Us Lubricants Market
市场规模(十亿美元)
CAGR :
% 
 USD
22.86 Billion
USD
28.91 Billion
2024
2032
USD
22.86 Billion
USD
28.91 Billion
2024
2032
| 2025 –2032 | |
| USD 22.86 Billion | |
| USD 28.91 Billion | |
|
|
|
|
美國潤滑油市場細分,按產品(發動機油、液壓油、循環液、齒輪油、油脂、金屬加工液、風力渦輪機油、壓縮機油、燃氣輪機油、傳熱油、防銹油等)、基礎油(礦物油、合成油、半合成油和生物基油)、等級(工業級和食品級)、市場銷售格式(散裝、小型分銷商、銷售商等用散裝業務用戶)、最終用途(汽車和運輸、船舶、能源和發電、冶金和金屬加工、化學製造、建築機械、重型設備、採礦、工業機械、航空航天、航空和國防、鐵路、農業、電氣/公用事業、製造設備、石油和天然氣、食品和飲料、水泥、塑料和橡膠加工、紡織、紙漿和造紙、消費者/DIY、其他)-2033年
潤滑油市場規模
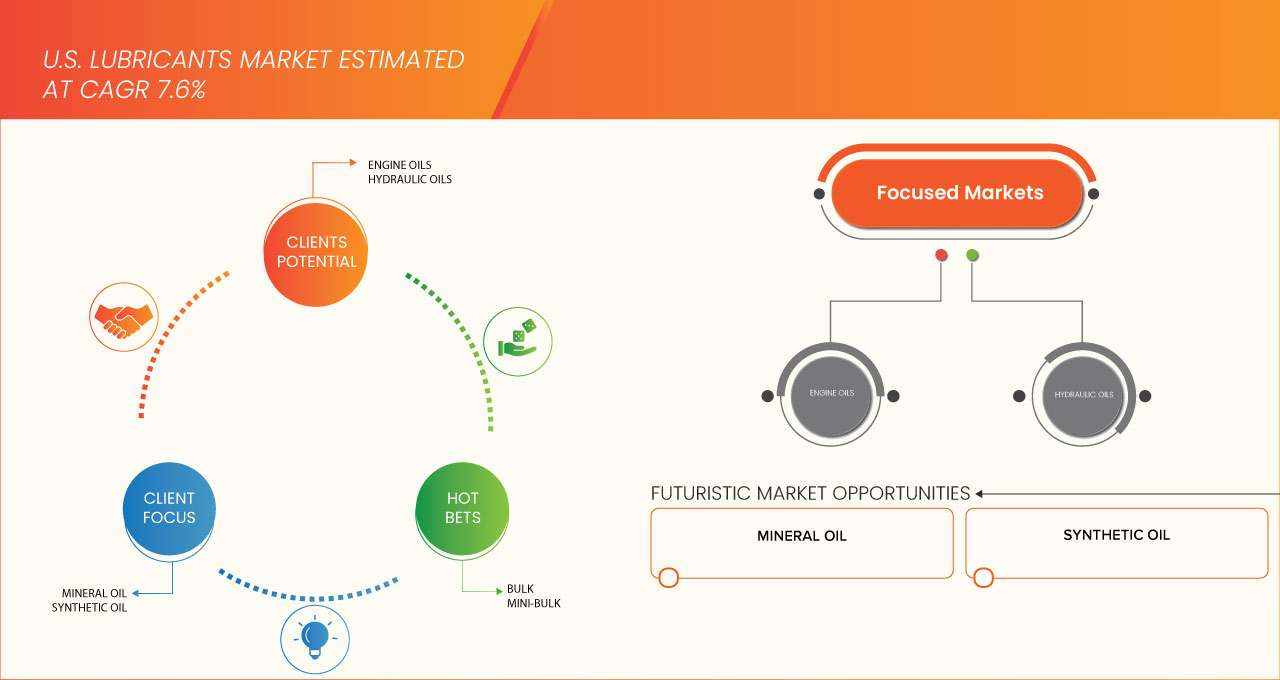
- 2024 年美國潤滑油市場規模為228.6 億美元 ,預計 到 2032 年將達到 289.1 億美元,預測期內 複合年增長率為 3.01%。
- 美國道路上車輛數量的不斷增長——包括內燃機 (ICE) 汽車和商用卡車——繼續推動對引擎油、變速箱油和維護服務的潤滑油需求。
- 隨著電動車和混合動力車使用量的增加,專用潤滑油(例如用於變速箱和傳動系統的潤滑油)的需求也越來越高,從而推動了創新和細分市場的成長。
潤滑油市場分析
- 增強的熱穩定性、減少的摩擦、更長的換油間隔以及極端條件下的性能推動了向合成油的轉變,特別是在汽車和工業領域。
- 工業自動化、物聯網和預測性維護增加了重型機械中潤滑油的使用量。狀態監測和智慧潤滑系統正日益受到關注。
- 潤滑劑對於風能、太陽能和水力發電廠至關重要,可以減少摩擦和停機時間,並支持綠色能源轉型。
- 機油領域在潤滑油市場佔據主導地位,2024 年的市場份額為 31.83%,這得益於具有更好的熱穩定性、抗氧化性和更長的換油間隔的增強配方,它們越來越多地取代汽車和工業環境中的傳統礦物油。
報告範圍和潤滑油市場細分
|
屬性 |
潤滑油市場洞察 |
|
涵蓋的領域 |
|
|
覆蓋國家 |
|
|
主要市場參與者 |
|
|
市場機會 |
|
|
加值資料資訊集 |
除了對市場價值、成長率、細分、地理覆蓋範圍和主要參與者等市場情景的洞察之外,Data Bridge Market Research 策劃的市場報告還包括深入的專家分析、定價分析、品牌份額分析、消費者調查、人口統計分析、供應鏈分析、價值鏈分析、原材料/消耗品概述、供應商選擇標準、PESTLE 分析、波特分析和監管框架。 |
潤滑油市場趨勢
“對高性能和可持續潤滑油的需求不斷增長”
- 在更嚴格的環境法規和提高設備效率的需求的推動下,美國潤滑油市場正在轉向高性能合成和生物基潤滑油。
- 工業化程度的提高以及汽車銷量(尤其是電動和混合動力汽車)的不斷增長,推動了對具有更長換油間隔和卓越熱穩定性的先進潤滑油的需求。
- 消費者和產業越來越重視永續性,促使潤滑油製造商投資環保配方和可生物降解的選擇,以減少對環境的影響。
潤滑油市場動態
司機
“技術進步和對燃油效率的需求”
- 美國潤滑油市場的主要成長動力是對能夠增強引擎性能、減少摩擦並有助於提高汽車和工業應用燃油效率的潤滑油的需求。
- 基礎油技術、添加劑化學和合成配方的進步正在推動在極端溫度和壓力下表現良好的潤滑劑的開發。
- 更嚴格的燃油經濟性標準和排放法規促使原始設備製造商和車隊營運商選擇優質潤滑油,以延長設備壽命並提高引擎清潔度。
- 終端用戶維護意識的提高也推動了特種潤滑劑的採用,特別是在航空航太、能源和製造等領域。
克制/挑戰
“原物料價格波動與環境問題”
- 原油價格波動直接影響石油基潤滑油的成本,造成價格不穩定,並給製造商和分銷商帶來利潤壓力。
- 有關廢舊潤滑劑處理和回收的環境問題帶來了監管和物流挑戰,特別是對於工業用戶和廢物管理公司而言。
- 儘管人們對生物潤滑劑的興趣日益濃厚,但與傳統潤滑劑相比,生物潤滑劑在某些應用中成本較高且性能較低,可能會阻礙其廣泛採用。
- 在某些細分市場中,消費者對合成和環保潤滑劑的好處缺乏認識,可能會減緩從傳統礦物基產品的轉變。
潤滑油市場範圍
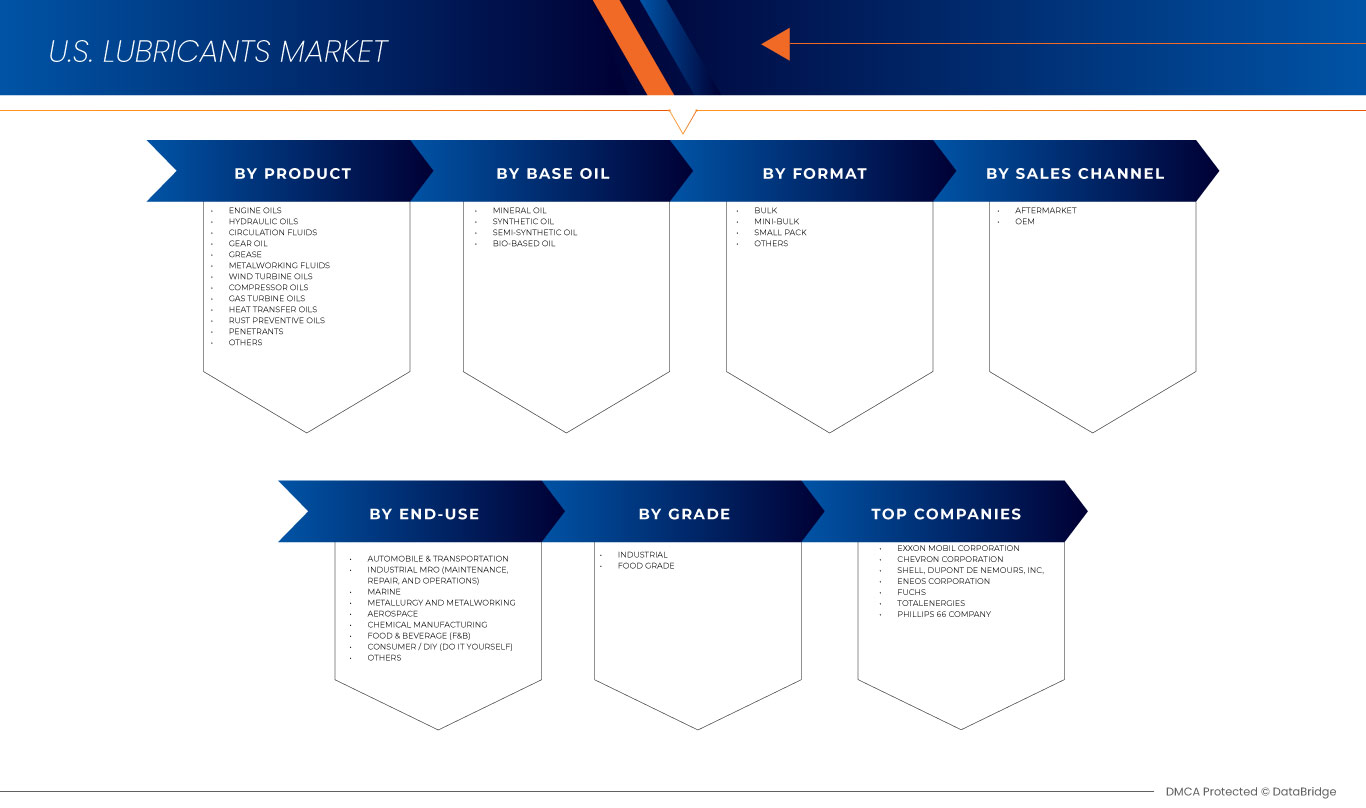
市場根據產品、基礎油、等級、形式、銷售通路、最終用途進行細分。
- 按產品
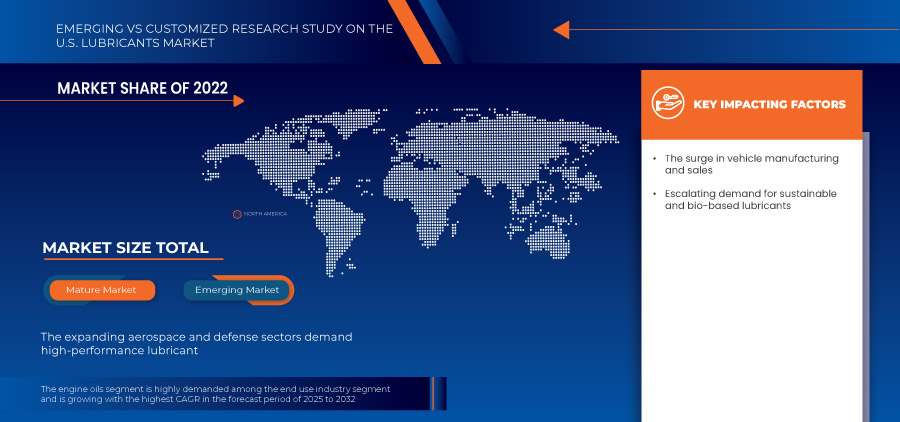
依產品類型,潤滑油市場細分為引擎油、液壓油、循環液、齒輪油、潤滑脂、金屬加工液、風力渦輪機油、壓縮機油、燃氣渦輪機油、傳熱油、防銹油等。 2024年,機油細分市場佔據最大的市場份額,達到31.83%。這得益於美國道路上車輛數量的不斷增長(包括內燃機 (ICE) 汽車和商用卡車),這持續推動了機油、變速箱油和維護服務對潤滑油的需求。
預計從 2025 年到 2032 年,機油領域將實現 3.59% 的最快增長率,這得益於具有更好的熱穩定性、抗氧化性和更長的換油間隔的增強配方正在越來越多地取代汽車和工業環境中的傳統礦物油。
- 按基礎油分類
根據基礎油,潤滑油市場細分為礦物油、合成油、半合成油、生物基油及其他。受監管和環境壓力的推動,礦物油領域在2024年佔據了最大的市場收入份額。
受向合成油和高性能油轉變的推動,礦物油領域預計將在 2025 年至 2032 年間見證最快的複合年增長率。
- 按年級
依等級,潤滑油市場分為工業級和食品級。受美國環保署(EPA)關於排放和生物降解性的嚴格法規以及可持續發展舉措的推動,工業級潤滑油在2024年佔據了最大的市場收入份額,這些舉措正在推動市場向環保配方(包括生物基潤滑油)發展。
- 按格式
根據加工形式,潤滑油市場細分為散裝、小散裝、小包裝和其他類型。 2024年,散裝潤滑油佔據了最大的市場收入份額,這得益於美國製造業(涵蓋重型機械、採礦、建築和發電)的復甦,這為確保運行可靠性創造了對工業潤滑油的持續需求。
- 按銷售管道
根據銷售管道,潤滑油市場細分為售後市場和原始設備製造商 (OEM)。售後市場在 2024 年佔據了最大的市場收入份額,這得益於風能、水力和太陽能發電設施需要用於渦輪機、發電機和輔助設備的專用潤滑油,從而支持市場擴張。
- 按最終用途
根據最終用途,潤滑油市場細分為汽車與運輸、工業維護、維修和營運 (MRO)、船舶、冶金和金屬加工、航空航太、化工製造、食品飲料 (F&B)、消費品/DIY (DIY)、其他。食品級潤滑油在2024年佔據了最大的市場收入份額,這得益於能夠減少腐蝕、磨損和摩擦,同時增強耐熱性的添加劑,這些添加劑使得汽車、航空航天和工業領域能夠提供更可靠、更專用的潤滑油。
潤滑油市場份額
潤滑油市場主要由知名公司主導,包括:
- 埃克森美孚公司
- 雪佛龍公司
- 殼
- 杜邦公司
- 盧克石油公司
- 總能量
- ENEOS 公司
- 菲利普斯 66 公司
- 摩特
- 福斯
- 勝牌
- 巴斯夫
- 嘉實多有限公司
- WD-40
- 藍天潤滑油
- 紅線合成油
- Mystik潤滑劑
- 卡爾貝赫姆有限公司
- 卡盧梅特公司
美國潤滑油動力市場最新動態
- 2024年,埃克森美孚推出了專為電動車(EV)設計的全新先進潤滑油系列-Mobil EV™。該系列產品包括專為電動車引擎和傳動系統的獨特需求而客製化的熱管理液和潤滑脂,以滿足電動車領域日益增長的需求。
- 2024年2月,雪佛龍宣布擴大其Havoline® Pro-RS™系列產品線,該系列產品採用植物性基礎油製成,是可再生全合成機油。此舉支持雪佛龍的可持續發展策略,並吸引具有環保意識的消費者和車隊營運商。
- 2023年9月,與主機廠合作,共同開發針對混合動力和渦輪增壓引擎優化的下一代潤滑油。這些配方旨在滿足不斷變化的燃油經濟性標準,同時延長換油週期並提升引擎壽命。
- 2023年7月,荷蘭皇家殼牌公司完成了位於路易斯安那州的潤滑油調配工廠的升級改造,提升了產能並整合了自動化品質控制系統。此次升級支援區域分銷,並滿足了北美地區對高性能潤滑油日益增長的需求。
- 2022年1月,大型獨立潤滑油製造商福克斯潤滑油公司(Fuchs Lubricants Co.)在堪薩斯州設立了全新的先進研發中心,擴大其美國業務。該中心專注於開發用於工業、食品級和再生能源應用的專用潤滑油。
SKU-
Get online access to the report on the World's First Market Intelligence Cloud
- Interactive Data Analysis Dashboard
- Company Analysis Dashboard for high growth potential opportunities
- Research Analyst Access for customization & queries
- Competitor Analysis with Interactive dashboard
- Latest News, Updates & Trend analysis
- Harness the Power of Benchmark Analysis for Comprehensive Competitor Tracking
目录
1 INTRODUCTION
1.1 OBJECTIVES OF THE STUDY
1.2 MARKET DEFINITION
1.3 OVERVIEW OF THE U.S. LUBRICANTS MARKET
1.4 LIMITATIONS
1.5 MARKETS COVERED
2 MARKET SEGMENTATION
2.1 MARKETS COVERED
2.2 GEOGRAPHICAL SCOPE
2.3 YEARS CONSIDERED FOR THE STUDY
2.4 CURRENCY AND PRICING
2.5 DBMR TRIPOD DATA VALIDATION MODEL
2.6 MULTIVARIATE MODELLING
2.7 PRIMARY INTERVIEWS WITH KEY OPINION LEADERS
2.8 DBMR MARKET POSITION GRID
2.9 MARKET END-USE COVERAGE GRID
2.1 SECONDARY SOURCES
2.11 ASSUMPTIONS
3 EXECUTIVE SUMMARY
4 PREMIUM INSIGHTS
4.1 PORTER’S FIVE FORCES ANALYSIS
4.1.1 THREAT OF NEW ENTRANTS
4.1.2 BARGAINING POWER OF SUPPLIERS
4.1.3 BARGAINING POWER OF BUYERS
4.1.4 THREAT OF SUBSTITUTE PRODUCTS
4.1.5 INDUSTRY RIVALRY
4.2 BRAND OUTLOOK
4.3 PRODUCTION CONSUMPTION ANALYSIS
4.4 PRICING ANALYSIS
4.5 PATENT ANALYSIS
4.5.1 PATENT QUALITY AND STRENGTH
4.5.2 PATENT FAMILIES
4.5.3 LICENSING AND COLLABORATIONS
4.5.4 REGIONAL PATENT LANDSCAPE
4.5.5 IP STRATEGY AND MANAGEMENT
4.6 PRODUCTION & CONSUMPTION ANALYSIS
4.7 VENDOR SELECTION CRITERIA
4.7.1 QUALITY AND CONSISTENCY
4.7.2 TECHNICAL EXPERTISE
4.7.3 SUPPLY CHAIN RELIABILITY
4.7.4 COMPLIANCE AND SUSTAINABILITY
4.7.5 COST AND PRICING STRUCTURE
4.7.6 FINANCIAL STABILITY
4.7.7 FLEXIBILITY AND CUSTOMIZATION
4.7.8 RISK MANAGEMENT AND CONTINGENCY PLANS
4.8 CLIMATE CHANGE SCENARIO
4.8.1 ENVIRONMENTAL CONCERNS
4.8.1.1 CARBON EMISSIONS FROM PRODUCTION
4.8.1.2 NON-RENEWABLE RESOURCE DEPLETION
4.8.1.3 WATER AND AIR POLLUTION
4.8.2 INDUSTRY RESPONSE
4.8.2.1 DEVELOPMENT OF BIO-BASED AND SYNTHETIC LUBRICANTS
4.8.2.2 RECYCLING AND RE-REFINING INITIATIVES
4.8.2.3 ENERGY EFFICIENCY IMPROVEMENTS
4.8.3 GOVERNMENT’S ROLE
4.8.3.1 REGULATIONS AND ENVIRONMENTAL STANDARDS
4.8.3.2 INCENTIVES FOR SUSTAINABLE PRODUCTS
4.8.3.3 PROMOTING PUBLIC-PRIVATE PARTNERSHIPS
4.8.4 ANALYST RECOMMENDATIONS
4.8.4.1 INVEST IN SUSTAINABLE PRODUCT DEVELOPMENT
4.8.4.2 ENHANCE RECYCLING AND RE-REFINING CAPABILITIES
4.8.4.3 COLLABORATE WITH REGULATORS AND INDUSTRY PEERS
4.8.4.4 LEVERAGE GOVERNMENT INCENTIVES
4.9 CONSUMER BUYING BEHAVIOUR
4.1 INNOVATION TRACKER AND STRATEGIC ANALYSIS – U.S. LUBRICANTS MARKET
4.10.1 MAJOR DEALS AND STRATEGIC ALLIANCES ANALYSIS
4.10.1.1 JOINT VENTURES
4.10.1.2 MERGERS AND ACQUISITIONS
4.10.1.3 LICENSING AND PARTNERSHIP
4.10.1.4 TECHNOLOGY COLLABORATIONS
4.10.1.5 STRATEGIC DIVESTMENTS
4.10.2 NUMBER OF PRODUCTS IN DEVELOPMENT
4.10.3 STAGE OF DEVELOPMENT
4.10.4 TIMELINES AND MILESTONES
4.10.5 INNOVATION STRATEGIES AND METHODOLOGIES
4.10.6 RISK ASSESSMENT AND MITIGATION
4.10.7 FUTURE OUTLOOK
4.11 INDUSTRY ECOSYSTEM ANALYSIS: U.S. LUBRICANTS MARKET
4.12 OVERVIEW OF TECHNOLOGICAL INNOVATIONS IN THE U.S. LUBRICANT MARKET
4.13 RAW MATERIAL COVERAGE
4.14 SUPPLY CHAIN ANALYSIS
4.14.1 OVERVIEW OF THE U.S. LUBRICANTS MARKET SUPPLY CHAIN
4.14.1.1 SUPPLY CHAIN CHALLENGES:
4.14.2 LOGISTICS COST SCENARIO
4.14.2.1 TRANSPORTATION COSTS
4.14.2.2 WAREHOUSING AND STORAGE COSTS
4.14.2.3 HANDLING AND PACKAGING COSTS
4.14.3 IMPORTANCE OF LOGISTICS SERVICE PROVIDERS
4.14.3.1 TRANSPORTATION MANAGEMENT
4.14.3.2 WAREHOUSING AND DISTRIBUTION SERVICES
4.14.3.3 REGULATORY AND COMPLIANCE EXPERTISE
4.15 VALUE CHAIN ANALYSIS
5 TARIFFS & IMPACT ON THE MARKET
6 REGULATION COVERAGE
6.1 OVERVIEW
7 MARKET OVERVIEW
7.1 DRIVERS
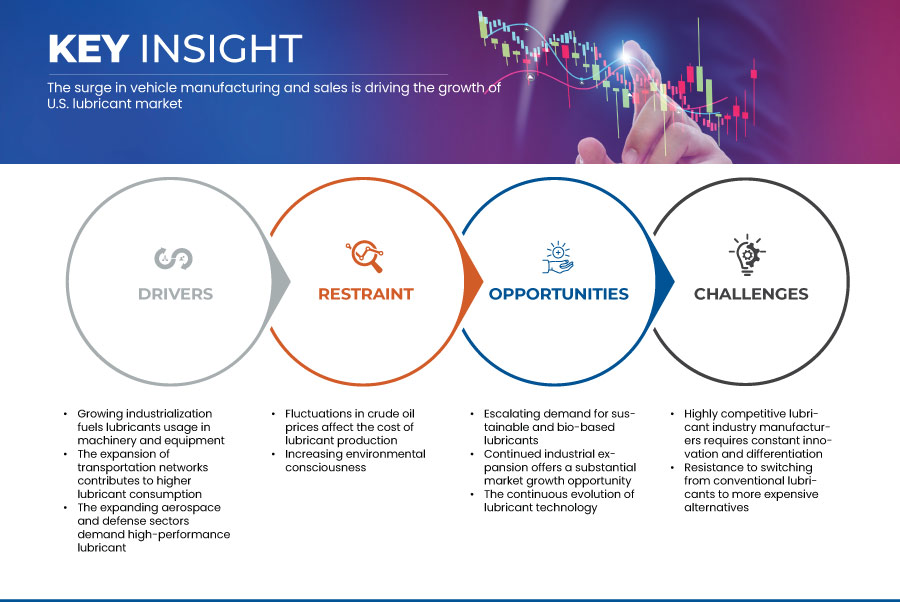
7.1.1 THE SURGE IN VEHICLE MANUFACTURING AND SALES
7.1.2 GROWING INDUSTRIALIZATION FUELS LUBRICANT USAGE IN MACHINERY AND EQUIPMENT
7.1.3 THE EXPANSION OF TRANSPORTATION NETWORKS CONTRIBUTES TO HIGHER LUBRICANT CONSUMPTION
7.1.4 THE EXPANDING AEROSPACE AND DEFENSE SECTORS DEMAND HIGH-PERFORMANCE LUBRICANT
7.2 RESTRAINTS
7.2.1 FLUCTUATIONS IN CRUDE OIL PRICES AFFECT THE COST OF LUBRICANT PRODUCTION
7.2.2 INCREASING ENVIRONMENTAL CONSCIOUSNESS
7.3 OPPORTUNITIES
7.3.1 ESCALATING DEMAND FOR SUSTAINABLE AND BIO-BASED LUBRICANTS
7.3.2 CONTINUED INDUSTRIAL EXPANSION OFFERS A SUBSTANTIAL MARKET GROWTH OPPORTUNITY
7.3.3 THE CONTINUOUS EVOLUTION OF LUBRICANT TECHNOLOGY
7.4 CHALLENGES
7.4.1 HIGHLY COMPETITIVE LUBRICANT INDUSTRY MANUFACTURERS REQUIRES CONSTANT INNOVATION AND DIFFERENTIATION
7.4.2 RESISTANCE TO SWITCHING FROM CONVENTIONAL LUBRICANTS TO MORE EXPENSIVE ALTERNATIVES
8 U.S. LUBRICANTS MARKET, BY PRODUCT
8.1 OVERVIEW
8.2 ENGINE OILS
8.2.1 MINERAL OIL
8.2.2 SYNTHETIC OIL
8.2.2.1 SYNTHETIC BLEND OIL
8.2.2.2 FULL SYNTHETIC OIL
8.2.3 SEMI-SYNTHETIC OIL
8.2.4 BIO-BASED OIL
8.2.5 OTHERS
8.2.5.1 INDUSTRIAL
8.2.5.2 FOOD GRADE
8.2.5.2.1 GASOLINE ENGINE OIL
8.2.5.2.2 DIESEL ENGINE OIL
8.3 HYDRAULIC OILS
8.3.1 MINERAL OIL
8.3.1.1 PARAFFINIC OILS
8.3.1.2 NAPHTHENIC OILS
8.3.1.3 AROMATIC OILS
8.3.2 SYNTHETIC OIL
8.3.2.1 SYNTHETIC BLEND OIL
8.3.2.2 FULL SYNTHETIC OIL
8.3.3 SEMI-SYNTHETIC OIL
8.3.4 BIO-BASED OIL
8.3.5 OTHERS
8.3.5.1 INDUSTRIAL
8.3.5.2 FOOD GRADE
8.4 CIRCULATION FLUIDS
8.4.1 MINERAL OIL
8.4.1.1 PARAFFINIC OILS
8.4.1.2 NAPHTHENIC OILS
8.4.1.3 AROMATIC OILS
8.4.2 SYNTHETIC OIL
8.4.2.1 SYNTHETIC BLEND OIL
8.4.2.2 FULL SYNTHETIC OIL
8.4.3 SEMI-SYNTHETIC OIL
8.4.4 BIO-BASED OIL
8.4.5 OTHERS
8.4.5.1 INDUSTRIAL
8.4.5.2 FOOD GRADE
8.5 GEAR OIL
8.5.1 MINERAL OIL
8.5.1.1 PARAFFINIC OILS
8.5.1.2 NAPHTHENIC OILS
8.5.1.3 AROMATIC OILS
8.5.2 SYNTHETIC OIL
8.5.2.1 SYNTHETIC BLEND OIL
8.5.2.2 FULL SYNTHETIC OIL
8.5.3 SEMI-SYNTHETIC OIL
8.5.4 BIO-BASED OIL
8.5.5 OTHERS
8.5.5.1 INDUSTRIAL
8.5.5.2 FOOD GRADE
8.6 GREASE
8.6.1 LITHIUM-BASED
8.6.2 CALCIUM-BASED
8.6.3 BENTONE-BASED
8.6.4 BARIUM COMPLEX
8.6.5 OTHERS
8.6.5.1 MINERAL OIL
8.6.5.1.1 PARAFFINIC OILS
8.6.5.1.2 NAPHTHENIC OILS
8.6.5.1.3 AROMATIC OILS
8.6.5.2 SYNTHETIC OIL
8.6.5.2.1 SYNTHETIC BLEND OIL
8.6.5.2.2 FULL SYNTHETIC OIL
8.6.5.3 SEMI-SYNTHETIC OIL
8.6.5.4 BIO-BASED OIL
8.6.5.5 OTHERS
8.6.5.5.1 INDUSTRIAL
8.6.5.5.2 FOOD GRADE
8.7 METALWORKING FLUIDS
8.7.1 MINERAL OIL
8.7.1.1 PARAFFINIC OILS
8.7.1.2 NAPHTHENIC OILS
8.7.1.3 AROMATIC OILS
8.7.2 SYNTHETIC OIL
8.7.2.1 SYNTHETIC BLEND OIL
8.7.2.2 FULL SYNTHETIC OIL
8.7.3 SEMI-SYNTHETIC OIL
8.7.4 BIO-BASED OIL
8.7.5 OTHERS
8.7.5.1 INDUSTRIAL
8.7.5.2 FOOD GRADE
8.8 WIND TURBINE OILS
8.8.1 MINERAL OIL
8.8.1.1 PARAFFINIC OILS
8.8.1.2 NAPHTHENIC OILS
8.8.1.3 AROMATIC OILS
8.8.2 SYNTHETIC OIL
8.8.2.1 SYNTHETIC BLEND OIL
8.8.2.2 FULL SYNTHETIC OIL
8.8.3 SEMI-SYNTHETIC OIL
8.8.4 BIO-BASED OIL
8.8.5 OTHERS
8.8.5.1 INDUSTRIAL
8.8.5.2 FOOD GRADE
8.9 COMPRESSOR OILS
8.9.1 MINERAL OIL
8.9.1.1 PARAFFINIC OILS
8.9.1.2 NAPHTHENIC OILS
8.9.1.3 AROMATIC OILS
8.9.2 SYNTHETIC OIL
8.9.2.1 SYNTHETIC BLEND OIL
8.9.2.2 FULL SYNTHETIC OIL
8.9.3 SEMI-SYNTHETIC OIL
8.9.4 BIO-BASED OIL
8.9.5 OTHERS
8.9.5.1 INDUSTRIAL
8.9.5.2 FOOD GRADE
8.1 GAS TURBINE OILS
8.10.1 MINERAL OIL
8.10.1.1 PARAFFINIC OILS
8.10.1.2 NAPHTHENIC OILS
8.10.1.3 AROMATIC OILS
8.10.2 SYNTHETIC OIL
8.10.2.1 SYNTHETIC BLEND OIL
8.10.2.2 FULL SYNTHETIC OIL
8.10.3 SEMI-SYNTHETIC OIL
8.10.4 BIO-BASED OIL
8.10.5 OTHERS
8.10.5.1 INDUSTRIAL
8.10.5.2 FOOD GRADE
8.11 HEAT TRANSFER OILS
8.11.1 MINERAL OIL
8.11.1.1 PARAFFINIC OILS
8.11.1.2 NAPHTHENIC OILS
8.11.1.3 AROMATIC OILS
8.11.2 SYNTHETIC OIL
8.11.2.1 SYNTHETIC BLEND OIL
8.11.2.2 2 FULL SYNTHETIC OIL
8.11.3 SEMI-SYNTHETIC OIL
8.11.4 BIO-BASED OIL
8.11.5 OTHERS
8.11.5.1 INDUSTRIAL
8.11.5.2 FOOD GRADE
8.12 RUST PREVENTIVE OILS
8.12.1 MINERAL OIL
8.12.1.1 PARAFFINIC OILS
8.12.1.2 NAPHTHENIC OILS
8.12.1.3 AROMATIC OILS
8.12.2 SYNTHETIC OIL
8.12.2.1 SYNTHETIC BLEND OIL
8.12.2.2 FULL SYNTHETIC OIL
8.12.3 SEMI-SYNTHETIC OIL
8.12.4 BIO-BASED OIL
8.12.5 OTHERS
8.12.5.1 INDUSTRIAL
8.12.5.2 FOOD GRADE
8.13 PENETRANTS
8.13.1 MINERAL OIL
8.13.1.1 PARAFFINIC OILS
8.13.1.2 NAPHTHENIC OILS
8.13.1.3 AROMATIC OILS
8.13.2 SYNTHETIC OIL
8.13.2.1 SYNTHETIC BLEND OIL
8.13.2.2 FULL SYNTHETIC OIL
8.13.3 SEMI-SYNTHETIC OIL
8.13.4 BIO-BASED OIL
8.13.5 OTHERS
8.13.5.1 INDUSTRIAL
8.13.5.2 FOOD GRADE
8.14 OTHERS
8.14.1 MINERAL OIL
8.14.1.1 PARAFFINIC OILS
8.14.1.2 NAPHTHENIC OILS
8.14.1.3 AROMATIC OILS
8.14.2 SYNTHETIC OIL
8.14.2.1 SYNTHETIC BLEND OIL
8.14.2.2 FULL SYNTHETIC OIL
8.14.3 SEMI-SYNTHETIC OIL
8.14.4 BIO-BASED OIL
8.14.5 OTHERS
8.14.5.1 INDUSTRIAL
8.14.5.2 FOOD GRADE
9 U.S. LUBRICANTS MARKET, BY BASE OIL
9.1 OVERVIEW
9.2 MINERAL OIL
9.2.1 PARAFFINIC OILS
9.2.2 NAPHTHENIC OILS
9.2.3 AROMATIC OILS
9.3 SYNTHETIC OIL
9.3.1 SYNTHETIC BLEND OIL
9.3.2 FULL SYNTHETIC OIL
9.4 SEMI-SYNTHETIC OIL
9.5 BIO-BASED OIL
9.6 OTHERS
10 U.S. LUBRICANTS MARKET, BY GRADE
10.1 OVERVIEW
10.2 INDUSTRIAL
10.3 FOOD GRADE
11 U.S. LUBRICANTS MARKET, BY FORMAT
11.1 OVERVIEW
11.2 BULK
11.3 MINI-BULK
11.4 SMALL PACK
11.5 OTHERS
12 U.S. LUBRICANTS MARKET, BY SALES CHANNEL
12.1 OVERVIEW
12.2 AFTERMARKET
12.2.1 VEHICLE SERVICE CENTERS
12.2.2 AUTOMOBILE SPARE PART SHOPS
12.2.3 LUBRICANTS STORES
12.2.3.1 MULTI-BRANDED
12.2.3.2 SINGLE-BRANDED
12.2.3.3 COMPANY-OWNED
12.2.4 HARDWARE AND DIY STORES
12.2.5 GAS STATIONS
12.2.6 ONLINE
12.2.6.1 THIRD PARTY WEBSITES
12.2.6.2 COMPANY-OWNED
12.2.6.2.1 ENGINE OILS
12.2.6.2.2 HYDRAULIC OILS
12.2.6.2.3 CIRCULATION FLUIDS
12.2.6.2.4 GREASE
12.2.6.2.5 GEAR OIL
12.2.6.2.6 COMPRESSOR OILS
12.2.6.2.7 GAS TURBINE OILS
12.2.6.2.8 WIND TURBINE OILS
12.2.6.2.9 HEAT TRANSFER OILS
12.2.6.2.10 RUST PREVENTIVE OILS
12.2.6.2.11 METALWORKING FLUIDS
12.2.6.2.12 PENETRANTS
12.2.6.2.13 OTHERS
12.3 OEM
12.3.1 ENGINE OILS
12.3.2 HYDRAULIC OILS
12.3.3 CIRCULATION FLUIDS
12.3.4 GREASE
12.3.5 GEAR OIL
12.3.6 COMPRESSOR OILS
12.3.7 GAS TURBINE OILS
12.3.8 WIND TURBINE OILS
12.3.9 HEAT TRANSFER OILS
12.3.10 RUST PREVENTIVE OILS
12.3.11 METALWORKING FLUIDS
12.3.12 PENETRANTS
12.3.13 OTHERS
13 U.S. LUBRICANTS MARKET, BY END USE
13.1 OVERVIEW
13.2 AUTOMOBILE & TRANSPORTATION
13.2.1 COMMERCIAL VEHICLES
13.2.1.1 TRUCKS
13.2.1.1.1 HEAVY WEIGHT TRUCKS
13.2.1.1.2 LIGHT WEIGHT TRUCKS
13.2.1.2 BUSES
13.2.1.3 OTHERS
13.2.2 PASSENGER VEHICLES
13.2.2.1 CARS
13.2.2.2 MOTORCYCLES
13.2.2.3 THREE WHEELERS
13.2.2.4 OTHERS
13.3 INDUSTRIAL MRO (MAINTENANCE, REPAIR, AND OPERATIONS)
13.3.1 MANUFACTURING EQUIPMENT
13.3.2 ENERGY AND POWER GENERATION
13.3.3 CONSTRUCTION MACHINERY AND HEAVY EQUIPMENT
13.3.4 INDUSTRIAL MACHINERY
13.3.5 AEROSPACE AND DEFENSE
13.3.6 OTHERS
13.4 MARINE
13.5 METALLURGY AND METALWORKING
13.6 AEROSPACE
13.7 CHEMICAL MANUFACTURING
13.8 FOOD & BEVERAGE (F&B)
13.9 CONSUMER / DIY (DO IT YOURSELF)
13.9.1 PERSONAL VEHICLE MAINTENANCE
13.9.2 HOUSEHOLD/DIY
13.9.3 OTHERS
13.1 OTHERS
13.10.1 TEXTILE
13.10.2 PLASTIC AND RUBBER PROCESSING
13.10.3 PULP & PAPER
13.10.4 OTHERS
14 U.S. LUBRICANTS MARKET: COMPANY LANDSCAPE
14.1 COMPANY SHARE ANALYSIS: U.S.
14.2 COMPANY SHARE ANALYSIS: U.S.
15 SWOT ANALYSIS
16 COMPANY PROFILES
16.1 EXXON MOBIL CORPORATION
16.1.1 COMPANY SNAPSHOT
16.1.2 REVENUE ANALYSIS
16.1.3 PRODUCT PORTFOLIO
16.1.4 RECENT DEVELOPMENTS
16.2 CHEVRON CORPORATION
16.2.1 COMPANY SNAPSHOT
16.2.2 REVENUE ANALYSIS
16.2.3 PRODUCT PORTFOLIO
16.2.4 RECENT DEVELOPMENT
16.3 SHELL PLC
16.3.1 COMPANY SNAPSHOT
16.3.2 RECENT FINANCIALS
16.3.3 PRODUCT PORTFOLIO
16.3.4 RECENT UPDATES
16.4 DUPONT
16.4.1 COMPANY SNAPSHOT
16.4.2 REVENUE ANALYSIS
16.4.3 PRODUCT PORTFOLIO
16.4.4 RECENT DEVELOPMENT
16.5 LUKOIL
16.5.1 COMPANY SNAPSHOT
16.5.2 BRAND PORTFOLIO
16.5.3 RECENT DEVELOPMENTS /NEWS
16.6 BASF
16.6.1 COMPANY SNAPSHOT
16.6.2 REVENUE ANALYSIS
16.6.3 PRODUCT PORTFOLIO
16.6.4 RECENT DEVELOPMENTS/NEWS
16.7 BLUESKY LUBRICANTS
16.7.1 COMPANY SNAPSHOT
16.7.2 PRODUCT PORTFOLIO
16.7.3 RECENT UPDATES
16.8 CARL BECHEM GMBH
16.8.1 COMPANY SNAPSHOT
16.8.2 PRODUCT PORTFOLIO
16.8.3 RECENT DEVELOPMENT
16.9 CASTROL LIMITED
16.9.1 COMPANY SNAPSHOT
16.9.2 PRODUCT PORTFOLIO
16.9.3 RECENT DEVELOPMENT
16.1 ENEOS CORPORATION
16.10.1 COMPANY SNAPSHOT
16.10.2 REVENUE ANALYSIS
16.10.3 PRODUCT PORTFOLIO
16.10.4 RECENT DEVELOPMENT
16.11 ESSEX BROWNELL
16.11.1 COMPANY SNAPSHOT
16.11.2 PRODUCT PORTFOLIO
16.11.3 RECENT DEVELOPMENT
16.12 FUCHS
16.12.1 COMPANY SNAPSHOT
16.12.2 REVENUE ANALYSIS
16.12.3 PRODUCT PORTFOLIO
16.12.4 RECENT DEVELOPMENT/NEWS
16.13 MOTION INDUSTRIES , INC
16.13.1 COMPANY SNAPSHOT
16.13.2 PRODUCT PORTFOLIO
16.13.3 RECENT DEVELOPMENT
16.14 MOTUL
16.14.1 COMPANY SNAPSHOT
16.14.2 PRODUCT PORTFOLIO
16.14.3 RECENT DEVELOPMENT
16.15 MYSTIK LUBRICANTS
16.15.1 COMPANY SNAPSHOT
16.15.2 PRODUCT PORTFOLIO
16.15.3 RECENT DEVELOPMENT
16.16 PHILLIPS 66 COMPANY
16.16.1 COMPANY SNAPSHOT
16.16.2 REVENUE ANALYSIS
16.16.3 PRODUCT PORTFOLIO
16.16.4 RECENT DEVELOPMENT/NEWS
16.17 RED LINE SYNTHETIC OIL CORPORATION
16.17.1 COMPANY SNAPSHOT
16.17.2 PRODUCT PORTFOLIO
16.17.3 RECENT DEVELOPMENT
16.18 RELADYNE LLC.
16.18.1 COMPANY SNAPSHOT
16.18.2 PRODUCT PORTFOLIO
16.18.3 RECENT DEVELOPMENT
16.19 ROYAL PURPLE
16.19.1 COMPANY SNAPSHOT
16.19.2 PRODUCT PORTFOLIO
16.19.3 RECENT UPDATES
16.2 SUN COAST RESOURCES, LLC
16.20.1 COMPANY SNAPSHOT
16.20.2 PRODUCT PORTFOLIO
16.20.3 RECENT DEVELOPMENT
16.21 TOTALENERGIES
16.21.1 COMPANY SNAPSHOT
16.21.2 REVENUE ANALYSIS
16.21.3 PRODUCT PORTFOLIO
16.21.4 RECENT DEVELOPMENT
16.22 VALVOLINE
16.22.1 COMPANY SNAPSHOT
16.22.2 REVENUE ANALYSIS
16.22.3 PRODUCT PORTFOLIO
16.22.4 RECENT DEVELOPMENT
16.23 WD-40
16.23.1 COMPANY SNAPSHOT
16.23.2 REVENUE ANALYSIS
16.23.3 PRODUCT PORTFOLIO
16.23.4 RECENT DEVELOPMENT
17 QUESTIONNAIRE
18 RELATED REPORTS
表格列表
TABLE 1 CONSUMER GROUPS BREAKDOWN
TABLE 2 PREFERENCE CRITERIA ACROSS CONSUMER GROUPS
TABLE 3 REGULATION COVERAGE
TABLE 4 U.S. LUBRICANTS MARKET, BY PRODUCT, 2018-2032 (USD THOUSAND)
TABLE 5 U.S. LUBRICANTS MARKET, BY PRODUCT, 2018-2032 (KILO TONS)
TABLE 6 U.S. LUBRICANTS MARKET, BY PRODUCT, 2018-2032 (USD/KG)
TABLE 7 U.S. ENGINE OILS IN LUBRICANTS MARKET, BY BASE OIL, 2018-2032 (USD THOUSAND)
TABLE 8 U.S. MINERAL OIL IN LUBRICANTS MARKET, BY TYPE, 2018-2032 (USD THOUSAND)
TABLE 9 U.S. SYNTHETIC OIL IN LUBRICANTS MARKET, BY TYPE, 2018-2032 (USD THOUSAND)
TABLE 10 U.S. ENGINE OILS IN LUBRICANTS MARKET, BY GRADE 2018-2032 (USD THOUSAND)
TABLE 11 U.S. ENGINE OILS IN LUBRICANTS MARKET, BY CATEGORY 2018-2032 (USD THOUSAND)
TABLE 12 U.S. HYDRAULIC OILS IN LUBRICANTS MARKET, BY BASE OIL, 2018-2032 (USD THOUSAND)
TABLE 13 U.S. MINERAL OIL IN LUBRICANTS MARKET, BY TYPE, 2018-2032 (USD THOUSAND)
TABLE 14 U.S. SYNTHETIC OIL IN LUBRICANTS MARKET, BY TYPE, 2018-2032 (USD THOUSAND)
TABLE 15 U.S. HYDRAULIC OILS IN LUBRICANTS MARKET, BY GRADE 2018-2032 (USD THOUSAND)
TABLE 16 U.S. CIRCULATION FLUIDS IN LUBRICANTS MARKET, BY BASE OIL, 2018-2032 (USD THOUSAND)
TABLE 17 U.S. MINERAL OIL IN LUBRICANTS MARKET, BY TYPE, 2018-2032 (USD THOUSAND)
TABLE 18 U.S. SYNTHETIC OIL IN LUBRICANTS MARKET, BY TYPE, 2018-2032 (USD THOUSAND)
TABLE 19 U.S. CIRCULATION FLUIDS IN LUBRICANTS MARKET, BY GRADE 2018-2032 (USD THOUSAND)
TABLE 20 U.S. GEAR OIL IN LUBRICANTS MARKET, BY BASE OIL, 2018-2032 (USD THOUSAND)
TABLE 21 U.S. MINERAL OIL IN LUBRICANTS MARKET, BY TYPE, 2018-2032 (USD THOUSAND)
TABLE 22 U.S. SYNTHETIC OIL IN LUBRICANTS MARKET, BY TYPE, 2018-2032 (USD THOUSAND)
TABLE 23 U.S. GEAR OILS IN LUBRICANTS MARKET, BY GRADE 2018-2032 (USD THOUSAND)
TABLE 24 U.S. GREASE IN LUBRICANTS MARKET, BY TYPE, 2018-2032 (USD THOUSAND)
TABLE 25 U.S. GREASE IN LUBRICANTS MARKET, BY BASE OIL, 2018-2032 (USD THOUSAND)
TABLE 26 U.S. MINERAL OIL IN LUBRICANTS MARKET, BY TYPE, 2018-2032 (USD THOUSAND)
TABLE 27 U.S. SYNTHETIC OIL IN LUBRICANTS MARKET, BY TYPE, 2018-2032 (USD THOUSAND)
TABLE 28 U.S. GREASE IN LUBRICANTS MARKET, BY GRADE 2018-2032 (USD THOUSAND)
TABLE 29 U.S. METALWORKING FLUIDS IN LUBRICANTS MARKET, BY BASE OIL, 2018-2032 (USD THOUSAND)
TABLE 30 U.S. MINERAL OIL IN LUBRICANTS MARKET, BY TYPE, 2018-2032 (USD THOUSAND)
TABLE 31 U.S. SYNTHETIC OIL IN LUBRICANTS MARKET, BY TYPE, 2018-2032 (USD THOUSAND)
TABLE 32 U.S. METALWORKING FLUIDS IN LUBRICANTS MARKET, BY GRADE 2018-2032 (USD THOUSAND)
TABLE 33 U.S. WIND TURBINE OILS IN LUBRICANTS MARKET, BY BASE OIL, 2018-2032 (USD THOUSAND)
TABLE 34 U.S. MINERAL OIL IN LUBRICANTS MARKET, BY TYPE, 2018-2032 (USD THOUSAND)
TABLE 35 U.S. SYNTHETIC OIL IN LUBRICANTS MARKET, BY TYPE, 2018-2032 (USD THOUSAND)
TABLE 36 U.S. WIND TURBINE OILS IN LUBRICANTS MARKET, BY GRADE 2018-2032 (USD THOUSAND)
TABLE 37 U.S. COMPRESSOR OILS IN LUBRICANTS MARKET, BY BASE OIL, 2018-2032 (USD THOUSAND)
TABLE 38 U.S. MINERAL OIL IN LUBRICANTS MARKET, BY TYPE, 2018-2032 (USD THOUSAND)
TABLE 39 U.S. SYNTHETIC OIL IN LUBRICANTS MARKET, BY TYPE, 2018-2032 (USD THOUSAND)
TABLE 40 U.S. COMPRESSOR OILS IN LUBRICANTS MARKET, BY GRADE 2018-2032 (USD THOUSAND)
TABLE 41 U.S. GAS TURBINE OILS IN LUBRICANTS MARKET, BY BASE OIL, 2018-2032 (USD THOUSAND)
TABLE 42 U.S. MINERAL OIL IN LUBRICANTS MARKET, BY TYPE, 2018-2032 (USD THOUSAND)
TABLE 43 U.S. SYNTHETIC OIL IN LUBRICANTS MARKET, BY TYPE, 2018-2032 (USD THOUSAND)
TABLE 44 U.S. GAS TURBINE OILS IN LUBRICANTS MARKET, BY GRADE 2018-2032 (USD THOUSAND)
TABLE 45 U.S. HEAT TRANSFER OILS IN LUBRICANTS MARKET, BY BASE OIL, 2018-2032 (USD THOUSAND)
TABLE 46 U.S. MINERAL OIL IN LUBRICANTS MARKET, BY TYPE, 2018-2032 (USD THOUSAND)
TABLE 47 U.S. SYNTHETIC OIL IN LUBRICANTS MARKET, BY TYPE, 2018-2032 (USD THOUSAND)
TABLE 48 U.S. HEAT TRANSFER OILS IN LUBRICANTS MARKET, BY GRADE 2018-2032 (USD THOUSAND)
TABLE 49 U.S. RUST PREVENTIVE OILS IN LUBRICANTS MARKET, BY BASE OIL, 2018-2032 (USD THOUSAND)
TABLE 50 U.S. MINERAL OIL IN LUBRICANTS MARKET, BY TYPE, 2018-2032 (USD THOUSAND)
TABLE 51 U.S. SYNTHETIC OIL IN LUBRICANTS MARKET, BY TYPE, 2018-2032 (USD THOUSAND)
TABLE 52 U.S. RUST PREVENTIVE OILS IN LUBRICANTS MARKET, BY GRADE 2018-2032 (USD THOUSAND)
TABLE 53 U.S. PENETRANTS IN LUBRICANTS MARKET, BY BASE OIL, 2018-2032 (USD THOUSAND)
TABLE 54 U.S. MINERAL OIL IN LUBRICANTS MARKET, BY TYPE, 2018-2032 (USD THOUSAND)
TABLE 55 U.S. SYNTHETIC OIL IN LUBRICANTS MARKET, BY TYPE, 2018-2032 (USD THOUSAND)
TABLE 56 U.S. PENETRANTS IN LUBRICANTS MARKET, BY GRADE 2018-2032 (USD THOUSAND)
TABLE 57 U.S. OTHERS IN LUBRICANTS MARKET, BY BASE OIL, 2018-2032 (USD THOUSAND)
TABLE 58 U.S. MINERAL OIL IN LUBRICANTS MARKET, BY TYPE, 2018-2032 (USD THOUSAND)
TABLE 59 U.S. SYNTHETIC OIL IN LUBRICANTS MARKET, BY TYPE, 2018-2032 (USD THOUSAND)
TABLE 60 U.S. OTHERS IN LUBRICANTS MARKET, BY GRADE 2018-2032 (USD THOUSAND)
TABLE 61 U.S. LUBRICANTS MARKET, BY BASE OIL, 2018-2032 (USD THOUSAND)
TABLE 62 U.S. MINERAL OIL IN LUBRICANTS MARKET, BY TYPE, 2018-2032 (USD THOUSAND)
TABLE 63 U.S. MINERAL OIL IN LUBRICANTS MARKET, BY TYPE, 2018-2032 (USD THOUSAND)
TABLE 64 U.S. LUBRICANTS MARKET, BY GRADE, 2018-2032 (USD THOUSAND)
TABLE 65 U.S. LUBRICANTS MARKET, BY FORMAT, 2018-2032 (USD THOUSAND)
TABLE 66 U.S. LUBRICANTS MARKET, BY SALES CHANNEL, 2018-2032 (USD THOUSAND)
TABLE 67 U.S. AFTERMARKET IN LUBRICANTS MARKET, BY CATEGORY, 2018-2032 (USD THOUSAND)
TABLE 68 U.S. LUBRICANTS STORES IN LUBRICANTS MARKET, BY TYPE, 2018-2032 (USD THOUSAND)
TABLE 69 U.S. ONLINE IN LUBRICANTS MARKET, BY TYPE, 2018-2032 (USD THOUSAND)
TABLE 70 U.S. AFTERMARKET IN LUBRICANTS MARKET, BY PRODUCT, 2018-2032 (USD THOUSAND)
TABLE 71 U.S. OEM IN LUBRICANTS MARKET, BY PRODUCT, 2018-2032 (USD THOUSAND)
TABLE 72 U.S. LUBRICANTS MARKET, BY END-USE, 2018-2032 (USD THOUSAND)
TABLE 73 U.S. AUTOMOBILE & TRANSPORTATION IN LUBRICANTS MARKET, BY VEHICLE TYPE, 2018-2032 (USD THOUSAND)
TABLE 74 U.S. COMMERCIAL VEHICLES IN LUBRICANTS MARKET, BY TYPE, 2018-2032 (USD THOUSAND)
TABLE 75 U.S. TRUCKS IN LUBRICANTS MARKET, BY TYPE, 2018-2032 (USD THOUSAND)
TABLE 76 U.S. PASSENGER VEHICLES IN LUBRICANTS MARKET, BY TYPE, 2018-2032 (USD THOUSAND)
TABLE 77 U.S. INDUSTRIAL MRO (MAINTENANCE, REPAIR, AND OPERATIONS) IN LUBRICANTS MARKET, BY TYPE, 2018-2032 (USD THOUSAND)
TABLE 78 U.S. CONSUMER / DIY (DO IT YOURSELF) IN LUBRICANTS MARKET, BY TYPE, 2018-2032 (USD THOUSAND)
TABLE 79 U.S. OTHERS IN LUBRICANTS MARKET, BY TYPE, 2018-2032 (USD THOUSAND)
图片列表
FIGURE 1 U.S. LUBRICANTS MARKET: SEGMENTATION
FIGURE 2 U.S. LUBRICANTS MARKET: DATA TRIANGULATION
FIGURE 3 U.S. LUBRICANTS MARKET: DROC ANALYSIS
FIGURE 4 U.S. LUBRICANTS MARKET: COUNTRY-WISE MARKET ANALYSIS
FIGURE 5 U.S. LUBRICANTS MARKET: COMPANY RESEARCH ANALYSIS
FIGURE 6 U.S. LUBRICANTS MARKET: INTERVIEW DEMOGRAPHICS
FIGURE 7 U.S. LUBRICANTS MARKET: DBMR MARKET POSITION GRID
FIGURE 8 U.S. LUBRICANTS MARKET: MARKET END-USE COVERAGE GRID
FIGURE 9 EXECUTIVE SUMMARY U.S. LUBRICANTS MARKET
FIGURE 10 STRATEGIC DECISIONS
FIGURE 11 THE ENGINE OILS SEGMENT IS EXPECTED TO ACCOUNT FOR THE LARGEST SHARE OF THE U.S. LUBRICANTS MARKET
FIGURE 12 U.S. LUBRICANTS MARKET: SEGMENTATION
FIGURE 13 THE SURGE IN VEHICLE MANUFACTURING AND SALES IS EXPECTED TO DRIVE THE GROWTH OF THE U.S. LUBRICANTS MARKET IN THE FORECAST PERIOD FROM 2025 TO 2032
FIGURE 14 THE ENGINE OILS SEGMENT IS EXPECTED TO ACCOUNT FOR THE LARGEST SHARE OF THE U.S. LUBRICANTS MARKET IN 2025 AND 2032
FIGURE 15 PORTER’S FIVE FORCES ANALYSIS
FIGURE 16 BRAND OUTLOOK
FIGURE 17 PRODUCTION CONSUMPTION ANALYSIS
FIGURE 18 U.S. LUBRICANTS MARKET, 2023-2032, AVERAGE SELLING PRICE (USD/KG)
FIGURE 19 NUMBER OF PATENTS BY THE APPLICANTS
FIGURE 20 PUBLICATIONS DATE
FIGURE 21 VENDOR SELECTION CRITERIA
FIGURE 22 DRIVERS, RESTRAINTS, OPPORTUNITIES, AND CHALLENGES OF THE U.S. LUBRICANTS MARKET
FIGURE 23 UNITED STATES MOTOR VEHICLE SALES: PASSENGER CARS FROM 2020 TO 2024
FIGURE 24 U.S. LUBRICANTS MARKET: BY PRODUCT, 2024
FIGURE 25 U.S. LUBRICANTS MARKET: BY BASE OIL, 2024
FIGURE 26 U.S. LUBRICANTS MARKET: BY GRADE, 2024
FIGURE 27 U.S. LUBRICANTS MARKET: BY FORMAT, 2024
FIGURE 28 U.S. LUBRICANTS MARKET: BY SALES CHANNEL, 2024
FIGURE 29 U.S. LUBRICANTS MARKET: BY END USE, 2024
FIGURE 30 U.S. : COMPANY SHARE 2024 (%) (MANUFACTURER)
FIGURE 31 U.S. : COMPANY SHARE 2024 (%) (DISTRIBUTOR)

研究方法
数据收集和基准年分析是使用具有大样本量的数据收集模块完成的。该阶段包括通过各种来源和策略获取市场信息或相关数据。它包括提前检查和规划从过去获得的所有数据。它同样包括检查不同信息源中出现的信息不一致。使用市场统计和连贯模型分析和估计市场数据。此外,市场份额分析和关键趋势分析是市场报告中的主要成功因素。要了解更多信息,请请求分析师致电或下拉您的询问。
DBMR 研究团队使用的关键研究方法是数据三角测量,其中包括数据挖掘、数据变量对市场影响的分析和主要(行业专家)验证。数据模型包括供应商定位网格、市场时间线分析、市场概览和指南、公司定位网格、专利分析、定价分析、公司市场份额分析、测量标准、全球与区域和供应商份额分析。要了解有关研究方法的更多信息,请向我们的行业专家咨询。
可定制
Data Bridge Market Research 是高级形成性研究领域的领导者。我们为向现有和新客户提供符合其目标的数据和分析而感到自豪。报告可定制,包括目标品牌的价格趋势分析、了解其他国家的市场(索取国家列表)、临床试验结果数据、文献综述、翻新市场和产品基础分析。目标竞争对手的市场分析可以从基于技术的分析到市场组合策略进行分析。我们可以按照您所需的格式和数据样式添加您需要的任意数量的竞争对手数据。我们的分析师团队还可以为您提供原始 Excel 文件数据透视表(事实手册)中的数据,或者可以帮助您根据报告中的数据集创建演示文稿。


