北美第三方风险管理市场,按组件(解决方案和服务)、部署模型(本地和云)、组织规模(中小型企业和大型企业)、最终用户(银行、金融服务和保险、IT 和电信、医疗保健和生命科学、政府、航空航天和国防、零售和消费品、制造业、能源和公用事业等)、国家(美国、加拿大、墨西哥)行业趋势和预测到 2028 年。
市场分析和见解:
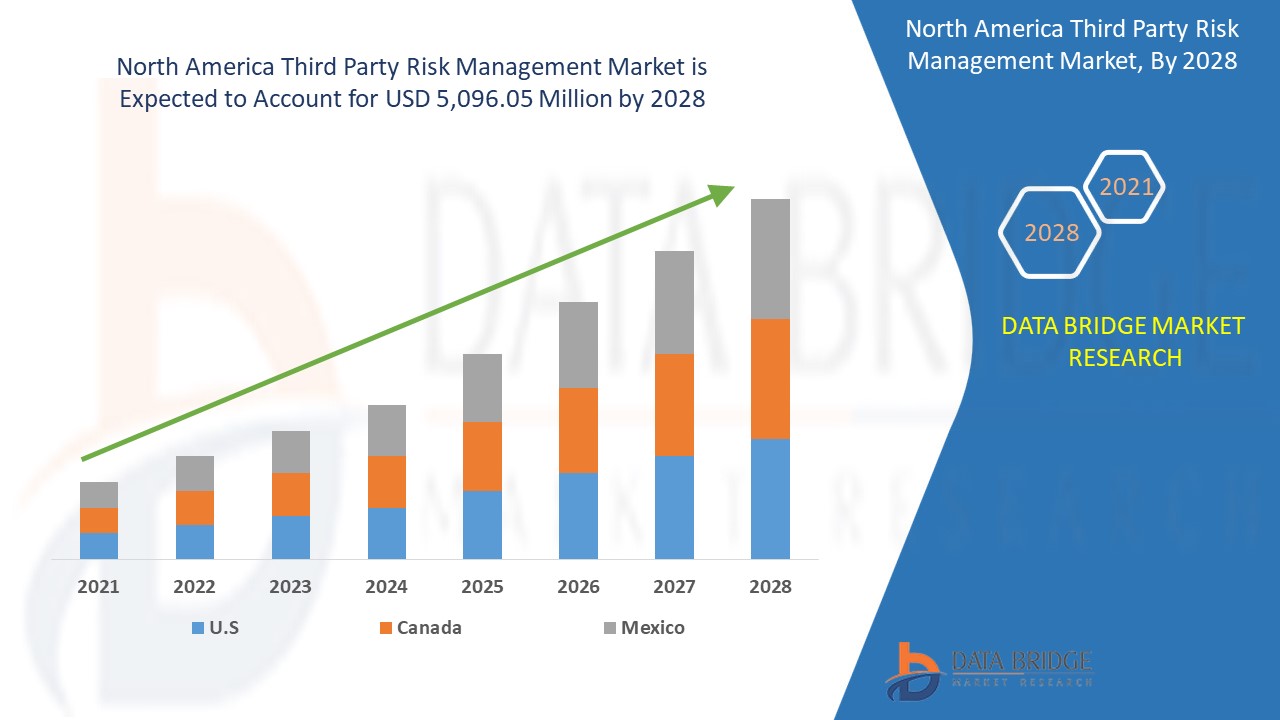
北美第三方风险管理市场预计将在 2021 年至 2028 年的预测期内实现市场增长。Data Bridge Market Research 分析,在 2021 年至 2028 年的预测期内,该市场的复合年增长率为 18.1%,预计到 2028 年将达到 50.9605 亿美元。网络攻击和勒索软件的激增是北美第三方风险管理市场增长的主要因素。
第三方风险管理是指识别和降低与使用第三方有关的风险的风险管理。该学科旨在让组织了解他们使用的第三方、他们如何使用第三方以及第三方采取了哪些保护措施。组织越来越依赖第三方来提高盈利能力、加快产品上市时间、获得竞争优势并降低成本。然而,第三方关系伴随着多种风险,包括战略风险、运营风险、声誉风险、财务风险、交易风险、合规风险和信息安全风险等。TPRM 是识别、评估和控制您与第三方关系生命周期中出现的这些风险和其他风险的过程。第三方风险管理生命周期是指概述与第三方的典型关系的一系列步骤,例如供应商识别、评估和选择、风险评估、风险缓解和监控。
各组织对第三方供应商的依赖性日益增强,这是北美第三方风险管理市场增长的主要因素。监管机构对数据治理和隐私的日益重视促进了市场的增长。然而,缺乏意识和对传统和手动风险管理流程的依赖可能会成为市场增长的主要制约因素。北美地区见证了人工智能和机器学习技术在第三方尽职调查中的应用日益增多,这为市场带来了机遇。高昂的初始投资成本可能会成为市场增长的主要挑战。
这份北美第三方风险管理市场报告提供了市场份额、新发展和产品线分析的详细信息,国内和本地化市场参与者的影响,分析了新兴收入领域、市场法规变化、产品批准、战略决策、产品发布、地域扩张和市场技术创新方面的机会。要了解分析和市场情景,请联系我们获取分析师简报;我们的团队将帮助您创建收入影响解决方案,以实现您的预期目标。
 北美第三方风险管理市场范围和市场规模
北美第三方风险管理市场根据组件、部署模型、组织规模和最终用户进行细分。细分市场之间的增长有助于您分析利基增长领域和进入市场的策略,并确定您的核心应用领域和目标市场的差异。
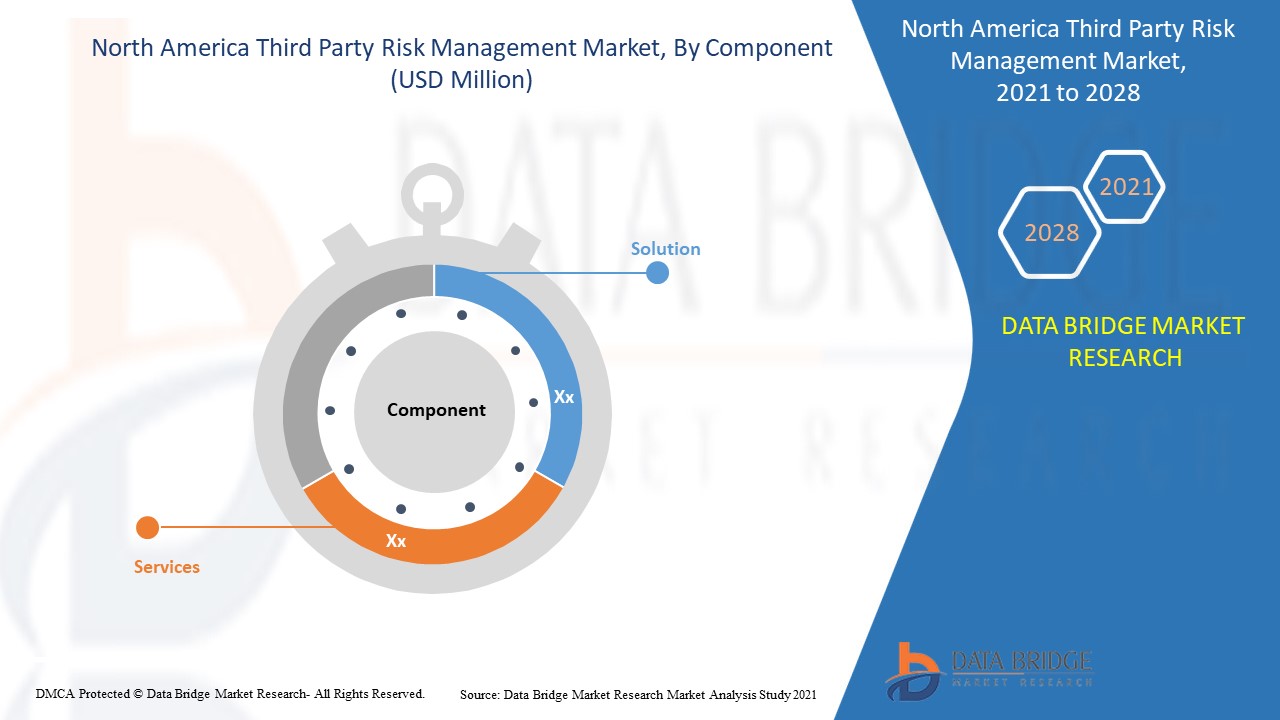
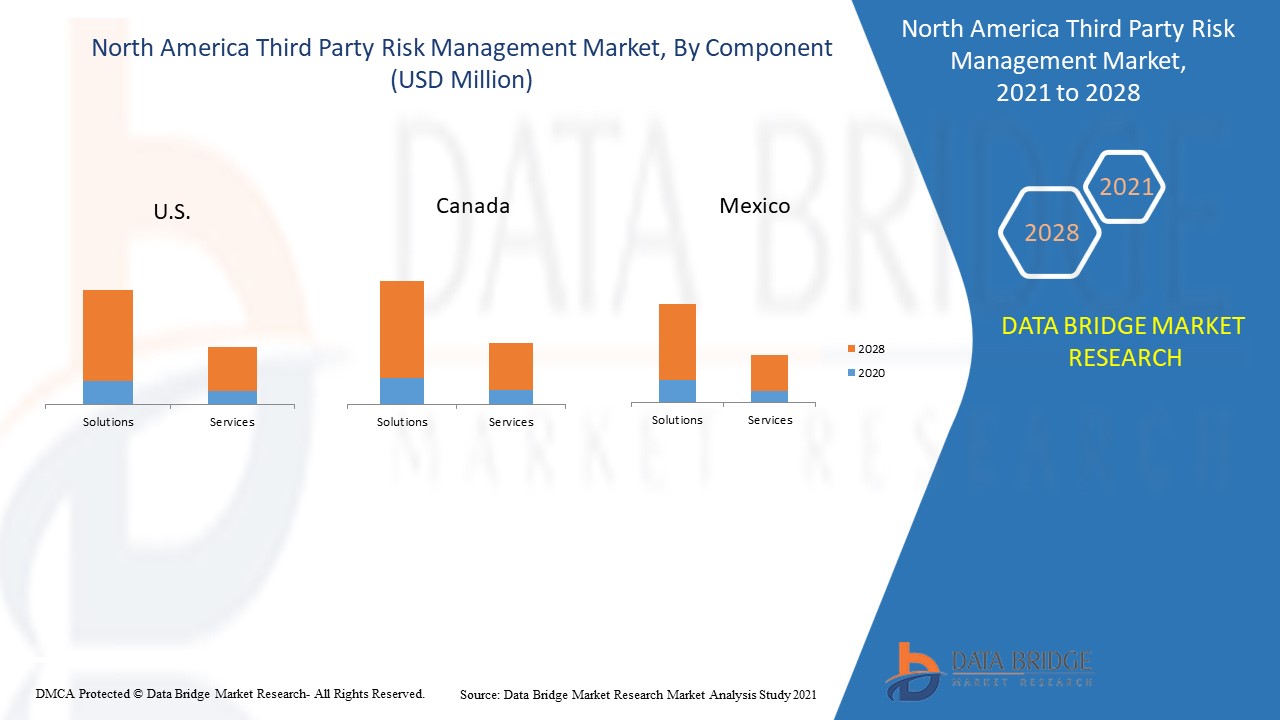
- 根据组成部分,北美第三方风险管理市场分为解决方案和服务。2021 年,解决方案部分预计将占据市场主导地位,因为第三方风险管理解决方案有助于降低数据泄露风险并提高美国和加拿大等国家网络安全扩展计划的效率。
- 根据部署模式,北美第三方风险管理市场分为计算机本地和云。由于各地区本地第三方管理解决方案的普及,预计 2021 年本地部分将占据市场主导地位。
- 根据组织规模,北美第三方风险管理市场分为中小型企业和大型企业。2021 年,大型企业部门预计将占据市场主导地位,原因是北美地区的大型企业主要依赖第三方,并且在大型企业中得到广泛采用。
- 根据最终用户,北美第三方风险管理市场细分为银行、金融服务和保险、IT 和电信、医疗保健和生命科学、政府航空航天和国防、零售和消费品、制造业、能源和公用事业等。2021 年,政府、航空航天和国防预计将主导市场,因为有效的风险管理对北美政府、航空航天和国防机构至关重要,并且拥有至关重要的数据。
 北美第三方风险管理市场国家级分析
对北美第三方风险管理市场进行分析,并按国家、组成部分、部署模式、组织规模和最终用户提供市场规模信息。
北美第三方风险管理市场报告涵盖的国家包括美国、加拿大和墨西哥。
美国占据第三方风险管理市场的最大份额,因为该国拥有大量主导参与者和本地参与者,并且越来越多地采用第三方风险管理解决方案方面的技术创新。
报告的国家部分还提供了影响市场当前和未来趋势的各个市场影响因素和市场监管变化。新销售、替代销售、国家人口统计、监管法案和进出口关税等数据点是用于预测各个国家市场情景的一些主要指标。此外,在对国家数据进行预测分析时,还考虑了北美品牌的存在和可用性以及它们因来自本地和国内品牌的激烈或稀缺竞争而面临的挑战、销售渠道的影响。
第三方风险管理需求不断增长
北美第三方风险管理市场还为您提供每个国家/地区行业增长的详细市场分析,包括销售额、零部件销售额、技术发展对第三方风险管理的影响以及监管情景的变化及其对北美第三方风险管理市场的支持。数据涵盖 2011 年至 2019 年的历史时期。
竞争格局和北美第三方风险管理市场份额分析
北美第三方风险管理市场竞争格局提供了竞争对手的详细信息。详细信息包括公司概况、公司财务状况、产生的收入、市场潜力、研发投资、新市场计划、北美业务、生产基地和设施、公司优势和劣势、产品发布、产品试验渠道、产品批准、专利、产品宽度和广度、应用主导地位、技术生命线曲线。以上数据点仅与公司对北美第三方风险管理市场的关注有关。
北美第三方风险管理报告涵盖的主要参与者包括 RSA Security LLC、KPMG International、Deloitte Touche Tohmatsu Limited、BitSight Technologies、ProcessUnity, Inc.、Genpact、Venminder, Inc.、Resolver Inc.、NAVEX Global, Inc.、SAI Global Compliance, Inc.、Rapid Ratings International Inc.、Optiv Security Inc.、PwC、Aravo Soutions, Inc.、OneTrust, LLC、Prevalent, Inc.、Alyne GmbH、Ernst & Young Global Limited、IBM Corporation 等。DBMR 分析师了解竞争优势并为每个竞争对手分别提供竞争分析。
全球各地的公司也纷纷推出新产品,这也加速了北美第三方风险管理市场的增长。
例如,
- 2021 年 9 月,Venminder, Inc. 宣布在其第三方风险管理平台中推出新的 SIG Lite 2022 和 SIG Core 2022。2022 SIG 正在更新,以适应不断变化的监管和威胁环境。这使该公司能够简化第三方风险专业人士和填写问卷的供应商的问卷调查流程。这增强了公司向客户提供标准化保证的能力
- 2020 年 11 月,Rapid Ratings International Inc. 宣布扩展和增强 FHR 网络。这个创新且安全的会员平台使私营公司供应商能够分享他们的财务健康评级。通过 FHR 网络,第三方供应商能够有效、一致且透明地进行沟通和协作。FHR 网络为他们提供了扩展的功能,帮助供应商谨慎而安全地传达他们的风险敞口和机会。这增强了公司的风险管理平台
合作、合资和其他战略通过扩大覆盖范围和影响力来提高公司的市场份额。通过扩大规模范围,公司还能够改善其第三方风险管理服务。
SKU-
Get online access to the report on the World's First Market Intelligence Cloud
- Interactive Data Analysis Dashboard
- Company Analysis Dashboard for high growth potential opportunities
- Research Analyst Access for customization & queries
- Competitor Analysis with Interactive dashboard
- Latest News, Updates & Trend analysis
- Harness the Power of Benchmark Analysis for Comprehensive Competitor Tracking
目录
- introduction
- OBJECTIVES OF THE STUDY
- MARKET DEFINITION
- OVERVIEW of North America third party risk management market
- Currency and Pricing
- LIMITATIONS
- MARKETS COVERED
- MARKET SEGMENTATION
- MARKETS COVERED
- geographicAL scope
- years considered for the study
- DBMR TRIPOD DATA VALIDATION MODEL
- primary interviews with key opinion leaders
- DBMR MARKET POSITION GRID
- vendor share analysis
- End user COVERAGE GRID
- Multivariate Modeling
- PRODUCTS timeline curve
- secondary sourcEs
- assumptions
- EXECUTIVE SUMMARY
- premium insights
- market overview
- drivers
- Surge in cyberattacks and ransomware
- Increasing dependence of various organizations on third party vendors
- Increasing emphasis on data governance and privacy by regulatory bodies
- Increasing pace of digitalization in businesses
- Surge in the third party supply chain breaches
- RESTRAINTS
- COnstant Changes in compliance laws and regulations
- Lack of awareness and Dependence on conventional and manual risk management processes
- opportunities
- ESG-related third party risk is an emerging concern for many organizations
- Increasing application of AI and ML technologies for third party due TO diligence
- Third party risk management using blockchain
- Increasing use of cloud environment for business application
- challenges
- High initial investment cost
- Lack of skilled employees to perform and manage risk assessments
- Companies are inconsistent in their approach to TPRM
- COVID-19 IMPACT ON NORTH AMERICA THIRD PARTY RISK MANAGEMENT MARKET
- ANALYSIS ON IMPACT OF COVID-19 ON THE MARKET
- AFTERMATH OF COVID-19 AND GOVERNMENT INITIATIVE TO BOOSt THE MARKET
- STRATEGIC DECISIONS FOR MANUFACTURERS AFTER COVID-19 TO GAIN COMPETITIVE MARKET SHARE
- IMPACT ON DEMAND
- IMPACT ON SUPPLY CHAIN
- PRICE IMPACT
- CONCLUSION
- NORTH AMERICA THIRD PARTY RISK MANAGEMENT MARKET, BY component
- overview
- solutions
- compliance management
- financial control management
- operation risk management
- contract management
- audit management
- others
- services
- professional services
- CONSULTING
- INTEGRATION AND DESIGN
- SUPPORT AND MAINTENANCE
- managed services
- North America THIRD PARTY RISK MANAGEMENT MARKET, BY deployment model
- overview
- on-premise
- cloud
- North America THIRD PARTY RISK MANAGEMENT MARKET, BY ORGANIZATION SIZE
- overview
- large enterprises
- small and medium-sized enterprises
- North America THIRD PARTY RISK MANAGEMENT MARKET, BY end user
- overview
- GOVERNMENT, AEROSPACE, AND DEFENSE
- large enterprises
- small and medium-sized enterprises
- banking, financial services and insurance
- large enterprises
- small and medium-sized enterprises
- IT AND TELECOM
- large enterprises
- small and medium-sized enterprises
- HEALTHCARE AND LIFE SCIENCES
- large enterprises
- small and medium-sized enterprises
- RETAIL AND CONSUMER GOODS
- large enterprises
- small and medium-sized enterprises
- MANUFACTURING
- large enterprises
- small and medium-sized enterprises
- ENERGY AND UTILITIES
- large enterprises
- small and medium-sized enterprises
- others
- large enterprises
- small and medium-sized enterprises
- North America third party risk management market, by region
- overview
- North America
- u.s.
- canada
- mexico
- NORTH AMERICA Third party risk management market: COMPANY landscape
- company share analysis: NORTH AMERICA
- Swot analysis
- COMPANY PROFILE
- ERNST & YOUNG GLOBAL LIMITED
- COMPANY SNAPSHOT
- PRODUCT PORTFOLIO
- RECENT DEVELOPMENTS
- ONETRUST, LLC
- COMPANY SNAPSHOT
- PRODUCT PORTFOLIO
- RECENT DEVELOPMENTS
- DELOITTE TOUCHE TOHMATSU LIMITED
- COMPANY SNAPSHOT
- . PRODUCT PORTFOLIO
- RECENT DEVELOPMENTS
- KPMG INTERNATIONAL
- COMPANY SNAPSHOT
- PRODUCT PORTFOLIO
- RECENT DEVELOPMENT
- GENPACT
- COMPANY SNAPSHOT
- REVENUE ANALYSIS
- PRODUCT PORTFOLIO
- RECENT DEVELOPMENT
- ALYNE GMBH
- COMPANY SNAPSHOT
- PRODUCT PORTFOLIO
- RECENT DEVELOPMENTS
- ARAVO SOLUTIONS, INC.
- COMPANY SNAPSHOT
- PRODUCT PORTFOLIO
- RECENT DEVELOPMENTS
- BITSIGHT TECHNOLOGIES
- COMPANY SNAPSHOT
- PRODUCT PORTFOLIO
- RECENT DEVELOPMENTS
- IBM CORPORATION
- COMPANY SNAPSHOT
- REVENUE ANALYSIS
- PRODUCT PORTFOLIO
- RECENT DEVELOPMENT
- METRICSTREAM
- COMPANY SNAPSHOT
- PRODUCT PORTFOLIO
- . RECENT DEVELOPMENTS
- NAVEX NORTH AMERICA, INC.
- COMPANY SNAPSHOT
- PRODUCT PORTFOLIO
- . RECENT DEVELOPMENTS
- OPTIV SECURITY INC.
- COMPANY SNAPSHOT
- PRODUCT PORTFOLIO
- RECENT DEVELOPMENTS
- PREVALENT, INC.
- COMPANY SNAPSHOT
- PRODUCT PORTFOLIO
- RECENT DEVELOPMENTS
- PROCESSUNITY, INC.
- COMPANY SNAPSHOT
- PRODUCT PORTFOLIO
- RECENT DEVELOPMENTS
- PWC
- COMPANY SNAPSHOT
- REVENUE ANALYSIS
- PRODUCT PORTFOLIO
- RECENT DEVELOPMENT
- RAPID RATINGS INTERNATIONAL INC.
- COMPANY SNAPSHOT
- PRODUCT PORTFOLIO
- RECENT DEVELOPMENTS
- RESOLVER INC.
- COMPANY SNAPSHOT
- PRODUCT PORTFOLIO
- RECENT DEVELOPMENTS
- RSA SECURITY LLC
- COMPANY SNAPSHOT
- PRODUCT PORTFOLIO
- RECENT DEVELOPMENTS
- SAI GLOBAL COMPLIANCE, INC.
- COMPANY SNAPSHOT
- PRODUCT PORTFOLIO
- RECENT DEVELOPMENTS
- VENMINDER, INC.
- COMPANY SNAPSHOT
- PRODUCT PORTFOLIO
- RECENT DEVELOPMENTS
- questionnaire
- related reports
表格列表
TABLE 1 North America THIRD PARTY RISK MANAGEMENT Market, By Component, 2019-2028 (USD Million)
TABLE 2 North America solutions in THIRD PARTY RISK MANAGEMENT MARKET, By type, 2019-2028 (USD MILLION)
TABLE 3 North America Services in THIRD PARTY RISK MANAGEMENT Market, By type, 2019-2028 (USD MILLION)
TABLE 4 North America Professional services in THIRD PARTY RISK MANAGEMENT Market, By type, 2019-2028 (USD MILLION)
TABLE 5 North America THIRD PARTY RISK MANAGEMENT Market, By deployment model, 2019-2028 (USD Million)
TABLE 6 North America on-premise in THIRD PARTY RISK MANAGEMENT Market, By Region ,2019-2028 (USD Million)
TABLE 7 North America THIRD PARTY RISK MANAGEMENT Market, By organization size, 2019-2028 (USD Million)
TABLE 8 North America THIRD PARTY RISK MANAGEMENT Market, By end user, 2019-2028 (USD Million)
TABLE 9 North America Government, aerospace, and defense in THIRD PARTY RISK MANAGEMENT Market, By Organization Size, 2019-2028 (USD MILLION)
TABLE 10 North America Banking, financial services and insurance in THIRD PARTY RISK MANAGEMENT Market, By Organization Size, 2019-2028 (USD MILLION)
TABLE 11 North America IT and telecom in THIRD PARTY RISK MANAGEMENT MARKET, By Organization Size, 2019-2028 (USD MILLION)
TABLE 12 North America Healthcare and life sciences in THIRD PARTY RISK MANAGEMENT Market, By Organization Size, 2019-2028 (USD MILLION)
TABLE 13 North America Retail and consumer goods in THIRD PARTY RISK MANAGEMENT Market, By Organization Size, 2019-2028 (USD MILLION)
TABLE 14 North America Manufacturing in THIRD PARTY RISK MANAGEMENT Market, By Organization Size, 2019-2028 (USD MILLION)
TABLE 15 North America Energy and utilities in THIRD PARTY RISK MANAGEMENT Market, By Organization Size, 2019-2028 (USD MILLION)
TABLE 16 North America Others in THIRD PARTY RISK MANAGEMENT Market, By Organization Size, 2019-2028 (USD MILLION)
TABLE 17 NORTH AMERICA THIRD PARTY RISK MANAGEMENT MARKET, By Country, 2019-2028 (USD Million)
TABLE 18 U.S. Third party risk management market, By Component, 2019-2028 (USD Million)
TABLE 19 U.S. solutions in Third party risk management market, By Type, 2019-2028 (USD Million)
TABLE 20 U.S. services in Third party risk management market, By Type, 2019-2028 (USD Million)
TABLE 21 U.S. Professional Services in Third party risk management market, By Type, 2019-2028 (USD Million)
TABLE 22 U.S. Third party risk management market, By deployment model, 2019-2028 (USD Million)
TABLE 23 U.S. Third party risk management market, By organization size, 2019-2028 (USD Million)
TABLE 24 U.S. Third party risk management market, By end user, 2019-2028 (USD Million)
TABLE 25 U.S. government, Aerospace, and Defense in Third party risk management market, By organization size, 2019-2028 (USD Million)
TABLE 26 U.S. Banking, Financial Services, and Insurance in Third party risk management market, By organization size, 2019-2028 (USD Million)
TABLE 27 U.S. Healthcare and Life Sciences in Third party risk management market, By organization size, 2019-2028 (USD Million)
TABLE 28 U.S. IT and Telecom in Third party risk management market, By organization size, 2019-2028 (USD Million)
TABLE 29 U.S. Manufacturing in Third party risk management market, By organization size, 2019-2028 (USD Million)
TABLE 30 U.S. Energy and Utilities in Third party risk management market, By organization size, 2019-2028 (USD Million)
TABLE 31 U.S. Retail and Consumer Goods in Third party risk management market, By organization size, 2019-2028 (USD Million)
TABLE 32 U.S. Others in Third party risk management market, By organization size, 2019-2028 (USD Million)
TABLE 33 CANADA Third party risk management market, By Component, 2019-2028 (USD Million)
TABLE 34 CANADA solutions in Third party risk management market, By Type, 2019-2028 (USD Million)
TABLE 35 CANADA services in Third party risk management market, By Type, 2019-2028 (USD Million)
TABLE 36 CANADA Professional Services in Third party risk management market, By Type, 2019-2028 (USD Million)
TABLE 37 CANADA Third party risk management market, By deployment model, 2019-2028 (USD Million)
TABLE 38 CANADA Third party risk management market, By organization size, 2019-2028 (USD Million)
TABLE 39 CANADA Third party risk management market, By end user, 2019-2028 (USD Million)
TABLE 40 CANADA government, Aerospace, and Defense in Third party risk management market, By organization size, 2019-2028 (USD Million)
TABLE 41 CANADA Banking, Financial Services, and Insurance in Third party risk management market, By organization size, 2019-2028 (USD Million)
TABLE 42 CANADA Healthcare and Life Sciences in Third party risk management market, By organization size, 2019-2028 (USD Million)
TABLE 43 CANADA IT and Telecom in Third party risk management market, By organization size, 2019-2028 (USD Million)
TABLE 44 CANADA Manufacturing in Third party risk management market, By organization size, 2019-2028 (USD Million)
TABLE 45 CANADA Energy and Utilities in Third party risk management market, By organization size, 2019-2028 (USD Million)
TABLE 46 CANADA Retail and Consumer Goods in Third party risk management market, By organization size, 2019-2028 (USD Million)
TABLE 47 CANADA Others in Third party risk management market, By organization size, 2019-2028 (USD Million)
TABLE 48 MEXICO Third party risk management market, By Component, 2019-2028 (USD Million)
TABLE 49 MEXICO solutions in Third party risk management market, By Type, 2019-2028 (USD Million)
TABLE 50 MEXICO services in Third party risk management market, By Type, 2019-2028 (USD Million)
TABLE 51 MEXICO Professional Services in Third party risk management market, By Type, 2019-2028 (USD Million)
TABLE 52 MEXICO Third party risk management market, By deployment model, 2019-2028 (USD Million)
TABLE 53 MEXICO Third party risk management market, By organization size, 2019-2028 (USD Million)
TABLE 54 MEXICO Third party risk management market, By end user, 2019-2028 (USD Million)
TABLE 55 MEXICO government, Aerospace, and Defense in Third party risk management market, By organization size, 2019-2028 (USD Million)
TABLE 56 MEXICO Banking, Financial Services, and Insurance in Third party risk management market, By organization size, 2019-2028 (USD Million)
TABLE 57 MEXICO Healthcare and Life Sciences in Third party risk management market, By organization size, 2019-2028 (USD Million)
TABLE 58 MEXICO IT and Telecom in Third party risk management market, By organization size, 2019-2028 (USD Million)
TABLE 59 MEXICO Manufacturing in Third party risk management market, By organization size, 2019-2028 (USD Million)
TABLE 60 MEXICO Energy and Utilities in Third party risk management market, By organization size, 2019-2028 (USD Million)
TABLE 61 MEXICO Retail and Consumer Goods in Third party risk management market, By organization size, 2019-2028 (USD Million)
TABLE 62 MEXICO Others in Third party risk management market, By organization size, 2019-2028 (USD Million)
图片列表
FIGURE 1 North America third party risk MANAGEMENT MARKET: segmentation
FIGURE 2 North America third party risk management market: data triangulation
FIGURE 3 North America third party risk management market: DROC ANALYSIS
FIGURE 4 North America third party risk MANAGEMENT MARKET: NORTH AMERICA VS REGIONAL MARKET ANALYSIS
FIGURE 5 North America third party risk MANAGEMENT MARKET: COMPANY RESEARCH ANALYSIS
FIGURE 6 North America third party risk MANAGEMENT MARKET: INTERVIEW DEMOGRAPHICS
FIGURE 7 North America third party risk management market: DBMR MARKET POSITION GRID
FIGURE 8 North America third party risk MANAGEMENT MARKET: vendor share analysis
FIGURE 9 NORTH AMERICA third party risk management market: APPLICATION COVERAGE GRID
FIGURE 10 North America third party risk management market: SEGMENTATION
FIGURE 11 Increasing dependence of various organizations on third party vendors is EXPECTED TO DRIVE THE North America third party risk management market IN THE FORECAST PERIOD OF 2021 to 2028
FIGURE 12 solutions segment is expected to account for the largest share of THE North America third party risk management market in 2021 & 2028
FIGURE 13 DRIVERS, RESTRaINT, OPPORTUNITIES, AND CHALLENGEs OF NORTH AMERICA THIRD PARTY RISK MANAGEMENT MARKET
FIGURE 14 North America THIRD PARTY RISK MANAGEMENT MARKET, BY component, 2020
FIGURE 15 North America THIRD PARTY RISK MANAGEMENT MARKET, BY deployment model, 2020
FIGURE 16 North America THIRD PARTY RISK MANAGEMENT MARKET, BY organization size, 2020
FIGURE 17 North America THIRD PARTY RISK MANAGEMENT MARKET, BY end user, 2020
FIGURE 18 NORTH AMERICA THIRD PARTY RISK MANAGEMENT MARKET: SNAPSHOT (2020)
FIGURE 19 NORTH AMERICA THIRD PARTY RISK MANAGEMENT MARKET: by Country (2020)
FIGURE 20 NORTH AMERICA THIRD PARTY RISK MANAGEMENT MARKET: by Country (2021 & 2028)
FIGURE 21 NORTH AMERICA THIRD PARTY RISK MANAGEMENT MARKET: by Country (2020 & 2028)
FIGURE 22 NORTH AMERICA THIRD PARTY RISK MANAGEMENT MARKET: by Component (2021-2028)
FIGURE 23 NORTH AMERICA Third party risk management Market: company share 2020 (%)

研究方法
数据收集和基准年分析是使用具有大样本量的数据收集模块完成的。该阶段包括通过各种来源和策略获取市场信息或相关数据。它包括提前检查和规划从过去获得的所有数据。它同样包括检查不同信息源中出现的信息不一致。使用市场统计和连贯模型分析和估计市场数据。此外,市场份额分析和关键趋势分析是市场报告中的主要成功因素。要了解更多信息,请请求分析师致电或下拉您的询问。
DBMR 研究团队使用的关键研究方法是数据三角测量,其中包括数据挖掘、数据变量对市场影响的分析和主要(行业专家)验证。数据模型包括供应商定位网格、市场时间线分析、市场概览和指南、公司定位网格、专利分析、定价分析、公司市场份额分析、测量标准、全球与区域和供应商份额分析。要了解有关研究方法的更多信息,请向我们的行业专家咨询。
可定制
Data Bridge Market Research 是高级形成性研究领域的领导者。我们为向现有和新客户提供符合其目标的数据和分析而感到自豪。报告可定制,包括目标品牌的价格趋势分析、了解其他国家的市场(索取国家列表)、临床试验结果数据、文献综述、翻新市场和产品基础分析。目标竞争对手的市场分析可以从基于技术的分析到市场组合策略进行分析。我们可以按照您所需的格式和数据样式添加您需要的任意数量的竞争对手数据。我们的分析师团队还可以为您提供原始 Excel 文件数据透视表(事实手册)中的数据,或者可以帮助您根据报告中的数据集创建演示文稿。


