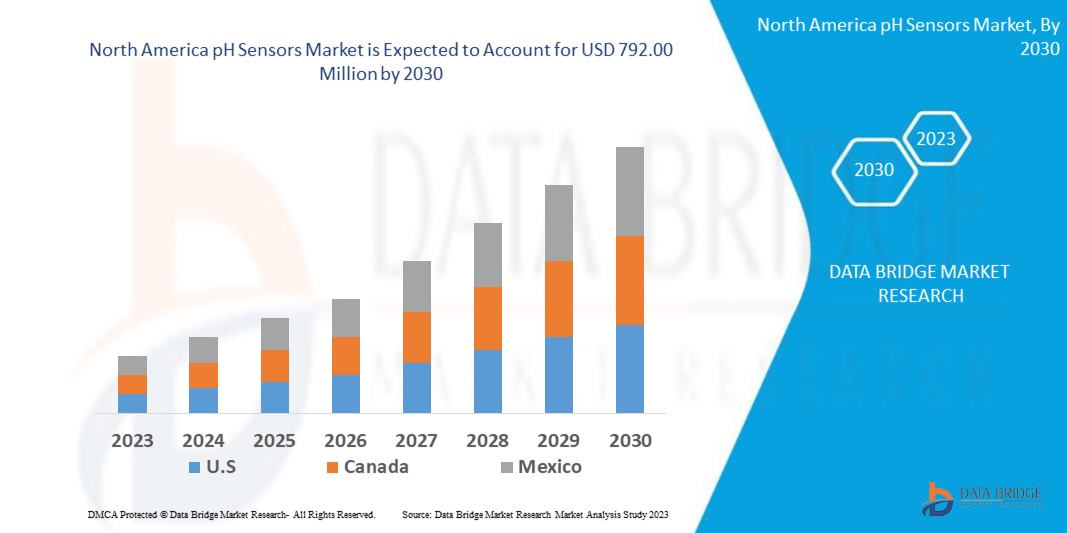
North America Ph Sensors Market
市场规模(十亿美元)
CAGR :
% 
 USD
413.45 million
USD
792.00 million
2022
2030
USD
413.45 million
USD
792.00 million
2022
2030
| 2023 –2030 | |
| USD 413.45 million | |
| USD 792.00 million | |
|
|
|
北美 pH 传感器市场,按类型(过程传感器、差分传感器、组合 PH 传感器、实验室传感器)、组件(硬件和服务)、产品类型(数字和模拟)、系统类型(台式和便携式)、垂直(水和废水工业、化学工业、石油和天然气工业、食品和饮料工业、医疗和制药工业、造纸工业、金属和采矿业、农业工业、其他)划分——行业趋势和预测到 2030 年。
北美 pH 传感器市场分析及规模
PH 传感器通常由传感电极和参比电极组成。传感电极对氢离子浓度的变化敏感,并产生与溶液 pH 成比例的电信号。参比电极为测量提供稳定的参考点。
Data Bridge Market Research 分析,北美 pH 传感器市场在 2022 年为 4.1345 亿美元,到 2030 年将飙升至 7.92 亿美元,预计在预测期内的复合年增长率为 9.54%。这表明了市场价值。PH 传感器是用于测量溶液酸度或碱度的设备。PH 代表“氢的功率”,是溶液中氢离子浓度的量度。pH 值范围从 0 到 14,其中 7 被认为是中性的。pH 值低于 7 表示酸性,而 pH 值高于 7 表示碱性。除了对市场价值、增长率、细分、地理覆盖范围和主要参与者等市场情景的洞察外,Data Bridge Market Research 策划的市场报告还包括深度专家分析、患者流行病学、管道分析、定价分析和监管框架。
北美 pH 传感器市场范围和细分
|
报告指标 |
细节 |
|
预测期 |
2023 至 2030 年 |
|
基准年 |
2022 |
|
历史岁月 |
2021 (可定制为 2015-2020) |
|
定量单位 |
收入(百万美元)、销量(单位)、定价(美元) |
|
涵盖的领域 |
类型(过程传感器、差分传感器、组合 PH 传感器、实验室传感器)、组件(硬件和服务)、产品类型(数字和模拟)、系统类型(台式和便携式)、垂直(水和废水工业、化学工业、石油和天然气工业、食品和饮料工业、医疗和制药工业、造纸工业、金属和采矿工业、农业工业和其他) |
|
覆盖国家 |
美国、加拿大和墨西哥 |
|
涵盖的市场参与者 |
Christian Burkert GmbH & Co. KG(德国)、Endress+Hauser Group Services AG(瑞士)、Knick Electronische Messgerate GmbH & Co. KG(德国)、Thermo Fisher Scientific Inc.(美国)、Yokogawa Electric Corporation(日本)、LTH Electronics Ltd.(英国)、Omega Engineering Inc(美国)、Krohne Messtechnik GmbH(德国)、PreSens precision Sensing GmbH(德国)、施耐德电气(法国)、Sea-Bird Scientific(美国)、Xylem Analytics UK Ltd.(英国)、Chemitec(意大利)、ABB(瑞士)、HACH(美国)、梅特勒-托利多(美国)、Gf Piping systems(瑞士) |
|
市场机会 |
|
市场定义
pH 传感器市场是指从事 pH 传感器生产、分销和销售的行业,pH 传感器是一种用于测量溶液酸度或碱度的设备。pH 传感器广泛应用于各种行业,包括水和废水处理、化学品制造、制药、食品和饮料加工、环境监测和研究实验室。pH 传感器旨在检测和量化溶液中氢离子 (H+) 的浓度。它们通常由玻璃电极和参比电极组成,可产生与被测溶液的 pH 值成比例的电压。然后将该电压转换为 pH 读数,可通过 pH 计或其他测量设备显示和分析。
北美 pH 传感器市场
驱动程序
- 对技术进步的需求日益增加
pH 传感器技术不断发展,从而开发出更准确、更可靠、更经济的传感器。固态 pH 传感器、小型化、无线连接和改进的校准技术等进步扩大了 pH 传感器的应用领域并增加了其采用率,预计将推动市场发展。
- 自动化和过程控制的进步
自动化和过程控制系统广泛应用于各个行业,以提高效率、降低成本和提高生产力。pH 传感器通过提供实时 pH 测量,在自动化系统中发挥着至关重要的作用,能够精确控制化学剂量、pH 调整和过程优化,有望促进市场发展。
- 食品和饮料行业对质量控制的需求日益增长
食品和饮料行业需要精确的 pH 监测,以确保产品质量、保质期和安全性。pH 传感器用于监测和控制食品加工、发酵、酿造和其他生产过程中的 pH 水平,因此有望推动该领域的需求。
机会
对环境监测和可持续性的日益关注为 pH 传感器提供了重大机遇。随着政府和组织努力监测和控制空气、水和土壤的污染水平,pH 传感器可以在评估这些环境的酸度或碱度方面发挥关键作用。这为在环境监测网络中部署 pH 传感器开辟了途径,为更好的决策和主动的污染控制措施提供实时数据,并有望为市场创造机会。
限制/挑战
主要制约因素之一是 pH 传感器技术成本高昂。先进的 pH 传感技术通常涉及复杂的制造工艺、精密组件和校准要求,从而导致更高的生产成本。成本因素可能带来挑战,尤其是对于中小型企业 (SME) 或预算紧张的行业而言,阻碍它们采用 pH 传感器预计将在 2023-2030 年预测期内对市场构成挑战。
这份北美 pH 传感器市场报告详细介绍了最新发展、贸易法规、进出口分析、生产分析、价值链优化、市场份额、国内和本地市场参与者的影响,分析了新兴收入领域的机会、市场法规的变化、战略市场增长分析、市场规模、类别市场增长、应用领域和主导地位、产品批准、产品发布、地域扩展、市场技术创新。如需了解有关北美 pH 传感器市场的更多信息,请联系 Data Bridge Market Research 获取分析师简报,我们的团队将帮助您做出明智的市场决策,以实现市场增长。
最新动态
- 2023 年 5 月,创新领域的领先公司 Endress+Hauser 最近在年度创新者会议上庆祝了其 300 名创新者,强调了他们对培养创意和进步的承诺。随着对研发的投入增加,该公司继续将创新放在首位,并认可参与专利申请的员工的宝贵贡献。此次活动在德国弗莱堡会议中心举行,聚集了一群多元化的创新者和嘉宾,展示了 Endress+Hauser 致力于培育创造力和尖端解决方案的文化
- 2023 年 3 月,赛默飞世尔科技公司和加州大学旧金山分校 (UCSF) 开设了一家 cGMP 制造工厂,以加速开发针对癌症和罕见疾病等棘手疾病的先进细胞疗法。此次合作旨在利用科学家、临床医生和患者与制造基地的距离来加快突破性治疗方法的研发。该工厂最初专注于胶质母细胞瘤、多发性骨髓瘤和其他癌症,将利用更新的 CAR-T 和 CRISPR 技术,并计划在未来扩展到其他难以治疗的疾病
北美 pH 传感器市场范围
pH 传感器市场根据类型、组件、产品类型、系统类型和垂直行业进行细分。这些细分市场之间的增长情况将帮助您分析行业中增长缓慢的细分市场,并为用户提供有价值的市场概览和市场洞察,帮助他们做出战略决策,确定核心市场应用。
类型
- 过程传感器
- 差分传感器
- 组合 PH 传感器
- 实验室传感器
成分
- 硬件
- 服务
产品类型
- 数字的
- 模拟
系统类型
- 台式
- 便携的
垂直的
- 水和废水处理行业
- 化工
- 石油和天然气工业
- 食品饮料行业
- 医疗和制药行业
- 造纸工业
- 金属及采矿业
- 农业产业
- 其他的
北美 pH 传感器市场区域分析/见解
对 pH 传感器市场进行了分析,并按类型、组件、产品类型、系统类型和垂直提供了市场规模洞察和趋势,如上所述。
pH 传感器市场覆盖的国家包括北美地区的美国、加拿大和墨西哥。
美国有望凭借其在各个行业的技术进步和专业知识在 pH 传感器市场占据主导地位。该国拥有强大的研发基础设施,促进创新并推动传感器技术(包括 pH 传感器)的进步。
由于美国地区城市化的快速发展、基础设施的不断完善和先进技术的采用,预计北美在 2023 年至 2030 年的预测期内将出现显著增长。
报告的国家部分还提供了影响单个市场影响因素和国内市场监管变化,这些因素和变化会影响市场的当前和未来趋势。下游和上游价值链分析、技术趋势和波特五力分析以及案例研究等数据点是用于预测单个国家市场情景的一些指标。此外,在提供国家数据的预测分析时,还考虑了全球品牌的存在和可用性以及它们因来自本地和国内品牌的大量或稀缺竞争而面临的挑战、国内关税的影响和贸易路线。
PH 传感器基础设施增长安装基础和新技术渗透
pH 传感器市场还为您提供详细的市场分析,包括每个国家/地区资本设备技术支出的增长、北美 pH 传感器市场不同类型产品的安装基数、使用生命线曲线的技术影响以及 PH 传感器监管情景的变化及其对 pH 传感器市场的影响。数据适用于 2010-2020 年的历史时期。
竞争格局和北美 pH 传感器市场份额分析
pH 传感器市场竞争格局提供了竞争对手的详细信息。详细信息包括公司概况、公司财务状况、收入、市场潜力、研发投资、新市场计划、全球影响力、生产基地和设施、生产能力、公司优势和劣势、产品发布、产品宽度和广度、应用主导地位。以上提供的数据点仅与公司对 pH 传感器市场的关注有关。
北美 pH 传感器市场的一些主要参与者包括:
- Christian Burkert GmbH & Co. KG(德国)
- Endress+Hauser 集团服务股份公司(瑞士)
- Knick Electronische Messgerate GmbH & Co. KG(德国)
- 赛默飞世尔科技公司(美国)
- 横河电机株式会社(日本)
- LTH Electronics Ltd.(英国)
- Omega Engineering Inc(美国)
- 科隆机械技术有限公司(德国)
- PreSens precision Sensing GmbH (德国)
- 施耐德电气(法国)
- 海鸟科学公司(美国)
- Xylem Analytics UK Ltd.(英国)
- Chemitec(意大利)
- ABB(瑞士)
- HACH(美国)
- 梅特勒-托利多(美国)
- Gf 管道系统(瑞士)
SKU-
Get online access to the report on the World's First Market Intelligence Cloud
- Interactive Data Analysis Dashboard
- Company Analysis Dashboard for high growth potential opportunities
- Research Analyst Access for customization & queries
- Competitor Analysis with Interactive dashboard
- Latest News, Updates & Trend analysis
- Harness the Power of Benchmark Analysis for Comprehensive Competitor Tracking
研究方法
数据收集和基准年分析是使用具有大样本量的数据收集模块完成的。该阶段包括通过各种来源和策略获取市场信息或相关数据。它包括提前检查和规划从过去获得的所有数据。它同样包括检查不同信息源中出现的信息不一致。使用市场统计和连贯模型分析和估计市场数据。此外,市场份额分析和关键趋势分析是市场报告中的主要成功因素。要了解更多信息,请请求分析师致电或下拉您的询问。
DBMR 研究团队使用的关键研究方法是数据三角测量,其中包括数据挖掘、数据变量对市场影响的分析和主要(行业专家)验证。数据模型包括供应商定位网格、市场时间线分析、市场概览和指南、公司定位网格、专利分析、定价分析、公司市场份额分析、测量标准、全球与区域和供应商份额分析。要了解有关研究方法的更多信息,请向我们的行业专家咨询。
可定制
Data Bridge Market Research 是高级形成性研究领域的领导者。我们为向现有和新客户提供符合其目标的数据和分析而感到自豪。报告可定制,包括目标品牌的价格趋势分析、了解其他国家的市场(索取国家列表)、临床试验结果数据、文献综述、翻新市场和产品基础分析。目标竞争对手的市场分析可以从基于技术的分析到市场组合策略进行分析。我们可以按照您所需的格式和数据样式添加您需要的任意数量的竞争对手数据。我们的分析师团队还可以为您提供原始 Excel 文件数据透视表(事实手册)中的数据,或者可以帮助您根据报告中的数据集创建演示文稿。


