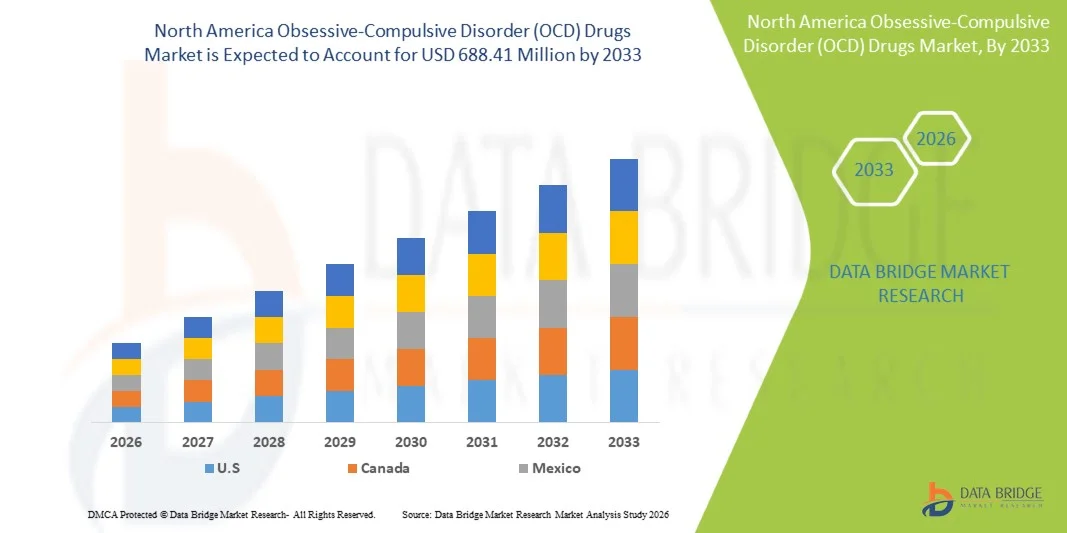
北美强迫症 (OCD) 药物市场,按严重程度(轻度至中度、中度至重度)、按子类型(伴有洗涤/清洁强迫症的污染强迫症、伴有检查强迫症的伤害强迫症、无明显强迫症的强迫症、伴有排序、安排和计数强迫症的对称性强迫症、囤积等)、按药物(抗抑郁药、抗精神病药、NMDA 阻滞剂等)、按给药途径(口服、肠外)、按人群类型(儿科、成人)、按最终用户(医院、专科诊所、家庭医疗保健等)、按分销渠道(医院药房、零售药房、网上药房等)按国家(美国、加拿大、墨西哥)划分。
市场分析与洞察:北美强迫症 (OCD) 药物市场
北美强迫症 (OCD) 药物市场预计将在 2021 年至 2028 年的预测期内实现市场增长。Data Bridge Market Research 分析,在 2021 年至 2028 年的预测期内,该市场将以 10.0% 的复合年增长率增长,预计到 2028 年将达到 4.2745 亿美元。全球人口传染病发病率的增加以及人们生活方式和环境压力的变化是推动预测期内市场需求的主要驱动力。
强迫症 (OCD) 是指一种焦虑症,其特征是无理且无法控制的想法和恐惧,导致个体做出重复行为。强迫症是一种已知会强迫人陷入特定想法或恐惧的疾病。治疗、疗法和新疗法的发展以及抗焦虑、抗精神病和抗抑郁药物的进步预计将为强迫症药物市场提供各种其他机会。然而,专利药物的专利到期和品牌药物仿制药的推出预计会限制预测期内市场的增长。
强迫症药物市场报告提供了市场份额、新发展和产品线分析、国内和本地市场参与者的影响的详细信息,分析了新兴收入来源、市场法规变化、产品审批、战略决策、产品发布、地域扩张和市场技术创新方面的机会。要了解分析和市场情况,请联系我们获取分析师简报,我们的团队将帮助您创建收入影响解决方案,以实现您的预期目标。
北美强迫症 (OCD) 药物市场范围和市场规模
Obsessive-Compulsive Disorder (OCD) Drugs Market is segmented on the basis of severity, subtypes, drugs, route of administration, population, end user, and distribution channel. The growth among segments helps you analyze niche pockets of growth and strategies to approach the market and determine your core application areas and the difference in your target markets.
- On the basis of severity, the North America obsessive compulsive disorder (OCD) drugs market is segmented into mild to moderate and moderate to severe. In 2021, the moderate to severe segment is dominating the North America obsessive obsessive-compulsive disorder (OCD) drugs market due to an increase in the cases of prevalence rate of infectious diseases among the population across the globe are predicted to dominate the market.
- On the basis of subtype, the North America obsessive compulsive disorder (OCD) drugs market is segmented into contamination obsessions with washing/cleaning compulsion, harm obsessions with checking compulsions, obsessions without visible compulsions, symmetry obsessions with ordering, arranging, and counting compulsions, hoarding and others. In 2021, contamination obsessions with washing/cleaning compulsion is are dominating the North America obsessive obsessive-compulsive disorder drug market due to developments in the treatment, therapies, and introduction of novel treatments are predicted to dominate the market.
- On the basis of drugs, the North America obsessive compulsive disorder (OCD) drugs market is segmented into antidepressants, antipsychotics, NMDA blocker, and others. Antidepressants is further segmented into selective serotonin reuptake inhibitors (SSRIs), serotonin-norepinephrine reuptake inhibitors (SNRIs), tricyclic antidepressants (TCAS), and others. SSRIs is further segmented into fluvoxamine, fluoxetine, paroxetine, sertraline, and others. SNRIs is further segmented into duloxetine, venlafaxine and others. TCAS is further segmented into clomipramine, amitriptyline, imipramine and others. Antipsychotics is further segmented into risperidone, haloperidol, quetiapine, olanzapine, aripiprazole and others. NMDA blocker is further segmented into ketamine, memantine, and others. In 2021, the antidepressants segment is dominating the North America obsessive obsessive-compulsive disorder drug market due to advancements in the anti-anxiety, antipsychotic and antidepressant drugs, and the robust pipelines for the development of newer treatment are predicted to dominate the market.
- On the basis of route of administration, the North America obsessive compulsive disorder (OCD) drugs market is segmented into oral and parenteral. Oral is further segmented into tablet, capsules and solution. In 2021, the oral segment is dominating the North America obsessive obsessive-compulsive disorder (OCD) drugs market due to novel treatment, and advancements in therapies are predicted to dominate the market.
- On the basis of population, the North America obsessive compulsive disorder (OCD) drugs market is segmented into pediatrics and adults. In 2021, the adults segment is dominating the North America obsessive obsessive-compulsive disorder drug market due to research and development to enhance bioavailability, pharmacology, safety, and dosage parameters is are predicted to dominate the market.
- On the basis of end user, the North America obsessive compulsive disorder (OCD) drugs market is segmented into hospitals, specialty clinics, home healthcare, and others. In 2021, the hospitals segment is dominating the North America obsessive obsessive-compulsive disorder drug market due to an increase in the cases of prevalence rate of infectious diseases among the population across the globe is predicted to dominate the market.
- On the basis of distribution channels, the North America obsessive compulsive disorder (OCD) drugs market is segmented into hospital pharmacy, retail pharmacy, online pharmacy and others. In 2021, hospital pharmacy segment is dominating the North America obsessive compulsive disorder drug market due to novel treatment and advancements in the anti-anxiety, antipsychotic and antidepressant drugs are predicted to dominate the market.
- In North America, U.S. is the dominant region due to growing position in OCD drug market with novel drug products and strong brand name of drug product.
Obsessive-Compulsive Disorder (OCD) Drugs Market Country Level Analysis
The OCD drugs market is analyzed and market size information is provided on the basis of severity, subtypes, drugs, route of administration, population, end user and distribution channel.
The countries covered in the OCD drugs market report are U.S., Canada, and Mexico.
Oral segment in North America region is expected to grow with the highest growth rate in the forecast period of 2021 to 2028 because of rise in clinical trials and increasing generic approvals.
The country section of the report also provides individual market impacting factors and changes in regulation in the market domestically that impacts the current and future trends of the market. Data points such as new sales, replacement sales, country demographics, regulatory acts and import-export tariffs are some of the major pointers used to forecast the market scenario for individual countries. Also, presence and availability of North America brands and their challenges faced due to large or scarce competition from local and domestic brands, impact of sales channels are considered while providing forecast analysis of the country data.
Strategic initiatives by market players and rise in awareness among people with respect to the disorder are boosting the Market Growth of OCD drugs products.
Obsessive-Compulsive Disorder (OCD) Drugs market also provides you with detailed market analysis for every country growth in OCD products industry with drugs sales, impact of advancement, technology and changes in regulatory scenarios with their support for the OCD drugs market. The data is available for historic period 2010 to 2018.
Competitive Landscape and OCD Market Share Analysis
OCD drugs market competitive landscape provides details by competitor. Details included are company overview, company financials, revenue generated, market potential, investment in research and development, new market initiatives, production sites and facilities, company strengths and weaknesses, product launch, product trials pipelines, product approvals, patents, product width, and breath, application dominance, technology lifeline curve. The above data points provided are only related to the company’s focus related to OCD drugs market.
The major companies which are dealing in the Obsessive-Compulsive Disorder (OCD) drugs are Lannett, H. LUNDBECK A/S, Teva Pharmaceutical industries Ltd. (a subsidiary of Teva Pharmaceutical Industries Ltd.), GlaxoSmithKline plc., Pfizer Inc., Mallinckrodt, Sebela Pharmaceuticals, Zydus Pharmaceuticals, Inc. (a subsidiary of Zydus Cadila), Lupin Pharmaceuticals, Inc., Amneal Pharmaceuticals LLC., Dr. Reddy’s Laboratories Ltd., , Wockhardt, Alvogen, Sun Pharmaceutical Industries Ltd., Aurobindo Pharma USA (a subsidiary of Aurobindo Pharma), Par Pharmaceutical, Apotex Inc., Abbott, Eli Lilly and Company, Viatria Inc., among others.
Many product launch and agreement are also initiated by the companies’ worldwide, which are also accelerating the OCD drugs market.
For instance,
- In February 2021, Lannett announced that it has added a new co-development agreement for biosimilar insulin aspart with its strategic alliance partners within the HEC Group of companies (HEC). Lannett will fund most of the clinical development requirements, while HEC continues to develop the product and related manufacturing infrastructure. Lannett and HEC will share in the profits of the venture.
- In January 2021, Lundbeck and Better Energy ensures the construction of a new solar park. Lundbeck entered a 7-year power purchase agreement (PPA) with the company Better Energy to ensure a 100 percent renewable electricity consumption. As a result of the deal, Better Energy will build a new solar park and bring more new renewable electricity into the Danish grid.
- In May 2021, Teva Pharmaceuticals (a subsidiary of Teva Pharmaceutical Industries Ltd.) announced its launch of the first available generic version, in the U.S., of THIOLA® (tiopronin) tablets, indicated, in combination with high fluid intake, alkali, and diet modification, for the prevention of cystine (kidney) stone formation in adults and pediatric patients 9 years of age and older with severe homozygous cystinuria, who are not responsive to these measures alone.
市场参与者的合作、产品发布、业务扩展、奖励和认可、合资企业和其他策略正在增强公司在强迫症药物市场中的市场,这也为组织改善其强迫症药物产品的供应提供了好处。
SKU-
Get online access to the report on the World's First Market Intelligence Cloud
- Interactive Data Analysis Dashboard
- Company Analysis Dashboard for high growth potential opportunities
- Research Analyst Access for customization & queries
- Competitor Analysis with Interactive dashboard
- Latest News, Updates & Trend analysis
- Harness the Power of Benchmark Analysis for Comprehensive Competitor Tracking
目录
1 INTRODUCTION
1.1 OBJECTIVES OF THE STUDY
1.2 MARKET DEFINITION
1.3 OVERVIEW
1.4 LIMITATIONS
1.5 MARKETS COVERED
2 MARKET SEGMENTATION
2.1 MARKETS COVERED
2.2 GEOGRAPHICAL SCOPE
2.3 YEARS CONSIDERED FOR THE STUDY
2.4 CURRENCY AND PRICING
2.5 DBMR TRIPOD DATA VALIDATION MODEL
2.6 MULTIVARIATE MODELLING
2.7 SEVERITY LIFELINE CURVE
2.8 PRIMARY INTERVIEWS WITH KEY OPINION LEADERS
2.9 DBMR MARKET POSITION GRID
2.1 MARKET APPLICATION COVERAGE GRID
2.11 VENDOR SHARE ANALYSIS
2.12 SECONDARY SOURCES
2.13 ASSUMPTIONS
3 EXECUTIVE SUMMARY
4 PREMIUM INSIGHTS
4.1 PORTERS FIVE FORCES
4.2 PESTEL ANALYSIS
5 EPIDEMIOLOGY
6 NORTH AMERICA OBSESSIVE-COMPULSIVE DISORDER (OCD) DRUG MARKET: REGULATIONS
6.1 THE U.S. REGULATORY FRAMEWORK FOR OCD DRUGS
6.2 EUROPE REGULATORY FRAMEWORK FOR OCD DRUGS
6.3 AUSTRALIA REGULATORY GUIDANCE ON OCD DRUGS
7 NORTH AMERICA OBSESSIVE-COMPULSIVE DISORDER (OCD) DRUG MARKET: REIMBURSEMENT SCENARIO
8 COST ANALYSIS
9 MARKET OVERVIEW
9.1 DRIVERS
9.1.1 RISE IN CLINICAL TRIALS FOR OBSESSIVE-COMPULSIVE DISORDER (OCD)
9.1.2 INCREASING CASES OF OBSESSIVE-COMPULSIVE DISORDER (OCD) WORLDWIDE
9.1.3 INCREASING R&D INVESTMENT BY KEY MARKET PLAYERS
9.1.4 CHANGES IN LIFESTYLE AND ENVIRONMENTAL STRESS AMONG PEOPLE
9.1.5 INCREASING GENERIC APPROVALS
9.2 RESTRAINTS
9.2.1 RECALL OF DRUGS
9.2.2 ADVERSE EFFECTS OF DRUGS
9.2.3 STRINGENT GOVERNMENT REGULATIONS FOR OCD DRUGS DEVELOPMENT
9.2.4 UNAWARENESS AMONG PEOPLE OF EXISTENCE OF OCD
9.3 OPPORTUNITIES
9.3.1 TECHNOLOGICAL ADVANCEMENT FOR THE TREATMENT OF OBSESSIVE-COMPULSIVE DISORDER (OCD)
9.3.2 RISING COLLABORATIONS, AND MERGER & ACQUISITIONS AMONG THE MARKET PLAYERS
9.3.3 RISE IN QUALITY CONCERNS
9.4 CHALLENGES
9.4.1 USE OF ALTERNATIVE THERAPIES
9.4.2 LIMITATIONS OF CURRENT OCD TREATMENT
10 IMPACT OF COVID-19 ON NORTH AMERICA OBSESSIVE-COMPULSIVE DISORDER (OCD) DRUG MARKET
10.1 IMPACT ON PRICE
10.2 IMPACT ON DEMAND
10.3 IMPACT ON SUPPLY CHAIN
10.4 STRATEGIC DECISIONS FOR MANUFACTURERS
10.5 CONCLUSION
11 MARKET BY DRUGS
11.1 TOTAL ADDRESSABLE MARKET
11.2 PATIENT POPULATION (2019-2028)
12 NORTH AMERICA OBSESSIVE-COMPULSIVE DISORDER (OCD) DRUG MARKET, BY SEVERITY
12.1 OVERVIEW
12.2 MODERATE TO SEVERE
12.3 MILD TO MODERATE
13 NORTH AMERICA OBSESSIVE-COMPULSIVE DISORDER (OCD) DRUG MARKET, BY SUBTYPE
13.1 OVERVIEW
13.2 CONTAMINATION OBSESSIONS WITH WASHING/CLEANING COMPULSION
13.3 HARM OBSESSIONS WITH CHECKING COMPULSIONS
13.4 OBSESSIONS WITHOUT VISIBLE COMPULSIONS
13.5 SYMMETRY OBSESSIONS WITH ORDERING, ARRANGING, AND COUNTING COMPULSIONS
13.6 HOARDING
13.7 OTHERS
14 NORTH AMERICA OBSESSIVE-COMPULSIVE DISORDER (OCD) DRUG MARKET, BY DRUGS
14.1 OVERVIEW
14.2 ANTIDEPRESSANTS
14.2.1 SELECTIVE SEROTONIN REUPTAKE INHIBITORS
14.2.1.1 FLUVOXAMINE
14.2.1.2 FLUOXETINE
14.2.1.3 PAROXETINE
14.2.1.4 SERTRALINE
14.2.1.5 OTHERS
14.2.2 SEROTONIN-NOREPINEPHRINE REUPTAKE INHIBITORS
14.2.2.1 DULOXETINE
14.2.2.2 VENLAFAXINE
14.2.2.3 OTHERS
14.2.3 TRICYCLIC ANTIDEPRESSANTS
14.2.3.1 CLOMIPRAMINE
14.2.3.2 AMITRIPTYLINE
14.2.3.3 IMIPRAMINE
14.2.3.4 OTHERS
14.3 ANTIPSYCHOTICS
14.3.1 RISPERIDONE
14.3.2 OLANZAPINE
14.3.3 ARIPIPRAZOLE
14.3.4 QUETIAPINE
14.3.5 HALOPERIDOL
14.3.6 OTHERS
14.4 NMDA BLOCKERS
14.4.1 MEMANTINE
14.4.2 KETAMINE
14.4.3 OTHERS
14.5 OTHERS
15 NORTH AMERICA OBSESSIVE-COMPULSIVE DISORDER (OCD) DRUG MARKET, BY ROUTE OF ADMINISTRATION
15.1 OVERVIEW
15.2 ORAL
15.2.1 TABLET
15.2.2 CAPSULE
15.2.3 SOLUTION
15.3 PARENTERAL
16 NORTH AMERICA OBSESSIVE-COMPULSIVE DISORDER (OCD) DRUG MARKET, BY POPULATION
16.1 OVERVIEW
16.2 ADULTS
16.3 PEDIATRICS
17 NORTH AMERICA OBSESSIVE-COMPULSIVE DISORDER (OCD) DRUG MARKET, BY END USER
17.1 OVERVIEW
17.2 HOSPITALS
17.3 SPECIALTY CLINICS
17.4 HOME HEALTHCARE
17.5 OTHERS
18 NORTH AMERICA OBSESSIVE-COMPULSIVE DISORDER (OCD) DRUG MARKET, BY DISTRIBUTION CHANNEL
18.1 OVERVIEW
18.2 HOSPITAL PHARMACY
18.3 RETAIL PHARMACY
18.4 ONLINE PHARMACY
18.5 OTHERS
19 NORTH AMERICA OBSESSIVE-COMPULSIVE DISORDER (OCD) DRUG MARKET, BY REGION
19.1 NORTH AMERICA
19.1.1 U.S.
19.1.2 CANADA
19.1.3 MEXICO
20 NORTH AMERICA OBSESSIVE-COMPULSIVE DISORDER (OCD) DRUG MARKET: COMPANY LANDSCAPE
20.1 COMPANY SHARE ANALYSIS: NORTH AMERICA
21 SWOT ANALYSIS
22 COMPANY PROFILE
22.1 SUN PHARMACEUTICAL INDUSTRIES LTD.
22.1.1 COMPANY SNAPSHOT
22.1.2 REVENUE ANALYSIS
22.1.3 COMPANY SHARE ANALYSIS
22.1.4 PRODUCT PORTFOLIO
22.1.5 RECENT DEVELOPMENTS
22.2 H. LUNDBECK A/S
22.2.1 COMPANY SNAPSHOT
22.2.2 REVENUE ANALYSIS
22.2.3 COMPANY SHARE ANALYSIS
22.2.4 PRODUCT PORTFOLIO
22.2.5 RECENT DEVELOPMENTS
22.3 TEVA PHARMACEUTICALS USA, INC. (A SUBSIDIARY OF TEVA PHARMACEUTICAL INDUSTRIES LTD.)
22.3.1 COMPANY SNAPSHOT
22.3.2 REVENUE ANALYSIS
22.3.3 COMPANY SHARE ANALYSIS
22.3.4 PRODUCT PORTFOLIO
22.3.5 RECENT DEVELOPMENTS
22.4 ELI LILLY AND COMPANY
22.4.1 COMPANY SNAPSHOT
22.4.2 REVENUE ANALYSIS
22.4.3 COMPANY SHARE ANALYSIS
22.4.4 PRODUCT PORTFOLIO
22.4.5 RECENT DEVELOPMENTS
22.5 APOTEX INC.
22.5.1 COMPANY SNAPSHOT
22.5.2 COMPANY SHARE ANALYSIS
22.5.3 PRODUCT PORTFOLIO
22.5.4 RECENT DEVELOPMENTS
22.6 VIATRIS INC.
22.6.1 COMPANY SNAPSHOT
22.6.2 REVENUE ANALYSIS
22.6.3 PRODUCT PORTFOLIO
22.6.4 RECENT DEVELOPMENTS
22.7 LANNETT
22.7.1 COMPANY SNAPSHOT
22.7.2 REVENUE ANALYSIS
22.7.3 PRODUCT PORTFOLIO
22.7.4 RECENT DEVELOPMENTS
22.8 GLAXOSMITHKLINE PLC
22.8.1 COMPANY SNAPSHOT
22.8.2 REVENUE ANALYSIS
22.8.3 PRODUCT PORTFOLIO
22.8.4 RECENT DEVELOPMENT
22.9 ALVOGEN
22.9.1 COMPANY SNAPSHOT
22.9.2 PRODUCT PORTFOLIO
22.9.3 RECENT DEVELOPMENTS
22.1 PFIZER INC.
22.10.1 COMPANY SNAPSHOT
22.10.2 REVENUE ANALYSIS
22.10.3 PRODUCT PORTFOLIO
22.10.4 RECENT DEVELOPMENTS
22.11 AMNEAL PHARMACEUTICALS LLC
22.11.1 COMPANY SNAPSHOT
22.11.2 REVENUE ANALYSIS
22.11.3 PRODUCT PORTFOLIO
22.11.4 RECENT DEVELOPMENTS
22.12 DR.REDDY’S LABORATORIES LTD.
22.12.1 COMPANY SNAPSHOT
22.12.2 REVENUE ANALYSIS
22.12.3 PRODUCT PORTFOLIO
22.12.4 RECENT DEVELOPMENTS
22.13 AUROBINDO PHARMA USA (A SUBSIDIARY OF AUROBINDO PHARMA)
22.13.1 COMPANY SNAPSHOT
22.13.2 REVENUE ANALYSIS
22.13.3 PRODUCT PORTFOLIO
22.13.4 RECENT DEVELOPMENTS
22.14 ABBOTT
22.14.1 COMPANY SNAPSHOT
22.14.2 REVENUE ANALYSIS
22.14.3 PRODUCT PORTFOLIO
22.14.4 RECENT DEVELOPMENTS
22.15 LUPIN PHARMACEUTICALS, INC.
22.15.1 COMPANY SNAPSHOT
22.15.2 REVENUE ANALYSIS
22.15.3 PRODUCT PORTFOLIO
22.15.4 RECENT DEVELOPMENTS
22.16 MALLINCKRODT
22.16.1 COMPANY SNAPSHOT
22.16.2 REVENUE ANALYSIS
22.16.3 PRODUCT PORTFOLIO
22.16.4 RECENT DEVELOPMENTS
22.17 PAR PHARMACEUTICAL
22.17.1 COMPANY SNAPSHOT
22.17.2 REVENUE ANALYSIS
22.17.3 PRODUCT PORTFOLIO
22.17.4 RECENT DEVELOPMENTS
22.18 SEBELA PHARMACEUTICALS
22.18.1 COMPANY SNAPSHOT
22.18.2 PRODUCT PORTFOLIO
22.18.3 RECENT DEVELOPMENT
22.19 ZYDUS PHARMACEUTICALS USA INC. (A SUBSIDIARY OF ZYDUS CADILA)
22.19.1 COMPANY SNAPSHOT
22.19.2 REVENUE ANALYSIS
22.19.3 PRODUCT PORTFOLIO
22.19.4 RECENT DEVELOPMENTS
22.2 WOCKHARDT
22.20.1 COMPANY SNAPSHOT
22.20.2 REVENUE ANALYSIS
22.20.3 PRODUCT PORTFOLIO
22.20.4 RECENT DEVELOPMENTS
23 QUESTIONNAIRE
24 RELATED REPORTS
表格列表
LIST OF TABLES
TABLE 1 BELOW MENTIONED ARE THE COST OF OCD DRUGS, AVAILABLE IN DIFFERENT DOSAGE FORMS SUCH AS A TABLET, CAPSULE, PARENTAL, AND STRENGTHS USED NORTH AMERICALY TO TREAT OBSESSIVE-COMPULSIVE DISORDER.
TABLE 2 DRUGS UNDER INVESTIGATIONS FOR OCD
TABLE 3 R&D COST BY KEY MARKET PLAYERS (USD MILLIONS) (2020)
TABLE 4 NORTH AMERICA OBSESSIVE-COMPULSIVE DISORDER (OCD) DRUG MARKET, BY SEVERITY, 2019-2028 (USD MILLION)
TABLE 5 NORTH AMERICA MODERATE TO SEVERE IN OBSESSIVE-COMPULSIVE DISORDER (OCD) DRUG MARKET, BY REGION, 2019-2028 (USD MILLION)
TABLE 6 NORTH AMERICA MILD TO MODERATE IN OBSESSIVE-COMPULSIVE DISORDER (OCD) DRUG MARKET, BY REGION, 2019-2028 (USD MILLION)
TABLE 7 NORTH AMERICA OBSESSIVE-COMPULSIVE DISORDER (OCD) DRUG MARKET, BY SUB TYPE 2019-2028 (USD MILLION)
TABLE 8 NORTH AMERICA CONTAMINATION OBSESSIONS WITH WASHING/CLEANING COMPULSION IN OBSESSIVE-COMPULSIVE DISORDER (OCD) DRUG MARKET, BY REGION, 2019-2028 (USD MILLION)
TABLE 9 NORTH AMERICA HARM OBSESSIONS WITH CHECKING COMPULSIONS IN OBSESSIVE-COMPULSIVE DISORDER (OCD) DRUG MARKET, BY REGION, 2019-2028 (USD MILLION)
TABLE 10 NORTH AMERICA OBSESSIONS WITHOUT VISIBLE COMPULSIONS IN OBSESSIVE-COMPULSIVE DISORDER (OCD) DRUG MARKET, BY REGION, 2019-2028 (USD MILLION)
TABLE 11 NORTH AMERICA SYMMETRY OBSESSIONS WITH ORDERING, ARRANGING, AND COUNTING COMPULSIONS IN OBSESSIVE-COMPULSIVE DISORDER (OCD) DRUG MARKET, BY REGION, 2019-2028 (USD MILLION)
TABLE 12 NORTH AMERICA HOARDING IN OBSESSIVE-COMPULSIVE DISORDER (OCD) DRUG MARKET, BY REGION, 2019-2028 (USD MILLION)
TABLE 13 NORTH AMERICA OTHERS IN OBSESSIVE-COMPULSIVE DISORDER (OCD) DRUG MARKET, BY REGION, 2019-2028 (USD MILLION)
TABLE 14 NORTH AMERICA OBSESSIVE-COMPULSIVE DISORDER (OCD) DRUG MARKET, BY DRUGS, 2019-2028 (USD MILLION)
TABLE 15 NORTH AMERICA ANTIDEPRESSANTS IN OBSESSIVE-COMPULSIVE DISORDER (OCD) DRUG MARKET, BY REGION, 2019-2028 (USD MILLION)
TABLE 16 NORTH AMERICA ANTIDEPRESSANTS IN OBSESSIVE-COMPULSIVE DISORDER (OCD) DRUG MARKET, BY DRUGS, 2019-2028 (USD MILLION)
TABLE 17 NORTH AMERICA SELECTIVE SEROTONIN REUPTAKE INHIBITORS IN OBSESSIVE-COMPULSIVE DISORDER (OCD) DRUG MARKET, BY DRUGS, 2019-2028 (USD MILLION)
TABLE 18 NORTH AMERICA SEROTONIN-NOREPINEPHRINE REUPTAKE INHIBITORS IN OBSESSIVE-COMPULSIVE DISORDER (OCD) DRUG MARKET, BY DRUGS, 2019-2028 (USD MILLION)
TABLE 19 NORTH AMERICA TRICYCLIC ANTIDEPRESSANTS IN OBSESSIVE-COMPULSIVE DISORDER (OCD) DRUG MARKET, BY DRUGS, 2019-2028 (USD MILLION)
TABLE 20 NORTH AMERICA ANTIPSYCHOTICS IN OBSESSIVE-COMPULSIVE DISORDER (OCD) DRUG MARKET, BY REGION, 2019-2028 (USD MILLION)
TABLE 21 NORTH AMERICA ANTIPSYCHOTICS IN OBSESSIVE-COMPULSIVE DISORDER (OCD) DRUG MARKET, BY DRUGS, 2019-2028 (USD MILLION)
TABLE 22 NORTH AMERICA NMDA BLOCKERS IN OBSESSIVE-COMPULSIVE DISORDER (OCD) DRUG MARKET, BY REGION, 2019-2028 (USD MILLION)
TABLE 23 NORTH AMERICA NMDA BLOCKERS IN OBSESSIVE-COMPULSIVE DISORDER (OCD) DRUG MARKET, BY DRUGS, 2019-2028 (USD MILLION)
TABLE 24 NORTH AMERICA OTHERS IN OBSESSIVE-COMPULSIVE DISORDER (OCD) DRUG MARKET, BY REGION, 2019-2028 (USD MILLION)
TABLE 25 NORTH AMERICA OBSESSIVE-COMPULSIVE DISORDER (OCD) DRUG MARKET, BY ROUTE OF ADMINISTRATION, 2019-2028 (USD MILLION)
TABLE 26 NORTH AMERICA ORAL IN OBSESSIVE-COMPULSIVE DISORDER (OCD) DRUG MARKET, BY REGION, 2019-2028 (USD MILLION)
TABLE 27 NORTH AMERICA ORAL IN OBSESSIVE-COMPULSIVE DISORDER (OCD) DRUG MARKET, BY ROUTE OF ADMINISTRATION, 2019-2028 (USD MILLION)
TABLE 28 NORTH AMERICA PARENTERAL IN OBSESSIVE-COMPULSIVE DISORDER (OCD) DRUG MARKET, BY REGION, 2019-2028 (USD MILLION)
TABLE 29 NORTH AMERICA OBSESSIVE-COMPULSIVE DISORDER (OCD) DRUG MARKET, BY POPULATION, 2019-2028 (USD MILLION)
TABLE 30 NORTH AMERICA ADULTS IN OBSESSIVE-COMPULSIVE DISORDER (OCD) DRUG MARKET, BY REGION 2019-2028 (USD MILLION)
TABLE 31 NORTH AMERICA PEDIATRICS IN OBSESSIVE-COMPULSIVE DISORDER (OCD) DRUG MARKET, BY REGION, 2019-2028 (USD MILLION)
TABLE 32 NORTH AMERICA OBSESSIVE-COMPULSIVE DISORDER (OCD) DRUG MARKET, BY END USER, 2019-2028 (USD MILLION)
TABLE 33 NORTH AMERICA HOSPITALS IN OBSESSIVE-COMPULSIVE DISORDER (OCD) DRUG MARKET, BY REGION, 2019-2028 (USD MILLION)
TABLE 34 NORTH AMERICA SPECIALTY CLINICS IN OBSESSIVE-COMPULSIVE (OCD) DRUG MARKET, BY REGION, 2019-2028 (USD MILLION)
TABLE 35 NORTH AMERICA HOME HEALTHCARE IN OBSESSIVE-COMPULSIVE DISORDER (OCD) DRUG MARKET, BY REGION, 2019-2028 (USD MILLION)
TABLE 36 NORTH AMERICA OTHERS IN OBSESSIVE-COMPULSIVE DISORDER (OCD) DRUG MARKET, BY REGION, 2019-2028 (USD MILLION)
TABLE 37 NORTH AMERICA OBSESSIVE-COMPULSIVE DISORDER (OCD) DRUG MARKET, BY DISTRIBUTION CHANNEL 2019-2028 (USD MILLION)
TABLE 38 NORTH AMERICA HOSPITAL PHARMACY IN OBSESSIVE-COMPULSIVE DISORDER (OCD) DRUG MARKET, BY REGION, 2019-2028 (USD MILLION)
TABLE 39 NORTH AMERICA RETAIL PHARMACY IN OBSESSIVE-COMPULSIVE DISORDER (OCD) DRUG MARKET, BY REGION, 2019-2028 (USD MILLION)
TABLE 40 NORTH AMERICA ONLINE PHARMACY IN OBSESSIVE-COMPULSIVE DISORDER (OCD) DRUG MARKET, BY REGION, 2019-2028 (USD MILLION)
TABLE 41 NORTH AMERICA OTHERS IN OBSESSIVE-COMPULSIVE DISORDER (OCD) DRUG MARKET, BY REGION, 2019-2028 (USD MILLION)
TABLE 42 NORTH AMERICA OBSESSIVE-COMPULSIVE DISORDER (OCD) DRUG MARKET, BY COUNTRY, 2019-2028 (USD MILLION)
TABLE 43 NORTH AMERICA OBSESSIVE-COMPULSIVE DISORDER (OCD) DRUG MARKET, BY SEVERITY, 2019-2028 (USD MILLION)
TABLE 44 NORTH AMERICA OBSESSIVE-COMPULSIVE DISORDER (OCD) DRUG MARKET, BY SUBTYPE, 2019-2028 (USD MILLION)
TABLE 45 NORTH AMERICA OBSESSIVE-COMPULSIVE DISORDER (OCD) DRUG MARKET, BY DRUGS, 2019-2028 (USD MILLION)
TABLE 46 NORTH AMERICA ANTIDEPRESSANTS IN OBSESSIVE-COMPULSIVE DISORDER (OCD) DRUG MARKET, BY DRUGS, 2019-2028 (USD MILLION)
TABLE 47 NORTH AMERICA SELECTIVE SEROTONIN REUPTAKE INHIBITORS IN OBSESSIVE-COMPULSIVE DISORDER (OCD) DRUG MARKET, BY DRUGS, 2019-2028 (USD MILLION)
TABLE 48 NORTH AMERICA SEROTONIN-NOREPINEPHRINE REUPTAKE INHIBITORS IN OBSESSIVE-COMPULSIVE DISORDER (OCD) DRUG MARKET, BY DRUGS, 2019-2028 (USD MILLION)
TABLE 49 NORTH AMERICA TRICYCLIC ANTIDEPRESSANTS IN OBSESSIVE-COMPULSIVE DISORDER (OCD) DRUG MARKET, BY DRUGS, 2019-2028 (USD MILLION)
TABLE 50 NORTH AMERICA ANTIPSYCHOTICS IN OBSESSIVE-COMPULSIVE DISORDER (OCD) DRUG MARKET, BY DRUGS, 2019-2028 (USD MILLION)
TABLE 51 NORTH AMERICA NMDA BLOCKERS IN OBSESSIVE-COMPULSIVE DISORDER (OCD) DRUG MARKET, BY DRUGS, 2019-2028 (USD MILLION)
TABLE 52 NORTH AMERICA OBSESSIVE-COMPULSIVE DISORDER (OCD) DRUG MARKET, BY ROUTE OF ADMINISTRATION, 2019-2028 (USD MILLION)
TABLE 53 NORTH AMERICA ORAL IN OBSESSIVE-COMPULSIVE DISORDER (OCD) DRUG MARKET, BY ROUTE OF ADMINISTRATION, 2019-2028 (USD MILLION)
TABLE 54 NORTH AMERICA OBSESSIVE-COMPULSIVE DISORDER (OCD) DRUG MARKET, BY POPULATION TYPE, 2019-2028 (USD MILLION)
TABLE 55 NORTH AMERICA OBSESSIVE-COMPULSIVE DISORDER (OCD) DRUG MARKET, BY END USER, 2019-2028 (USD MILLION)
TABLE 56 NORTH AMERICA OBSESSIVE-COMPULSIVE DISORDER (OCD) DRUG MARKET, BY DISTRIBUTION CHANNEL, 2019-2028 (USD MILLION)
TABLE 57 U.S. OBSESSIVE-COMPULSIVE DISORDER (OCD) DRUG MARKET, BY SEVERITY, 2019-2028 (USD MILLION)
TABLE 58 U.S. OBSESSIVE-COMPULSIVE DISORDER (OCD) DRUG MARKET, BY SUBTYPE, 2019-2028 (USD MILLION)
TABLE 59 U.S. OBSESSIVE-COMPULSIVE DISORDER (OCD) DRUG MARKET, BY DRUGS, 2019-2028 (USD MILLION)
TABLE 60 U.S. ANTIDEPRESSANTS IN OBSESSIVE-COMPULSIVE DISORDER (OCD) DRUG MARKET, BY DRUGS, 2019-2028 (USD MILLION)
TABLE 61 U.S. SELECTIVE SEROTONIN REUPTAKE INHIBITORS IN OBSESSIVE-COMPULSIVE DISORDER (OCD) DRUG MARKET, BY DRUGS, 2019-2028 (USD MILLION)
TABLE 62 U.S. SEROTONIN-NOREPINEPHRINE REUPTAKE INHIBITORS IN OBSESSIVE-COMPULSIVE DISORDER (OCD) DRUG MARKET, BY DRUGS, 2019-2028 (USD MILLION)
TABLE 63 U.S. TRICYCLIC ANTIDEPRESSANTS IN OBSESSIVE-COMPULSIVE DISORDER (OCD) DRUG MARKET, BY DRUGS, 2019-2028 (USD MILLION)
TABLE 64 U.S. ANTIPSYCHOTICS IN OBSESSIVE-COMPULSIVE DISORDER (OCD) DRUG MARKET, BY DRUGS, 2019-2028 (USD MILLION)
TABLE 65 U.S. NMDA BLOCKERS IN OBSESSIVE-COMPULSIVE DISORDER (OCD) DRUG MARKET, BY DRUGS, 2019-2028 (USD MILLION)
TABLE 66 U.S. OBSESSIVE-COMPULSIVE DISORDER (OCD) DRUG MARKET, BY ROUTE OF ADMINISTRATION, 2019-2028 (USD MILLION)
TABLE 67 U.S. ORAL IN OBSESSIVE-COMPULSIVE DISORDER (OCD) DRUG MARKET, BY ROUTE OF ADMINISTRATION, 2019-2028 (USD MILLION)
TABLE 68 U.S. OBSESSIVE-COMPULSIVE DISORDER (OCD) DRUG MARKET, BY POPULATION TYPE, 2019-2028 (USD MILLION)
TABLE 69 U.S. OBSESSIVE-COMPULSIVE DISORDER (OCD) DRUG MARKET, BY END USER, 2019-2028 (USD MILLION)
TABLE 70 U.S. OBSESSIVE-COMPULSIVE DISORDER (OCD) DRUG MARKET, BY DISTRIBUTION CHANNEL, 2019-2028 (USD MILLION)
TABLE 71 CANADA OBSESSIVE-COMPULSIVE DISORDER (OCD) DRUG MARKET, BY SEVERITY, 2019-2028 (USD MILLION)
TABLE 72 CANADA OBSESSIVE-COMPULSIVE DISORDER (OCD) DRUG MARKET, BY SUBTYPE, 2019-2028 (USD MILLION)
TABLE 73 CANADA OBSESSIVE-COMPULSIVE DISORDER (OCD) DRUG MARKET, BY DRUGS, 2019-2028 (USD MILLION)
TABLE 74 CANADA ANTIDEPRESSANTS IN OBSESSIVE-COMPULSIVE DISORDER (OCD) DRUG MARKET, BY DRUGS, 2019-2028 (USD MILLION)
TABLE 75 CANADA SELECTIVE SEROTONIN REUPTAKE INHIBITORS IN OBSESSIVE-COMPULSIVE DISORDER (OCD) DRUG MARKET, BY DRUGS, 2019-2028 (USD MILLION)
TABLE 76 CANADA SEROTONIN-NOREPINEPHRINE REUPTAKE INHIBITORS IN OBSESSIVE-COMPULSIVE DISORDER (OCD) DRUG MARKET, BY DRUGS, 2019-2028 (USD MILLION)
TABLE 77 CANADA TRICYCLIC ANTIDEPRESSANTS IN OBSESSIVE-COMPULSIVE DISORDER (OCD) DRUG MARKET, BY DRUGS, 2019-2028 (USD MILLION)
TABLE 78 CANADA ANTIPSYCHOTICS IN OBSESSIVE-COMPULSIVE DISORDER (OCD) DRUG MARKET, BY DRUGS, 2019-2028 (USD MILLION)
TABLE 79 CANADA NMDA BLOCKERS IN OBSESSIVE-COMPULSIVE DISORDER (OCD) DRUG MARKET, BY DRUGS, 2019-2028 (USD MILLION)
TABLE 80 CANADA OBSESSIVE-COMPULSIVE DISORDER (OCD) DRUG MARKET, BY ROUTE OF ADMINISTRATION, 2019-2028 (USD MILLION)
TABLE 81 CANADA ORAL IN OBSESSIVE-COMPULSIVE DISORDER (OCD) DRUG MARKET, BY ROUTE OF ADMINISTRATION, 2019-2028 (USD MILLION)
TABLE 82 CANADA OBSESSIVE-COMPULSIVE DISORDER (OCD) DRUG MARKET, BY POPULATION TYPE, 2019-2028 (USD MILLION)
TABLE 83 CANADA OBSESSIVE-COMPULSIVE DISORDER (OCD) DRUG MARKET, BY END USER, 2019-2028 (USD MILLION)
TABLE 84 CANADA OBSESSIVE-COMPULSIVE DISORDER (OCD) DRUG MARKET, BY DISTRIBUTION CHANNEL, 2019-2028 (USD MILLION)
TABLE 85 MEXICO OBSESSIVE-COMPULSIVE DISORDER (OCD) DRUG MARKET, BY SEVERITY, 2019-2028 (USD MILLION)
TABLE 86 MEXICO OBSESSIVE-COMPULSIVE DISORDER (OCD) DRUG MARKET, BY SUBTYPE, 2019-2028 (USD MILLION)
TABLE 87 MEXICO OBSESSIVE-COMPULSIVE DISORDER (OCD) DRUG MARKET, BY DRUGS, 2019-2028 (USD MILLION)
TABLE 88 MEXICO ANTIDEPRESSANTS IN OBSESSIVE-COMPULSIVE DISORDER (OCD) DRUG MARKET, BY DRUGS, 2019-2028 (USD MILLION)
TABLE 89 MEXICO SELECTIVE SEROTONIN REUPTAKE INHIBITORS IN OBSESSIVE-COMPULSIVE DISORDER (OCD) DRUG MARKET, BY DRUGS, 2019-2028 (USD MILLION)
TABLE 90 MEXICO SEROTONIN-NOREPINEPHRINE REUPTAKE INHIBITORS IN OBSESSIVE-COMPULSIVE DISORDER (OCD) DRUG MARKET, BY DRUGS, 2019-2028 (USD MILLION)
TABLE 91 MEXICO TRICYCLIC ANTIDEPRESSANTS IN OBSESSIVE-COMPULSIVE DISORDER (OCD) DRUG MARKET, BY DRUGS, 2019-2028 (USD MILLION)
TABLE 92 MEXICO ANTIPSYCHOTICS IN OBSESSIVE-COMPULSIVE DISORDER (OCD) DRUG MARKET, BY DRUGS, 2019-2028 (USD MILLION)
TABLE 93 MEXICO NMDA BLOCKERS IN OBSESSIVE-COMPULSIVE DISORDER (OCD) DRUG MARKET, BY DRUGS, 2019-2028 (USD MILLION)
TABLE 94 MEXICO OBSESSIVE-COMPULSIVE DISORDER (OCD) DRUG MARKET, BY ROUTE OF ADMINISTRATION, 2019-2028 (USD MILLION)
TABLE 95 MEXICO ORAL IN OBSESSIVE-COMPULSIVE DISORDER (OCD) DRUG MARKET, BY ROUTE OF ADMINISTRATION, 2019-2028 (USD MILLION)
TABLE 96 MEXICO OBSESSIVE-COMPULSIVE DISORDER (OCD) DRUG MARKET, BY POPULATION TYPE, 2019-2028 (USD MILLION)
TABLE 97 MEXICO OBSESSIVE-COMPULSIVE DISORDER (OCD) DRUG MARKET, BY END USER, 2019-2028 (USD MILLION)
TABLE 98 MEXICO OBSESSIVE-COMPULSIVE DISORDER (OCD) DRUG MARKET, BY DISTRIBUTION CHANNEL, 2019-2028 (USD MILLION)
图片列表
LIST OF FIGURES
FIGURE 1 NORTH AMERICA OBSESSIVE-COMPULSIVE DISORDER (OCD) DRUG MARKET SEGMENTATION
FIGURE 2 NORTH AMERICA OBSESSIVE-COMPULSIVE DISORDER (OCD) DRUG MARKET DATA TRIANGULATION
FIGURE 3 NORTH AMERICA OBSESSIVE-COMPULSIVE DISORDER (OCD) DRUG MARKET DROC ANALYSIS
FIGURE 4 NORTH AMERICA OBSESSIVE-COMPULSIVE DISORDER (OCD) DRUG MARKET : NORTH AMERICA VS REGIONAL MARKET ANALYSIS
FIGURE 5 NORTH AMERICA OBSESSIVE-COMPULSIVE DISORDER (OCD) DRUG MARKET: COMPANY RESEARCH ANALYSIS
FIGURE 6 NORTH AMERICA OBSESSIVE-COMPULSIVE DISORDER (OCD) DRUG MARKET INTERVIEW DEMOGRAPHICS
FIGURE 7 NORTH AMERICA OBSESSIVE-COMPULSIVE DISORDER (OCD) DRUG MARKET DBMR MARKET POSITION GRID
FIGURE 8 NORTH AMERICA OBSESSIVE-COMPULSIVE DISORDER (OCD) DRUG MARKET MARKET APPLICATION COVERAGE GRID
FIGURE 9 NORTH AMERICA OBSESSIVE-COMPULSIVE DISORDER (OCD) DRUG MARKET VENDOR SHARE ANALYSIS
FIGURE 10 NORTH AMERICA OBSESSIVE-COMPULSIVE DISORDER (OCD) DRUG MARKET SEGMENTATION
FIGURE 11 RISE IN CLINICAL TRIALS FOR OBSESSIVE-COMPULSIVE DISORDER AND INCREASING R&D INVESTMENT BY KEY MARKET PLAYERS ARE EXPECTED TO DRIVE THE NORTH AMERICA OBSESSIVE-COMPULSIVE DISORDER (OCD) DRUG MARKET IN THE FORECAST PERIOD OF 2021 TO 2028
FIGURE 12 SEVERITY SEGMENT IS EXPECTED TO ACCOUNT FOR THE LARGEST SHARE OF THE NORTH AMERICA OBSESSIVE-COMPULSIVE DISORDER DRUG MARKET IN 2021 & 2028
FIGURE 13 DRIVERS, RESTRAINTS, OPPORTUNITIES ABD CHALLENGES OF NORTH AMERICA OBSESSIVE-COMPULSIVE DISORDER (OCD) DRUG MARKET
FIGURE 14 NORTH AMERICA OBSESSIVE-COMPULSIVE DISORDER (OCD) DRUG MARKET: BY SEVERITY, 2020
FIGURE 15 NORTH AMERICA OBSESSIVE-COMPULSIVE DISORDER (OCD) DRUG MARKET: BY SEVERITY, 2020-2028 (USD MILLION)
FIGURE 16 NORTH AMERICA OBSESSIVE-COMPULSIVE DISORDER (OCD) DRUG MARKET: BY SEVERITY, CAGR (2021-2028)
FIGURE 17 NORTH AMERICA OBSESSIVE-COMPULSIVE DIOSRDER (OCD) DRUG MARKET: BY SEVERITY, LIFELINE CURVE
FIGURE 18 NORTH AMERICA OBSESSIVE-COMPULSIVE DISORDER (OCD) DRUG MARKET: BY SUBTYPE, 2020
FIGURE 19 NORTH AMERICA OBSESSIVE-COMPULSIVE DISORDER (OCD) DRUG MARKET: BY SUBTYPE, 2020-2028 (USD MILLION)
FIGURE 20 NORTH AMERICA OBSESSIVE-COMPULSIVE DISORDER (OCD) DRUG MARKET: BY SUBTYPE, CAGR (2020-2028)
FIGURE 21 NORTH AMERICA OBSESSIVE-COMPULSIVE DISORDER (OCD) DRUG MARKET: BY SUBTYPE, LIFELINE CURVE
FIGURE 22 NORTH AMERICA OBSESSIVE-COMPULSIVE DISORDER (OCD) DRUG MARKET: BY DRUGS, 2020
FIGURE 23 NORTH AMERICA OBSESSIVE-COMPULSIVE DISORDER (OCD) DRUG MARKET: BY DRUGS, 2020-2028 (USD MILLION)
FIGURE 24 NORTH AMERICA OBSESSIVE-COMPULSIVE DISORDER (OCD) DRUG MARKET: BY DRUGS, CAGR (2020-2028)
FIGURE 25 NORTH AMERICA OBSESSIVE-COMPULSIVE DISORDER (OCD) DRUG MARKET: BY DRUGS, LIFELINE CURVE
FIGURE 26 NORTH AMERICA OBSESSIVE-COMPULSIVE DISORDER (OCD) DRUG MARKET: BY ROUTE OF ADMINISTRATION, 2020
FIGURE 27 NORTH AMERICA OBSESSIVE-COMPULSIVE DISORDER (OCD) DRUG MARKET: BY ROUTE OF ADMINISTRATION, 2020-2028 (USD MILLION)
FIGURE 28 NORTH AMERICA OBSESSIVE-COMPULSIVE DISORDER (OCD) DRUG MARKET: BY ROUTE OF ADMINISTRATION, CAGR (2020-2028)
FIGURE 29 NORTH AMERICA OBSESSIVE-COMPULSIVE DISORDER (OCD) DRUG MARKET: BY ROUTE OF ADMINISTRATION, LIFELINE CURVE
FIGURE 30 NORTH AMERICA OBSESSIVE-COMPULSIVE DISORDER (OCD) DRUG MARKET: BY POPULATION, 2020
FIGURE 31 NORTH AMERICA OBSESSIVE-COMPULSIVE DISORDER (OCD) DRUG MARKET: BY POPULATION, 2020-2028 (USD MILLION)
FIGURE 32 NORTH AMERICA OBSESSIVE-COMPULSIVE DISORDER (OCD) DRUG MARKET: BY POPULATION, CAGR (2021-2028)
FIGURE 33 NORTH AMERICA OBSESSIVE-COMPULSIVE DISORDER (OCD) DRUG MARKET: BY, LIFELINE CURVE
FIGURE 34 NORTH AMERICA OBSESSIVE-COMPULSIVE DISORDER (OCD) DRUG MARKET: BY END USER, 2020
FIGURE 35 NORTH AMERICA OBSESSIVE-COMPULSIVE DISORDER (OCD) DRUG MARKET: BY END USER, 2020-2028 (USD MILLION)
FIGURE 36 NORTH AMERICA OBSESSIVE-COMPULSIVE DISORDER (OCD) DRUG MARKET: BY END USER, CAGR (2021-2028)
FIGURE 37 NORTH AMERICA OBSESSIVE-COMPULSIVE DISORDER (OCD) DRUG MARKET: BY END USER, LIFELINE CURVE
FIGURE 38 NORTH AMERICA OBSESSIVE-COMPULSIVE DISORDER (OCD) DRUG MARKET: BY DISTRIBUTION CHANNEL, 2020
FIGURE 39 NORTH AMERICA OBSESSIVE-COMPULSIVE DISORDER (OCD) DRUG MARKET: BY DISTRIBUTION CHANNEL, 2020-2028 (USD MILLION)
FIGURE 40 NORTH AMERICA OBSESSIVE-COMPULSIVE DISORDER (OCD) DRUG MARKET: BY DISTRIBUTION CHANNEL, CAGR (2021-2028)
FIGURE 41 NORTH AMERICA OBSESSIVE-COMPULSIVE DISORDER (OCD) DRUG MARKET: BY DISTRIBUTION CHANNEL, LIFELINE CURVE
FIGURE 42 NORTH AMERICA OBSESSIVE-COMPULSIVE DISORDER (OCD) DRUG MARKET: SNAPSHOT (2020)
FIGURE 43 NORTH AMERICA OBSESSIVE-COMPULSIVE DISORDER (OCD) DRUG MARKET: BY COUNTRY (2020)
FIGURE 44 NORTH AMERICA OBSESSIVE-COMPULSIVE DISORDER (OCD) DRUG MARKET: BY COUNTRY (2021 & 2028)
FIGURE 45 NORTH AMERICA OBSESSIVE-COMPULSIVE DISORDER (OCD) DRUG MARKET: BY COUNTRY (2020 & 2028)
FIGURE 46 NORTH AMERICA OBSESSIVE-COMPULSIVE DISORDER (OCD) DRUG MARKET: BY SEVERITY (2021 & 2028)
FIGURE 47 NORTH AMERICA OBSESSIVE-COMPULSIVE DISORDER (OCD) DRUG MARKET: COMPANY SHARE 2020 (%)
研究方法
Data collection and base year analysis are done using data collection modules with large sample sizes. The stage includes obtaining market information or related data through various sources and strategies. It includes examining and planning all the data acquired from the past in advance. It likewise envelops the examination of information inconsistencies seen across different information sources. The market data is analysed and estimated using market statistical and coherent models. Also, market share analysis and key trend analysis are the major success factors in the market report. To know more, please request an analyst call or drop down your inquiry.
The key research methodology used by DBMR research team is data triangulation which involves data mining, analysis of the impact of data variables on the market and primary (industry expert) validation. Data models include Vendor Positioning Grid, Market Time Line Analysis, Market Overview and Guide, Company Positioning Grid, Patent Analysis, Pricing Analysis, Company Market Share Analysis, Standards of Measurement, Global versus Regional and Vendor Share Analysis. To know more about the research methodology, drop in an inquiry to speak to our industry experts.
可定制
Data Bridge Market Research is a leader in advanced formative research. We take pride in servicing our existing and new customers with data and analysis that match and suits their goal. The report can be customized to include price trend analysis of target brands understanding the market for additional countries (ask for the list of countries), clinical trial results data, literature review, refurbished market and product base analysis. Market analysis of target competitors can be analyzed from technology-based analysis to market portfolio strategies. We can add as many competitors that you require data about in the format and data style you are looking for. Our team of analysts can also provide you data in crude raw excel files pivot tables (Fact book) or can assist you in creating presentations from the data sets available in the report.