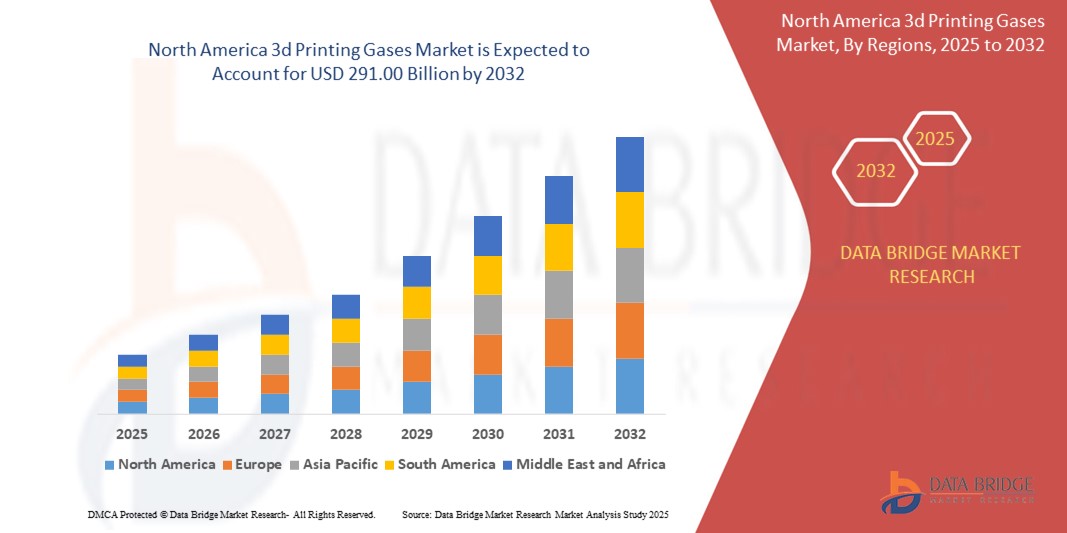
北美 3D 打印气体市场 – 行业趋势和 2031 年预测

请求目录 请求目录 与分析师交谈 与分析师交谈 立即购买 立即购买 购买前请咨询 提前咨询 免费样本报告 免费样本报告

北美 3D 打印气体市场 – 行业趋势和 2031 年预测

  • Chemical and Materials
  • Upcoming Report
  • Mar 2024
  • North America
  • 350 页面
  • 桌子數: 220
  • 图号: 60

>北美 3D 打印气体市场,按类型(氩气、氮气、氢气、氦气和其他)、技术(立体光刻 (SLA)、选择性激光烧结 (SLS)、熔融沉积成型 (FDM)、数字光处理 (DLP)、多喷射熔融 (MJF)、Polyjet、直接金属激光烧结 (DMLS)、电子束熔化 (EBM)、Poly-Jet 和其他)、材料(塑料、金属、铝化物、木材和其他)、存储和分配(气瓶、商用液体和吨位)、功能(绝缘、照明、冷却和其他)、最终用户(工业、汽车、航空航天、消费品、医疗、建筑和施工、珠宝、食品、玩具、视觉艺术、机器人和其他) - 行业趋势和预测到 2031 年。

北美 3D 打印气体市场

北美 3D 打印气体市场分析和规模

3D 打印气体市场用于航空航天工业,其中特种气体用于增材制造工艺,为飞机制造复杂而轻巧的部件。这些气体(如氩气和氮气)有助于优化打印环境,确保精确控制温度并降低最终 3D 打印航空航天部件出现缺陷的风险。使用 3D 打印气体可提高北美航空航天制造工艺的效率和质量。

Data Bridge Market Research 分析了北美 3D 打印气体市场,该市场在 2023 年为 225 亿美元,预计到 2031 年将达到 2189.7 亿美元,在 2024-2031 年的预测期内复合年增长率为 32.9%。除了对市场价值、增长率、细分、地理覆盖范围和主要参与者等市场情景的见解外,Data Bridge Market Research 策划的市场报告还包括深入的专家分析、按地理代表的公司生产和产能、分销商和合作伙伴的网络布局、详细和更新的价格趋势分析以及供应链和需求的缺口分析。

北美 3D 打印气体市场范围和细分

报告指标

细节

预测期

2024-2031

基准年

2023

历史岁月

2022 (可定制为 2016-2021)

定量单位

收入(单位:十亿美元)、销量(单位:台)、定价(美元)

涵盖的领域

类型(氩气、氮气、 氢气、氦气等)、技术(立体光刻 (SLA)、选择性激光烧结 (SLS)、熔融沉积成型 (FDM)、数字光处理 (DLP)、多喷射熔合 (MJF)、Polyjet、直接金属激光烧结 (DMLS)、电子束熔化 (EBM)、Poly-Jet 等)、材料(塑料、金属、铝化物、木材等)、存储和分配(气瓶、商用液体和吨位)、功能(绝缘、照明、冷却等)、最终用户(工业、汽车、航空航天、消费品、医疗、建筑和施工、珠宝、食品、玩具、视觉艺术、机器人等)

覆盖国家

北美的美国、加拿大和墨西哥

涵盖的市场参与者

杜邦(美国)、日酸控股株式会社(日本)、ExOne(美国)、3D Systems, Inc.(美国)、雷尼绍公司(英国)、Universal Industrial Gases Inc.(美国)、Messer SE & Co. KGaA(德国)、Bronkhorst(荷兰)、Stratasys(以色列)、通用电气(美国)、Höganäs AB(瑞典)、GKN Powder Metallurgy(德国)、Equispheres(加拿大)、山特维克公司(瑞典)、空气化工产品公司(美国)、液化空气集团(法国)、赢创工业集团(德国)、巴斯夫公司(德国)、林德公司(爱尔兰)

市场机会

  • 针对特定应用定制混合气体
  • 日益重视环境可持续性推动环保解决方案

市场定义

3D 打印气体是增材制造过程中使用的材料,用于提高打印物体的质量和性能。这些气体包括惰性气体(如氩气或氮气),它们可形成受控气氛以防止打印过程中的氧化,以及活性气体(如氧气),用于特定的材料相互作用。正确的气体选择通过影响 3D 打印过程中的温度、材料流动和表面光洁度,对实现所需的打印结果起着至关重要的作用。 

北美 3D 打印气体市场动态

驱动程序

  • 3D 打印行业增长增加对专用气体的需求

随着 3D 打印技术在航空航天、医疗保健、汽车和制造业等各个领域的应用不断增加,对 3D 打印过程中使用的专用气体的需求也相应增加。这些气体可能包括氮气和氩气等惰性气体,它们通常用于在打印过程中创造受控气氛,以提高打印产品的质量。

  • 3D 打印助力航空航天和汽车行业原型设计

3D 打印具有快速成型的优势,使公司能够快速迭代和测试设计。航空航天和汽车等产品开发周期至关重要的行业越来越依赖 3D 打印技术来加快创新。对快速成型和缩短开发周期的重视预计将大大增加对 3D 打印气体的需求。随着该技术成为这些​​行业产品设计和开发流程不可或缺的一部分,对这些气体的需求预计将会增加。

机会

  • 针对特定应用定制混合气体

定制气体混合物以满足不同 3D 打印应用的独特要求可能是一个有利可图的机会。不同的材料和打印技术可能需要特定的大气条件。公司可以探索创建定制的气体混合物,以优化打印质量、减少缺陷并提高特定行业或应用的效率。这种方法允许在市场中提供更有针对性和更专业​​的产品。

  • 日益重视环境可持续性推动环保解决方案

人们对可持续性和环境责任的日益重视为 3D 打印气体市场中的公司提供了开发和推广环保解决方案的机会。这可能涉及制造对环境影响较小的气体或开发废气体的回收和再利用工艺。可持续发展驱动的举措可以与注重环保的行业产生良好共鸣,并有助于公司在市场上树立积极的形象。

 限制/挑战

  • 监管障碍阻碍企业扩大产品供应

行业内严格的法规和合规要求为寻求多元化或推出新产品的企业设置了障碍。需要遵循和遵守复杂的监管框架可能会阻碍产品组合的及时扩展。这种限制可能会限制 3D 打印气体市场中的公司迅速适应不断变化的市场需求的能力,从而影响它们在监管挑战面前的增长潜力。

  • 高昂的初始成本限制了 3D 打印技术的采用

实施 3D 打印技术通常需要在设备、材料和气体方面进行大量的初始投资。购买和维护 3D 打印机的成本以及打印过程中使用的气体对某些企业来说可能是一大障碍。这可能会限制 3D 打印技术的采用,尤其是对于资金有限的中小型企业 (SME)。

这份北美 3D 打印气体市场报告详细介绍了最新发展、贸易法规、进出口分析、生产分析、价值链优化、市场份额、国内和本地市场参与者的影响,分析了新兴收入来源、市场法规变化、战略市场增长分析、市场规模、类别市场增长、应用领域和主导地位、产品批准、产品发布、地域扩展、市场技术创新等方面的机会。如需了解有关北美 3D 打印气体市场的更多信息,请联系 Data Bridge Market Research 获取分析师简报,我们的团队将帮助您做出明智的市场决策,实现市场增长。

原材料短缺和运输延误的影响和当前市场状况

Data Bridge 市场研究提供高水平的市场分析,并通过考虑原材料短缺和运输延迟的影响和当前市场环境来提供信息。这意味着评估战略可能性、制定有效的行动计划并协助企业做出重要决策。除了标准报告外,我们还提供从预测运输延迟、按地区划分的分销商映射、商品分析、生产分析、价格映射趋势、采购、类别绩效分析、供应链风险管理解决方案、高级基准测试以及其他采购和战略支持服务等方面的采购层面的深入分析。

经济放缓对产品定价和供应的预期影响

当经济活动放缓时,行业开始受到影响。DBMR 提供的市场洞察报告和情报服务考虑了经济衰退对产品定价和可获得性的预测影响。借助这些,我们的客户通常可以领先竞争对手一步,预测他们的销售额和收入,并估算他们的盈亏支出。

最新动态

  • 2021 年 2 月,3D Systems 推出了专为航空航天和汽车应用量身定制的“高速融合”3D 打印系统,提升了其在 3D 打印气体市场的份额。这一战略举措反映了行业对高可靠性产品的需求,与公司为响应市场需求而进行的产品组合扩展相一致
  • 2021 年 2 月,AMEXCI 与 SLM Solutions 合作,共同努力推动增材制造的工业化。此次合作的重点是支持企业实施先进的制造技术,强调了 3D 打印气体在不断发展的市场中促进复杂金属零件批量生产的作用
  • 2021 年 1 月,Equispheres 推出了三种高性能铝粉,旨在提高强度、精度和打印速度。这一战略举措增强了公司的收入,并使其产品组合多样化,使其在 3D 打印材料市场中占据了增长优势
  • 2020 年 5 月,通用电气与美国空军合作,为 F110 发动机 3D 打印了油底壳盖,实现了技术里程碑。此次成功合作展示了金属增材制造的进步,并通过增加对航空航天应用的参与,促进了通用电气的收入增长
  • 2020 年 3 月,Stratasys 与 m2nxt Solutions 合作,标志着 3D 打印气体市场的关键合作。该联盟旨在增强 3D 打印解决方案和增材制造应用,帮助企业拥抱工业 4.0 并塑造 3D 打印技术不断发展的格局

北美 3D 打印气体市场范围

北美 3D 打印气体市场按类型、技术、材料、存储和分销、功能和最终用户进行细分。细分市场之间的增长有助于您分析利基增长领域和进入市场的策略,并确定您的核心应用领域和目标市场的差异。

类型

  • 氩气
  • 其他的

技术

  • 立体光刻 (SLA)
  • 选择性激光烧结 (SLS)
  • 熔融沉积成型 (FDM)
  • 数字光处理 (DLP)
  • 多喷射熔接 (MJF)
  • 波利杰特
  • 直接金属激光烧结 (DMLS)
  • 电子束熔炼 (EBM)
  • 聚喷射
  • 其他的

材料

  • 塑料
  • 金属
  • 铝化物
  • 木头
  • 其他的

储存和配送

  • 圆柱
  • 商用液体
  • 吨位

功能

  • 绝缘
  • 照明
  • 冷却
  • 其他的

终端用户

  • 工业的
  • 汽车
  • 航天
  • 消费品
  • 医疗的
  • 建筑
  • 建造
  • 首饰
  • 食物
  • 玩具
  • 视觉艺术
  • 机器人
  • 其他的

北美 3D 打印气体市场区域分析/洞察

对北美 3D 打印气体市场进行了分析,并按国家、类型、技术、材料、存储和分销、功能和最终用户提供了市场规模信息,如上所述。

北美 3D 打印气体市场报告涵盖的国家包括北美的美国、加拿大和墨西哥。

美国在北美 3D 打印气体市场占据主导地位,主要得益于产品制造领域的持续创新和进步。强劲的发展环境培养了庞大的客户群,使美国成为 3D 打印气体应用的关键参与者。该国对技术进步的承诺为其在该市场的主导地位做出了重大贡献。

在加拿大,由于汽车金属产品产量的增加,对氩气的需求也在增加。随着汽车行业的扩张,对氩气的需求也随之增加,氩气通常用于生产高质量金属部件的焊接工艺。需求激增反映了氩气在支持加拿大汽车制造业增长方面发挥的不可或缺的作用。

报告的国家部分还提供了影响单个市场因素和国内市场监管变化,这些因素和变化会影响市场的当前和未来趋势。下游和上游价值链分析、技术趋势和波特五力分析、案例研究等数据点是用于预测单个国家市场情景的一些指标。此外,在提供国家数据的预测分析时,还考虑了全球品牌的存在和可用性以及它们因来自本地和国内品牌的大量或稀缺竞争而面临的挑战、国内关税和贸易路线的影响。   

竞争格局和北美 3D 打印气体市场份额分析

北美 3D 打印气体市场竞争格局按竞争对手提供详细信息。详细信息包括公司概况、公司财务状况、产生的收入、市场潜力、研发投资、新市场计划、全球影响力、生产基地和设施、公司优势和劣势、产品发布、临床试验渠道、品牌分析、产品批准、专利、产品宽度和广度、应用主导地位、技术生命线曲线。以上提供的数据点仅与公司对北美 3D 打印气体市场的关注有关。

北美 3D 打印气体市场的一些主要参与者包括:

  • 杜邦(美国)
  • 日本酸素控股株式会社(日本)
  • ExOne(美国)
  • 3D Systems, Inc.(美国)
  • Renishaw plc(英国)
  • 环球工业气体公司(美国)
  • 梅塞尔股份公司(德国)
  • 布朗克霍斯特(荷兰)
  • Stratasys(以色列)
  • 通用电气(美国)
  • Höganäs AB(瑞典)
  • GKN粉末冶金公司(德国)
  • Equispheres(加拿大)
  • 山特维克公司(瑞典)
  • 空气产品及化学品公司(美国)
  • 液化空气集团(法国)
  • 赢创工业集团 (德国)
  • 巴斯夫公司(德国)
  • 林德集团(爱尔兰)


SKU-

Get online access to the report on the World's First Market Intelligence Cloud

  • Interactive Data Analysis Dashboard
  • Company Analysis Dashboard for high growth potential opportunities
  • Research Analyst Access for customization & queries
  • Competitor Analysis with Interactive dashboard
  • Latest News, Updates & Trend analysis
  • Harness the Power of Benchmark Analysis for Comprehensive Competitor Tracking
Request for Demo

目录

  1. introduction
    1. OBJECTIVES OF THE STUDY
    2. MARKET DEFINITION
    3. OVERVIEW of North America 3D printing gases MARKET
    4. LIMITATION
    5. MARKETS COVERED
  2. MARKET SEGMENTATION
    1. MARKETS COVERED
    2. geographic scope
    3. years considered for the study
    4. currency and pricing
    5. DBMR TRIPOD DATA VALIDATION MODEL
    6. TYPE LIFE LINE CURVE
    7. MULTIVARIATE MODELLING
    8. primary interviews with key opinion leaders
    9. DBMR MARKET POSITION GRID
    10. MARKET end-user COVERAGE GRID
    11. DBMR MARKET CHALLENGE MATRIX
    12. vendor share analysis
    13. IMPORT-EXPORT DATA
    14. secondary sourcEs
    15. assumptions
  3. EXECUTIVE SUMMARY
  4. premium insights
  5. market overview
    1. DRIVERS
      1. INCREASE IN INDUSTRIALISATION AND CHANGING TECHNOLOGY FOR ADDITIVE GAS MANUFACTURING
      2. RISE IN DEMAND OF 3D PRINTING GASES IN MEDICAL SECTOR AND HEALTHCARE DEVICES
      3. 3D PRINTING GASES REDUCES THE CHANCE OF OXIDATION OF PRINT CHAMBER
      4. RAPID DIGITIZATION IN CHEMICAL INDUSTRY
      5. INCREASING DEMAND FOR INERT GASES IN AEROSPACE INDUSTRY
    2. RESTRAINTS
      1. HIGH REQUIREMENT OF CONTROLLED ENVIRONMENT TO REDUCE EXPOSURE LEVEL OF MATERIALS USE IN 3D PRINTING
      2. HIGH COST OF 3D PRINTING GASES AND SHORTAGE OF SKILLED LABOR
      3. HIGH COST OF 3D PRINTING SOFTWARE TOOLS
      4. STRINGENT RULES AND REGULATION FOR THE USE OF 3D PRINTING GASES
    3. OPPORTUNITIES
      1. RISE IN EXPENDITURE IN RESEARCH AND DEVELOPMENT FOR 3D PRINTING ACTIVITIES
      2. SIGNIFICANT OPPORTUNITIES WITH RESPECT TO POWDER CLUMPING IN TUBES
    4. CHALLENGES
      1. LOW AVAILABILITY OF RAW MATERIALS SUCH AS PLASTICS AND METALS WHICH ARE NON-RECYCLABLE IN NATURE
      2. LACK OF STANDARD PROCESS CONTROLS FOR 3D PRINTING
  6. IMPACT OF COVID 19 on the North America 3D Printing Gases Market
    1. ANALYSIS ON IMPACT OF COVID-19 ON 3D PRINTING GASES market
    2. AFTERMATH OF COVID-19 AND GOVERNMENT ROLE
    3. STRATERGIC DECISIONS FOR MANUFACTURERS AFTER COVID-19 TO GAIN COMPETITIVE MARKET SHARE
    4. IMPACT on price
    5. IMPACT ON DEMAND
    6. IMPACT ON SUPPLY CHAIN
    7. CONCLUSION
  7. North america 3D printing gases market, BY type
    1. overview
    2. ARGON
    3. NITROGEN
    4. hElium
    5. hydrogen
    6. others
  8. NORTH AMERICA 3D PRINTING GASES MARKET, BY technology
    1. overview
    2. Fused Deposition Modeling (FDM)
    3. Selective Laser Sintering (SLS)
    4. Stereo Lithography (SLA)
    5. Multi Jet Fusion (MJF)
    6. Polyjet
    7. Direct Metal Laser Sintering (DMLS)
    8. Digital Light Process (DLP)
    9. Electron Beam Melting (EBM)
    10. Others
  9. NORTH AMERICA 3D PRINTING GASES MARKET, BY material
    1. overview
    2. Plastics
      1. ABS
      2. PLA
      3. NYLON (POLYAMIDE)
      4. PEEK
      5. PET
      6. PETG
      7. ULTEM
      8. HIPS
      9. PVA
      10. OTHERS
    3. MEtal
      1. Aluminium
      2. Silver
      3. Platinum
      4. Stainless Steel
      5. Titanium
      6. Copper and Bronze
      7. Nickel
      8. Cobalt Chromium
      9. Gold
      10. Inconel
      11. OTHERS
    4. Alumide
    5. wood
    6. others
  10. NORTH AMERICA 3D PRINTING GASES MARKET, BY storage and distribution
    1. overview
    2. Cylinder
    3. Merchant Liquid
    4. Tonnage
  11. nORTH AMERICA 3D PRINTING GASES MARKET, BY function
    1. overview
    2. Illumination
    3. Insulation
    4. Cooling
    5. Others
  12. North America Industrial in 3D Printing gases market, BY End-User
    1. overview
    2. Industrial
      1. Industrial By End-User
        1. OIL AND GAS
        2. METAL PROCESSING
        3. MINING
        4. MANUFACTURING
        5. OTHERS
      2. Industrial By Type
        1. ARGON
        2. NITROGEN
        3. HELIUM
        4. HYDROGEN
        5. OTHERS
    3. Aerospace
      1. Aerospace By End-User
        1. GEAR CASES AND COVERS
        2. FUEL TANKS
        3. LIGHTWEIGHT ENGINE PARTS
        4. STRUCTURAL HINGES
        5. TRANSMISSION HOUSINGS
        6. PROTOTYPES
        7. OTHERS
      2. Aerospace By Type
        1. ARGON
        2. NITROGEN
        3. HELIUM
        4. HYDROGEN
        5. OTHERS
    4. Automotive
      1. Automotive By End-User
        1. HOOD
        2. INTERIOR ACCESSORIES
        3. CAST METAL BRACKETS AND HANDLES
        4. FULL SCALE PANELS
        5. LIGHTS
        6. BEZELS
        7. AIR DUCTS
        8. COMPLEX METAL COMPONENTS
        9. OTHERS
      2. Automotive By Type
        1. ARGON
        2. NITROGEN
        3. HELIUM
        4. HYDROGEN
        5. OTHERS
    5. Consumer Goods
      1. Consumer Goods By End-User
        1. BI-CYCLES
        2. COSMETIC PRODUCTS
        3. SHOE SOLES
        4. EYEWEAR
        5. HELMETS
        6. OTHERS
      2. Consumer Goods By Type
        1. ARGON
        2. NITROGEN
        3. HELIUM
        4. HYDROGEN
        5. OTHERS
    6. Medical
      1. Medical By End-User
        1. IMPLANTS
        2. PROSTHETICS
        3. LASER SCANNING
        4. HEARING AIDS
        5. SURGICAL LEARNING TOOLS
        6. CT SCAN
        7. MRI
        8. OTHERS
      2. Medical By Type
        1. ARGON
        2. NITROGEN
        3. HELIUM
        4. HYDROGEN
        5. OTHERS
    7. Building and Construction
      1. Building and Construction By End-User
        1. WALLS AND FLOORS
        2. BENCHES
        3. METAL FRAMES
        4. BRIDGES
        5. DISASTER RELIEF SHELTERS
        6. 3D PRINTED HOUSES
        7. CANALS
        8. DAMS
        9. OTHERS
      2. Building and Construction By Type
        1. ARGON
        2. NITROGEN
        3. HELIUM
        4. HYDROGEN
        5. OTHERS
    8. Visual Art
      1. Visual Art By End-User
        1. DIY PROJECTS
        2. ARCHITECTURAL MODELS
        3. FUNCTIONAL MODELS
        4. CONCEPT MODELS
        5. OTHERS
      2. Visual Art By Type
        1. ARGON
        2. NITROGEN
        3. HELIUM
        4. HYDROGEN
        5. OTHERS
    9. Food
      1. Food By End-User
        1. CAKES AND PASTRIES
        2. DESSERTS
        3. CHOCOLATES
        4. CHEWING GUMS
        5. SUGAR
        6. SAUCES
        7. OTHERS
      2. Food By Type
        1. ARGON
        2. NITROGEN
        3. HELIUM
        4. HYDROGEN
        5. OTHERS
    10. Robotics
      1. Robotics By Type
        1. ARGON
        2. NITROGEN
        3. HELIUM
        4. HYDROGEN
        5. OTHERS
    11. Toys
      1. Toys By Type
        1. ARGON
        2. NITROGEN
        3. HELIUM
        4. HYDROGEN
        5. OTHERS
    12. Jewelery
      1. Jewellery By Type
        1. ARGON
        2. NITROGEN
        3. HELIUM
        4. HYDROGEN
        5. OTHERS
    13. Others
      1. Others By Type
        1. ARGON
        2. NITROGEN
        3. HELIUM
        4. HYDROGEN
        5. OTHERS
  13. North America 3D printing gases MARKET by country
    1. North AMERICA
      1. U.S.
      2. CanaDa
      3. Mexico
  14. NORTH AMERICA 3D PRINTING GASES Market, COMPANY landscape
    1. Merger & Acquisition
    2. EXPANSIONS
    3. new product development
    4. partnership
  15. SWOT
  16. company profiles
    1. BASF SE
      1. COMPANY SNAPSHOT
      2. REVENUE ANALYSIS
      3. PRODUCT PORTFOLIO
      4. RECENT UPDATES
    2. Linde plc
      1. COMPANY SNAPSHOT
      2. REVENUE ANALYSIS
      3. PRODUCT PORTFOLIO
      4. RECENT UPDATES
    3. Evonik Industries AG
      1. COMPANY SNAPSHOT
      2. REVENUE ANALYSIS
      3. PRODUCT PORTFOLIO
      4. RECENT UPDATES
    4. NIPPON SANSO HOLDINGS CORPORATION
      1. COMPANY SNAPSHOT
      2. REVENUE ANALYSIS
      3. PRODUCT PORTFOLIO
      4. RECENT UPDATES
    5. Air Liquide
      1. COMPANY SNAPSHOT
      2. REVENUE ANALYSIS
      3. PRODUCT PORTFOLIO
      4. RECENT UPDATES
    6. DuPont
      1. COMPANY SNAPSHOT
      2. REVENUE ANALYSIS
      3. PRODUCT PORTFOLIO
      4. RECENT UPDATES
    7. Sandvik AB
      1. COMPANY SNAPSHOT
      2. REVENUE ANALYSIS
      3. PRODUCT PORTFOLIO
      4. RECENT UPDATES
    8. Höganäs AB
      1. COMPANY SNAPSHOT
      2. PRODUCT PORTFOLIO
      3. RECENT UPDATE
    9. GKN Sinter Metals Engineering GmbH
      1. COMPANY SNAPSHOT
      2. PRODUCT PORTFOLIO
      3. RECENT UPDATE
    10. 3D Systems, Inc.
      1. COMPANY SNAPSHOT
      2. REVENUE ANALYSIS
      3. PRODUCT PORTFOLIO
      4. RECENT UPDATES
    11. Air Products Inc.
      1. COMPANY SNAPSHOT
      2. REVENUE ANALYSIS
      3. PRODUCT PORTFOLIO
      4. RECENT UPDATE
    12. Bronkhorst
      1. COMPANY SNAPSHot
      2. Product Portfolio
      3. RECENT UPDATES
    13. CRS Holdings Inc.
      1. COMPANY SNAPSHOT
      2. REVENUE ANALYSIS
      3. PRODUCT PORTFOLIO
      4. RECENT UPDATES
    14. Equispheres
      1. COMPANY SNAPSHOT
      2. PRODUCT PORTFOLIO
      3. RECENT UPDATE
    15. ExOne
      1. COMPANY SNAPSHOT
      2. REVENUE ANALYSIS
      3. PRODUCT PORTFOLIO
      4. RECENT UPDATES
    16. GENERAL ELECTRIC
      1. COMPANY SNAPSHOT
      2. REVENUE ANALYSIS
      3. PRODUCT PORTFOLIO
      4. RECENT UPDATE
    17. Messer Group GmbH
      1. COMPANY SNAPSHOT
      2. REVENUE ANALYSIS
      3. PRODUCT PORTFOLIO
      4. RECENT UPDATES
    18. Renishaw plc
      1. COMPANY SNAPSHOT
      2. REVENUE ANALYSIS
      3. PRODUCT PORTFOLIO
      4. RECENT UPDATES
    19. Stratasys Ltd.
      1. COMPANY SNAPSHOT
      2. REVENUE ANALYSIS
      3. PRODUCT PORTFOLIO
      4. RECENT UPDATES
    20. Universal INDUSTRIAL GASES Inc.
      1. COMPANY SNAPSHot
      2. Product Portfolio
      3. RECENT UPDATE
  17. questionnaire
  18. related reports

表格列表

TABLE 1 IMPORT DATA of Product: 2804 Hydrogen, rare gases and other non-metals.. HS Code - 2804 (USD thousand)

TABLE 2 export data Product: 2804 Hydrogen, rare gases and other non-metals.. HS Code - 2804 (USD thousand)

TABLE 3 Data on Plastics in MSW by Weight (in thousands of U.S. tons), 2000, 2018

TABLE 4 North America 3D printing gases Market, By type, 2019-2028 (Million UNITS)

TABLE 5 North America 3D printing gases Market, By type, 2019-2028 (USD Million)

TABLE 6 North America argon in 3D printing gases Market, By Country, 2019-2028 (Million units)

TABLE 7 North America Argon in 3D printing gases Market, By Country, 2019-2028 (USD MIllion)

TABLE 8 North America Nitrogen in 3D printing gases Market, By Country, 2019-2028 (Million units)

TABLE 9 North America Paperboard boxes in 3D printing gases Market, By Country, 2019-2028 (USD Million)

TABLE 10 North America helium in 3D printing gases Market, By Country, 2019-2028 (Million units)

TABLE 11 North America hElium in 3D printing gases Market, By Country, 2019-2028 (USD million)

TABLE 12 North America hydrogen in 3D printing gases Market, By Country, 2019-2028 (Million units)

TABLE 13 North America hydrogen in 3D printing gases Market , By Country, 2019-2028 (USD million)

TABLE 14 North America others in 3D printing gases Market, By Country, 2019-2028 (Million units)

TABLE 15 North America others in 3D printing gases Market, By Country, 2019-2028 (USD million)

TABLE 16 North America 3D printing gases Market, By technology, 2019-2028 (USD Million)

TABLE 17 North America Fused Deposition Modeling (FDM) in 3D printing gases Market, By Country, 2019-2028 (USD Million)

TABLE 18 North America Selective Laser Sintering (SLS) in 3D printing gases Market, By Country, 2019-2028 (USD Million)

TABLE 19 North America Stereo Lithography (SLA) in 3D printing gases Market, By Country, 2019-2028 (USD Million)

TABLE 20 North America Multi Jet Fusion (MJF) in 3D printing gases Market, By Country, 2019-2028 (USD Million)

TABLE 21 North America Polyjet in 3D printing gases Market, By Country, 2019-2028 (USD Million)

TABLE 22 North America Direct Metal Laser Sintering (DMLS) in 3D printing gases Market, By Country, 2019-2028 (USD Million)

TABLE 23 North America Digital Light Process (DLP) in 3D printing gases Market, By Country, 2019-2028 (USD Million)

TABLE 24 North America Electron Beam Melting (EBM) in 3D printing gases Market, By Country, 2019-2028 (USD Million)

TABLE 25 North America others in 3D printing gases Market, By Country, 2019-2028 (USD Million)

TABLE 26 North America 3D printing gases Market, By material, 2019-2028 (USD Million)

TABLE 27 North America plastics in 3D printing gases Market, By Country, 2019-2028 (USD Million)

TABLE 28 North America plastics in 3D printing gases Market, By plastic material, 2019-2028 (USD Million)

TABLE 29 North America metal in 3D printing gases Market, By Country, 2019-2028 (USD Million)

TABLE 30 North America metal in 3D printing gases Market, By Country, 2019-2028 (USD Million)

TABLE 31 North America Alumide in 3D printing gases Market, By Country, 2019-2028 (USD Million)

TABLE 32 North America wood in 3D printing gases Market, By Country, 2019-2028 (USD Million)

TABLE 33 North America others in 3D printing gases Market, By Country, 2019-2028 (USD Million)

TABLE 34 North America 3D printing gases Market, By storage and distribution, 2019-2028 (USD Million)

TABLE 35 North America Cylinder in 3D printing gases Market, By Country, 2019-2028 (USD Million)

TABLE 36 North America Merchant Liquid in 3D printing gases Market, By Country, 2019-2028 (USD Million)

TABLE 37 North America Tonnage in 3D printing gases Market, By Country, 2019-2028 (USD Million)

TABLE 38 North America 3D printing gases Market, By function, 2019-2028 (USD Million)

TABLE 39 North America Illumination in 3D printing gases Market, By Country, 2019-2028 (USD Million)

TABLE 40 North America Insulation in 3D printing gases Market, By Country, 2019-2028 (USD Million)

TABLE 41 North America cooling in 3D printing gases Market, By Country, 2019-2028 (USD Million)

TABLE 42 North America others in 3D printing gases Market, By Country, 2019-2028 (USD Million)

TABLE 43 North America 3D Printing gases Market, By End-User, 2019-2028 (USD Million)

TABLE 44 North America Industrial in 3D Printing gases Market BY Country, 2019-2028 (USD MILLION)

TABLE 45 North America Industrial in 3D Printing gases Market, By End-User, 2019-2028 (USD Million)

TABLE 46 North America Industrial in 3D Printing gases Market, By Type, 2019-2028 (USD Million)

TABLE 47 North America Aerospace in 3D Printing gases Market BY Country, 2019-2028 (USD MILLION)

TABLE 48 North America Aerospace in 3D Printing gases Market, By End-User, 2019-2028 (USD Million)

TABLE 49 North America Aerospace in 3D Printing gases Market, By Type, 2019-2028 (USD Million)

TABLE 50 North America Automotive in 3D Printing gases Market BY Country, 2019-2028 (USD MILLION)

TABLE 51 North America Automotive in 3D Printing gases Market, By End-User, 2019-2028 (USD Million)

TABLE 52 North America Automotive in 3D Printing gases Market, By Type, 2019-2028 (USD Million)

TABLE 53 North America Consumer Goods in 3D Printing gases Market BY Country, 2019-2028 (USD MILLION)

TABLE 54 North America Consumer Goods in 3D Printing gases Market, By End-User, 2019-2028 (USD Million)

TABLE 55 North America Consumer Goods in 3D Printing gases Market, By Type, 2019-2028 (USD Million)

TABLE 56 North America Medical in 3D Printing gases Market BY Country, 2019-2028 (USD MILLION)

TABLE 57 North America Medical in 3D Printing gases Market, By End-User, 2019-2028 (USD Million)

TABLE 58 North America Medical in 3D Printing gases Market, By Type, 2019-2028 (USD Million)

TABLE 59 North America Building and Construction in 3D Printing gases Market BY Country, 2019-2028 (USD MILLION)

TABLE 60 North America Building and Construction in 3D Printing gases Market, By End-User, 2019-2028 (USD Million)

TABLE 61 North America Building and Construction in 3D Printing gases Market, By Type, 2019-2028 (USD Million)

TABLE 62 North America Visual Art in 3D Printing gases Market BY Country, 2019-2028 (USD MILLION)

TABLE 63 North America Visual Art in 3D Printing gases Market, By End-User, 2019-2028 (USD Million)

TABLE 64 North America Visual Art in 3D Printing gases Market, By Type, 2019-2028 (USD Million)

TABLE 65 North America Food in 3D Printing gases Market BY Country, 2019-2028 (USD MILLION)

TABLE 66 North America Food in 3D Printing gases Market, By End-User, 2019-2028 (USD Million)

TABLE 67 North America Food in 3D Printing gases Market, By Type, 2019-2028 (USD Million)

TABLE 68 North America Robotics in 3D Printing gases Market BY Country, 2019-2028 (USD MILLION)

TABLE 69 North America Robotics in 3D Printing gases Market, By Type, 2019-2028 (USD Million)

TABLE 70 North America Toys in 3D Printing gases Market BY Country, 2019-2028 (USD MILLION)

TABLE 71 North America Toys in 3D Printing gases Market, By Type, 2019-2028 (USD Million)

TABLE 72 North America Jewellery in 3D Printing gases Market, BY Country, 2019-2028 (USD MILLION)

TABLE 73 North America Jewellery in 3D Printing gases Market, By Type, 2019-2028 (USD Million)

TABLE 74 North America Others in 3D Printing gases Market BY Country, 2019-2028 (USD MILLION)

TABLE 75 North America Others in 3D Printing gases Market, By Type, 2019-2028 (USD Million)

TABLE 76 North America 3D Printing Gases Market, By Country, 2019-2028 (million Units)

TABLE 77 North America 3D Printing Gases Market, By Country, 2019-2028 (USD Million)

TABLE 78 North America 3D Printing Gases Market, By Type, 2019-2028 (million Units)

TABLE 79 North America 3D Printing Gases Market, By Type, 2019-2028 (USD Million)

TABLE 80 North America 3D Printing Gases Market, By Technology, 2019-2028 (USD Million)

TABLE 81 North America 3D Printing Gases Market, By Material, 2019-2028 (USD Million)

TABLE 82 North America Plastic in 3D Printing Gases Market, By Plastic Material, 2019-2028 (USD Million)

TABLE 83 North America Metal in 3D Printing Gases Market, By Metal Material, 2019-2028 (USD Million)

TABLE 84 North America 3D Printing Gases Market, By Storage and Distribution, 2019-2028 (USD Million)

TABLE 85 North America 3D Printing Gases Market, By Function, 2019-2028 (USD Million)

TABLE 86 North America 3D Printing Gases Market, By End-User, 2019-2028 (USD Million)

TABLE 87 North America Industrial in 3D Printing Gases Market, By End-User, 2019-2028 (USD Million)

TABLE 88 North America Industrial in 3D Printing Gases Market, By Type, 2019-2028 (USD Million)

TABLE 89 North America Aerospace in 3D Printing Gases Market, By End-User, 2019-2028 (USD Million)

TABLE 90 North America Aerospace in 3D Printing Gases Market, By Type, 2019-2028 (USD Million)

TABLE 91 North America Automotive in 3D Printing Gases Market, By End-User, 2019-2028 (USD Million)

TABLE 92 North America Automotive in 3D Printing Gases Market, By Type, 2019-2028 (USD Million)

TABLE 93 North America Consumer Goods in 3D Printing Gases Market, By End-User, 2019-2028 (USD MILLION)

TABLE 94 North America Consumer Goods in 3D Printing Gases Market, By Type, 2019-2028 (USD MILLION)

TABLE 95 North America Medical in 3D Printing Gases Market, By End-User, 2019-2028 (USD MILLION)

TABLE 96 North America Medical in 3D Printing Gases Market, By Type, 2019-2028 (USD MILLION)

TABLE 97 North America Building and Construction in 3D Printing Gases Market, By End-User, 2019-2028 (USD MILLION)

TABLE 98 North America Building and Construction in 3D Printing Gases Market, By Type, 2019-2028 (USD MILLION)

TABLE 99 North America Visual Art in 3D Printing Gases Market, By End-User, 2019-2028 (USD MILLION)

TABLE 100 North America Visual Art in 3D Printing Gases Market, By Type, 2019-2028 (USD MILLION)

TABLE 101 North America Food in 3D Printing Gases Market, By End-User, 2019-2028 (USD MILLION)

TABLE 102 North America Food in 3D Printing Gases Market, By Type, 2019-2028 (USD MILLION)

TABLE 103 North America Robotics in 3D Printing Gases Market, By Type, 2019-2028 (USD MILLION)

TABLE 104 North America Toys in 3D Printing Gases Market, By Type, 2019-2028 (USD MILLION)

TABLE 105 North America Jewellery in 3D Printing Gases Market, By Type, 2019-2028 (USD MILLION)

TABLE 106 North America Others in 3D Printing Gases Market, By Type, 2019-2028 (USD MILLION)

TABLE 107 U.S. 3D Printing Gases Market, By Type, 2019-2028 (MILLION Units)

TABLE 108 U.S. 3D Printing Gases Market, By Type, 2019-2028 (USD MILLION)

TABLE 109 U.S. 3D Printing Gases Market, By Technology, 2019-2028 (USD MILLION)

TABLE 110 U.S. 3D Printing Gases Market, By Material, 2019-2028 (USD MILLION)

TABLE 111 U.S. Plastic in 3D Printing Gases Market, By Plastic Material, 2019-2028 (USD MILLION)

TABLE 112 U.S. Metal in 3D Printing Gases Market, By Metal Material, 2019-2028 (USD MILLION)

TABLE 113 U.S. 3D Printing Gases Market, By Storage and Distribution, 2019-2028 (USD MILLION)

TABLE 114 U.S. 3D Printing Gases Market, By Function, 2019-2028 (USD MILLION)

TABLE 115 U.S. 3D Printing Gases Market, By End-User, 2019-2028 (USD MILLION)

TABLE 116 U.S. Industrial in 3D Printing Gases Market, By End-User, 2019-2028 (USD MILLION)

TABLE 117 U.S. Industrial in 3D Printing Gases Market, By Type, 2019-2028 (USD MILLION)

TABLE 118 U.S. Aerospace in 3D Printing Gases Market, By End-User, 2019-2028 (USD MILLION)

TABLE 119 U.S. Aerospace in 3D Printing Gases Market, By Type, 2019-2028 (USD MILLION)

TABLE 120 U.S. Automotive in 3D Printing Gases Market, By End-User, 2019-2028 (USD MILLION)

TABLE 121 U.S. Automotive in 3D Printing Gases Market, By Type, 2019-2028 (USD MILLION)

TABLE 122 U.S. Consumer Goods in 3D Printing Gases Market, By End-User, 2019-2028 (USD MILLION)

TABLE 123 U.S. Consumer Goods in 3D Printing Gases Market, By Type, 2019-2028 (USD MILLION)

TABLE 124 U.S. Medical in 3D Printing Gases Market, By End-User, 2019-2028 (USD MILLION)

TABLE 125 U.S. Medical in 3D Printing Gases Market, By Type, 2019-2028 (USD MILLION)

TABLE 126 U.S. Building and Construction in 3D Printing Gases Market, By End-User, 2019-2028 (USD MILLION)

TABLE 127 U.S. Building and Construction in 3D Printing Gases Market, By Type, 2019-2028 (USD MILLION)

TABLE 128 U.S. Visual Art in 3D Printing Gases Market, By End-User, 2019-2028 (USD MILLION)

TABLE 129 U.S. Visual Art in 3D Printing Gases Market, By Type, 2019-2028 (USD MILLION)

TABLE 130 U.S. Food in 3D Printing Gases Market, By End-User, 2019-2028 (USD MILLION)

TABLE 131 U.S. Food in 3D Printing Gases Market, By Type, 2019-2028 (USD MILLION)

TABLE 132 U.S. Robotics in 3D Printing Gases Market, By Type, 2019-2028 (USD MILLION)

TABLE 133 U.S. Toys in 3D Printing Gases Market, By Type, 2019-2028 (USD MILLION)

TABLE 134 U.S. Jewellery in 3D Printing Gases Market, By Type, 2019-2028 (USD MILLION)

TABLE 135 U.S. Others in 3D Printing Gases Market, By Type, 2019-2028 (USD MILLION)

TABLE 136 Canada 3D Printing Gases Market, By Type, 2019-2028 (MILLION Units)

TABLE 137 Canada 3D Printing Gases Market, By Type, 2019-2028 (USD MILLION)

TABLE 138 Canada 3D Printing Gases Market, By Technology, 2019-2028 (USD MILLION)

TABLE 139 Canada 3D Printing Gases Market, By Material, 2019-2028 (USD MILLION)

TABLE 140 Canada Plastic in 3D Printing Gases Market, By Plastic Material, 2019-2028 (USD MILLION)

TABLE 141 Canada Metal in 3D Printing Gases Market, By Metal Material, 2019-2028 (USD MILLION)

TABLE 142 Canada 3D Printing Gases Market, By Storage and Distribution, 2019-2028 (USD MILLION)

TABLE 143 Canada 3D Printing Gases Market, By Function, 2019-2028 (USD MILLION)

TABLE 144 Canada 3D Printing Gases Market, By End-User, 2019-2028 (USD MILLION)

TABLE 145 Canada Industrial in 3D Printing Gases Market, By End-User, 2019-2028 (USD MILLION)

TABLE 146 Canada Industrial in 3D Printing Gases Market, By Type, 2019-2028 (USD MILLION)

TABLE 147 Canada Aerospace in 3D Printing Gases Market, By End-User, 2019-2028 (USD MILLION)

TABLE 148 Canada Aerospace in 3D Printing Gases Market, By Type, 2019-2028 (USD MILLION)

TABLE 149 Canada Automotive in 3D Printing Gases Market, By End-User, 2019-2028 (USD MILLION)

TABLE 150 Canada Automotive in 3D Printing Gases Market, By Type, 2019-2028 (USD MILLION)

TABLE 151 Canada Consumer Goods in 3D Printing Gases Market, By End-User, 2019-2028 (USD MILLION)

TABLE 152 Canada Consumer Goods in 3D Printing Gases Market, By Type, 2019-2028 (USD MILLION)

TABLE 153 Canada Medical in 3D Printing Gases Market, By End-User, 2019-2028 (USD MILLION)

TABLE 154 Canada Medical in 3D Printing Gases Market, By Type, 2019-2028 (USD MILLION)

TABLE 155 Canada Building and Construction in 3D Printing Gases Market, By End-User, 2019-2028 (USD MILLION)

TABLE 156 Canada Building and Construction in 3D Printing Gases Market, By Type, 2019-2028 (USD MILLION)

TABLE 157 Canada Visual Art in 3D Printing Gases Market, By End-User, 2019-2028 (USD MILLION)

TABLE 158 Canada Visual Art in 3D Printing Gases Market, By Type, 2019-2028 (USD MILLION)

TABLE 159 Canada Food in 3D Printing Gases Market, By End-User, 2019-2028 (USD MILLION)

TABLE 160 Canada Food in 3D Printing Gases Market, By Type, 2019-2028 (USD MILLION)

TABLE 161 Canada Robotics in 3D Printing Gases Market, By Type, 2019-2028 (USD MILLION)

TABLE 162 Canada Toys in 3D Printing Gases Market, By Type, 2019-2028 (USD MILLION)

TABLE 163 Canada Jewellery in 3D Printing Gases Market, By Type, 2019-2028 (USD MILLION)

TABLE 164 Canada Others in 3D Printing Gases Market, By Type, 2019-2028 (USD MILLION)

TABLE 165 Mexico 3D Printing Gases Market, By Type, 2019-2028 (MILLION Units)

TABLE 166 Mexico 3D Printing Gases Market, By Type, 2019-2028 (USD MILLION)

TABLE 167 Mexico 3D Printing Gases Market, By Technology, 2019-2028 (USD MILLION)

TABLE 168 Mexico3D Printing Gases Market, By Material, 2019-2028 (USD MILLION)

TABLE 169 Mexico Plastic in 3D Printing Gases Market, By Plastic Material, 2019-2028 (USD MILLION)

TABLE 170 Mexico Metal in 3D Printing Gases Market, By Metal Material, 2019-2028 (USD Million)

TABLE 171 Mexico 3D Printing Gases Market, By Storage and Distribution, 2019-2028 (USD MILLION)

TABLE 172 Mexico 3D Printing Gases Market, By Function, 2019-2028 (USD MILLION)

TABLE 173 Mexico 3D Printing Gases Market, By End-User, 2019-2028 (USD MILLION)

TABLE 174 Mexico Industrial in 3D Printing Gases Market, By End-User, 2019-2028 (USD MILLION)

TABLE 175 Mexico Industrial in 3D Printing Gases Market, By Type, 2019-2028 (USD MILLION)

TABLE 176 Mexico Aerospace in 3D Printing Gases Market, By End-User, 2019-2028 (USD MILLION)

TABLE 177 Mexico Aerospace in 3D Printing Gases Market, By Type, 2019-2028 (USD MILLION)

TABLE 178 Mexico Automotive in 3D Printing Gases Market, By End-User, 2019-2028 (USD MILLION)

TABLE 179 Mexico Automotive in 3D Printing Gases Market, By Type, 2019-2028 (USD MILLION)

TABLE 180 Mexico Consumer Goods in 3D Printing Gases Market, By End-User, 2019-2028 (USD MILLION)

TABLE 181 Mexico Consumer Goods in 3D Printing Gases Market, By Type, 2019-2028 (USD MILLION)

TABLE 182 Mexico Medical in 3D Printing Gases Market, By End-User, 2019-2028 (USD MILLION)

TABLE 183 Mexico Medical in 3D Printing Gases Market, By Type, 2019-2028 (USD MILLION)

TABLE 184 Mexico Building and Construction in 3D Printing Gases Market, By End-User, 2019-2028 (USD MILLION)

TABLE 185 Mexico Building and Construction in 3D Printing Gases Market, By Type, 2019-2028 (USD MILLION)

TABLE 186 Mexico Visual Art in 3D Printing Gases Market, By End-User, 2019-2028 (USD MILLION)

TABLE 187 Mexico Visual Art in 3D Printing Gases Market, By Type, 2019-2028 (USD MILLION)

TABLE 188 Mexico Food in 3D Printing Gases Market, By End-User, 2019-2028 (USD MILLION)

TABLE 189 Mexico Food in 3D Printing Gases Market, By Type, 2019-2028 (USD MILLION)

TABLE 190 Mexico Robotics in 3D Printing Gases Market, By Type, 2019-2028 (USD MILLION)

TABLE 191 Mexico Toys in 3D Printing Gases Market, By Type, 2019-2028 (USD MILLION)

TABLE 192 Mexico Jewellery in 3D Printing Gases Market, By Type, 2019-2028 (USD MILLION)

TABLE 193 Mexico Others in 3D Printing Gases Market, By Type, 2019-2028 (USD MILLION)

图片列表

FIGURE 1 North America 3D printing gases MARKET: segmentation

FIGURE 2 North America 3D printing gases MARKET: data triangulation

FIGURE 3 North America 3D printing gases MARKET: DROC ANALYSIS

FIGURE 4 North America 3D printing gases MARKET: regional vs COUNTRY MARKET analysis

FIGURE 5 North America 3D printing gases MARKET: company research analysis

FIGURE 6 North America 3D printing gases MARKET: THE TYPE LIFE LINE CURVE

FIGURE 7 MULTIVARIATE MODELLING FOR North America 3D printing gases MARKET

FIGURE 8 North America 3D printing gases MARKET: INTERVIEW DEMOGRAPHICS

FIGURE 9 North America 3D printing gases MARKET: DBMR MARKET POSITION GRID

FIGURE 10 North America 3D printing gases MARKET: MARKET end-user COVERAGE GRID

FIGURE 11 North America 3D printing gases MARKET: THE MARKET CHALLENGE MATRIX

FIGURE 12 North America 3D printing gases MARKET: vendor share analysis

FIGURE 13 North America 3D Printing Gases MARKET: SEGMENTATION

FIGURE 14 Rapid digitization in the chemical industry is expected to drive the North America 3D Printing Gases market in the forecast period of 2021 to 2028

FIGURE 15 Argon SEGMENT is expected to account for the largest share of the North America 3D Printing Gases MARKET in 2021 to 2028

FIGURE 16 DRIVERS, RESTRAINTS, OPPORTUNITIES AND CHALLENGES OF NORTH AMERICA 3D PRINTING GASES MARKET

FIGURE 17 Chemical sales OF TOP TEN COUNTRIES, 2018, USD billion

FIGURE 18 NORTH AMERICA 3D PRINTING GASES MARKET, BY Type, 2020

FIGURE 19 NORTH AMERICA 3D PRINTING GASES MARKET, BY technology, 2020

FIGURE 20 NORTH AMERICA 3D PRINTING GASES MARKET, BY material, 2020

FIGURE 21 NORTH AMERICA 3D PRINTING GASES MARKET, BY storage and distribution, 2020

FIGURE 22 NORTH AMERICA 3D PRINTING GASES MARKET, BY function, 2020

FIGURE 23 NORTH AMERICA 3D PRINTING GASES MARKET: BY END-USER, 2020

FIGURE 24 North America 3D printing gases MARKET: SNAPSHOT (2020)

FIGURE 25 North America 3D printing gases MARKET: by COUNTRY (2020)

FIGURE 26 North America 3D printing gases MARKET: by COUNTRY (2021 & 2028)

FIGURE 27 North America 3D printing gases MARKET: by COUNTRY (202o & 2028)

FIGURE 28 North America 3D printing gases MARKET: by TYPE (2021-2028)

FIGURE 29 North America 3D Printing Gases market: company share 2020 (%)

查看详细信息 Right Arrow

研究方法

Data collection and base year analysis are done using data collection modules with large sample sizes. The stage includes obtaining market information or related data through various sources and strategies. It includes examining and planning all the data acquired from the past in advance. It likewise envelops the examination of information inconsistencies seen across different information sources. The market data is analysed and estimated using market statistical and coherent models. Also, market share analysis and key trend analysis are the major success factors in the market report. To know more, please request an analyst call or drop down your inquiry.

The key research methodology used by DBMR research team is data triangulation which involves data mining, analysis of the impact of data variables on the market and primary (industry expert) validation. Data models include Vendor Positioning Grid, Market Time Line Analysis, Market Overview and Guide, Company Positioning Grid, Patent Analysis, Pricing Analysis, Company Market Share Analysis, Standards of Measurement, Global versus Regional and Vendor Share Analysis. To know more about the research methodology, drop in an inquiry to speak to our industry experts.

可定制

Data Bridge Market Research is a leader in advanced formative research. We take pride in servicing our existing and new customers with data and analysis that match and suits their goal. The report can be customized to include price trend analysis of target brands understanding the market for additional countries (ask for the list of countries), clinical trial results data, literature review, refurbished market and product base analysis. Market analysis of target competitors can be analyzed from technology-based analysis to market portfolio strategies. We can add as many competitors that you require data about in the format and data style you are looking for. Our team of analysts can also provide you data in crude raw excel files pivot tables (Fact book) or can assist you in creating presentations from the data sets available in the report.

Frequently Asked Questions

The North America 3D Printing Gases Market size will be worth USD 218.97 billion by 2031 during the forecast period.
The North America 3D Printing Gases Market growth rate is 32.9% during the forecast period.
The Growth in 3D Printing Industry Increases the Demand for Specialized Gases and 3D Printing Increases Prototyping in Aerospace and Automotive Industries are the growth drivers of the North America 3D Printing Gases Market.
The type, technology, material, storage and distribution, function and end-user are the factors on which the North America 3D Printing Gases Market research is based
The major companies in the North America 3D Printing Gases Market are DuPont (U.S.), NIPPON SANSO HOLDINGS CORPORATION (Japan), ExOne (U.S.), 3D Systems, Inc. (U.S.), Renishaw plc (U.K.), Universal Industrial Gases Inc. (U.S.), Messer SE & Co. KGaA (Germany), Bronkhorst (Netherlands), Stratasys (Israel), General Electric(U.S.), Höganäs AB (Sweden), GKN Powder Metallurgy(Germany), Equispheres (Canada), Sandvik AB (Sweden), Air Products and Chemicals, Inc.(U.S.), AIR LIQUIDE(France), Evonik Industries AG (Germany), BASF SE (Germany), Linde PLC (Ireland).