

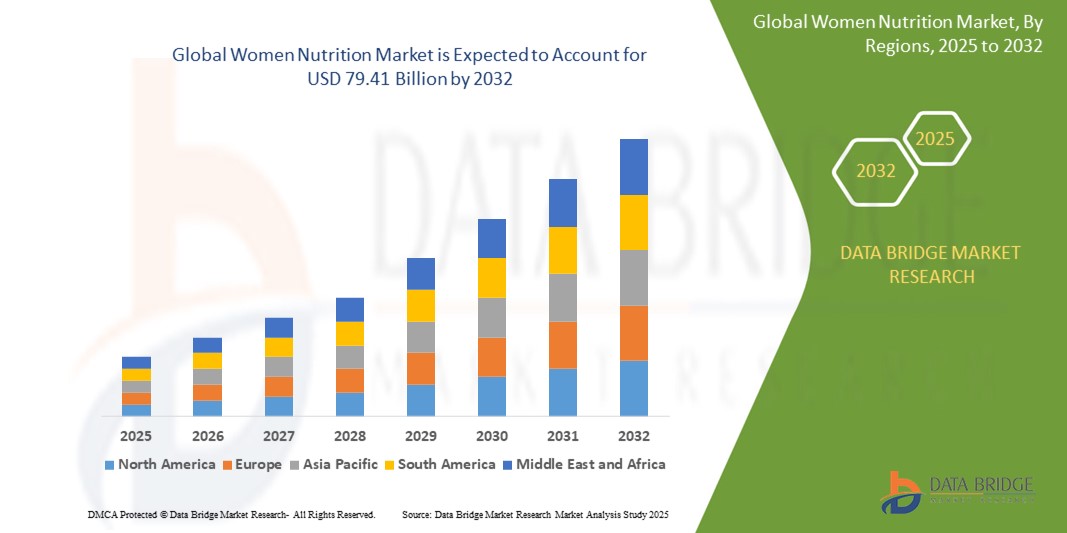
Global Women Nutrition Market
市场规模(十亿美元)
CAGR :
% 
 USD
50.20 Billion
USD
79.41 Billion
2024
2032
USD
50.20 Billion
USD
79.41 Billion
2024
2032
| 2025 –2032 | |
| USD 50.20 Billion | |
| USD 79.41 Billion | |
| % | |
|
全球女性營養市場細分,按類型(瑞士奶酪、山羊奶酪、磚塊奶酪、意大利乳清乾酪和新鮮馬蘇里拉奶酪)、分銷渠道(實體店和線上)、應用(餅乾、零食、湯、醬料等)——行業趨勢及 2032 年預測
全球女性營養市場規模和成長率是多少?
- 2024 年全球女性營養市場規模為502 億美元 ,預計 到 2032 年將達到 794.1 億美元,預測期內 複合年增長率為 5.90%。
- 勞動人口一直是食品飲料市場的驅動力,她們日益增長的營養意識和需求也為女性營養市場帶來了新的趨勢。這些女性勞動人口也意識到了新的營養需求,因此增加了營養產品的消費。
- 這些營養產品成本高的主要因素是與營養產品(如強化營養產品)消費相關的健康益處、人均收入的增加以及女性等生活方式的改變,這些因素預計將限製女性營養市場的成長
女性營養市場的主要內容是什麼?
- 隨著人們越來越意識到營養對整體健康和福祉的重要性,女性也越來越注重自己的飲食選擇。隨著人們的健康意識增強,營養在維持整體健康和福祉方面的重要性也得到了越來越多的認可。
- 透過網路、社群媒體和行動應用程式等各種媒體管道,健康相關資訊的激增,使人們能夠了解營養知識,並就飲食和生活方式做出明智的選擇。這種資訊的可近性促進了女性健康意識的提高。
- 對心臟健康的認識和關注不斷提高,促使消費者尋找符合其健康目標的產品,從而推動女性營養市場的發展,並鼓勵製造商擴大其在這一類別的產品供應
- 北美在女性營養市場佔據主導地位,2024 年其收入份額最大,為 38.57%,這得益於女性健康意識的增強、對預防性醫療保健解決方案的需求增加以及營養產品的廣泛普及
- 預計從 2025 年到 2032 年,歐洲的複合年增長率將達到 9.25%,這是最快的成長趨勢,這得益於對性別特定健康解決方案的日益關注、人口老齡化以及飲食習慣的不斷變化
- 膳食補充劑領域在女性營養市場佔據主導地位,2024 年市場收入份額最大,為 41.2%,這歸因於營養不良患病率的上升、預防保健意識的增強以及對便捷的健康促進產品的需求
報告範圍和女性營養市場細分
|
屬性 |
女性營養關鍵市場洞察 |
|
涵蓋的領域 |
|
|
覆蓋國家 |
北美洲
歐洲
亞太
中東和非洲
南美洲
|
|
主要市場參與者 |
|
|
市場機會 |
|
|
加值資料資訊集 |
除了對市場價值、成長率、細分、地理覆蓋範圍和主要參與者等市場情景的洞察之外,Data Bridge Market Research 策劃的市場報告還包括深入的專家分析、定價分析、品牌份額分析、消費者調查、人口統計分析、供應鏈分析、價值鏈分析、原材料/消耗品概述、供應商選擇標準、PESTLE 分析、波特分析和監管框架。 |
女性營養市場的主要趨勢是什麼?
“個人化和功能性營養需求不斷增長”
- 改變女性營養市場的一個主要趨勢是消費者對個人化補充劑和功能性食品的興趣日益濃厚,這些補充劑和食品旨在幫助女性平衡荷爾蒙、改善骨骼健康、增強生育能力和支持更年期
- 各大品牌正在推出富含膠原蛋白、鐵、葉酸、益生菌和維生素 D 的解決方案,針對青春期、懷孕和更年期等不同生命階段
- 例如,2024 年 3 月,雀巢健康科學在其「Persona Nutrition」平台下推出了一系列針對女性的新型複合維生素,提供人工智慧個人化方案
- 在社群媒體、數位健康工具和有影響力的倡議的支持下,女性對腸道健康、心理健康和免疫力的認識不斷提高,也加速了這一趨勢
- 康寶萊、達能和 GNC 等主要參與者正在將適應原和生物可利用營養素整合到其產品中,以增強能量、荷爾蒙支持和壓力抵抗能力
- 隨著對清潔標籤、植物基和符合道德標準的產品的需求不斷增長,女性營養市場正在迅速轉向整體健康和科學支持的創新
女性營養市場的主要驅動力是什麼?
- 隨著健康意識的增強以及骨質疏鬆症、貧血、多囊性卵巢症候群和甲狀腺失衡等疾病的盛行率不斷上升,女性開始採取有針對性的營養計劃
- 世界衛生組織 2023 年的一份報告強調,全球三分之一的女性患有缺鐵症,這推動了對強化食品和富含鐵的補充劑的需求
- 忙碌的生活方式、城市化以及預防性醫療保健的轉變,擴大了對符合現代日常生活習慣的即食補充劑的需求
- 網路普及率高且社群媒體參與度高,使得健康教育更加普及,鼓勵女性積極投資自身的營養需求
- 生育意識、孕產婦保健計劃以及促進婦女健康的政府舉措進一步推動了市場擴張,尤其是在亞太地區和拉丁美洲
哪些因素對女性營養市場的成長構成挑戰?
- 一個關鍵障礙是農村和欠發達地區缺乏針對性別的營養意識和教育,從而限制了產品的普及和消費
- 例如,儘管人們越來越重視,但根據聯合國兒童基金會 2024 年的一項研究,低收入國家只有 27% 的女性達到了建議的微量營養素攝取量
- 負擔能力仍然是一個主要問題,尤其是在新興市場,高端產品對於大部分人來說價格過高
- 此外,監管環境分散,缺乏標準化的健康聲明,常常導致消費者對產品功效產生懷疑
- 另一個挑戰是配方的複雜性,特別是對於必須平衡功效、適口性和貨架穩定性的天然或純素產品
- 透過教育活動、可負擔的創新和清晰的標籤來克服這些限制對於可持續的市場成長至關重要
女性營養市場如何區隔?
市場根據類型、產品、劑型、人群類型、處方方式、應用和分銷管道進行細分。
• 依類型
根據類型,女性營養市場細分為運動營養、膳食補充劑、個人化營養和其他。膳食補充劑在女性營養市場中佔據主導地位,2024 年市場收入份額最高,達到 41.2%,這得益於營養不良患病率的上升、預防性保健意識的增強以及對便捷健康產品的需求。
個人化營養領域預計將在 2025 年至 2032 年期間實現最快的複合年增長率 18.6%,這得益於營養基因組學的進步以及消費者對基於遺傳、生活方式和代謝因素的定制健康解決方案的興趣日益濃厚。
• 按產品
根據產品類型,市場細分為維生素、蛋白質、礦物質、液體、益生菌、Omega 3 和其他。 2024 年,維生素佔了 29.7% 的主導市場份額,這得益於其在解決營養缺陷、增強免疫力以及改善不同年齡層女性生殖和骨骼健康方面的應用日益增多。
由於益生菌與腸道健康、荷爾蒙平衡和免疫支持的關聯日益密切,預計其在預測期內將達到最高成長率。
• 以劑型
根據劑型,市場分為固體和液體兩類。固體劑型(包括片劑、膠囊和粉末)在2024年佔據最大份額,達67.8%,這得益於更長的保質期、更便捷的包裝以及消費者對傳統補充劑形式的偏好。
受老年人和孕婦群體尋求更便捷的消費方式的需求不斷增長的推動,液體飲料細分市場將以最快的速度擴張。
• 依人口類型
根據人口類型,市場細分為成年人和孕婦。 2024年,成年人群體佔據最大份額,達到73.4%,這歸因於人們意識的提高、職業女性人口的增加以及生活方式相關疾病的流行。
由於全球越來越重視產前和產後營養護理,孕婦市場預計將快速成長。
• 依處方方式
根據處方方式,市場分為處方藥和非處方藥 (OTC)。非處方藥 (OTC) 市場佔據主導地位,2024 年市場份額為 62.1%,這得益於其易於獲取、產品種類不斷擴展以及女性自我藥療趨勢的日益增長。
處方藥領域在妊娠糖尿病和產後恢復等高風險病例的臨床級補充劑方面越來越受歡迎。
• 按應用
根據應用領域,市場細分為能量與體重管理、骨骼與關節健康、免疫力、心臟健康、糖尿病、胃腸道健康、眼科疾病、神經系統疾病及其他。 2024年,能量與體重管理領域佔據最大份額,達到24.3%,這主要得益於肥胖率上升、人們對身體健康的關注度增加以及富含蛋白質的營養產品的普及。
骨骼和關節健康領域預計將以最快的速度成長,尤其是對於需要更高鈣和維生素 D 攝取量的老年婦女和停經後族群。
• 按分銷管道
根據分銷管道,市場細分為大賣場/超市、藥局/藥局、專賣店、線上及其他。藥局/藥局憑藉其值得信賴的專業醫療建議、處方藥和非處方藥的供應以及在城市和半城市地區的強勁影響力,在2024年佔據了34.5%的市場份額,佔據了主導地位。
在數位健康平台、不斷增長的互聯網普及率以及提供基於訂閱的個人化營養的直接面向消費者的營養品牌的支持下,在線領域預計將以最高的複合年增長率增長。
哪個地區佔據女性營養市場的最大份額?
- 北美在女性營養市場佔據主導地位,2024 年其收入份額最大,為 38.57%,這得益於女性健康意識的增強、對預防性醫療保健解決方案的需求增加以及營養產品的廣泛普及
- 該地區受益於主要參與者的強大影響力、完善的零售網絡,以及針對懷孕、更年期和衰老等不同生命階段的個人化營養解決方案的日益增長的趨勢
- 在美國和加拿大等國家,慢性病盛行率上升、運動營養趨勢增強以及可支配收入水平提高,持續推動了產品的採用
美國女性營養市場洞察
2024年,美國女性營養市場佔據北美最大的收入份額,這得益於消費者對整體健康和針對性營養補充劑日益增長的興趣。產前、產後和更年期營養支持的需求不斷增長,以及軟糖、粉劑和即飲型產品等便利的配送方式,推動了這個市場的成長。電子商務滲透率的提高、名人健康代言的興起,以及植物基配方和清潔標籤產品的創新,進一步增強了市場的成長動能。
歐洲女性營養市場洞察
預計歐洲女性營養市場在預測期內將實現顯著的複合年增長率,這得益於人們對性別特定營養需求的認識不斷提高,以及對有機和益生菌補充劑需求的激增。人們對荷爾蒙健康、體重管理和免疫力的日益關注,尤其是在職業女性和老年人群體中,正在推動女性營養的普及。德國、法國和英國等國家憑藉著先進的醫療基礎設施和優質的產品,在這一領域處於領先地位。
英國女性營養市場洞察
英國女性營養市場預計將以顯著的複合年增長率擴張,這得益於促進女性健康的公共衛生運動以及「健康起步」等倡議和英國國家醫療服務體系 (NHS) 支持的補充劑指南。市場對純素、非基因改造以及針對皮膚、骨骼和生殖健康的功能性補充劑的需求正在增長。零售合作夥伴關係以及圍繞圍絕經期和生育營養的認知度的提升,進一步支持了市場擴張。
德國女性營養市場洞察
德國女性營養市場預計將強勁成長,這得益於消費者對清潔標籤和科學支持的補充劑日益增長的興趣。城市女性正在採用蛋白質、維生素和益生菌混合物來管理與生活方式相關的疾病,並支持積極老化。當地製造商和藥局正在擴大其女性健康產品組合,以滿足日益增長的個人化健康解決方案需求。
哪個地區的女性營養市場成長最快?
預計歐洲在2025年至2032年間的複合年增長率將達到9.25%,為全球最高。這得益於人們對性別健康解決方案的日益關注、人口老化以及飲食習慣的不斷變化。對非荷爾蒙更年期補充劑、產前營養品和免疫增強劑的旺盛需求,正在塑造義大利、西班牙和北歐等國家的市場發展動能。支持性法規、臨床營養方面的投資以及環保包裝和數位健康平台的創新,進一步促進了區域成長。
法國女性營養市場洞察
隨著健康成為女性生活方式選擇中不可或缺的一部分,法國女性營養市場正日益受到關注。產後護理、荷爾蒙平衡和骨骼健康的意識日益增強,推動了對天然和有機補充劑的需求。藥局主導的零售通路、強大的網紅行銷以及向訂閱式營養服務的轉變也推動了該市場的發展。
義大利女性營養市場洞察
在義大利女性營養市場,針對女性需求的地中海飲食營養產品正日益受到青睞。越來越多的女性選擇膠原蛋白勝肽、歐米伽-3 補充劑以及平衡荷爾蒙的草本配方來延緩衰老並保持日常健康。透過線上藥局和保健食品店,產品可近性不斷提升,消費者的參與度和忠誠度也隨之提升。
女性營養市場頂尖公司有哪些?
女性營養產業主要由知名公司主導,包括:
- 雅培(美國)
- Optimum Nutrition, Inc.(美國)
- GNC控股有限公司(美國)
- 安麗(美國)
- ADM(美國)
- Hamilton Thorne Health Solutions(美國)
- 拜耳公司(美國)
- 達能(法國)
- BHI 生物健康國際股份有限公司(奧地利)
- NOW Foods:(美國)
- Swisse Wellness PTY LTD(澳洲)
- Gaia Herbs(美國)
- 聯合利華(英國)
- 雀巢(瑞士)
- La Nature's(印度)
- 美國康寶萊國際公司(美國)
- 葛蘭素史克公司(英國)
- 通用磨坊公司(美國)
- 家樂氏公司(美國)
全球女性營養市場的最新發展是什麼?
- 2025年1月,拜耳消費者保健公司帶著CanesMeno產品進軍英國更年期市場,提供一系列經科學驗證的產品以及數位教育資源,幫助約1,300萬圍絕經期和更年期女性有效管理自身症狀。此次產品發表將增強拜耳在歐洲女性健康領域的影響力。
- 2025年4月,Tranont推出了一系列全新女性健康補充劑,專注於增強肌肉力量、提升能量並平衡荷爾蒙。該產品系列包括一款含EstroG-100和南非醉茄的更年期支持配方、一款易於消化的清澈乳清蛋白,以及一款專為30歲以上因年齡增長而肌肉衰退的女性設計的肌酸補充劑。此次產品線的拓展進一步強化了Tranont對女性整體健康的承諾。
- 2025年1月,GNC推出了Premier Collagen,這是一款美容補充劑系列,包含兩種特殊配方和多種劑型,旨在促進肌膚年輕化,由內而外展現整體美感。此舉標誌著GNC進軍日益壯大的「由內而外美」營養保健品市場。
- 2024年9月,大塚製藥株式會社與Bonafide Health, LLC在美國聯合推出了Thermella,這是一款旨在支持女性更年期健康的植物性補充劑,透過Bonafide Health的數位平台獨家發售。此次合作彰顯了兩家公司致力於以自然的方式解決荷爾蒙健康問題的決心。
- 2020年10月,Oziva推出了HerBones,這是一款100%植物性純素補充劑,旨在強健骨骼、促進關節健康並平衡女性荷爾蒙。這款產品專為25歲及以上女性設計,尤其適合鈣缺乏的女性,進一步鞏固了Oziva對預防性女性健康解決方案的重視。
SKU-
Get online access to the report on the World's First Market Intelligence Cloud

- Interactive Data Analysis Dashboard
- Company Analysis Dashboard for high growth potential opportunities
- Research Analyst Access for customization & queries
- Competitor Analysis with Interactive dashboard
- Latest News, Updates & Trend analysis
- Harness the Power of Benchmark Analysis for Comprehensive Competitor Tracking
研究方法
数据收集和基准年分析是使用具有大样本量的数据收集模块完成的。该阶段包括通过各种来源和策略获取市场信息或相关数据。它包括提前检查和规划从过去获得的所有数据。它同样包括检查不同信息源中出现的信息不一致。使用市场统计和连贯模型分析和估计市场数据。此外,市场份额分析和关键趋势分析是市场报告中的主要成功因素。要了解更多信息,请请求分析师致电或下拉您的询问。
DBMR 研究团队使用的关键研究方法是数据三角测量,其中包括数据挖掘、数据变量对市场影响的分析和主要(行业专家)验证。数据模型包括供应商定位网格、市场时间线分析、市场概览和指南、公司定位网格、专利分析、定价分析、公司市场份额分析、测量标准、全球与区域和供应商份额分析。要了解有关研究方法的更多信息,请向我们的行业专家咨询。
可定制
Data Bridge Market Research 是高级形成性研究领域的领导者。我们为向现有和新客户提供符合其目标的数据和分析而感到自豪。报告可定制,包括目标品牌的价格趋势分析、了解其他国家的市场(索取国家列表)、临床试验结果数据、文献综述、翻新市场和产品基础分析。目标竞争对手的市场分析可以从基于技术的分析到市场组合策略进行分析。我们可以按照您所需的格式和数据样式添加您需要的任意数量的竞争对手数据。我们的分析师团队还可以为您提供原始 Excel 文件数据透视表(事实手册)中的数据,或者可以帮助您根据报告中的数据集创建演示文稿。

