

Global Surface Analysis Market
市场规模(十亿美元)
CAGR :
% 
 USD
6.10 Billion
USD
8.68 Billion
2024
2032
USD
6.10 Billion
USD
8.68 Billion
2024
2032
| 2025 –2032 | |
| USD 6.10 Billion | |
| USD 8.68 Billion | |
| % | |
|
全球表面分析市場,按技術(顯微鏡、光譜、X 射線衍射 (XRD) 和表面分析儀)、類型(XPS (X 射線光電子能譜)、TOF-SIMS (飛行時間二次離子質譜)、AES (俄歇電子能譜)、拉曼(拉曼光譜)、UPS (紫外光電子顯微鏡)、ISS (ISS) 等離子光譜方法(模式結構和顯微鏡類型) (SPM)/原子力顯微鏡 (AFM)、電子探針微分析儀 (EPMA)、X 射線光電子能譜儀 (XPS)/化學分析電子能譜 (ESCA) 等)、應用(材料組成、表面粗糙度和形貌、薄膜分析、表面污染、故障分析、腐蝕分析和表面改性)、最終用戶(研究機構和學術趨勢
表面分析市場分析
全球表面分析市場正經歷顯著成長,這得益於半導體、製藥和航空航太等產業對精確材料表徵日益增長的需求。該市場涵蓋X射線光電子能譜 (XPS)、原子力顯微鏡 (AFM) 和二次離子質譜 (SIMS) 等先進技術,這些技術能夠實現詳細的表面成分和結構分析。人工智慧驅動的數據解讀、混合分析技術和自動化等技術進步正在提高準確性和效率。研發投入的增加、奈米技術應用的不斷拓展以及材料品質和安全監管要求的不斷提高,進一步推動了該市場的發展。
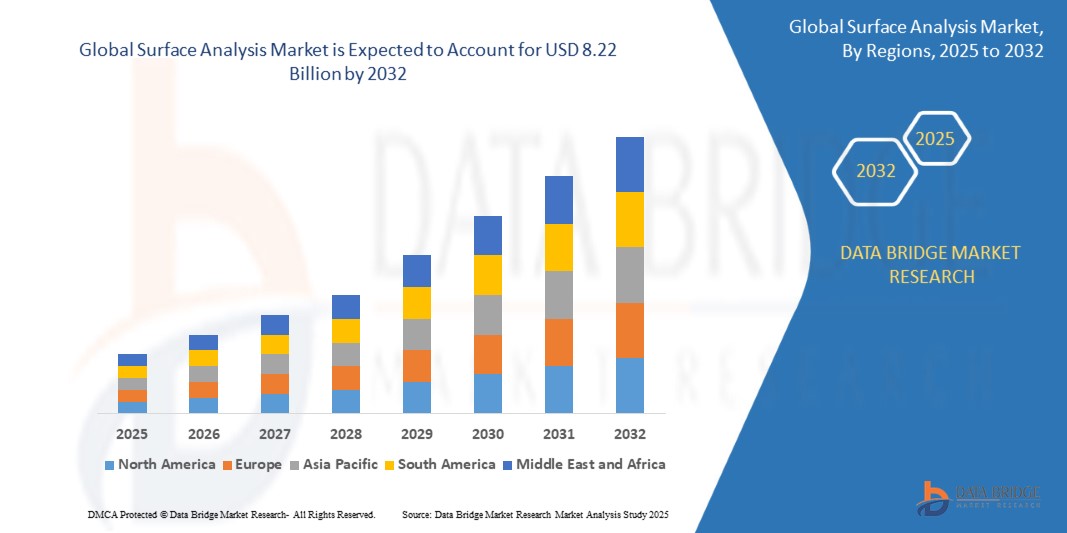
表面分析市場規模
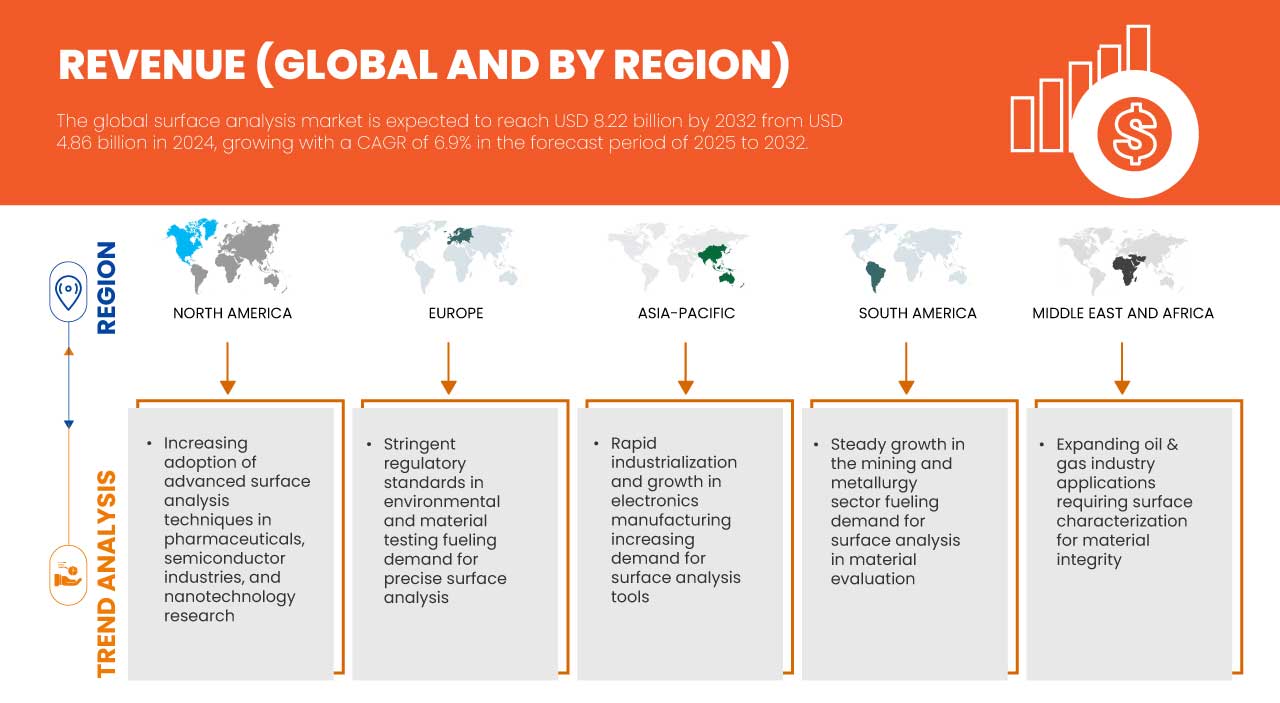
2024 年全球表面分析市場規模為 48.6 億美元,預計到 2032 年將達到 82.2 億美元,預測期內(2025 年至 2032 年)的複合年增長率為 6.9%。除了對市場價值、成長率、細分、地理覆蓋範圍和主要參與者等市場情景的洞察外,Data Bridge Market Research 策劃的市場報告還包括深入的專家分析、進出口分析、定價分析、生產消費分析和杵分析。
表面分析市場趨勢
“對高精度材料表徵的需求不斷增長”
對高精度材料表徵日益增長的需求推動了表面分析市場的進步。半導體、製藥和航空航天等行業需要更精確、更可靠的表面評估技術,以確保產品品質和性能。光譜學、顯微鏡學和質譜學的創新正在增強分析能力,以實現即時、深入的表面評估。此外,自動化和人工智慧驅動的資料處理正在提高效率、減少錯誤並加速研發進程。隨著材料完整性和安全性監管標準的日益嚴格,先進表面分析技術的應用預計將不斷增長,從而鞏固其在各個高科技領域的關鍵作用。
報告範圍和表面分析市場細分
|
屬性 |
表面分析關鍵市場洞察 |
|
涵蓋的領域 |
|
|
覆蓋國家 |
美國、加拿大、墨西哥、英國、德國、法國、義大利、西班牙、俄羅斯、荷蘭、瑞士、比利時、土耳其、盧森堡、歐洲其他地區、中國、日本、印度、韓國、澳洲、紐西蘭、新加坡、馬來西亞、泰國、印尼、菲律賓、台灣、越南、亞太其他地區、巴西、阿根廷、南美洲其他地區和阿聯酋、沙烏地阿拉伯、南非、埃及、以色列、中東和非洲其他地區 |
|
主要市場參與者 |
SERMA GROUP(法國)、島津製作所(日本)、Eurofins Scientific(盧森堡)、賽默飛世爾科技公司(美國)、SAI Ltd(英國)、SPECS GmbH(德國)、Physical Electronics, Inc. (PHI)(美國)、Staib Instruments(德國)、Hiden Ana.(德國) Ltd(日本)、卡爾蔡司股份公司(德國)、TESCAN GROUP, as(捷克共和國)、TSI(美國)和尼康儀器公司(美國) |
|
市場機會 |
|
|
加值資料資訊集 |
除了對市場價值、成長率、細分、地理覆蓋範圍和主要參與者等市場情景的洞察之外,Data Bridge Market Research 策劃的市場報告還包括深度專家分析、患者流行病學、管道分析、定價分析和監管框架。 |
表面分析市場定義
表面分析是研究材料最外層,以確定其成分、結構、粗糙度和化學性質的技術。它涉及X射線光電子能譜 (XPS)、原子力顯微鏡 (AFM) 和二次離子質譜 (SIMS) 等先進技術,用於在微觀和原子層面分析表面。表面分析在半導體、製藥、航空航太和奈米技術等行業中至關重要,因為這些行業的材料特性會顯著影響其性能和可靠性。透過提供對錶面特性的詳細洞察,此類分析有助於提高產品品質、優化製造流程並確保符合監管標準。
表面分析市場動態
驅動程式
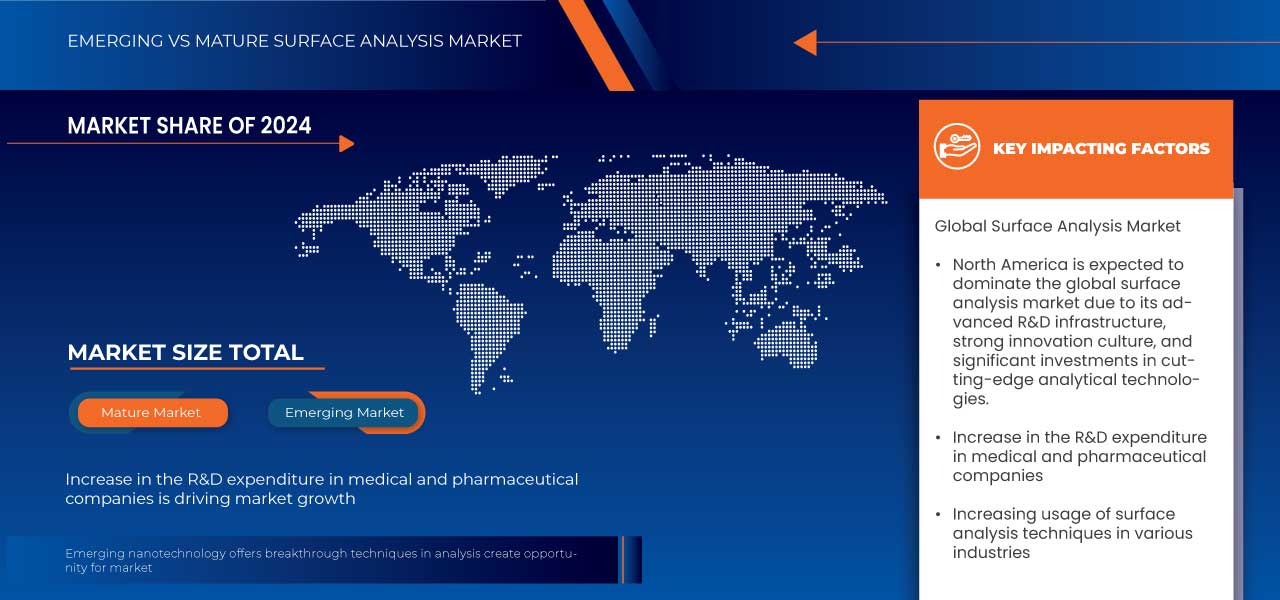
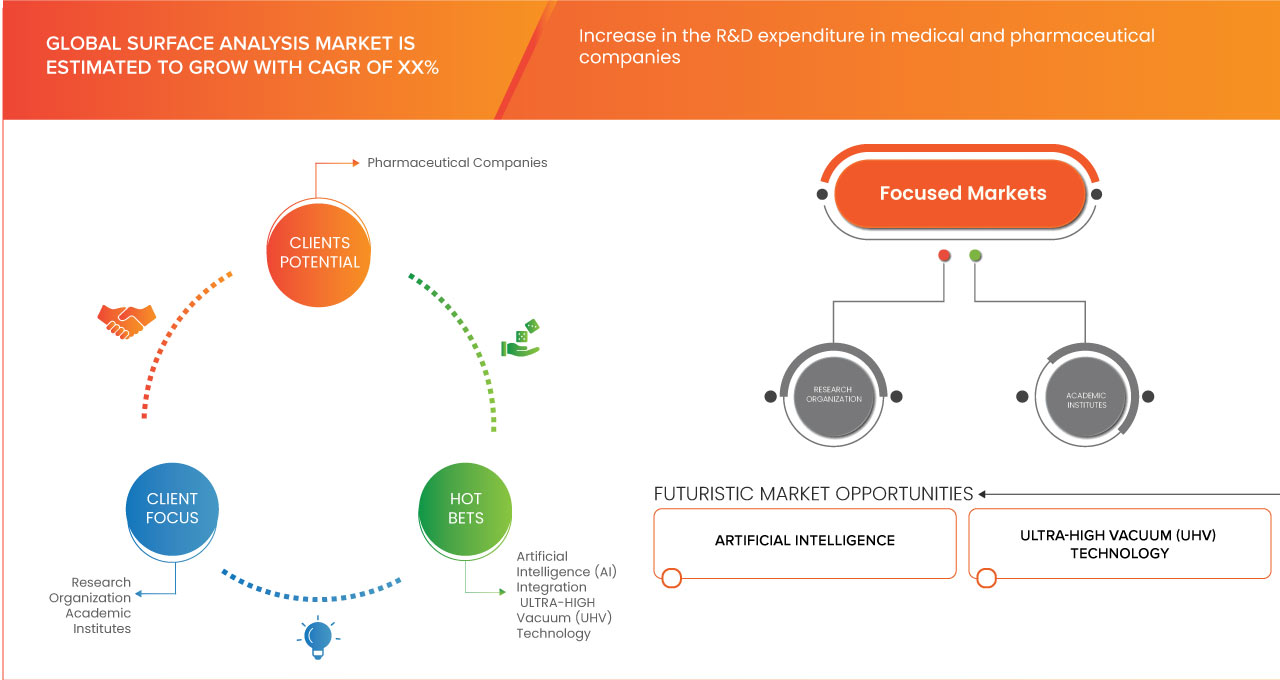
- 醫藥企業研發支出增加
由於這些行業專注於開發創新藥物和醫療器械,精確的表面表徵對於確保產品品質和法規合規性至關重要。研發支出的激增加速了表面分析的創新,並拓寬了其在關鍵醫療保健領域的應用。此外,資金的增加也促進了分辨率和靈敏度更高的先進分析儀器的開發。這些進步使公司能夠滿足嚴格的監管標準,同時促進產品開發領域的突破性研究。
例如,
- 根據德勤於2024年4月發表的文章,全球製藥公司的研發投資報酬率在2023年上升至4.1%,從歷史低點回升。受複雜試驗和監管變化的推動,全球排名前20的製藥公司在研發上的支出達1,450億美元。創新的推動導致在品質控制和製程優化方面的投資增加。因此,包括表面分析在內的先進分析技術在確保藥物安全性和性能方面的重要性日益凸顯,從而推動了表面分析市場的成長。
表面分析方法的應用日益廣泛
表面分析方法的整合可透過精確檢測表面缺陷並確保一致性來優化製造流程。這種廣泛的應用凸顯了表面分析工具的多功能性,並推動了其在各種工業應用中的市場成長。此外,技術進步降低了營運成本,使這些技術更容易被更廣泛的行業所採用。使用者友善軟體的不斷發展進一步增強了資料解讀和製程控制,從而提升了整體效率。
例如,
根據愛思唯爾公司發表的文章,2025年3月,研究人員利用人工智慧增強型X射線顯微鏡對無定形固體分散體中的結晶咪康唑進行了無損檢測和定量分析。他們將先進的成像技術與人工智慧輔助分割技術相結合,以獲得詳細的粒度分佈並減少人為錯誤。這項技術改善了藥品生產的品質控制,並顯示出對精確表面分析的顯著優勢,預計將推動全球表面分析市場的成長。
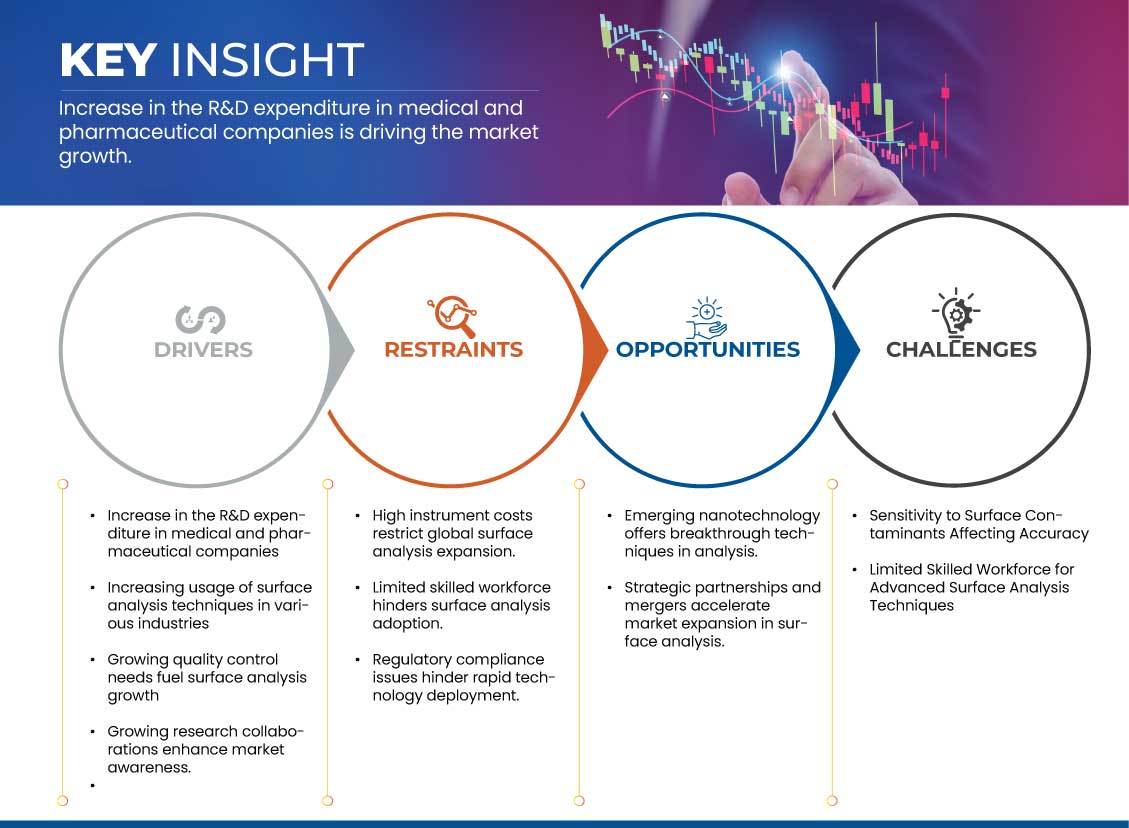
機會
- 新興奈米技術為分析帶來突破性技術
新興奈米技術推動著創新,它實現了原子和分子層面的分析,提供了前所未有的分辨率和精度。這項進步使得檢測和表徵先前傳統方法無法實現的微小表面特徵成為可能。隨著這些基於奈米技術的技術的不斷發展,它們為材料科學和品質控制開闢了新的可能性,推動了各行各業表面分析應用的成長。
例如: -
- 2024年6月,根據施普林格·自然有限公司發表的文章,研究人員利用先進的環境掃描電子顯微鏡(A-ESEM)揭示了濃縮有絲分裂染色體的自然奈米形態。他們應用機器學習最佳化條件,實現了對敏感濕潤樣品的高解析度成像,且不會造成傷害。這項突破使得人們能夠發現染色體表面先前未觀察到的結構細節。該研究表明,奈米技術為推動表面分析市場發展提供了重要機會。
策略合作與合併加速市場擴張
策略夥伴關係與併購將互補的專業知識和資源結合,創造協同效益,推動市場成長。這些合作透過利用共享技術、客戶網路和市場洞察,簡化了先進表面分析技術的開發和部署。因此,企業可以縮短產品上市時間,擴大全球影響力,並更有效地應對不斷變化的產業挑戰,最終加速表面分析市場的整體擴張。
例如,
2025年2月,根據Cision US Inc.發表的文章報道,Nanovis宣布美敦力收購了部分奈米表面技術資產,包括與OsteoSync鈦合金墊相關的智慧財產權,用於其下一代PEEK椎間融合器。這項經FDA批准的奈米技術改善了骨整合,增強了脊椎手術中植入物的固定效果。此次策略性收購凸顯了合作與併購如何透過將先進的奈米級創新與領先的醫療器材設計相結合來加速表面分析市場的擴張。此次合作可望為外科醫生提供一流的設備,進一步推動醫療植入物領域的創新和市場成長。
限制/挑戰
- 對錶面污染物的敏感度影響精準度
X射線光電子能譜 (XPS)、俄歇電子能譜 (AES) 和飛行時間二次離子質譜 (ToF-SIMS) 等技術對錶面高度敏感,這意味著來自環境、操作或樣品製備的污染可能會引入誤差。這項挑戰在半導體、製藥和先進材料等行業尤其重要,因為精確的表面成分分析對於品質控制和法規遵循至關重要。解決這些問題需要嚴格的樣品處理方案、受控的環境和先進的清潔技術,以最大限度地減少不必要的表面變化。
此外,奈米技術和生物材料研究對高解析度和定量表面分析的需求日益增長,這也加劇了改善污染控制措施的必要性。為了減輕污染物的影響,人們正在探索各種創新解決方案,例如超高真空 (UHV) 條件、離子濺鍍等原位清潔技術以及先進的資料校正演算法。然而,這些方法可能會增加分析過程的複雜性和成本,從而給其廣泛應用帶來挑戰,尤其是在小型研究實驗室和新興產業。隨著表面分析技術的發展,自動化、即時污染檢測和機器學習驅動的校正技術的進步將成為提高各種應用的準確性和可靠性的關鍵。
例如
根據XPS計量技術,表面污染會影響材料性能、塗層和附著力,通常會導致腐蝕和降解。油、鹽和大氣污染物等污染物會幹擾表面分析結果,尤其是在XPS中,即使是奈米厚度的塗層也會影響精確度。在航空航太和半導體製造等行業中,操作規範、手套和清潔噴霧會進一步影響測量可靠性。
- 缺乏掌握先進表面分析技術的熟練勞動力
XPS、SIMS 和 AFM 等技術需要儀器操作、數據解析和樣品製備方面的專業知識,這些知識對於獲得精確可靠的結果至關重要。缺乏訓練有素的專業人員會導致效率低下、數據品質不穩定以及分析時間延長,最終影響依賴表面表徵的研究、品質控制和工業應用。
例如:
2020年1月,根據美國國家醫學圖書館的數據,X射線光電子能譜 (XPS) 已成為應用最廣泛的表面分析技術,但由於缺乏熟練的專業人員,其快速普及也導致誤用頻傳。許多缺乏經驗的使用者難以進行準確的測量和數據解讀,從而導致錯誤和不一致。儀器校準的差異進一步加劇了這個過程的複雜性,缺乏訓練有素的專業人員是表面分析市場面臨的關鍵挑戰,影響了結果的可靠性和可重複性。
本市場報告詳細介紹了最新發展動態、貿易法規、進出口分析、生產分析、價值鏈優化、市場份額、國內和本地市場參與者的影響,並分析了新興收入來源、市場法規變化、戰略市場增長分析、市場規模、品類市場增長、應用領域和主導地位、產品審批、產品發布、地域擴張以及市場技術創新等方面的機遇。如需了解更多市場信息,請聯繫 Data Bridge 市場研究部門獲取分析師簡報,我們的團隊將協助您做出明智的市場決策,實現市場成長。
表面分析市場範圍
全球表面分析市場根據產品、部署模式、組織規模、作業系統和應用細分為五個顯著的細分市場。這些細分市場的成長將有助於您分析行業中成長乏力的細分市場,並為用戶提供有價值的市場概覽和市場洞察,幫助他們做出策略決策,從而確定核心市場應用。
科技
- 顯微鏡
- 依方法
- 電子顯微鏡
- 光學顯微鏡
- 共聚焦顯微鏡
- 探針顯微鏡
- 依技術
- 掃描電子顯微鏡(Sem)
- 透射電子顯微鏡(Tem)
- 掃描探針顯微鏡(Spm)
- 影像分析
- 低溫電子顯微鏡(Cryo-Em)
- 其他的
- 依方法
- 光譜學
- X射線衍射(Xrd)
- 表面分析儀
類型
- Xps(X射線光電子能譜)
- Tof-Sims(飛行時間二次離子質譜法)
- AES(俄歇電子能譜)
- 拉曼(拉曼光譜)
- UPS(紫外光電子能譜)
- Iss(離子散射光譜)
- 其他的
方法類型
- 光譜法
- 顯微鏡法
- 經典方法
設備類型
- 掃描探針顯微鏡(Spm)/原子力顯微鏡(Afm)
- 按操作
- 自動的
- 手動的
- 按噪音水平
- 低的
- 極低
- 標準
- 按操作
- 電子探針微分析儀(Epma)
- X射線光電子能譜儀(Xps)/化學分析電子能譜儀(Esca)
- 其他的
應用
- 材料成分
- 表面粗糙度和形貌
- 薄膜分析
- 表面污染
- 故障分析
- 腐蝕分析
- 表面改性
最終用戶
- 產業
- 按類型
- 半導體
- 生命科學與製藥
- 聚合物
- 活力
- 冶金礦產
- 汽車
- 食品和飲料
- 紡織品
- 紙張和包裝
- 其他的
- 依技術
- 顯微鏡
- 光譜學
- X射線衍射(Xrd)
- 表面分析儀
- 按類型
- 研究組織
- 顯微鏡
- 光譜學
- X射線衍射(Xrd)
- 表面分析儀
- 學術機構
- 顯微鏡
- 光譜學
- X射線衍射(XRD)
- 表面分析儀

表面分析市場區域分析
對市場進行分析,並按技術、類型、方法類型、設備類型、應用和最終用戶提供市場規模洞察和趨勢。
市場涵蓋的國家包括美國、加拿大、墨西哥、英國、德國、法國、義大利、西班牙、俄羅斯、荷蘭、瑞士、比利時、土耳其、盧森堡、歐洲其他地區、中國、日本、印度、韓國、澳洲、紐西蘭、新加坡、馬來西亞、泰國、印尼、菲律賓、台灣、越南、亞太其他地區、巴西、阿根廷、其他地區、阿聯酋、沙烏地阿拉伯、其他非洲、以色列、以色列、中東、其他地區、英國、以色列、中國、英國、以色列。
北美憑藉其先進的研發基礎設施、強大的創新文化以及對尖端分析技術的大量投資,預計將在全球表面分析市場中佔據主導地位。該地區在航空航太、醫療保健、汽車和電子等領域擁有成熟的產業基礎,推動對精確品質控制和材料表徵的迫切需求。強大的產學合作和支持性監管框架進一步促進了技術應用。
由於領先的科技公司、對研發的強大投資、先進的半導體和奈米技術產業以及醫療保健、電子和材料科學等各個領域對尖端分析技術的廣泛採用,北美有望成為全球表面分析市場中成長最快的地區。
報告的國家部分還提供了各個市場的影響因素以及國內市場監管變化,這些變化會影響市場的當前和未來趨勢。下游和上游價值鏈分析、技術趨勢、波特五力模型分析以及案例研究等數據點是預測各國市場狀況的一些指標。此外,在對國家/地區數據進行預測分析時,還考慮了南美品牌的存在和供應情況,以及它們因本土和國內品牌的激烈競爭或稀缺而面臨的挑戰,以及國內關稅和貿易路線的影響。
表面分析市佔率
市場競爭格局按競爭對手提供詳細資料。詳細資訊包括公司概況、公司財務狀況、收入、市場潛力、研發投入、新市場計劃、南美業務、生產基地和設施、生產能力、公司優勢和劣勢、產品發布、產品寬度和廣度以及應用主導地位。以上提供的數據點僅與公司在市場中的重點相關。
在市場上運作的表面分析市場領導者有:
- SERMA集團(法國)
- 島津製作所(日本)
- Eurofins Scientific(盧森堡)
- 賽默飛世爾科技公司(美國)
- SAI有限公司(英國)
- SPECS GmbH(德國)
- Physical Electronics, Inc.(PHI)(美國)
- Staib Instruments(德國)
- Hiden Analytical(英國)
- 布魯克(美國)
- HORIBA集團(日本)
- JEOL株式會社(日本)
- 卡爾蔡司股份公司(德國)
- TESCAN GROUP, as(捷克共和國)
- TSI(美國)
- 尼康儀器公司(美國)
全球表面分析市場的最新發展
- 2025年1月,歐陸環境測試公司伊頓分析公司開發了一種先進的方法,用於檢測飲用水中新發現的消毒副產物氯硝酰胺陰離子,從而提升了水質分析和安全性。這項進展增強了歐陸科學公司在表面和化學分析方面的專業知識,提高了其識別和評估污染物的能力,進一步鞏固了其在水和環境安全分析測試領域的領先地位。
- 2022年7月,ULVAC-PHI推出了PHI GENESIS,這是一款全自動XPS/HAXPES系統,專為高速、高靈敏度的表面和介面分析而設計。這項進步增強了Physical Electronics, Inc.在金屬、半導體、陶瓷和有機材料方面的自動化程度、靈敏度和分析能力,從而鞏固了其市場地位。
- 2024年7月,島津公司與TESCAN集團攜手,今年秋季在日本推出TESCAN的掃描電子顯微鏡,進一步拓展其分析測量產品線。此次合作將TESCAN先進的SEM技術與島津現有的儀器結合,增強其表面分析能力,從而實現更精確、更全面的材料表徵。
- 2024年7月,LAB14 GmbH旗下的FOCUS GmbH和SPECS Surface Nano Analysis GmbH合併為SPECS Surface Nano Analysis GmbH,同時保留各自的品牌標誌。此次合併將整合FOCUS GmbH在動量顯微鏡和電子能譜方面的專業知識,並增強SPECS GmbH的表面分析能力,進而提供更精準、更全面的研究解決方案。
- 2025年2月,賽默飛世爾科技將以41億美元收購Solventum的純化與過濾業務,以鞏固其在不斷擴張的生物加工市場中的地位。此次收購將增強賽默飛世爾的過濾和純化能力,增強XPS和光譜等表面分析技術的樣品製備能力,進而提高材料表徵的精確度和效率。
SKU-
Get online access to the report on the World's First Market Intelligence Cloud

- Interactive Data Analysis Dashboard
- Company Analysis Dashboard for high growth potential opportunities
- Research Analyst Access for customization & queries
- Competitor Analysis with Interactive dashboard
- Latest News, Updates & Trend analysis
- Harness the Power of Benchmark Analysis for Comprehensive Competitor Tracking
目录
1 INTRODUCTION
1.1 OBJECTIVES OF THE STUDY
1.2 MARKET DEFINITION
1.3 OVERVIEW OF GLOBAL SURFACE ANALYSIS MARKET
1.4 CURRENCY AND PRICING
1.5 LIMITATIONS
1.6 MARKETS COVERED
2 MARKET SEGMENTATION
2.1 MARKETS COVERED
2.2 GEOGRAPHICAL SCOPE
2.3 YEARS CONSIDERED FOR THE STUDY
2.4 DBMR TRIPOD DATA VALIDATION MODEL
2.5 PRIMARY INTERVIEWS WITH KEY OPINION LEADERS
2.6 DBMR MARKET POSITION GRID
2.7 MULTIVARIATE MODELING
2.8 THECNOLOGY TIMELINE CURVE
2.9 MARKET APPLICATION COVERAGE GRID
2.1 SECONDARY SOURCES
2.11 ASSUMPTIONS
3 EXECUTIVE SUMMARY
4 PREMIUM INSIGHTS
4.1 INDUSTRY ANALYSIS & FUTURISTIC SCENARIO
4.1.1 SURFACE ANALYSIS IN THE SEMICONDUCTOR INDUSTRY
4.1.2 SURFACE ANALYSIS IN THE ACADEMIC INSTITUTES
4.1.3 SURFACE ANALYSIS IN THE RESEARCH ORGANIZATIONS
4.2 PENETRATION AND GROWTH PROSPECT MAPPING
4.2.1 GROWTH PROSPECT
4.3 COMPETITOR KEY PRICING STRATEGIES
4.4 KEY TECHNOLOGIES
4.4.1 COMPLEMENTARY TECHNOLOGIES
4.4.2 ADJACENT TECHNOLOGIES
4.4.3 CHALLENGES
4.4.4 TECHNOLOGY SPEND OF COMPANY
4.5 COMPANY COMPARATIVE ANALYSIS
5 MARKET OVERVIEW
5.1 DRIVERS
5.1.1 INCREASE IN THE R&D EXPENDITURE IN MEDICAL AND PHARMACEUTICAL COMPANIES
5.1.2 GROWING UTILIZATION OF SURFACE ANALYSIS METHODS IS EXPANDING ACROSS SECTORS LIKE ELECTRONICS, AUTOMOTIVE, AEROSPACE, AND ADVANCED MATERIALS
5.1.3 INCREASING QUALITY CONTROL DEMANDS ARE DRIVING THE EXPANSION OF SURFACE ANALYSIS.
5.1.4 GROWING RESEARCH COLLABORATION AMONG ACADEMIA, INDUSTRY, AND GOVERNMENT BOOST MARKET AWARENESS
5.2 RESTRAINTS
5.2.1 HIGH INSTRUMENT COSTS RESTRICT GLOBAL SURFACE ANALYSIS EXPANSION
5.2.2 REGULATORY COMPLIANCE ISSUES HINDER RAPID TECHNOLOGY DEPLOYMENT
5.3 OPPORTUNITIES
5.3.1 EMERGING NANOTECHNOLOGY OFFERS BREAKTHROUGH TECHNIQUES IN ANALYSIS
5.3.2 STRATEGIC PARTNERSHIPS AND MERGERS ACCELERATE MARKET EXPANSION IN SURFACE ANALYSIS
5.4 CHALLENGES
5.4.1 SENSITIVITY TO SURFACE CONTAMINANTS AFFECTING ACCURACY
5.4.2 LIMITED SKILLED WORKFORCE FOR ADVANCED SURFACE ANALYSIS TECHNIQUES
6 GLOBAL SURFACE ANALYSIS MARKET, BY TECHNOLOGY
6.1 OVERVIEW
6.2 MICROSCOPY
6.2.1 MICROSCOPY, BY METHOD
6.2.1.1 ELECTRON MICROSCOPY
6.2.1.2 OPTICAL MICROSCOPY
6.2.1.3 CONFOCAL MICROSCOPY
6.2.1.4 PROBE MICROSCOPY
6.2.2 MICROSCOPY, BY TECHNIQUE
6.2.2.1 SCANNING ELECTRON MICROSCOPY (SEM)
6.2.2.2 TRANSMISSION ELECTRON MICROSCOPY (TEM)
6.2.2.3 SCANNING PROBE MICROSCOPY (SPM)
6.2.2.4 IMAGE ANALYSIS
6.2.2.5 CRYO-ELECTRON MICROSCOPY (CRYO-EM)
6.2.2.6 OTHERS
6.3 SPECTROSCOPY
6.4 X-RAY DIFFRACTION (XRD)
6.5 SURFACE ANALYZERS
7 GLOBAL SURFACE ANALYSIS MARKET, BY TYPE
7.1 OVERVIEW
7.2 XPS (X-RAY PHOTOELECTRON SPECTROSCOPY)
7.3 TOF-SIMS (TIME-OF-FLIGHT SECONDARY ION MASS SPECTROMETRY)
7.4 AES (AUGER ELECTRON SPECTROSCOPY)
7.5 RAMAN (RAMAN SPECTROSCOPY)
7.6 UPS (UV PHOTOELECTRON SPECTROSCOPY)
7.7 ISS (ION SCATTERING SPECTROSCOPY)
7.8 OTHERS
8 GLOBAL SURFACE ANALYSIS MARKET, BY METHOD TYPE
8.1 OVERVIEW
8.2 SPECTROSCOPIC METHOD
8.3 MICROSCOPIC METHOD
8.4 CLASSICAL METHOD
9 GLOBAL SURFACE ANALYSIS MARKET, BY EQUIPMENT TYPE
9.1 OVERVIEW
9.2 SCANNING PROBE MICROSCOPES (SPM)/ATOMIC FORCE MICROSCOPES (AFM)
9.2.1 SCANNING PROBE MICROSCOPES (SPM)/ATOMIC FORCE MICROSCOPES (AFM), BY OPERATION
9.2.1.1 AUTOMATIC
9.2.1.2 MANUAL
9.2.2 SCANNING PROBE MICROSCOPES (SPM)/ATOMIC FORCE MICROSCOPES (AFM), BY NOISE LEVEL
9.2.2.1 LOW
9.2.2.2 EXTREMELY LOW
9.2.2.3 STANDARD
9.3 ELECTRON PROBE MICRO-ANALYZERS (EPMA)
9.4 X-RAY PHOTOELECTRON SPECTROMETERS (XPS)/ELECTRON SPECTROSCOPY FOR CHEMICAL ANALYSIS (ESCA)
9.5 OTHERS
10 GLOBAL SURFACE ANALYSIS MARKET, BY APPLICATION
10.1 OVERVIEW
10.2 MATERIAL COMPOSITION
10.3 SURFACE ROUGHNESS AND TOPOGRAPHY
10.4 THIN FILM ANALYSIS
10.5 SURFACE CONTAMINATION
10.6 FAILURE ANALYSIS
10.7 CORROSION ANALYSIS
10.8 SURFACE MODIFICATION
11 GLOBAL SURFACE ANALYSIS MARKET, BY END USER
11.1 OVERVIEW
11.2 INDUSTRIES
11.2.1 INDUSTRIES, BY TYPE
11.2.1.1 LIFE SCIENCES & PHARMACEUTICALS
11.2.1.2 SEMICONDUCTOR
11.2.1.3 METALLURGY AND MINERALS
11.2.1.4 AUTOMOTIVE
11.2.1.5 ENERGY
11.2.1.6 FOOD AND BEVERAGES
11.2.1.7 POLYMERS
11.2.1.8 TEXTILE
11.2.1.9 PAPER AND PACKAGING
11.2.1.10 OTHERS
11.2.2 INDUSTRIES, BY TECHNOLOGY
11.2.2.1 MICROSCOPY
11.2.2.2 SPECTROSCOPY
11.2.2.3 X-RAY DIFFRACTION (XRD)
11.2.2.4 SURFACE ANALYZERS
11.3 RESEARCH ORGANIZATION
11.3.1 RESEARCH ORGANIZATION, BY TECHNOLOGY
11.3.1.1 MICROSCOPY
11.3.1.2 SPECTROSCOPY
11.3.1.3 X-RAY DIFFRACTION (XRD)
11.3.1.4 SURFACE ANALYZERS
11.4 ACADEMIC INSTITUTES
11.4.1 ACADEMIC INSTITUTES, BY TECHNOLOGY
11.4.1.1 MICROSCOPY
11.4.1.2 SPECTROSCOPY
11.4.1.3 X-RAY DIFFRACTION (XRD)
11.4.1.4 SURFACE ANALYZERS
12 GLOBAL SURFACE ANALYSIS MARKET, BY REGION
12.1 OVERVIEW
12.2 NORTH AMERICA
12.2.1 U.S.
12.2.2 CANADA
12.2.3 MEXICO
12.3 EUROPE
12.3.1 GERMANY
12.3.2 FRANCE
12.3.3 U.K.
12.3.4 ITALY
12.3.5 SPAIN
12.3.6 NETHERLANDS
12.3.7 SWITZERLAND
12.3.8 RUSS.IA
12.3.9 TURKEY
12.3.10 BELGIUM
12.3.11 REST OF EUROPE
12.4 ASIA-PACIFIC
12.4.1 CHINA
12.4.2 JAPAN
12.4.3 SOUTH KOREA
12.4.4 INDIA
12.4.5 AUST.RALIA
12.4.6 SINGAPORE
12.4.7 INDONESIA
12.4.8 THAILAND
12.4.9 MALAYSIA
12.4.10 PHILIPPINES
12.4.11 NEW-ZEALAND
12.4.12 REST OF ASIA-PACIFIC
12.5 SOUTH AMERICA
12.5.1 BRAZIL
12.5.2 ARGENTINA
12.5.3 REST OF SOUTH AMERICA
12.6 MIDDLE EAST AND AFRICA
12.6.1 SAUDI ARABIA
12.6.2 SOUTH AFRICA
12.6.3 U.A.E.
12.6.4 EGYPT
12.6.5 ISRAEL
12.6.6 REST OF MIDDLE EAST AND AFRICA
13 GLOBAL SURFACE ANALYSIS MARKET, COMPANY LANDSCAPE
13.1 COMPANY SHARE ANALYSIS: GLOBAL
13.2 COMPANY SHARE ANALYSIS: NORTH AMERICA
13.3 COMPANY SHARE ANALYSIS: EUROPE
13.4 COMPANY SHARE ANALYSIS: ASIA-PACIFIC
14 SWOT ANALYSIS
15 COMPANY PROFILES
15.1 THERMO FISHER SCIENTIFIC INC.
15.1.1 COMPANY SNAPSHOTS
15.1.2 REVENUE ANALYSIS
15.1.3 COMPANY SHARE ANALYSIS
15.1.4 PRODUCT PORTFOLIO
15.1.5 RECENT DEVELOPMENT
15.2 CARL ZEISS AG
15.2.1 COMPANY SNAPSHOT
15.2.2 COMPANY SHARE ANALYSIS
15.2.3 PRODUCT PORTFOLIO
15.2.4 RECENT DEVELOPMENTS/NEWS
15.3 BRUKER
15.3.1 COMPANY SNAPSHOT
15.3.2 REVENUE ANALYSIS
15.3.3 COMPANY SHARE ANALYSIS
15.3.4 PRODUCT PORTFOLIO
15.3.5 RECENT DEVELOPMENT/ NEWS
15.4 HORIBA GROUP
15.4.1 COMPANY SNAPSHOT
15.4.2 REVENUE ANALYSIS
15.4.3 COMPANY SHARE ANALYSIS
15.4.4 PRODUCT PORTFOLIO
15.4.5 RECENT DEVELOPMENTS
15.5 EUROFINS SCIENTIFIC
15.5.1 COMPANY SNAPSHOT
15.5.2 REVENUE ANALYSIS
15.5.3 COMPANY SHARE ANALYSIS
15.5.4 SERVICE PORTFOLIO
15.5.5 RECENT DEVELOPMENT
15.6 HIDDEN ANALYTICAL
15.6.1 COMPANY SNAPSHOT
15.6.2 PRODUCT PORTFOLIO
15.6.3 RECENT DEVELOPMENT
15.7 JEOL LTD.
15.7.1 COMPANY SNAPSHOTS
15.7.2 REVENUE ANALYSIS
15.7.3 PRODUCT PORTFOLIO
15.7.4 RECENT DEVELOPMENTS/NEWS
15.8 NIKON INSTRUMENTS INC.
15.8.1 COMPANY SNAPSHOT
15.8.2 PRODUCT PORTFOLIO
15.8.3 RECENT DEVELOPMENT
15.9 PHYSICAL ELECTRONICS, INC. (AS A PART OF ULVAC-PHI)
15.9.1 COMPANY SNAPSHOT
15.9.2 PRODUCT PORTFOLIO
15.9.3 RECENT DEVELOPMENT
15.1 S A I LTD
15.10.1 COMPANY SNAPSHOT
15.10.2 PRODUCT PORTFOLIO
15.10.3 RECENT DEVELOPMENT
15.11 SERMA GROUP
15.11.1 COMPANY SNAPSHOT
15.11.2 PRODUCT PORTFOLIO
15.11.3 RECENT DEVELOPMENT / NEWS
15.12 SHIMADZU CORPORATION
15.12.1 COMPANY SNAPSHOT
15.12.2 REVENUE ANALYSIS
15.12.3 PRODUCT PORTFOLIO
15.12.4 RECENT DEVELOPMENT
15.13 SPECS GMBH
15.13.1 COMPANY SNAPSHOT
15.13.2 PRODUCT PORTFOLIO
15.13.3 RECENT DEVELOPMENT
15.14 STAIB INSTRUMENTS
15.14.1 COMPANY SNAPSHOT
15.14.2 PRODUCT PORTFOLIO
15.14.3 RECENT DEVELOPMENT
15.15 TESCAN
15.15.1 COMPANY SNAPSHOT
15.15.2 PRODUCT PORTFOLIO
15.15.3 RECENT DEVELOPMENT/NEWS
15.16 TSI
15.16.1 COMPANY SNAPSHOT
15.16.2 PRODUCT PORTFOLIO
15.16.3 RECENT DEVELOPMENT/NEWS
16 QUESTIONNAIRE
17 RELATED REPORTS
表格列表
TABLE 1 MARKET PENETRATION ANALYSIS
TABLE 2 PRICING
TABLE 3 COMPANY COMPARATIVE ANALYSIS
TABLE 4 SEVERAL SOURCES OF SUBSTRATE SURFACE CONTAMINATION
TABLE 5 GLOBAL SURFACE ANALYSIS MARKET, BY TECHNOLOGY, 2018-2032 (USD THOUSAND)
TABLE 6 GLOBAL MICROSCOPY IN SURFACE ANALYSIS MARKET, BY REGION, 2018-2032 (USD THOUSAND)
TABLE 7 GLOBAL MICROSCOPY IN SURFACE ANALYSIS MARKET, BY METHOD, 2018-2032 (USD THOUSAND)
TABLE 8 GLOBAL MICROSCOPY IN SURFACE ANALYSIS MARKET, BY TECHNIQUE, 2018-2032 (USD THOUSAND)
TABLE 9 GLOBAL SPECTROSCOPY IN SURFACE ANALYSIS MARKET, BY REGION, 2018-2032 (USD THOUSAND)
TABLE 10 GLOBAL X-RAY DIFFRACTION (XRD) IN SURFACE ANALYSIS MARKET, BY RGION, 2018-2032 (USD THOUSAND)
TABLE 11 GLOBAL SURFACE ANALYZERS IN SURFACE ANALYSIS MARKET, BY REGION, 2018-2032 (USD THOUSAND)
TABLE 12 GLOBAL SURFACE ANALYSIS MARKET, BY TYPE, 2018-2032 (USD THOUSAND)
TABLE 13 GLOBAL XPS (X-RAY PHOTOELECTRON SPECTROSCOPY) IN SURFACE ANALYSIS MARKET, BY REGION, 2018-2032 (USD THOUSAND)
TABLE 14 GLOBAL TOF-SIMS (TIME-OF-FLIGHT SECONDARY ION MASS SPECTROMETRY) IN SURFACE ANALYSIS MARKET, BY REGION, 2018-2032 (USD THOUSAND)
TABLE 15 GLOBAL AES (AUGER ELECTRON SPECTROSCOPY) IN SURFACE ANALYSIS MARKET, BY REGION, 2018-2032 (USD THOUSAND)
TABLE 16 GLOBAL RAMAN (RAMAN SPECTROSCOPY) IN SURFACE ANALYSIS MARKET, BY REGION, 2018-2032 (USD THOUSAND)
TABLE 17 GLOBAL UPS (UV PHOTOELECTRON SPECTROSCOPY) IN SURFACE ANALYSIS MARKET, BY REGION, 2018-2032 (USD THOUSAND)
TABLE 18 GLOBAL ISS (ION SCATTERING SPECTROSCOPY) IN SURFACE ANALYSIS MARKET, BY REGION, 2018-2032 (USD THOUSAND)
TABLE 19 GLOBAL OTHERS IN SURFACE ANALYSIS MARKET, BY REGION, 2018-2032 (USD THOUSAND)
TABLE 20 GLOBAL SURFACE ANALYSIS MARKET, BY METHOD TYPE, 2018-2032 (USD THOUSAND)
TABLE 21 GLOBAL SPECTROSCOPIC METHOD IN SURFACE ANALYSIS MARKET, BY REGION, 2018-2032 (USD THOUSAND)
TABLE 22 GLOBAL MICROSCOPIC METHOD IN SURFACE ANALYSIS MARKET, BY REGION, 2018-2032 (USD THOUSAND)
TABLE 23 GLOBAL CLASSICAL METHOD IN SURFACE ANALYSIS MARKET, BY REGION, 2018-2032 (USD THOUSAND)
TABLE 24 GLOBAL SURFACE ANALYSIS MARKET, BY EQUIPMENT TYPE, 2018-2032 (USD THOUSAND)
TABLE 25 GLOBAL SCANNING PROBE MICROSCOPES (SPM)/ATOMIC FORCE MICROSCOPES (AFM) IN SURFACE ANALYSIS MARKET, BY REGION, 2018-2032 (USD THOUSAND)
TABLE 26 GLOBAL SCANNING PROBE MICROSCOPES (SPM)/ATOMIC FORCE MICROSCOPES (AFM) IN SURFACE ANALYSIS MARKET, BY OPERATION, 2018-2032 (USD THOUSAND)
TABLE 27 GLOBAL SCANNING PROBE MICROSCOPES (SPM)/ATOMIC FORCE MICROSCOPES (AFM) IN SURFACE ANALYSIS MARKET, BY NOISE LEVEL, 2018-2032 (USD THOUSAND)
TABLE 28 GLOBAL ELECTRON PROBE MICRO-ANALYZERS (EPMA) IN SURFACE ANALYSIS MARKET, BY REGION, 2018-2032 (USD THOUSAND)
TABLE 29 GLOBAL X-RAY PHOTOELECTRON SPECTROMETERS (XPS)/ELECTRON SPECTROSCOPY FOR CHEMICAL ANALYSIS (ESCA) IN SURFACE ANALYSIS MARKET, BY REGION, 2018-2032 (USD THOUSAND)
TABLE 30 GLOBAL OTHERS IN SURFACE ANALYSIS MARKET, BY REGION, 2018-2032 (USD THOUSAND)
TABLE 31 GLOBAL SURFACE ANALYSIS MARKET, BY APPLICATION, 2018-2032 (USD THOUSAND)
TABLE 32 GLOBAL MATERIAL COMPOSITION IN SURFACE ANALYSIS MARKET, BY REGION, 2018-2032 (USD THOUSAND)
TABLE 33 GLOBAL SURFACE ROUGHNESS AND TOPOGRAPHY IN SURFACE ANALYSIS MARKET, BY REGION, 2018-2032 (USD THOUSAND)
TABLE 34 GLOBAL THIN FILM ANALYSIS IN SURFACE ANALYSIS MARKET, BY REGION, 2018-2032 (USD THOUSAND)
TABLE 35 GLOBAL SURFACE CONTAMINATION IN SURFACE ANALYSIS MARKET, BY REGION, 2018-2032 (USD THOUSAND)
TABLE 36 GLOBAL FAILURE ANALYSIS IN SURFACE ANALYSIS MARKET, BY REGION, 2018-2032 (USD THOUSAND)
TABLE 37 GLOBAL CORROSION ANALYSIS IN SURFACE ANALYSIS MARKET, BY REGION, 2018-2032 (USD THOUSAND)
TABLE 38 GLOBAL SURFACE MODIFICATION IN SURFACE ANALYSIS MARKET, BY REGION, 2018-2032 (USD THOUSAND)
TABLE 39 GLOBAL SURFACE ANALYSIS MARKET, BY END USER, 2018-2032 (USD THOUSAND)
TABLE 40 GLOBAL INDUSTRIES IN SURFACE ANALYSIS MARKET, BY REGION, 2018-2032 (USD THOUSAND)
TABLE 41 GLOBAL INDUSTRIES IN SURFACE ANALYSIS MARKET, BY TYPE, 2018-2032 (USD THOUSAND)
TABLE 42 GLOBAL INDUSTRIES IN SURFACE ANALYSIS MARKET, BY TECHNOLOGY, 2018-2032 (USD THOUSAND)
TABLE 43 GLOBAL RESEARCH ORGANIZATION IN SURFACE ANALYSIS MARKET, BY REGION, 2018-2032 (USD THOUSAND)
TABLE 44 GLOBAL RESEARCH ORGANIZATION IN SURFACE ANALYSIS MARKET, BY TECHNOLOGY, 2018-2032 (USD THOUSAND)
TABLE 45 GLOBAL ACADEMIC INSTITUTES IN SURFACE ANALYSIS MARKET, BY REGION, 2018-2032 (USD THOUSAND)
TABLE 46 GLOBAL ACADEMIC INSTITUTES IN SURFACE ANALYSIS MARKET, BY TECHNOLOGY, 2018-2032 (USD THOUSAND)
TABLE 47 GLOBAL SURFACE ANALYSIS MARKET, BY REGION 2018-2032, USD (THOUSAND)
TABLE 48 NORTH AMERICA SURFACE ANALYSIS MARKET, BY COUNTRY, 2018-2032 (USD THOUSAND)
TABLE 49 NORTH AMERICA SURFACE ANALYSIS MARKET, BY TECHNOLOGY, 2018-2032 (USD THOUSAND)
TABLE 50 NORTH AMERICA MICROSCOPY IN SURFACE ANALYSIS MARKET, BY METHOD, 2018-2032 (USD THOUSAND)
TABLE 51 NORTH AMERICA MICROSCOPY IN SURFACE ANALYSIS MARKET, BY TECHNIQUE, 2018-2032 (USD THOUSAND)
TABLE 52 NORTH AMERICA SURFACE ANALYSIS MARKET, BY TYPE, 2018-2032 (USD THOUSAND)
TABLE 53 NORTH AMERICA SURFACE ANALYSIS MARKET, BY METHOD TYPE, 2018-2032 (USD THOUSAND)
TABLE 54 NORTH AMERICA SURFACE ANALYSIS MARKET, BY EQUIPMENT TYPE, 2018-2032 (USD THOUSAND)
TABLE 55 NORTH AMERICA SCANNING PROBE MICROSCOPES (SPM)/ATOMIC FORCE MICROSCOPES (AFM) IN SURFACE ANALYSIS MARKET, BY OPERATION, 2018-2032 (USD THOUSAND)
TABLE 56 NORTH AMERICA SCANNING PROBE MICROSCOPES (SPM)/ATOMIC FORCE MICROSCOPES (AFM) IN SURFACE ANALYSIS MARKET, BY NOISE LEVEL, 2018-2032 (USD THOUSAND)
TABLE 57 NORTH AMERICA SURFACE ANALYSIS MARKET, BY APPLICATION, 2018-2032 (USD THOUSAND)
TABLE 58 NORTH AMERICA SURFACE ANALYSIS MARKET, BY END USER, 2018-2032 (USD THOUSAND)
TABLE 59 NORTH AMERICA INDUSTRIES IN SURFACE ANALYSIS MARKET, BY TYPE, 2018-2032 (USD THOUSAND)
TABLE 60 NORTH AMERICA INDUSTRIES IN SURFACE ANALYSIS MARKET, BY TECHNOLOGY, 2018-2032 (USD THOUSAND)
TABLE 61 NORTH AMERICA RESEARCH ORGANIZATION IN SURFACE ANALYSIS MARKET, BY TECHNOLOGY, 2018-2032 (USD THOUSAND)
TABLE 62 NORTH AMERICA ACADEMIC INSTITUTES IN SURFACE ANALYSIS MARKET, BY TECHNOLOGY, 2018-2032 (USD THOUSAND)
TABLE 63 U.S. SURFACE ANALYSIS MARKET, BY TECHNOLOGY, 2018-2032 (USD THOUSAND)
TABLE 64 U.S. MICROSCOPY IN SURFACE ANALYSIS MARKET, BY METHOD, 2018-2032 (USD THOUSAND)
TABLE 65 U.S. MICROSCOPY IN SURFACE ANALYSIS MARKET, BY TECHNIQUE, 2018-2032 (USD THOUSAND)
TABLE 66 U.S. SURFACE ANALYSIS MARKET, BY TYPE, 2018-2032 (USD THOUSAND)
TABLE 67 U.S. SURFACE ANALYSIS MARKET, BY METHOD TYPE, 2018-2032 (USD THOUSAND)
TABLE 68 U.S. SURFACE ANALYSIS MARKET, BY EQUIPMENT TYPE, 2018-2032 (USD THOUSAND)
TABLE 69 U.S. SCANNING PROBE MICROSCOPES (SPM)/ATOMIC FORCE MICROSCOPES (AFM) IN SURFACE ANALYSIS MARKET, BY OPERATION, 2018-2032 (USD THOUSAND)
TABLE 70 U.S. SCANNING PROBE MICROSCOPES (SPM)/ATOMIC FORCE MICROSCOPES (AFM) IN SURFACE ANALYSIS MARKET, BY NOISE LEVEL, 2018-2032 (USD THOUSAND)
TABLE 71 U.S. SURFACE ANALYSIS MARKET, BY APPLICATION, 2018-2032 (USD THOUSAND)
TABLE 72 U.S. SURFACE ANALYSIS MARKET, BY END USER, 2018-2032 (USD THOUSAND)
TABLE 73 U.S. INDUSTRIES IN SURFACE ANALYSIS MARKET, BY TYPE, 2018-2032 (USD THOUSAND)
TABLE 74 U.S. INDUSTRIES IN SURFACE ANALYSIS MARKET, BY TECHNOLOGY, 2018-2032 (USD THOUSAND)
TABLE 75 U.S. RESEARCH ORGANIZATION IN SURFACE ANALYSIS MARKET, BY TECHNOLOGY, 2018-2032 (USD THOUSAND)
TABLE 76 U.S. ACADEMIC INSTITUTES IN SURFACE ANALYSIS MARKET, BY TECHNOLOGY, 2018-2032 (USD THOUSAND)
TABLE 77 CANADA SURFACE ANALYSIS MARKET, BY TECHNOLOGY, 2018-2032 (USD THOUSAND)
TABLE 78 CANADA MICROSCOPY IN SURFACE ANALYSIS MARKET, BY METHOD, 2018-2032 (USD THOUSAND)
TABLE 79 CANADA MICROSCOPY IN SURFACE ANALYSIS MARKET, BY TECHNIQUE, 2018-2032 (USD THOUSAND)
TABLE 80 CANADA SURFACE ANALYSIS MARKET, BY TYPE, 2018-2032 (USD THOUSAND)
TABLE 81 CANADA SURFACE ANALYSIS MARKET, BY METHOD TYPE, 2018-2032 (USD THOUSAND)
TABLE 82 CANADA SURFACE ANALYSIS MARKET, BY EQUIPMENT TYPE, 2018-2032 (USD THOUSAND)
TABLE 83 CANADA SCANNING PROBE MICROSCOPES (SPM)/ATOMIC FORCE MICROSCOPES (AFM) IN SURFACE ANALYSIS MARKET, BY OPERATION, 2018-2032 (USD THOUSAND)
TABLE 84 CANADA SCANNING PROBE MICROSCOPES (SPM)/ATOMIC FORCE MICROSCOPES (AFM) IN SURFACE ANALYSIS MARKET, BY NOISE LEVEL, 2018-2032 (USD THOUSAND)
TABLE 85 CANADA SURFACE ANALYSIS MARKET, BY APPLICATION, 2018-2032 (USD THOUSAND)
TABLE 86 CANADA SURFACE ANALYSIS MARKET, BY END USER, 2018-2032 (USD THOUSAND)
TABLE 87 CANADA INDUSTRIES IN SURFACE ANALYSIS MARKET, BY TYPE, 2018-2032 (USD THOUSAND)
TABLE 88 CANADA INDUSTRIES IN SURFACE ANALYSIS MARKET, BY TECHNOLOGY, 2018-2032 (USD THOUSAND)
TABLE 89 CANADA RESEARCH ORGANIZATION IN SURFACE ANALYSIS MARKET, BY TECHNOLOGY, 2018-2032 (USD THOUSAND)
TABLE 90 CANADA ACADEMIC INSTITUTES IN SURFACE ANALYSIS MARKET, BY TECHNOLOGY, 2018-2032 (USD THOUSAND)
TABLE 91 MEXICO SURFACE ANALYSIS MARKET, BY TECHNOLOGY, 2018-2032 (USD THOUSAND)
TABLE 92 MEXICO MICROSCOPY IN SURFACE ANALYSIS MARKET, BY METHOD, 2018-2032 (USD THOUSAND)
TABLE 93 MEXICO MICROSCOPY IN SURFACE ANALYSIS MARKET, BY TECHNIQUE, 2018-2032 (USD THOUSAND)
TABLE 94 MEXICO SURFACE ANALYSIS MARKET, BY TYPE, 2018-2032 (USD THOUSAND)
TABLE 95 MEXICO SURFACE ANALYSIS MARKET, BY METHOD TYPE, 2018-2032 (USD THOUSAND)
TABLE 96 MEXICO SURFACE ANALYSIS MARKET, BY EQUIPMENT TYPE, 2018-2032 (USD THOUSAND)
TABLE 97 MEXICO SCANNING PROBE MICROSCOPES (SPM)/ATOMIC FORCE MICROSCOPES (AFM) IN SURFACE ANALYSIS MARKET, BY OPERATION, 2018-2032 (USD THOUSAND)
TABLE 98 MEXICO SCANNING PROBE MICROSCOPES (SPM)/ATOMIC FORCE MICROSCOPES (AFM) IN SURFACE ANALYSIS MARKET, BY NOISE LEVEL, 2018-2032 (USD THOUSAND)
TABLE 99 MEXICO SURFACE ANALYSIS MARKET, BY APPLICATION, 2018-2032 (USD THOUSAND)
TABLE 100 MEXICO SURFACE ANALYSIS MARKET, BY END USER, 2018-2032 (USD THOUSAND)
TABLE 101 MEXICO INDUSTRIES IN SURFACE ANALYSIS MARKET, BY TYPE, 2018-2032 (USD THOUSAND)
TABLE 102 MEXICO INDUSTRIES IN SURFACE ANALYSIS MARKET, BY TECHNOLOGY, 2018-2032 (USD THOUSAND)
TABLE 103 MEXICO RESEARCH ORGANIZATION IN SURFACE ANALYSIS MARKET, BY TECHNOLOGY, 2018-2032 (USD THOUSAND)
TABLE 104 MEXICO ACADEMIC INSTITUTES IN SURFACE ANALYSIS MARKET, BY TECHNOLOGY, 2018-2032 (USD THOUSAND)
TABLE 105 EUROPE SURFACE ANALYSIS MARKET, BY COUNTRY, 2018-2032 (USD THOUSAND)
TABLE 106 EUROPE SURFACE ANALYSIS MARKET, BY TECHNOLOGY, 2018-2032 (USD THOUSAND)
TABLE 107 EUROPE MICROSCOPY IN SURFACE ANALYSIS MARKET, BY METHOD, 2018-2032 (USD THOUSAND)
TABLE 108 EUROPE MICROSCOPY IN SURFACE ANALYSIS MARKET, BY TECHNIQUE, 2018-2032 (USD THOUSAND)
TABLE 109 EUROPE SURFACE ANALYSIS MARKET, BY TYPE, 2018-2032 (USD THOUSAND)
TABLE 110 EUROPE SURFACE ANALYSIS MARKET, BY METHOD TYPE, 2018-2032 (USD THOUSAND)
TABLE 111 EUROPE SURFACE ANALYSIS MARKET, BY EQUIPMENT TYPE, 2018-2032 (USD THOUSAND)
TABLE 112 EUROPE SCANNING PROBE MICROSCOPES (SPM)/ATOMIC FORCE MICROSCOPES (AFM) IN SURFACE ANALYSIS MARKET, BY OPERATION, 2018-2032 (USD THOUSAND)
TABLE 113 EUROPE SCANNING PROBE MICROSCOPES (SPM)/ATOMIC FORCE MICROSCOPES (AFM) IN SURFACE ANALYSIS MARKET, BY NOISE LEVEL, 2018-2032 (USD THOUSAND)
TABLE 114 EUROPE SURFACE ANALYSIS MARKET, BY APPLICATION, 2018-2032 (USD THOUSAND)
TABLE 115 EUROPE SURFACE ANALYSIS MARKET, BY END USER, 2018-2032 (USD THOUSAND)
TABLE 116 EUROPE INDUSTRIES IN SURFACE ANALYSIS MARKET, BY TYPE, 2018-2032 (USD THOUSAND)
TABLE 117 EUROPE INDUSTRIES IN SURFACE ANALYSIS MARKET, BY TECHNOLOGY, 2018-2032 (USD THOUSAND)
TABLE 118 EUROPE RESEARCH ORGANIZATION IN SURFACE ANALYSIS MARKET, BY TECHNOLOGY, 2018-2032 (USD THOUSAND)
TABLE 119 EUROPE ACADEMIC INSTITUTES IN SURFACE ANALYSIS MARKET, BY TECHNOLOGY, 2018-2032 (USD THOUSAND)
TABLE 120 GERMANY SURFACE ANALYSIS MARKET, BY TECHNOLOGY, 2018-2032 (USD THOUSAND)
TABLE 121 GERMANY MICROSCOPY IN SURFACE ANALYSIS MARKET, BY METHOD, 2018-2032 (USD THOUSAND)
TABLE 122 GERMANY MICROSCOPY IN SURFACE ANALYSIS MARKET, BY TECHNIQUE, 2018-2032 (USD THOUSAND)
TABLE 123 GERMANY SURFACE ANALYSIS MARKET, BY TYPE, 2018-2032 (USD THOUSAND)
TABLE 124 GERMANY SURFACE ANALYSIS MARKET, BY METHOD TYPE, 2018-2032 (USD THOUSAND)
TABLE 125 GERMANY SURFACE ANALYSIS MARKET, BY EQUIPMENT TYPE, 2018-2032 (USD THOUSAND)
TABLE 126 GERMANY SCANNING PROBE MICROSCOPES (SPM)/ATOMIC FORCE MICROSCOPES (AFM) IN SURFACE ANALYSIS MARKET, BY OPERATION, 2018-2032 (USD THOUSAND)
TABLE 127 GERMANY SCANNING PROBE MICROSCOPES (SPM)/ATOMIC FORCE MICROSCOPES (AFM) IN SURFACE ANALYSIS MARKET, BY NOISE LEVEL, 2018-2032 (USD THOUSAND)
TABLE 128 GERMANY SURFACE ANALYSIS MARKET, BY APPLICATION, 2018-2032 (USD THOUSAND)
TABLE 129 GERMANY SURFACE ANALYSIS MARKET, BY END USER, 2018-2032 (USD THOUSAND)
TABLE 130 GERMANY INDUSTRIES IN SURFACE ANALYSIS MARKET, BY TYPE, 2018-2032 (USD THOUSAND)
TABLE 131 GERMANY INDUSTRIES IN SURFACE ANALYSIS MARKET, BY TECHNOLOGY, 2018-2032 (USD THOUSAND)
TABLE 132 GERMANY RESEARCH ORGANIZATION IN SURFACE ANALYSIS MARKET, BY TECHNOLOGY, 2018-2032 (USD THOUSAND)
TABLE 133 GERMANY ACADEMIC INSTITUTES IN SURFACE ANALYSIS MARKET, BY TECHNOLOGY, 2018-2032 (USD THOUSAND)
TABLE 134 FRANCE SURFACE ANALYSIS MARKET, BY TECHNOLOGY, 2018-2032 (USD THOUSAND)
TABLE 135 FRANCE MICROSCOPY IN SURFACE ANALYSIS MARKET, BY METHOD, 2018-2032 (USD THOUSAND)
TABLE 136 FRANCE MICROSCOPY IN SURFACE ANALYSIS MARKET, BY TECHNIQUE, 2018-2032 (USD THOUSAND)
TABLE 137 FRANCE SURFACE ANALYSIS MARKET, BY TYPE, 2018-2032 (USD THOUSAND)
TABLE 138 FRANCE SURFACE ANALYSIS MARKET, BY METHOD TYPE, 2018-2032 (USD THOUSAND)
TABLE 139 FRANCE SURFACE ANALYSIS MARKET, BY EQUIPMENT TYPE, 2018-2032 (USD THOUSAND)
TABLE 140 FRANCE SCANNING PROBE MICROSCOPES (SPM)/ATOMIC FORCE MICROSCOPES (AFM) IN SURFACE ANALYSIS MARKET, BY OPERATION, 2018-2032 (USD THOUSAND)
TABLE 141 FRANCE SCANNING PROBE MICROSCOPES (SPM)/ATOMIC FORCE MICROSCOPES (AFM) IN SURFACE ANALYSIS MARKET, BY NOISE LEVEL, 2018-2032 (USD THOUSAND)
TABLE 142 FRANCE SURFACE ANALYSIS MARKET, BY APPLICATION, 2018-2032 (USD THOUSAND)
TABLE 143 FRANCE SURFACE ANALYSIS MARKET, BY END USER, 2018-2032 (USD THOUSAND)
TABLE 144 FRANCE INDUSTRIES IN SURFACE ANALYSIS MARKET, BY TYPE, 2018-2032 (USD THOUSAND)
TABLE 145 FRANCE INDUSTRIES IN SURFACE ANALYSIS MARKET, BY TECHNOLOGY, 2018-2032 (USD THOUSAND)
TABLE 146 FRANCE RESEARCH ORGANIZATION IN SURFACE ANALYSIS MARKET, BY TECHNOLOGY, 2018-2032 (USD THOUSAND)
TABLE 147 FRANCE ACADEMIC INSTITUTES IN SURFACE ANALYSIS MARKET, BY TECHNOLOGY, 2018-2032 (USD THOUSAND)
TABLE 148 U.K. SURFACE ANALYSIS MARKET, BY TECHNOLOGY, 2018-2032 (USD THOUSAND)
TABLE 149 U.K. MICROSCOPY IN SURFACE ANALYSIS MARKET, BY METHOD, 2018-2032 (USD THOUSAND)
TABLE 150 U.K. MICROSCOPY IN SURFACE ANALYSIS MARKET, BY TECHNIQUE, 2018-2032 (USD THOUSAND)
TABLE 151 U.K. SURFACE ANALYSIS MARKET, BY TYPE, 2018-2032 (USD THOUSAND)
TABLE 152 U.K. SURFACE ANALYSIS MARKET, BY METHOD TYPE, 2018-2032 (USD THOUSAND)
TABLE 153 U.K. SURFACE ANALYSIS MARKET, BY EQUIPMENT TYPE, 2018-2032 (USD THOUSAND)
TABLE 154 U.K. SCANNING PROBE MICROSCOPES (SPM)/ATOMIC FORCE MICROSCOPES (AFM) IN SURFACE ANALYSIS MARKET, BY OPERATION, 2018-2032 (USD THOUSAND)
TABLE 155 U.K. SCANNING PROBE MICROSCOPES (SPM)/ATOMIC FORCE MICROSCOPES (AFM) IN SURFACE ANALYSIS MARKET, BY NOISE LEVEL, 2018-2032 (USD THOUSAND)
TABLE 156 U.K. SURFACE ANALYSIS MARKET, BY APPLICATION, 2018-2032 (USD THOUSAND)
TABLE 157 U.K. SURFACE ANALYSIS MARKET, BY END USER, 2018-2032 (USD THOUSAND)
TABLE 158 U.K. INDUSTRIES IN SURFACE ANALYSIS MARKET, BY TYPE, 2018-2032 (USD THOUSAND)
TABLE 159 U.K. INDUSTRIES IN SURFACE ANALYSIS MARKET, BY TECHNOLOGY, 2018-2032 (USD THOUSAND)
TABLE 160 U.K. RESEARCH ORGANIZATION IN SURFACE ANALYSIS MARKET, BY TECHNOLOGY, 2018-2032 (USD THOUSAND)
TABLE 161 U.K. ACADEMIC INSTITUTES IN SURFACE ANALYSIS MARKET, BY TECHNOLOGY, 2018-2032 (USD THOUSAND)
TABLE 162 ITALY SURFACE ANALYSIS MARKET, BY TECHNOLOGY, 2018-2032 (USD THOUSAND)
TABLE 163 ITALY MICROSCOPY IN SURFACE ANALYSIS MARKET, BY METHOD, 2018-2032 (USD THOUSAND)
TABLE 164 ITALY MICROSCOPY IN SURFACE ANALYSIS MARKET, BY TECHNIQUE, 2018-2032 (USD THOUSAND)
TABLE 165 ITALY SURFACE ANALYSIS MARKET, BY TYPE, 2018-2032 (USD THOUSAND)
TABLE 166 ITALY SURFACE ANALYSIS MARKET, BY METHOD TYPE, 2018-2032 (USD THOUSAND)
TABLE 167 ITALY SURFACE ANALYSIS MARKET, BY EQUIPMENT TYPE, 2018-2032 (USD THOUSAND)
TABLE 168 ITALY SCANNING PROBE MICROSCOPES (SPM)/ATOMIC FORCE MICROSCOPES (AFM) IN SURFACE ANALYSIS MARKET, BY OPERATION, 2018-2032 (USD THOUSAND)
TABLE 169 ITALY SCANNING PROBE MICROSCOPES (SPM)/ATOMIC FORCE MICROSCOPES (AFM) IN SURFACE ANALYSIS MARKET, BY NOISE LEVEL, 2018-2032 (USD THOUSAND)
TABLE 170 ITALY SURFACE ANALYSIS MARKET, BY APPLICATION, 2018-2032 (USD THOUSAND)
TABLE 171 ITALY SURFACE ANALYSIS MARKET, BY END USER, 2018-2032 (USD THOUSAND)
TABLE 172 ITALY INDUSTRIES IN SURFACE ANALYSIS MARKET, BY TYPE, 2018-2032 (USD THOUSAND)
TABLE 173 ITALY INDUSTRIES IN SURFACE ANALYSIS MARKET, BY TECHNOLOGY, 2018-2032 (USD THOUSAND)
TABLE 174 ITALY RESEARCH ORGANIZATION IN SURFACE ANALYSIS MARKET, BY TECHNOLOGY, 2018-2032 (USD THOUSAND)
TABLE 175 ITALY ACADEMIC INSTITUTES IN SURFACE ANALYSIS MARKET, BY TECHNOLOGY, 2018-2032 (USD THOUSAND)
TABLE 176 SPAIN SURFACE ANALYSIS MARKET, BY TECHNOLOGY, 2018-2032 (USD THOUSAND)
TABLE 177 SPAIN MICROSCOPY IN SURFACE ANALYSIS MARKET, BY METHOD, 2018-2032 (USD THOUSAND)
TABLE 178 SPAIN MICROSCOPY IN SURFACE ANALYSIS MARKET, BY TECHNIQUE, 2018-2032 (USD THOUSAND)
TABLE 179 SPAIN SURFACE ANALYSIS MARKET, BY TYPE, 2018-2032 (USD THOUSAND)
TABLE 180 SPAIN SURFACE ANALYSIS MARKET, BY METHOD TYPE, 2018-2032 (USD THOUSAND)
TABLE 181 SPAIN SURFACE ANALYSIS MARKET, BY EQUIPMENT TYPE, 2018-2032 (USD THOUSAND)
TABLE 182 SPAIN SCANNING PROBE MICROSCOPES (SPM)/ATOMIC FORCE MICROSCOPES (AFM) IN SURFACE ANALYSIS MARKET, BY OPERATION, 2018-2032 (USD THOUSAND)
TABLE 183 SPAIN SCANNING PROBE MICROSCOPES (SPM)/ATOMIC FORCE MICROSCOPES (AFM) IN SURFACE ANALYSIS MARKET, BY NOISE LEVEL, 2018-2032 (USD THOUSAND)
TABLE 184 SPAIN SURFACE ANALYSIS MARKET, BY APPLICATION, 2018-2032 (USD THOUSAND)
TABLE 185 SPAIN SURFACE ANALYSIS MARKET, BY END USER, 2018-2032 (USD THOUSAND)
TABLE 186 SPAIN INDUSTRIES IN SURFACE ANALYSIS MARKET, BY TYPE, 2018-2032 (USD THOUSAND)
TABLE 187 SPAIN INDUSTRIES IN SURFACE ANALYSIS MARKET, BY TECHNOLOGY, 2018-2032 (USD THOUSAND)
TABLE 188 SPAIN RESEARCH ORGANIZATION IN SURFACE ANALYSIS MARKET, BY TECHNOLOGY, 2018-2032 (USD THOUSAND)
TABLE 189 SPAIN ACADEMIC INSTITUTES IN SURFACE ANALYSIS MARKET, BY TECHNOLOGY, 2018-2032 (USD THOUSAND)
TABLE 190 NETHERLANDS SURFACE ANALYSIS MARKET, BY TECHNOLOGY, 2018-2032 (USD THOUSAND)
TABLE 191 NETHERLANDS MICROSCOPY IN SURFACE ANALYSIS MARKET, BY METHOD, 2018-2032 (USD THOUSAND)
TABLE 192 NETHERLANDS MICROSCOPY IN SURFACE ANALYSIS MARKET, BY TECHNIQUE, 2018-2032 (USD THOUSAND)
TABLE 193 NETHERLANDS SURFACE ANALYSIS MARKET, BY TYPE, 2018-2032 (USD THOUSAND)
TABLE 194 NETHERLANDS SURFACE ANALYSIS MARKET, BY METHOD TYPE, 2018-2032 (USD THOUSAND)
TABLE 195 NETHERLANDS SURFACE ANALYSIS MARKET, BY EQUIPMENT TYPE, 2018-2032 (USD THOUSAND)
TABLE 196 NETHERLANDS SCANNING PROBE MICROSCOPES (SPM)/ATOMIC FORCE MICROSCOPES (AFM) IN SURFACE ANALYSIS MARKET, BY OPERATION, 2018-2032 (USD THOUSAND)
TABLE 197 NETHERLANDS SCANNING PROBE MICROSCOPES (SPM)/ATOMIC FORCE MICROSCOPES (AFM) IN SURFACE ANALYSIS MARKET, BY NOISE LEVEL, 2018-2032 (USD THOUSAND)
TABLE 198 NETHERLANDS SURFACE ANALYSIS MARKET, BY APPLICATION, 2018-2032 (USD THOUSAND)
TABLE 199 NETHERLANDS SURFACE ANALYSIS MARKET, BY END USER, 2018-2032 (USD THOUSAND)
TABLE 200 NETHERLANDS INDUSTRIES IN SURFACE ANALYSIS MARKET, BY TYPE, 2018-2032 (USD THOUSAND)
TABLE 201 NETHERLANDS INDUSTRIES IN SURFACE ANALYSIS MARKET, BY TECHNOLOGY, 2018-2032 (USD THOUSAND)
TABLE 202 NETHERLANDS RESEARCH ORGANIZATION IN SURFACE ANALYSIS MARKET, BY TECHNOLOGY, 2018-2032 (USD THOUSAND)
TABLE 203 NETHERLANDS ACADEMIC INSTITUTES IN SURFACE ANALYSIS MARKET, BY TECHNOLOGY, 2018-2032 (USD THOUSAND)
TABLE 204 SWITZERLAND SURFACE ANALYSIS MARKET, BY TECHNOLOGY, 2018-2032 (USD THOUSAND)
TABLE 205 SWITZERLAND MICROSCOPY IN SURFACE ANALYSIS MARKET, BY METHOD, 2018-2032 (USD THOUSAND)
TABLE 206 SWITZERLAND MICROSCOPY IN SURFACE ANALYSIS MARKET, BY TECHNIQUE, 2018-2032 (USD THOUSAND)
TABLE 207 SWITZERLAND SURFACE ANALYSIS MARKET, BY TYPE, 2018-2032 (USD THOUSAND)
TABLE 208 SWITZERLAND SURFACE ANALYSIS MARKET, BY METHOD TYPE, 2018-2032 (USD THOUSAND)
TABLE 209 SWITZERLAND SURFACE ANALYSIS MARKET, BY EQUIPMENT TYPE, 2018-2032 (USD THOUSAND)
TABLE 210 SWITZERLAND SCANNING PROBE MICROSCOPES (SPM)/ATOMIC FORCE MICROSCOPES (AFM) IN SURFACE ANALYSIS MARKET, BY OPERATION, 2018-2032 (USD THOUSAND)
TABLE 211 SWITZERLAND SCANNING PROBE MICROSCOPES (SPM)/ATOMIC FORCE MICROSCOPES (AFM) IN SURFACE ANALYSIS MARKET, BY NOISE LEVEL, 2018-2032 (USD THOUSAND)
TABLE 212 SWITZERLAND SURFACE ANALYSIS MARKET, BY APPLICATION, 2018-2032 (USD THOUSAND)
TABLE 213 SWITZERLAND SURFACE ANALYSIS MARKET, BY END USER, 2018-2032 (USD THOUSAND)
TABLE 214 SWITZERLAND INDUSTRIES IN SURFACE ANALYSIS MARKET, BY TYPE, 2018-2032 (USD THOUSAND)
TABLE 215 SWITZERLAND INDUSTRIES IN SURFACE ANALYSIS MARKET, BY TECHNOLOGY, 2018-2032 (USD THOUSAND)
TABLE 216 SWITZERLAND RESEARCH ORGANIZATION IN SURFACE ANALYSIS MARKET, BY TECHNOLOGY, 2018-2032 (USD THOUSAND)
TABLE 217 SWITZERLAND ACADEMIC INSTITUTES IN SURFACE ANALYSIS MARKET, BY TECHNOLOGY, 2018-2032 (USD THOUSAND)
TABLE 218 RUSSIA SURFACE ANALYSIS MARKET, BY TECHNOLOGY, 2018-2032 (USD THOUSAND)
TABLE 219 RUSSIA MICROSCOPY IN SURFACE ANALYSIS MARKET, BY METHOD, 2018-2032 (USD THOUSAND)
TABLE 220 RUSSIA MICROSCOPY IN SURFACE ANALYSIS MARKET, BY TECHNIQUE, 2018-2032 (USD THOUSAND)
TABLE 221 RUSSIA SURFACE ANALYSIS MARKET, BY TYPE, 2018-2032 (USD THOUSAND)
TABLE 222 RUSSIA SURFACE ANALYSIS MARKET, BY METHOD TYPE, 2018-2032 (USD THOUSAND)
TABLE 223 RUSSIA SURFACE ANALYSIS MARKET, BY EQUIPMENT TYPE, 2018-2032 (USD THOUSAND)
TABLE 224 RUSSIA SCANNING PROBE MICROSCOPES (SPM)/ATOMIC FORCE MICROSCOPES (AFM) IN SURFACE ANALYSIS MARKET, BY OPERATION, 2018-2032 (USD THOUSAND)
TABLE 225 RUSSIA SCANNING PROBE MICROSCOPES (SPM)/ATOMIC FORCE MICROSCOPES (AFM) IN SURFACE ANALYSIS MARKET, BY NOISE LEVEL, 2018-2032 (USD THOUSAND)
TABLE 226 RUSSIA SURFACE ANALYSIS MARKET, BY APPLICATION, 2018-2032 (USD THOUSAND)
TABLE 227 RUSSIA SURFACE ANALYSIS MARKET, BY END USER, 2018-2032 (USD THOUSAND)
TABLE 228 RUSSIA INDUSTRIES IN SURFACE ANALYSIS MARKET, BY TYPE, 2018-2032 (USD THOUSAND)
TABLE 229 RUSSIA INDUSTRIES IN SURFACE ANALYSIS MARKET, BY TECHNOLOGY, 2018-2032 (USD THOUSAND)
TABLE 230 RUSSIA RESEARCH ORGANIZATION IN SURFACE ANALYSIS MARKET, BY TECHNOLOGY, 2018-2032 (USD THOUSAND)
TABLE 231 RUSSIA ACADEMIC INSTITUTES IN SURFACE ANALYSIS MARKET, BY TECHNOLOGY, 2018-2032 (USD THOUSAND)
TABLE 232 TURKEY SURFACE ANALYSIS MARKET, BY TECHNOLOGY, 2018-2032 (USD THOUSAND)
TABLE 233 TURKEY MICROSCOPY IN SURFACE ANALYSIS MARKET, BY METHOD, 2018-2032 (USD THOUSAND)
TABLE 234 TURKEY MICROSCOPY IN SURFACE ANALYSIS MARKET, BY TECHNIQUE, 2018-2032 (USD THOUSAND)
TABLE 235 TURKEY SURFACE ANALYSIS MARKET, BY TYPE, 2018-2032 (USD THOUSAND)
TABLE 236 TURKEY SURFACE ANALYSIS MARKET, BY METHOD TYPE, 2018-2032 (USD THOUSAND)
TABLE 237 TURKEY SURFACE ANALYSIS MARKET, BY EQUIPMENT TYPE, 2018-2032 (USD THOUSAND)
TABLE 238 TURKEY SCANNING PROBE MICROSCOPES (SPM)/ATOMIC FORCE MICROSCOPES (AFM) IN SURFACE ANALYSIS MARKET, BY OPERATION, 2018-2032 (USD THOUSAND)
TABLE 239 TURKEY SCANNING PROBE MICROSCOPES (SPM)/ATOMIC FORCE MICROSCOPES (AFM) IN SURFACE ANALYSIS MARKET, BY NOISE LEVEL, 2018-2032 (USD THOUSAND)
TABLE 240 TURKEY SURFACE ANALYSIS MARKET, BY APPLICATION, 2018-2032 (USD THOUSAND)
TABLE 241 TURKEY SURFACE ANALYSIS MARKET, BY END USER, 2018-2032 (USD THOUSAND)
TABLE 242 TURKEY INDUSTRIES IN SURFACE ANALYSIS MARKET, BY TYPE, 2018-2032 (USD THOUSAND)
TABLE 243 TURKEY INDUSTRIES IN SURFACE ANALYSIS MARKET, BY TECHNOLOGY, 2018-2032 (USD THOUSAND)
TABLE 244 TURKEY RESEARCH ORGANIZATION IN SURFACE ANALYSIS MARKET, BY TECHNOLOGY, 2018-2032 (USD THOUSAND)
TABLE 245 TURKEY ACADEMIC INSTITUTES IN SURFACE ANALYSIS MARKET, BY TECHNOLOGY, 2018-2032 (USD THOUSAND)
TABLE 246 BELGIUM SURFACE ANALYSIS MARKET, BY TECHNOLOGY, 2018-2032 (USD THOUSAND)
TABLE 247 BELGIUM MICROSCOPY IN SURFACE ANALYSIS MARKET, BY METHOD, 2018-2032 (USD THOUSAND)
TABLE 248 BELGIUM MICROSCOPY IN SURFACE ANALYSIS MARKET, BY TECHNIQUE, 2018-2032 (USD THOUSAND)
TABLE 249 BELGIUM SURFACE ANALYSIS MARKET, BY TYPE, 2018-2032 (USD THOUSAND)
TABLE 250 BELGIUM SURFACE ANALYSIS MARKET, BY METHOD TYPE, 2018-2032 (USD THOUSAND)
TABLE 251 BELGIUM SURFACE ANALYSIS MARKET, BY EQUIPMENT TYPE, 2018-2032 (USD THOUSAND)
TABLE 252 BELGIUM SCANNING PROBE MICROSCOPES (SPM)/ATOMIC FORCE MICROSCOPES (AFM) IN SURFACE ANALYSIS MARKET, BY OPERATION, 2018-2032 (USD THOUSAND)
TABLE 253 BELGIUM SCANNING PROBE MICROSCOPES (SPM)/ATOMIC FORCE MICROSCOPES (AFM) IN SURFACE ANALYSIS MARKET, BY NOISE LEVEL, 2018-2032 (USD THOUSAND)
TABLE 254 BELGIUM SURFACE ANALYSIS MARKET, BY APPLICATION, 2018-2032 (USD THOUSAND)
TABLE 255 BELGIUM SURFACE ANALYSIS MARKET, BY END USER, 2018-2032 (USD THOUSAND)
TABLE 256 BELGIUM INDUSTRIES IN SURFACE ANALYSIS MARKET, BY TYPE, 2018-2032 (USD THOUSAND)
TABLE 257 BELGIUM INDUSTRIES IN SURFACE ANALYSIS MARKET, BY TECHNOLOGY, 2018-2032 (USD THOUSAND)
TABLE 258 BELGIUM RESEARCH ORGANIZATION IN SURFACE ANALYSIS MARKET, BY TECHNOLOGY, 2018-2032 (USD THOUSAND)
TABLE 259 BELGIUM ACADEMIC INSTITUTES IN SURFACE ANALYSIS MARKET, BY TECHNOLOGY, 2018-2032 (USD THOUSAND)
TABLE 260 REST OF EUROPE SURFACE ANALYSIS MARKET, BY TECHNOLOGY, 2018-2032 (USD THOUSAND)
TABLE 261 ASIA-PACIFIC SURFACE ANALYSIS MARKET, BY COUNTRY, 2018-2032 (USD THOUSAND)
TABLE 262 ASIA-PACIFIC SURFACE ANALYSIS MARKET, BY TECHNOLOGY, 2018-2032 (USD THOUSAND)
TABLE 263 ASIA-PACIFIC MICROSCOPY IN SURFACE ANALYSIS MARKET, BY METHOD, 2018-2032 (USD THOUSAND)
TABLE 264 ASIA-PACIFIC MICROSCOPY IN SURFACE ANALYSIS MARKET, BY TECHNIQUE, 2018-2032 (USD THOUSAND)
TABLE 265 ASIA-PACIFIC SURFACE ANALYSIS MARKET, BY TYPE, 2018-2032 (USD THOUSAND)
TABLE 266 ASIA-PACIFIC SURFACE ANALYSIS MARKET, BY METHOD TYPE, 2018-2032 (USD THOUSAND)
TABLE 267 ASIA-PACIFIC SURFACE ANALYSIS MARKET, BY EQUIPMENT TYPE, 2018-2032 (USD THOUSAND)
TABLE 268 ASIA-PACIFIC SCANNING PROBE MICROSCOPES (SPM)/ATOMIC FORCE MICROSCOPES (AFM) IN SURFACE ANALYSIS MARKET, BY OPERATION, 2018-2032 (USD THOUSAND)
TABLE 269 ASIA-PACIFIC SCANNING PROBE MICROSCOPES (SPM)/ATOMIC FORCE MICROSCOPES (AFM) IN SURFACE ANALYSIS MARKET, BY NOISE LEVEL, 2018-2032 (USD THOUSAND)
TABLE 270 ASIA-PACIFIC SURFACE ANALYSIS MARKET, BY APPLICATION, 2018-2032 (USD THOUSAND)
TABLE 271 ASIA-PACIFIC SURFACE ANALYSIS MARKET, BY END USER, 2018-2032 (USD THOUSAND)
TABLE 272 ASIA-PACIFIC INDUSTRIES IN SURFACE ANALYSIS MARKET, BY TYPE, 2018-2032 (USD THOUSAND)
TABLE 273 ASIA-PACIFIC INDUSTRIES IN SURFACE ANALYSIS MARKET, BY TECHNOLOGY, 2018-2032 (USD THOUSAND)
TABLE 274 ASIA-PACIFIC RESEARCH ORGANIZATION IN SURFACE ANALYSIS MARKET, BY TECHNOLOGY, 2018-2032 (USD THOUSAND)
TABLE 275 ASIA-PACIFIC ACADEMIC INSTITUTES IN SURFACE ANALYSIS MARKET, BY TECHNOLOGY, 2018-2032 (USD THOUSAND)
TABLE 276 CHINA SURFACE ANALYSIS MARKET, BY TECHNOLOGY, 2018-2032 (USD THOUSAND)
TABLE 277 CHINA MICROSCOPY IN SURFACE ANALYSIS MARKET, BY METHOD, 2018-2032 (USD THOUSAND)
TABLE 278 CHINA MICROSCOPY IN SURFACE ANALYSIS MARKET, BY TECHNIQUE, 2018-2032 (USD THOUSAND)
TABLE 279 CHINA SURFACE ANALYSIS MARKET, BY TYPE, 2018-2032 (USD THOUSAND)
TABLE 280 CHINA SURFACE ANALYSIS MARKET, BY METHOD TYPE, 2018-2032 (USD THOUSAND)
TABLE 281 CHINA SURFACE ANALYSIS MARKET, BY EQUIPMENT TYPE, 2018-2032 (USD THOUSAND)
TABLE 282 CHINA SCANNING PROBE MICROSCOPES (SPM)/ATOMIC FORCE MICROSCOPES (AFM) IN SURFACE ANALYSIS MARKET, BY OPERATION, 2018-2032 (USD THOUSAND)
TABLE 283 CHINA SCANNING PROBE MICROSCOPES (SPM)/ATOMIC FORCE MICROSCOPES (AFM) IN SURFACE ANALYSIS MARKET, BY NOISE LEVEL, 2018-2032 (USD THOUSAND)
TABLE 284 CHINA SURFACE ANALYSIS MARKET, BY APPLICATION, 2018-2032 (USD THOUSAND)
TABLE 285 CHINA SURFACE ANALYSIS MARKET, BY END USER, 2018-2032 (USD THOUSAND)
TABLE 286 CHINA INDUSTRIES IN SURFACE ANALYSIS MARKET, BY TYPE, 2018-2032 (USD THOUSAND)
TABLE 287 CHINA INDUSTRIES IN SURFACE ANALYSIS MARKET, BY TECHNOLOGY, 2018-2032 (USD THOUSAND)
TABLE 288 CHINA RESEARCH ORGANIZATION IN SURFACE ANALYSIS MARKET, BY TECHNOLOGY, 2018-2032 (USD THOUSAND)
TABLE 289 CHINA ACADEMIC INSTITUTES IN SURFACE ANALYSIS MARKET, BY TECHNOLOGY, 2018-2032 (USD THOUSAND)
TABLE 290 JAPAN SURFACE ANALYSIS MARKET, BY TECHNOLOGY, 2018-2032 (USD THOUSAND)
TABLE 291 JAPAN MICROSCOPY IN SURFACE ANALYSIS MARKET, BY METHOD, 2018-2032 (USD THOUSAND)
TABLE 292 JAPAN MICROSCOPY IN SURFACE ANALYSIS MARKET, BY TECHNIQUE, 2018-2032 (USD THOUSAND)
TABLE 293 JAPAN SURFACE ANALYSIS MARKET, BY TYPE, 2018-2032 (USD THOUSAND)
TABLE 294 JAPAN SURFACE ANALYSIS MARKET, BY METHOD TYPE, 2018-2032 (USD THOUSAND)
TABLE 295 JAPAN SURFACE ANALYSIS MARKET, BY EQUIPMENT TYPE, 2018-2032 (USD THOUSAND)
TABLE 296 JAPAN SCANNING PROBE MICROSCOPES (SPM)/ATOMIC FORCE MICROSCOPES (AFM) IN SURFACE ANALYSIS MARKET, BY OPERATION, 2018-2032 (USD THOUSAND)
TABLE 297 JAPAN SCANNING PROBE MICROSCOPES (SPM)/ATOMIC FORCE MICROSCOPES (AFM) IN SURFACE ANALYSIS MARKET, BY NOISE LEVEL, 2018-2032 (USD THOUSAND)
TABLE 298 JAPAN SURFACE ANALYSIS MARKET, BY APPLICATION, 2018-2032 (USD THOUSAND)
TABLE 299 JAPAN SURFACE ANALYSIS MARKET, BY END USER, 2018-2032 (USD THOUSAND)
TABLE 300 JAPAN INDUSTRIES IN SURFACE ANALYSIS MARKET, BY TYPE, 2018-2032 (USD THOUSAND)
TABLE 301 JAPAN INDUSTRIES IN SURFACE ANALYSIS MARKET, BY TECHNOLOGY, 2018-2032 (USD THOUSAND)
TABLE 302 JAPAN RESEARCH ORGANIZATION IN SURFACE ANALYSIS MARKET, BY TECHNOLOGY, 2018-2032 (USD THOUSAND)
TABLE 303 JAPAN ACADEMIC INSTITUTES IN SURFACE ANALYSIS MARKET, BY TECHNOLOGY, 2018-2032 (USD THOUSAND)
TABLE 304 SOUTH KOREA SURFACE ANALYSIS MARKET, BY TECHNOLOGY, 2018-2032 (USD THOUSAND)
TABLE 305 SOUTH KOREA MICROSCOPY IN SURFACE ANALYSIS MARKET, BY METHOD, 2018-2032 (USD THOUSAND)
TABLE 306 SOUTH KOREA MICROSCOPY IN SURFACE ANALYSIS MARKET, BY TECHNIQUE, 2018-2032 (USD THOUSAND)
TABLE 307 SOUTH KOREA SURFACE ANALYSIS MARKET, BY TYPE, 2018-2032 (USD THOUSAND)
TABLE 308 SOUTH KOREA SURFACE ANALYSIS MARKET, BY METHOD TYPE, 2018-2032 (USD THOUSAND)
TABLE 309 SOUTH KOREA SURFACE ANALYSIS MARKET, BY EQUIPMENT TYPE, 2018-2032 (USD THOUSAND)
TABLE 310 SOUTH KOREA SCANNING PROBE MICROSCOPES (SPM)/ATOMIC FORCE MICROSCOPES (AFM) IN SURFACE ANALYSIS MARKET, BY OPERATION, 2018-2032 (USD THOUSAND)
TABLE 311 SOUTH KOREA SCANNING PROBE MICROSCOPES (SPM)/ATOMIC FORCE MICROSCOPES (AFM) IN SURFACE ANALYSIS MARKET, BY NOISE LEVEL, 2018-2032 (USD THOUSAND)
TABLE 312 SOUTH KOREA SURFACE ANALYSIS MARKET, BY APPLICATION, 2018-2032 (USD THOUSAND)
TABLE 313 SOUTH KOREA SURFACE ANALYSIS MARKET, BY END USER, 2018-2032 (USD THOUSAND)
TABLE 314 SOUTH KOREA INDUSTRIES IN SURFACE ANALYSIS MARKET, BY TYPE, 2018-2032 (USD THOUSAND)
TABLE 315 SOUTH KOREA INDUSTRIES IN SURFACE ANALYSIS MARKET, BY TECHNOLOGY, 2018-2032 (USD THOUSAND)
TABLE 316 SOUTH KOREA RESEARCH ORGANIZATION IN SURFACE ANALYSIS MARKET, BY TECHNOLOGY, 2018-2032 (USD THOUSAND)
TABLE 317 SOUTH KOREA ACADEMIC INSTITUTES IN SURFACE ANALYSIS MARKET, BY TECHNOLOGY, 2018-2032 (USD THOUSAND)
TABLE 318 INDIA SURFACE ANALYSIS MARKET, BY TECHNOLOGY, 2018-2032 (USD THOUSAND)
TABLE 319 INDIA MICROSCOPY IN SURFACE ANALYSIS MARKET, BY METHOD, 2018-2032 (USD THOUSAND)
TABLE 320 INDIA MICROSCOPY IN SURFACE ANALYSIS MARKET, BY TECHNIQUE, 2018-2032 (USD THOUSAND)
TABLE 321 INDIA SURFACE ANALYSIS MARKET, BY TYPE, 2018-2032 (USD THOUSAND)
TABLE 322 INDIA SURFACE ANALYSIS MARKET, BY METHOD TYPE, 2018-2032 (USD THOUSAND)
TABLE 323 INDIA SURFACE ANALYSIS MARKET, BY EQUIPMENT TYPE, 2018-2032 (USD THOUSAND)
TABLE 324 INDIA SCANNING PROBE MICROSCOPES (SPM)/ATOMIC FORCE MICROSCOPES (AFM) IN SURFACE ANALYSIS MARKET, BY OPERATION, 2018-2032 (USD THOUSAND)
TABLE 325 INDIA SCANNING PROBE MICROSCOPES (SPM)/ATOMIC FORCE MICROSCOPES (AFM) IN SURFACE ANALYSIS MARKET, BY NOISE LEVEL, 2018-2032 (USD THOUSAND)
TABLE 326 INDIA SURFACE ANALYSIS MARKET, BY APPLICATION, 2018-2032 (USD THOUSAND)
TABLE 327 INDIA SURFACE ANALYSIS MARKET, BY END USER, 2018-2032 (USD THOUSAND)
TABLE 328 INDIA INDUSTRIES IN SURFACE ANALYSIS MARKET, BY TYPE, 2018-2032 (USD THOUSAND)
TABLE 329 INDIA INDUSTRIES IN SURFACE ANALYSIS MARKET, BY TECHNOLOGY, 2018-2032 (USD THOUSAND)
TABLE 330 INDIA RESEARCH ORGANIZATION IN SURFACE ANALYSIS MARKET, BY TECHNOLOGY, 2018-2032 (USD THOUSAND)
TABLE 331 INDIA ACADEMIC INSTITUTES IN SURFACE ANALYSIS MARKET, BY TECHNOLOGY, 2018-2032 (USD THOUSAND)
TABLE 332 AUSTRALIA SURFACE ANALYSIS MARKET, BY TECHNOLOGY, 2018-2032 (USD THOUSAND)
TABLE 333 AUSTRALIA MICROSCOPY IN SURFACE ANALYSIS MARKET, BY METHOD, 2018-2032 (USD THOUSAND)
TABLE 334 AUSTRALIA MICROSCOPY IN SURFACE ANALYSIS MARKET, BY TECHNIQUE, 2018-2032 (USD THOUSAND)
TABLE 335 AUSTRALIA SURFACE ANALYSIS MARKET, BY TYPE, 2018-2032 (USD THOUSAND)
TABLE 336 AUSTRALIA SURFACE ANALYSIS MARKET, BY METHOD TYPE, 2018-2032 (USD THOUSAND)
TABLE 337 AUSTRALIA SURFACE ANALYSIS MARKET, BY EQUIPMENT TYPE, 2018-2032 (USD THOUSAND)
TABLE 338 AUSTRALIA SCANNING PROBE MICROSCOPES (SPM)/ATOMIC FORCE MICROSCOPES (AFM) IN SURFACE ANALYSIS MARKET, BY OPERATION, 2018-2032 (USD THOUSAND)
TABLE 339 AUSTRALIA SCANNING PROBE MICROSCOPES (SPM)/ATOMIC FORCE MICROSCOPES (AFM) IN SURFACE ANALYSIS MARKET, BY NOISE LEVEL, 2018-2032 (USD THOUSAND)
TABLE 340 AUSTRALIA SURFACE ANALYSIS MARKET, BY APPLICATION, 2018-2032 (USD THOUSAND)
TABLE 341 AUSTRALIA SURFACE ANALYSIS MARKET, BY END USER, 2018-2032 (USD THOUSAND)
TABLE 342 AUSTRALIA INDUSTRIES IN SURFACE ANALYSIS MARKET, BY TYPE, 2018-2032 (USD THOUSAND)
TABLE 343 AUSTRALIA INDUSTRIES IN SURFACE ANALYSIS MARKET, BY TECHNOLOGY, 2018-2032 (USD THOUSAND)
TABLE 344 AUSTRALIA RESEARCH ORGANIZATION IN SURFACE ANALYSIS MARKET, BY TECHNOLOGY, 2018-2032 (USD THOUSAND)
TABLE 345 AUSTRALIA ACADEMIC INSTITUTES IN SURFACE ANALYSIS MARKET, BY TECHNOLOGY, 2018-2032 (USD THOUSAND)
TABLE 346 SINGAPORE SURFACE ANALYSIS MARKET, BY TECHNOLOGY, 2018-2032 (USD THOUSAND)
TABLE 347 SINGAPORE MICROSCOPY IN SURFACE ANALYSIS MARKET, BY METHOD, 2018-2032 (USD THOUSAND)
TABLE 348 SINGAPORE MICROSCOPY IN SURFACE ANALYSIS MARKET, BY TECHNIQUE, 2018-2032 (USD THOUSAND)
TABLE 349 SINGAPORE SURFACE ANALYSIS MARKET, BY TYPE, 2018-2032 (USD THOUSAND)
TABLE 350 SINGAPORE SURFACE ANALYSIS MARKET, BY METHOD TYPE, 2018-2032 (USD THOUSAND)
TABLE 351 SINGAPORE SURFACE ANALYSIS MARKET, BY EQUIPMENT TYPE, 2018-2032 (USD THOUSAND)
TABLE 352 SINGAPORE SCANNING PROBE MICROSCOPES (SPM)/ATOMIC FORCE MICROSCOPES (AFM) IN SURFACE ANALYSIS MARKET, BY OPERATION, 2018-2032 (USD THOUSAND)
TABLE 353 SINGAPORE SCANNING PROBE MICROSCOPES (SPM)/ATOMIC FORCE MICROSCOPES (AFM) IN SURFACE ANALYSIS MARKET, BY NOISE LEVEL, 2018-2032 (USD THOUSAND)
TABLE 354 SINGAPORE SURFACE ANALYSIS MARKET, BY APPLICATION, 2018-2032 (USD THOUSAND)
TABLE 355 SINGAPORE SURFACE ANALYSIS MARKET, BY END USER, 2018-2032 (USD THOUSAND)
TABLE 356 SINGAPORE INDUSTRIES IN SURFACE ANALYSIS MARKET, BY TYPE, 2018-2032 (USD THOUSAND)
TABLE 357 SINGAPORE INDUSTRIES IN SURFACE ANALYSIS MARKET, BY TECHNOLOGY, 2018-2032 (USD THOUSAND)
TABLE 358 SINGAPORE RESEARCH ORGANIZATION IN SURFACE ANALYSIS MARKET, BY TECHNOLOGY, 2018-2032 (USD THOUSAND)
TABLE 359 SINGAPORE ACADEMIC INSTITUTES IN SURFACE ANALYSIS MARKET, BY TECHNOLOGY, 2018-2032 (USD THOUSAND)
TABLE 360 INDONESIA SURFACE ANALYSIS MARKET, BY TECHNOLOGY, 2018-2032 (USD THOUSAND)
TABLE 361 INDONESIA MICROSCOPY IN SURFACE ANALYSIS MARKET, BY METHOD, 2018-2032 (USD THOUSAND)
TABLE 362 INDONESIA MICROSCOPY IN SURFACE ANALYSIS MARKET, BY TECHNIQUE, 2018-2032 (USD THOUSAND)
TABLE 363 INDONESIA SURFACE ANALYSIS MARKET, BY TYPE, 2018-2032 (USD THOUSAND)
TABLE 364 INDONESIA SURFACE ANALYSIS MARKET, BY METHOD TYPE, 2018-2032 (USD THOUSAND)
TABLE 365 INDONESIA SURFACE ANALYSIS MARKET, BY EQUIPMENT TYPE, 2018-2032 (USD THOUSAND)
TABLE 366 INDONESIA SCANNING PROBE MICROSCOPES (SPM)/ATOMIC FORCE MICROSCOPES (AFM) IN SURFACE ANALYSIS MARKET, BY OPERATION, 2018-2032 (USD THOUSAND)
TABLE 367 INDONESIA SCANNING PROBE MICROSCOPES (SPM)/ATOMIC FORCE MICROSCOPES (AFM) IN SURFACE ANALYSIS MARKET, BY NOISE LEVEL, 2018-2032 (USD THOUSAND)
TABLE 368 INDONESIA SURFACE ANALYSIS MARKET, BY APPLICATION, 2018-2032 (USD THOUSAND)
TABLE 369 INDONESIA SURFACE ANALYSIS MARKET, BY END USER, 2018-2032 (USD THOUSAND)
TABLE 370 INDONESIA INDUSTRIES IN SURFACE ANALYSIS MARKET, BY TYPE, 2018-2032 (USD THOUSAND)
TABLE 371 INDONESIA INDUSTRIES IN SURFACE ANALYSIS MARKET, BY TECHNOLOGY, 2018-2032 (USD THOUSAND)
TABLE 372 INDONESIA RESEARCH ORGANIZATION IN SURFACE ANALYSIS MARKET, BY TECHNOLOGY, 2018-2032 (USD THOUSAND)
TABLE 373 INDONESIA ACADEMIC INSTITUTES IN SURFACE ANALYSIS MARKET, BY TECHNOLOGY, 2018-2032 (USD THOUSAND)
TABLE 374 THAILAND SURFACE ANALYSIS MARKET, BY TECHNOLOGY, 2018-2032 (USD THOUSAND)
TABLE 375 THAILAND MICROSCOPY IN SURFACE ANALYSIS MARKET, BY METHOD, 2018-2032 (USD THOUSAND)
TABLE 376 THAILAND MICROSCOPY IN SURFACE ANALYSIS MARKET, BY TECHNIQUE, 2018-2032 (USD THOUSAND)
TABLE 377 THAILAND SURFACE ANALYSIS MARKET, BY TYPE, 2018-2032 (USD THOUSAND)
TABLE 378 THAILAND SURFACE ANALYSIS MARKET, BY METHOD TYPE, 2018-2032 (USD THOUSAND)
TABLE 379 THAILAND SURFACE ANALYSIS MARKET, BY EQUIPMENT TYPE, 2018-2032 (USD THOUSAND)
TABLE 380 THAILAND SCANNING PROBE MICROSCOPES (SPM)/ATOMIC FORCE MICROSCOPES (AFM) IN SURFACE ANALYSIS MARKET, BY OPERATION, 2018-2032 (USD THOUSAND)
TABLE 381 THAILAND SCANNING PROBE MICROSCOPES (SPM)/ATOMIC FORCE MICROSCOPES (AFM) IN SURFACE ANALYSIS MARKET, BY NOISE LEVEL, 2018-2032 (USD THOUSAND)
TABLE 382 THAILAND SURFACE ANALYSIS MARKET, BY APPLICATION, 2018-2032 (USD THOUSAND)
TABLE 383 THAILAND SURFACE ANALYSIS MARKET, BY END USER, 2018-2032 (USD THOUSAND)
TABLE 384 THAILAND INDUSTRIES IN SURFACE ANALYSIS MARKET, BY TYPE, 2018-2032 (USD THOUSAND)
TABLE 385 THAILAND INDUSTRIES IN SURFACE ANALYSIS MARKET, BY TECHNOLOGY, 2018-2032 (USD THOUSAND)
TABLE 386 THAILAND RESEARCH ORGANIZATION IN SURFACE ANALYSIS MARKET, BY TECHNOLOGY, 2018-2032 (USD THOUSAND)
TABLE 387 THAILAND ACADEMIC INSTITUTES IN SURFACE ANALYSIS MARKET, BY TECHNOLOGY, 2018-2032 (USD THOUSAND)
TABLE 388 MALAYSIA SURFACE ANALYSIS MARKET, BY TECHNOLOGY, 2018-2032 (USD THOUSAND)
TABLE 389 MALAYSIA MICROSCOPY IN SURFACE ANALYSIS MARKET, BY METHOD, 2018-2032 (USD THOUSAND)
TABLE 390 MALAYSIA MICROSCOPY IN SURFACE ANALYSIS MARKET, BY TECHNIQUE, 2018-2032 (USD THOUSAND)
TABLE 391 MALAYSIA SURFACE ANALYSIS MARKET, BY TYPE, 2018-2032 (USD THOUSAND)
TABLE 392 MALAYSIA SURFACE ANALYSIS MARKET, BY METHOD TYPE, 2018-2032 (USD THOUSAND)
TABLE 393 MALAYSIA SURFACE ANALYSIS MARKET, BY EQUIPMENT TYPE, 2018-2032 (USD THOUSAND)
TABLE 394 MALAYSIA SCANNING PROBE MICROSCOPES (SPM)/ATOMIC FORCE MICROSCOPES (AFM) IN SURFACE ANALYSIS MARKET, BY OPERATION, 2018-2032 (USD THOUSAND)
TABLE 395 MALAYSIA SCANNING PROBE MICROSCOPES (SPM)/ATOMIC FORCE MICROSCOPES (AFM) IN SURFACE ANALYSIS MARKET, BY NOISE LEVEL, 2018-2032 (USD THOUSAND)
TABLE 396 MALAYSIA SURFACE ANALYSIS MARKET, BY APPLICATION, 2018-2032 (USD THOUSAND)
TABLE 397 MALAYSIA SURFACE ANALYSIS MARKET, BY END USER, 2018-2032 (USD THOUSAND)
TABLE 398 MALAYSIA INDUSTRIES IN SURFACE ANALYSIS MARKET, BY TYPE, 2018-2032 (USD THOUSAND)
TABLE 399 MALAYSIA INDUSTRIES IN SURFACE ANALYSIS MARKET, BY TECHNOLOGY, 2018-2032 (USD THOUSAND)
TABLE 400 MALAYSIA RESEARCH ORGANIZATION IN SURFACE ANALYSIS MARKET, BY TECHNOLOGY, 2018-2032 (USD THOUSAND)
TABLE 401 MALAYSIA ACADEMIC INSTITUTES IN SURFACE ANALYSIS MARKET, BY TECHNOLOGY, 2018-2032 (USD THOUSAND)
TABLE 402 PHILIPPINES SURFACE ANALYSIS MARKET, BY TECHNOLOGY, 2018-2032 (USD THOUSAND)
TABLE 403 PHILIPPINES MICROSCOPY IN SURFACE ANALYSIS MARKET, BY METHOD, 2018-2032 (USD THOUSAND)
TABLE 404 PHILIPPINES MICROSCOPY IN SURFACE ANALYSIS MARKET, BY TECHNIQUE, 2018-2032 (USD THOUSAND)
TABLE 405 PHILIPPINES SURFACE ANALYSIS MARKET, BY TYPE, 2018-2032 (USD THOUSAND)
TABLE 406 PHILIPPINES SURFACE ANALYSIS MARKET, BY METHOD TYPE, 2018-2032 (USD THOUSAND)
TABLE 407 PHILIPPINES SURFACE ANALYSIS MARKET, BY EQUIPMENT TYPE, 2018-2032 (USD THOUSAND)
TABLE 408 PHILIPPINES SCANNING PROBE MICROSCOPES (SPM)/ATOMIC FORCE MICROSCOPES (AFM) IN SURFACE ANALYSIS MARKET, BY OPERATION, 2018-2032 (USD THOUSAND)
TABLE 409 PHILIPPINES SCANNING PROBE MICROSCOPES (SPM)/ATOMIC FORCE MICROSCOPES (AFM) IN SURFACE ANALYSIS MARKET, BY NOISE LEVEL, 2018-2032 (USD THOUSAND)
TABLE 410 PHILIPPINES SURFACE ANALYSIS MARKET, BY APPLICATION, 2018-2032 (USD THOUSAND)
TABLE 411 PHILIPPINES SURFACE ANALYSIS MARKET, BY END USER, 2018-2032 (USD THOUSAND)
TABLE 412 PHILIPPINES INDUSTRIES IN SURFACE ANALYSIS MARKET, BY TYPE, 2018-2032 (USD THOUSAND)
TABLE 413 PHILIPPINES INDUSTRIES IN SURFACE ANALYSIS MARKET, BY TECHNOLOGY, 2018-2032 (USD THOUSAND)
TABLE 414 PHILIPPINES RESEARCH ORGANIZATION IN SURFACE ANALYSIS MARKET, BY TECHNOLOGY, 2018-2032 (USD THOUSAND)
TABLE 415 PHILIPPINES ACADEMIC INSTITUTES IN SURFACE ANALYSIS MARKET, BY TECHNOLOGY, 2018-2032 (USD THOUSAND)
TABLE 416 NEW-ZEALAND SURFACE ANALYSIS MARKET, BY TECHNOLOGY, 2018-2032 (USD THOUSAND)
TABLE 417 NEW-ZEALAND MICROSCOPY IN SURFACE ANALYSIS MARKET, BY METHOD, 2018-2032 (USD THOUSAND)
TABLE 418 NEW-ZEALAND MICROSCOPY IN SURFACE ANALYSIS MARKET, BY TECHNIQUE, 2018-2032 (USD THOUSAND)
TABLE 419 NEW-ZEALAND SURFACE ANALYSIS MARKET, BY TYPE, 2018-2032 (USD THOUSAND)
TABLE 420 NEW-ZEALAND SURFACE ANALYSIS MARKET, BY METHOD TYPE, 2018-2032 (USD THOUSAND)
TABLE 421 NEW-ZEALAND SURFACE ANALYSIS MARKET, BY EQUIPMENT TYPE, 2018-2032 (USD THOUSAND)
TABLE 422 NEW-ZEALAND SCANNING PROBE MICROSCOPES (SPM)/ATOMIC FORCE MICROSCOPES (AFM) IN SURFACE ANALYSIS MARKET, BY OPERATION, 2018-2032 (USD THOUSAND)
TABLE 423 NEW-ZEALAND SCANNING PROBE MICROSCOPES (SPM)/ATOMIC FORCE MICROSCOPES (AFM) IN SURFACE ANALYSIS MARKET, BY NOISE LEVEL, 2018-2032 (USD THOUSAND)
TABLE 424 NEW-ZEALAND SURFACE ANALYSIS MARKET, BY APPLICATION, 2018-2032 (USD THOUSAND)
TABLE 425 NEW-ZEALAND SURFACE ANALYSIS MARKET, BY END USER, 2018-2032 (USD THOUSAND)
TABLE 426 NEW-ZEALAND INDUSTRIES IN SURFACE ANALYSIS MARKET, BY TYPE, 2018-2032 (USD THOUSAND)
TABLE 427 NEW-ZEALAND INDUSTRIES IN SURFACE ANALYSIS MARKET, BY TECHNOLOGY, 2018-2032 (USD THOUSAND)
TABLE 428 NEW-ZEALAND RESEARCH ORGANIZATION IN SURFACE ANALYSIS MARKET, BY TECHNOLOGY, 2018-2032 (USD THOUSAND)
TABLE 429 NEW-ZEALAND ACADEMIC INSTITUTES IN SURFACE ANALYSIS MARKET, BY TECHNOLOGY, 2018-2032 (USD THOUSAND)
TABLE 430 REST OF ASIA-PACIFIC SURFACE ANALYSIS MARKET, BY TECHNOLOGY, 2018-2032 (USD THOUSAND)
TABLE 431 SOUTH AMERICA SURFACE ANALYSIS MARKET, BY COUNTRY, 2018-2032 (USD THOUSAND)
TABLE 432 SOUTH AMERICA SURFACE ANALYSIS MARKET, BY TECHNOLOGY, 2018-2032 (USD THOUSAND)
TABLE 433 SOUTH AMERICA MICROSCOPY IN SURFACE ANALYSIS MARKET, BY METHOD, 2018-2032 (USD THOUSAND)
TABLE 434 SOUTH AMERICA MICROSCOPY IN SURFACE ANALYSIS MARKET, BY TECHNIQUE, 2018-2032 (USD THOUSAND)
TABLE 435 SOUTH AMERICA SURFACE ANALYSIS MARKET, BY TYPE, 2018-2032 (USD THOUSAND)
TABLE 436 SOUTH AMERICA SURFACE ANALYSIS MARKET, BY METHOD TYPE, 2018-2032 (USD THOUSAND)
TABLE 437 SOUTH AMERICA SURFACE ANALYSIS MARKET, BY EQUIPMENT TYPE, 2018-2032 (USD THOUSAND)
TABLE 438 SOUTH AMERICA SCANNING PROBE MICROSCOPES (SPM)/ATOMIC FORCE MICROSCOPES (AFM) IN SURFACE ANALYSIS MARKET, BY OPERATION, 2018-2032 (USD THOUSAND)
TABLE 439 SOUTH AMERICA SCANNING PROBE MICROSCOPES (SPM)/ATOMIC FORCE MICROSCOPES (AFM) IN SURFACE ANALYSIS MARKET, BY NOISE LEVEL, 2018-2032 (USD THOUSAND)
TABLE 440 SOUTH AMERICA SURFACE ANALYSIS MARKET, BY APPLICATION, 2018-2032 (USD THOUSAND)
TABLE 441 SOUTH AMERICA SURFACE ANALYSIS MARKET, BY END USER, 2018-2032 (USD THOUSAND)
TABLE 442 SOUTH AMERICA INDUSTRIES IN SURFACE ANALYSIS MARKET, BY TYPE, 2018-2032 (USD THOUSAND)
TABLE 443 SOUTH AMERICA INDUSTRIES IN SURFACE ANALYSIS MARKET, BY TECHNOLOGY, 2018-2032 (USD THOUSAND)
TABLE 444 SOUTH AMERICA RESEARCH ORGANIZATION IN SURFACE ANALYSIS MARKET, BY TECHNOLOGY, 2018-2032 (USD THOUSAND)
TABLE 445 SOUTH AMERICA ACADEMIC INSTITUTES IN SURFACE ANALYSIS MARKET, BY TECHNOLOGY, 2018-2032 (USD THOUSAND)
TABLE 446 BRAZIL SURFACE ANALYSIS MARKET, BY TECHNOLOGY, 2018-2032 (USD THOUSAND)
TABLE 447 BRAZIL MICROSCOPY IN SURFACE ANALYSIS MARKET, BY METHOD, 2018-2032 (USD THOUSAND)
TABLE 448 BRAZIL MICROSCOPY IN SURFACE ANALYSIS MARKET, BY TECHNIQUE, 2018-2032 (USD THOUSAND)
TABLE 449 BRAZIL SURFACE ANALYSIS MARKET, BY TYPE, 2018-2032 (USD THOUSAND)
TABLE 450 BRAZIL SURFACE ANALYSIS MARKET, BY METHOD TYPE, 2018-2032 (USD THOUSAND)
TABLE 451 BRAZIL SURFACE ANALYSIS MARKET, BY EQUIPMENT TYPE, 2018-2032 (USD THOUSAND)
TABLE 452 BRAZIL SCANNING PROBE MICROSCOPES (SPM)/ATOMIC FORCE MICROSCOPES (AFM) IN SURFACE ANALYSIS MARKET, BY OPERATION, 2018-2032 (USD THOUSAND)
TABLE 453 BRAZIL SCANNING PROBE MICROSCOPES (SPM)/ATOMIC FORCE MICROSCOPES (AFM) IN SURFACE ANALYSIS MARKET, BY NOISE LEVEL, 2018-2032 (USD THOUSAND)
TABLE 454 BRAZIL SURFACE ANALYSIS MARKET, BY APPLICATION, 2018-2032 (USD THOUSAND)
TABLE 455 BRAZIL SURFACE ANALYSIS MARKET, BY END USER, 2018-2032 (USD THOUSAND)
TABLE 456 BRAZIL INDUSTRIES IN SURFACE ANALYSIS MARKET, BY TYPE, 2018-2032 (USD THOUSAND)
TABLE 457 BRAZIL INDUSTRIES IN SURFACE ANALYSIS MARKET, BY TECHNOLOGY, 2018-2032 (USD THOUSAND)
TABLE 458 BRAZIL RESEARCH ORGANIZATION IN SURFACE ANALYSIS MARKET, BY TECHNOLOGY, 2018-2032 (USD THOUSAND)
TABLE 459 BRAZIL ACADEMIC INSTITUTES IN SURFACE ANALYSIS MARKET, BY TECHNOLOGY, 2018-2032 (USD THOUSAND)
TABLE 460 ARGENTINA SURFACE ANALYSIS MARKET, BY TECHNOLOGY, 2018-2032 (USD THOUSAND)
TABLE 461 ARGENTINA MICROSCOPY IN SURFACE ANALYSIS MARKET, BY METHOD, 2018-2032 (USD THOUSAND)
TABLE 462 ARGENTINA MICROSCOPY IN SURFACE ANALYSIS MARKET, BY TECHNIQUE, 2018-2032 (USD THOUSAND)
TABLE 463 ARGENTINA SURFACE ANALYSIS MARKET, BY TYPE, 2018-2032 (USD THOUSAND)
TABLE 464 ARGENTINA SURFACE ANALYSIS MARKET, BY METHOD TYPE, 2018-2032 (USD THOUSAND)
TABLE 465 ARGENTINA SURFACE ANALYSIS MARKET, BY EQUIPMENT TYPE, 2018-2032 (USD THOUSAND)
TABLE 466 ARGENTINA SCANNING PROBE MICROSCOPES (SPM)/ATOMIC FORCE MICROSCOPES (AFM) IN SURFACE ANALYSIS MARKET, BY OPERATION, 2018-2032 (USD THOUSAND)
TABLE 467 ARGENTINA SCANNING PROBE MICROSCOPES (SPM)/ATOMIC FORCE MICROSCOPES (AFM) IN SURFACE ANALYSIS MARKET, BY NOISE LEVEL, 2018-2032 (USD THOUSAND)
TABLE 468 ARGENTINA SURFACE ANALYSIS MARKET, BY APPLICATION, 2018-2032 (USD THOUSAND)
TABLE 469 ARGENTINA SURFACE ANALYSIS MARKET, BY END USER, 2018-2032 (USD THOUSAND)
TABLE 470 ARGENTINA INDUSTRIES IN SURFACE ANALYSIS MARKET, BY TYPE, 2018-2032 (USD THOUSAND)
TABLE 471 ARGENTINA INDUSTRIES IN SURFACE ANALYSIS MARKET, BY TECHNOLOGY, 2018-2032 (USD THOUSAND)
TABLE 472 ARGENTINA RESEARCH ORGANIZATION IN SURFACE ANALYSIS MARKET, BY TECHNOLOGY, 2018-2032 (USD THOUSAND)
TABLE 473 ARGENTINA ACADEMIC INSTITUTES IN SURFACE ANALYSIS MARKET, BY TECHNOLOGY, 2018-2032 (USD THOUSAND)
TABLE 474 REST OF SOUTH AMERICA SURFACE ANALYSIS MARKET, BY TECHNOLOGY, 2018-2032 (USD THOUSAND)
TABLE 475 MIDDLE EAST AND AFRICA SURFACE ANALYSIS MARKET, BY COUNTRY, 2018-2032 (USD THOUSAND)
TABLE 476 MIDDLE EAST AND AFRICA SURFACE ANALYSIS MARKET, BY TECHNOLOGY, 2018-2032 (USD THOUSAND)
TABLE 477 MIDDLE EAST AND AFRICA MICROSCOPY IN SURFACE ANALYSIS MARKET, BY METHOD, 2018-2032 (USD THOUSAND)
TABLE 478 MIDDLE EAST AND AFRICA MICROSCOPY IN SURFACE ANALYSIS MARKET, BY TECHNIQUE, 2018-2032 (USD THOUSAND)
TABLE 479 MIDDLE EAST AND AFRICA SURFACE ANALYSIS MARKET, BY TYPE, 2018-2032 (USD THOUSAND)
TABLE 480 MIDDLE EAST AND AFRICA SURFACE ANALYSIS MARKET, BY METHOD TYPE, 2018-2032 (USD THOUSAND)
TABLE 481 MIDDLE EAST AND AFRICA SURFACE ANALYSIS MARKET, BY EQUIPMENT TYPE, 2018-2032 (USD THOUSAND)
TABLE 482 MIDDLE EAST AND AFRICA SCANNING PROBE MICROSCOPES (SPM)/ATOMIC FORCE MICROSCOPES (AFM) IN SURFACE ANALYSIS MARKET, BY OPERATION, 2018-2032 (USD THOUSAND)
TABLE 483 MIDDLE EAST AND AFRICA SCANNING PROBE MICROSCOPES (SPM)/ATOMIC FORCE MICROSCOPES (AFM) IN SURFACE ANALYSIS MARKET, BY NOISE LEVEL, 2018-2032 (USD THOUSAND)
TABLE 484 MIDDLE EAST AND AFRICA SURFACE ANALYSIS MARKET, BY APPLICATION, 2018-2032 (USD THOUSAND)
TABLE 485 MIDDLE EAST AND AFRICA SURFACE ANALYSIS MARKET, BY END USER, 2018-2032 (USD THOUSAND)
TABLE 486 MIDDLE EAST AND AFRICA INDUSTRIES IN SURFACE ANALYSIS MARKET, BY TYPE, 2018-2032 (USD THOUSAND)
TABLE 487 MIDDLE EAST AND AFRICA INDUSTRIES IN SURFACE ANALYSIS MARKET, BY TECHNOLOGY, 2018-2032 (USD THOUSAND)
TABLE 488 MIDDLE EAST AND AFRICA RESEARCH ORGANIZATION IN SURFACE ANALYSIS MARKET, BY TECHNOLOGY, 2018-2032 (USD THOUSAND)
TABLE 489 MIDDLE EAST AND AFRICA ACADEMIC INSTITUTES IN SURFACE ANALYSIS MARKET, BY TECHNOLOGY, 2018-2032 (USD THOUSAND)
TABLE 490 SAUDI ARABIA SURFACE ANALYSIS MARKET, BY TECHNOLOGY, 2018-2032 (USD THOUSAND)
TABLE 491 SAUDI ARABIA MICROSCOPY IN SURFACE ANALYSIS MARKET, BY METHOD, 2018-2032 (USD THOUSAND)
TABLE 492 SAUDI ARABIA MICROSCOPY IN SURFACE ANALYSIS MARKET, BY TECHNIQUE, 2018-2032 (USD THOUSAND)
TABLE 493 SAUDI ARABIA SURFACE ANALYSIS MARKET, BY TYPE, 2018-2032 (USD THOUSAND)
TABLE 494 SAUDI ARABIA SURFACE ANALYSIS MARKET, BY METHOD TYPE, 2018-2032 (USD THOUSAND)
TABLE 495 SAUDI ARABIA SURFACE ANALYSIS MARKET, BY EQUIPMENT TYPE, 2018-2032 (USD THOUSAND)
TABLE 496 SAUDI ARABIA SCANNING PROBE MICROSCOPES (SPM)/ATOMIC FORCE MICROSCOPES (AFM) IN SURFACE ANALYSIS MARKET, BY OPERATION, 2018-2032 (USD THOUSAND)
TABLE 497 SAUDI ARABIA SCANNING PROBE MICROSCOPES (SPM)/ATOMIC FORCE MICROSCOPES (AFM) IN SURFACE ANALYSIS MARKET, BY NOISE LEVEL, 2018-2032 (USD THOUSAND)
TABLE 498 SAUDI ARABIA SURFACE ANALYSIS MARKET, BY APPLICATION, 2018-2032 (USD THOUSAND)
TABLE 499 SAUDI ARABIA SURFACE ANALYSIS MARKET, BY END USER, 2018-2032 (USD THOUSAND)
TABLE 500 SAUDI ARABIA INDUSTRIES IN SURFACE ANALYSIS MARKET, BY TYPE, 2018-2032 (USD THOUSAND)
TABLE 501 SAUDI ARABIA INDUSTRIES IN SURFACE ANALYSIS MARKET, BY TECHNOLOGY, 2018-2032 (USD THOUSAND)
TABLE 502 SAUDI ARABIA RESEARCH ORGANIZATION IN SURFACE ANALYSIS MARKET, BY TECHNOLOGY, 2018-2032 (USD THOUSAND)
TABLE 503 SAUDI ARABIA ACADEMIC INSTITUTES IN SURFACE ANALYSIS MARKET, BY TECHNOLOGY, 2018-2032 (USD THOUSAND)
TABLE 504 SOUTH AFRICA SURFACE ANALYSIS MARKET, BY TECHNOLOGY, 2018-2032 (USD THOUSAND)
TABLE 505 SOUTH AFRICA MICROSCOPY IN SURFACE ANALYSIS MARKET, BY METHOD, 2018-2032 (USD THOUSAND)
TABLE 506 SOUTH AFRICA MICROSCOPY IN SURFACE ANALYSIS MARKET, BY TECHNIQUE, 2018-2032 (USD THOUSAND)
TABLE 507 SOUTH AFRICA SURFACE ANALYSIS MARKET, BY TYPE, 2018-2032 (USD THOUSAND)
TABLE 508 SOUTH AFRICA SURFACE ANALYSIS MARKET, BY METHOD TYPE, 2018-2032 (USD THOUSAND)
TABLE 509 SOUTH AFRICA SURFACE ANALYSIS MARKET, BY EQUIPMENT TYPE, 2018-2032 (USD THOUSAND)
TABLE 510 SOUTH AFRICA SCANNING PROBE MICROSCOPES (SPM)/ATOMIC FORCE MICROSCOPES (AFM) IN SURFACE ANALYSIS MARKET, BY OPERATION, 2018-2032 (USD THOUSAND)
TABLE 511 SOUTH AFRICA SCANNING PROBE MICROSCOPES (SPM)/ATOMIC FORCE MICROSCOPES (AFM) IN SURFACE ANALYSIS MARKET, BY NOISE LEVEL, 2018-2032 (USD THOUSAND)
TABLE 512 SOUTH AFRICA SURFACE ANALYSIS MARKET, BY APPLICATION, 2018-2032 (USD THOUSAND)
TABLE 513 SOUTH AFRICA SURFACE ANALYSIS MARKET, BY END USER, 2018-2032 (USD THOUSAND)
TABLE 514 SOUTH AFRICA INDUSTRIES IN SURFACE ANALYSIS MARKET, BY TYPE, 2018-2032 (USD THOUSAND)
TABLE 515 SOUTH AFRICA INDUSTRIES IN SURFACE ANALYSIS MARKET, BY TECHNOLOGY, 2018-2032 (USD THOUSAND)
TABLE 516 SOUTH AFRICA RESEARCH ORGANIZATION IN SURFACE ANALYSIS MARKET, BY TECHNOLOGY, 2018-2032 (USD THOUSAND)
TABLE 517 SOUTH AFRICA ACADEMIC INSTITUTES IN SURFACE ANALYSIS MARKET, BY TECHNOLOGY, 2018-2032 (USD THOUSAND)
TABLE 518 U.A.E. SURFACE ANALYSIS MARKET, BY TECHNOLOGY, 2018-2032 (USD THOUSAND)
TABLE 519 U.A.E. MICROSCOPY IN SURFACE ANALYSIS MARKET, BY METHOD, 2018-2032 (USD THOUSAND)
TABLE 520 U.A.E. MICROSCOPY IN SURFACE ANALYSIS MARKET, BY TECHNIQUE, 2018-2032 (USD THOUSAND)
TABLE 521 U.A.E. SURFACE ANALYSIS MARKET, BY TYPE, 2018-2032 (USD THOUSAND)
TABLE 522 U.A.E. SURFACE ANALYSIS MARKET, BY METHOD TYPE, 2018-2032 (USD THOUSAND)
TABLE 523 U.A.E. SURFACE ANALYSIS MARKET, BY EQUIPMENT TYPE, 2018-2032 (USD THOUSAND)
TABLE 524 U.A.E. SCANNING PROBE MICROSCOPES (SPM)/ATOMIC FORCE MICROSCOPES (AFM) IN SURFACE ANALYSIS MARKET, BY OPERATION, 2018-2032 (USD THOUSAND)
TABLE 525 U.A.E. SCANNING PROBE MICROSCOPES (SPM)/ATOMIC FORCE MICROSCOPES (AFM) IN SURFACE ANALYSIS MARKET, BY NOISE LEVEL, 2018-2032 (USD THOUSAND)
TABLE 526 U.A.E. SURFACE ANALYSIS MARKET, BY APPLICATION, 2018-2032 (USD THOUSAND)
TABLE 527 U.A.E. SURFACE ANALYSIS MARKET, BY END USER, 2018-2032 (USD THOUSAND)
TABLE 528 U.A.E. INDUSTRIES IN SURFACE ANALYSIS MARKET, BY TYPE, 2018-2032 (USD THOUSAND)
TABLE 529 U.A.E. INDUSTRIES IN SURFACE ANALYSIS MARKET, BY TECHNOLOGY, 2018-2032 (USD THOUSAND)
TABLE 530 U.A.E. RESEARCH ORGANIZATION IN SURFACE ANALYSIS MARKET, BY TECHNOLOGY, 2018-2032 (USD THOUSAND)
TABLE 531 U.A.E. ACADEMIC INSTITUTES IN SURFACE ANALYSIS MARKET, BY TECHNOLOGY, 2018-2032 (USD THOUSAND)
TABLE 532 EGYPT SURFACE ANALYSIS MARKET, BY TECHNOLOGY, 2018-2032 (USD THOUSAND)
TABLE 533 EGYPT MICROSCOPY IN SURFACE ANALYSIS MARKET, BY METHOD, 2018-2032 (USD THOUSAND)
TABLE 534 EGYPT MICROSCOPY IN SURFACE ANALYSIS MARKET, BY TECHNIQUE, 2018-2032 (USD THOUSAND)
TABLE 535 EGYPT SURFACE ANALYSIS MARKET, BY TYPE, 2018-2032 (USD THOUSAND)
TABLE 536 EGYPT SURFACE ANALYSIS MARKET, BY METHOD TYPE, 2018-2032 (USD THOUSAND)
TABLE 537 EGYPT SURFACE ANALYSIS MARKET, BY EQUIPMENT TYPE, 2018-2032 (USD THOUSAND)
TABLE 538 EGYPT SCANNING PROBE MICROSCOPES (SPM)/ATOMIC FORCE MICROSCOPES (AFM) IN SURFACE ANALYSIS MARKET, BY OPERATION, 2018-2032 (USD THOUSAND)
TABLE 539 EGYPT SCANNING PROBE MICROSCOPES (SPM)/ATOMIC FORCE MICROSCOPES (AFM) IN SURFACE ANALYSIS MARKET, BY NOISE LEVEL, 2018-2032 (USD THOUSAND)
TABLE 540 EGYPT SURFACE ANALYSIS MARKET, BY APPLICATION, 2018-2032 (USD THOUSAND)
TABLE 541 EGYPT SURFACE ANALYSIS MARKET, BY END USER, 2018-2032 (USD THOUSAND)
TABLE 542 EGYPT INDUSTRIES IN SURFACE ANALYSIS MARKET, BY TYPE, 2018-2032 (USD THOUSAND)
TABLE 543 EGYPT INDUSTRIES IN SURFACE ANALYSIS MARKET, BY TECHNOLOGY, 2018-2032 (USD THOUSAND)
TABLE 544 EGYPT RESEARCH ORGANIZATION IN SURFACE ANALYSIS MARKET, BY TECHNOLOGY, 2018-2032 (USD THOUSAND)
TABLE 545 EGYPT ACADEMIC INSTITUTES IN SURFACE ANALYSIS MARKET, BY TECHNOLOGY, 2018-2032 (USD THOUSAND)
TABLE 546 ISRAEL SURFACE ANALYSIS MARKET, BY TECHNOLOGY, 2018-2032 (USD THOUSAND)
TABLE 547 ISRAEL MICROSCOPY IN SURFACE ANALYSIS MARKET, BY METHOD, 2018-2032 (USD THOUSAND)
TABLE 548 ISRAEL MICROSCOPY IN SURFACE ANALYSIS MARKET, BY TECHNIQUE, 2018-2032 (USD THOUSAND)
TABLE 549 ISRAEL SURFACE ANALYSIS MARKET, BY TYPE, 2018-2032 (USD THOUSAND)
TABLE 550 ISRAEL SURFACE ANALYSIS MARKET, BY METHOD TYPE, 2018-2032 (USD THOUSAND)
TABLE 551 ISRAEL SURFACE ANALYSIS MARKET, BY EQUIPMENT TYPE, 2018-2032 (USD THOUSAND)
TABLE 552 ISRAEL SCANNING PROBE MICROSCOPES (SPM)/ATOMIC FORCE MICROSCOPES (AFM) IN SURFACE ANALYSIS MARKET, BY OPERATION, 2018-2032 (USD THOUSAND)
TABLE 553 ISRAEL SCANNING PROBE MICROSCOPES (SPM)/ATOMIC FORCE MICROSCOPES (AFM) IN SURFACE ANALYSIS MARKET, BY NOISE LEVEL, 2018-2032 (USD THOUSAND)
TABLE 554 ISRAEL SURFACE ANALYSIS MARKET, BY APPLICATION, 2018-2032 (USD THOUSAND)
TABLE 555 ISRAEL SURFACE ANALYSIS MARKET, BY END USER, 2018-2032 (USD THOUSAND)
TABLE 556 ISRAEL INDUSTRIES IN SURFACE ANALYSIS MARKET, BY TYPE, 2018-2032 (USD THOUSAND)
TABLE 557 ISRAEL INDUSTRIES IN SURFACE ANALYSIS MARKET, BY TECHNOLOGY, 2018-2032 (USD THOUSAND)
TABLE 558 ISRAEL RESEARCH ORGANIZATION IN SURFACE ANALYSIS MARKET, BY TECHNOLOGY, 2018-2032 (USD THOUSAND)
TABLE 559 ISRAEL ACADEMIC INSTITUTES IN SURFACE ANALYSIS MARKET, BY TECHNOLOGY, 2018-2032 (USD THOUSAND)
TABLE 560 REST OF MIDDLE EAST AND AFRICA SURFACE ANALYSIS MARKET, BY TECHNOLOGY, 2018-2032 (USD THOUSAND)
图片列表
FIGURE 1 GLOBAL SURFACE ANALYSIS MARKET: SEGMENTATION
FIGURE 2 GLOBAL SURFACE ANALYSIS MARKET: DATA TRIANGULATION
FIGURE 3 GLOBAL SURFACE ANALYSIS MARKET: DROC ANALYSIS
FIGURE 4 GLOBAL SURFACE ANALYSIS MARKET: INTERVIEW DEMOGRAPHICS
FIGURE 5 GLOBAL SURFACE ANALYSIS MARKET: DBMR MARKET POSITION GRID
FIGURE 6 GLOBAL SURFACE ANALYSIS MARKET: MULTIVARIATE MODELING
FIGURE 7 GLOBAL SURFACE ANALYSIS MARKET: TECHNOLOGY TIMELINE CURVE
FIGURE 8 GLOBAL SURFACE ANALYSIS MARKET: APPLICATION COVERAGE GRID
FIGURE 9 GLOBAL SURFACE ANALYSIS MARKET: SEGMENTATION
FIGURE 10 SEMICONDUCTOR: GLOBAL SURFACE ANALYSIS MARKET EXECUTIVE SUMMARY
FIGURE 11 FOUR SEGMENTS COMPRISE THE GLOBAL SURFACE ANALYSIS MARKET, BY TECHNOLOGY (2024)
FIGURE 12 STRATEGIC DECISIONS
FIGURE 13 INCREASE IN THE R&D EXPENDITURE IN MEDICAL AND PHARMACEUTICAL COMPANIES THE GLOBAL SURFACE ANALYSIS MARKET DURING THE FORECAST PERIOD OF 2025 TO 2032
FIGURE 14 TECHNOLOGY SEGMENT IS EXPECTED TO ACCOUNT FOR THE LARGEST SHARE OF THE GLOBAL SURFACE ANALYSIS MARKET IN 2025 & 2032
FIGURE 15 NORTH AMERICA IS EXPECTED TO BE THE DOMINANT, AND ASIA-PACIFIC IS THE FASTEST GROWING REGION IN THE GLOBAL SURFACE ANALYSIS MARKET IN THE FORECAST PERIOD OF 2025 TO 2032
FIGURE 16 ASIA-PACIFIC IS THE FASTEST-GROWING REGION FOR THE GLOBAL SURFACE ANALYSIS MARKET IN THE FORECAST PERIOD OF 2025 TO 2032
FIGURE 17 BIGGEST MANUFACTURING ECONOMIES
FIGURE 18 DROC ANALYSIS
FIGURE 19 R&D INVESTMENTS BY INDIAN PHARMA COMPANIES
FIGURE 20 GLOBAL SURFACE ANALYSIS MARKET: BY TECHNOLOGY, 2024
FIGURE 21 GLOBAL SURFACE ANALYSIS MARKET: BY TYPE, 2024
FIGURE 22 GLOBAL SURFACE ANALYSIS MARKET: BY METHOD TYPE, 2024
FIGURE 23 GLOBAL SURFACE ANALYSIS MARKET: BY EQUIPMENT TYPE, 2024
FIGURE 24 GLOBAL SURFACE ANALYSIS MARKET: BY APPLICATION, 2024
FIGURE 25 GLOBAL SURFACE ANALYSIS MARKET: BY END USER, 2024
FIGURE 26 GLOBAL SURFACE ANALYSIS MARKET: SNAPSHOT (2024)
FIGURE 27 GLOBAL SURFACE ANALYSIS MARKET: COMPANY SHARE 2024 (%)
FIGURE 28 NORTH AMERICA SURFACE ANALYSIS MARKET: COMPANY SHARE 2024 (%)
FIGURE 29 EUROPE SURFACE ANALYSIS MARKET: COMPANY SHARE 2024 (%)
FIGURE 30 ASIA-PACIFIC SURFACE ANALYSIS MARKET: COMPANY SHARE 2024 (%)
研究方法
数据收集和基准年分析是使用具有大样本量的数据收集模块完成的。该阶段包括通过各种来源和策略获取市场信息或相关数据。它包括提前检查和规划从过去获得的所有数据。它同样包括检查不同信息源中出现的信息不一致。使用市场统计和连贯模型分析和估计市场数据。此外,市场份额分析和关键趋势分析是市场报告中的主要成功因素。要了解更多信息,请请求分析师致电或下拉您的询问。
DBMR 研究团队使用的关键研究方法是数据三角测量,其中包括数据挖掘、数据变量对市场影响的分析和主要(行业专家)验证。数据模型包括供应商定位网格、市场时间线分析、市场概览和指南、公司定位网格、专利分析、定价分析、公司市场份额分析、测量标准、全球与区域和供应商份额分析。要了解有关研究方法的更多信息,请向我们的行业专家咨询。
可定制
Data Bridge Market Research 是高级形成性研究领域的领导者。我们为向现有和新客户提供符合其目标的数据和分析而感到自豪。报告可定制,包括目标品牌的价格趋势分析、了解其他国家的市场(索取国家列表)、临床试验结果数据、文献综述、翻新市场和产品基础分析。目标竞争对手的市场分析可以从基于技术的分析到市场组合策略进行分析。我们可以按照您所需的格式和数据样式添加您需要的任意数量的竞争对手数据。我们的分析师团队还可以为您提供原始 Excel 文件数据透视表(事实手册)中的数据,或者可以帮助您根据报告中的数据集创建演示文稿。

