

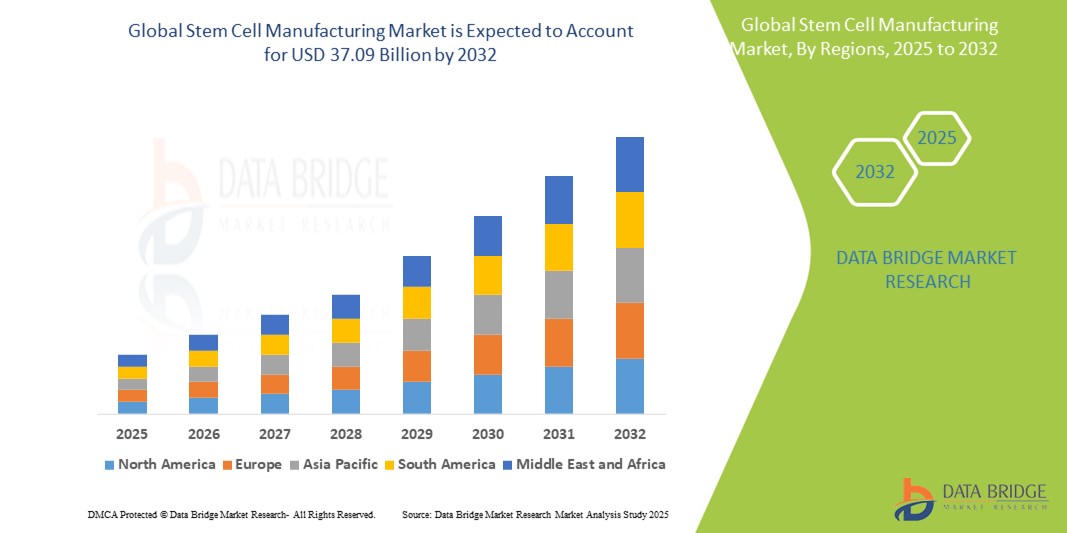
Global Stem Cell Manufacturing Market
市场规模(十亿美元)
CAGR :
% 
 USD
16.56 Billion
USD
37.09 Billion
2024
2032
USD
16.56 Billion
USD
37.09 Billion
2024
2032
| 2025 –2032 | |
| USD 16.56 Billion | |
| USD 37.09 Billion | |
| % | |
|
全球幹細胞製造市場細分,按產品(幹細胞系、儀器、消耗品和試劑盒)、應用(研究應用、臨床應用、細胞和組織庫及其他)、最終用戶(生物技術和製藥公司、研究機構和學術機構、細胞庫和組織庫、醫院和外科中心及其他)、渠道(直銷和第三方分銷商)——行業趨勢和預測到 2032 年
幹細胞製造市場規模
- 2024 年全球幹細胞製造市場規模為165.6 億美元,預計到 2032 年將達到 370.9 億美元,預測期內 複合年增長率為 10.6%。
- 這種成長是由慢性病和退化性疾病盛行率上升、老年人口成長以及製造技術進步等因素所推動的
幹細胞製造市場分析
- 幹細胞製造是再生療法發展的關鍵組成部分,可提供高品質的幹細胞用於治療多種疾病,包括神經系統疾病、心血管疾病和癌症。市場包括幹細胞擴增、分化、冷凍保存和品質控制過程
- 慢性病發病率的上升、再生醫學投資的增加以及細胞培養技術的進步極大地推動了幹細胞製造的需求
- 北美預計將主導全球幹細胞製造市場,市場份額為 45.7%,這得益於先進的研究基礎設施、大量的研發投資、強有力的監管支持、有利的細胞療法審批監管框架以及高採用率、幹細胞療法在臨床應用中的廣泛使用
- 由於人們對再生療法的認識不斷提高、醫療保健支出不斷增加以及生物技術領域不斷擴大,亞太地區預計將成為幹細胞製造市場成長最快的地區,複合年增長率為 12.4%。
- 臨床應用領域預計將佔據市場主導地位,市佔率達到 61.2%,這得益於幹細胞療法在治療多種慢性疾病(包括癌症、神經系統疾病和心血管疾病)方面的日益普及
報告範圍和幹細胞製造市場細分
|
屬性 |
幹細胞製造關鍵市場洞察 |
|
涵蓋的領域 |
|
|
覆蓋國家 |
北美洲
歐洲
亞太
中東和非洲
南美洲
|
|
主要市場參與者 |
|
|
市場機會 |
|
|
加值資料資訊集 |
除了對市場價值、成長率、細分、地理覆蓋範圍和主要參與者等市場情景的洞察之外,Data Bridge Market Research 策劃的市場報告還包括進出口分析、生產能力概覽、生產消費分析、價格趨勢分析、氣候變遷情景、供應鏈分析、價值鏈分析、原材料/消耗品概覽、供應商選擇標準、PESTLE 分析、波特分析和監管框架。 |
幹細胞製造市場趨勢
“幹細胞製造技術的進步”
- 幹細胞製造發展的一個突出趨勢是越來越多地採用自動化、封閉系統生物反應器和 3D 培養技術
- 這些創新透過降低污染風險和提高細胞質量,提高了幹細胞生產的可擴展性、一致性和成本效益,使大規模生產更加可行
- 例如,3D 生物反應器系統可以大規模生產生長和分化更均勻的幹細胞,支持再生醫學和先進細胞療法所需的複雜細胞類型的生產
- 這些進步正在改變幹細胞製造格局,促進更有效療法的開發,改善患者治療效果,並推動對下一代製造平台的需求
幹細胞製造市場動態
司機
“再生醫學和細胞療法的需求不斷增長”
- 癌症、神經系統疾病和心血管疾病等慢性疾病的發生率不斷上升,推動了對幹細胞療法的需求,這種療法為疾病改良和組織再生提供了有希望的解決方案
- 隨著全球人口老化和慢性病發病率上升,對包括幹細胞療法在內的先進治療方法的需求持續增長
- 幹細胞具有分化成各種細胞類型的獨特能力,使其成為再生醫學的理想選擇,可用於修復或替換受損組織
例如,
- 2025年1月,根據再生醫學聯盟發布的報告,預計到2028年全球再生醫學市場規模將達到600億美元,其中幹細胞療法將佔這一成長的很大一部分。需求激增的動力來自於正在進行的臨床試驗、技術進步以及對細胞療法的投資增加
- 因此,幹細胞製造市場正經歷顯著成長,各公司紛紛投資先進的製造平台,以滿足對高品質、可擴展幹細胞生產日益增長的需求
機會
“擴大個人化醫療和精準治療的應用”
- 幹細胞製造越來越多地被整合到個人化醫療中,其中治療是根據個別患者的特定基因組成和病史量身定制的
- 個人化幹細胞療法具有高度針對性的治療潛力,可以提高療效並減少副作用,從而在快速發展的醫療保健市場中提供競爭優勢
- 這些療法對於治療選擇有限的罕見疾病和病症尤其有價值,因為它們可以根據每個患者獨特的細胞需求進行客製化
例如,
- 2025年3月,根據《幹細胞轉化醫學》雜誌發表的一篇文章,個人化幹細胞療法正在獲得發展勢頭,研究人員正在開發針對脊髓損傷、心臟衰竭和神經退化性疾病等疾病的患者特異性幹細胞系。這些方法旨在透過使用自體細胞來改善患者的治療效果,降低免疫排斥和併發症的風險
- 隨著客製化細胞產品需求的不斷增長,個人化醫療的擴展預計將為幹細胞製造商創造重大機會
克制/挑戰
“製造成本高,監管複雜”
- 幹細胞製造的高成本仍然是一個重大挑戰,與細胞培養、品質控制和法規遵循相關的費用增加了整體生產成本
- 幹細胞製造過程非常複雜,需要高度控制的環境來確保最終產品的安全性、純度和效力,因此大規模生產需要大量的資金
- 此外,應對幹細胞療法複雜的監管環境可能既耗時又昂貴,這給小型生物技術公司進入市場設置了障礙
例如,
- 2025年2月,根據國際細胞和基因治療學會(ISCT)的報告,製造單劑CAR-T細胞療法的平均成本在10萬美元至40萬美元之間,取決於細胞類型和製造方法。高昂的成本對幹細胞療法的廣泛應用構成了重大障礙,尤其是在發展中市場
- 因此,幹細胞製造的高成本可能會限制市場成長,限制患者獲得治療的機會,並減緩創新細胞療法的商業化。
幹細胞製造市場範圍
市場根據產品、應用、最終用戶和分銷管道進行細分。
|
分割 |
細分 |
|
按產品 |
|
|
按應用 |
|
|
按最終用戶 |
|
|
按分銷管道 |
|
預計到 2025 年,臨床應用將佔據市場主導地位,佔據應用領域的最大份額
預計到 2025 年,臨床應用領域將佔據幹細胞製造市場的主導地位,佔據 61.2% 的最大份額,這得益於幹細胞療法在治療多種慢性疾病(包括癌症、神經系統疾病和心血管疾病)中的應用日益增多。人們對個人化醫療的日益關注以及獲準的幹細胞療法數量的增加進一步支持了這一領域的擴張,改善了患者的治療效果並推動了市場成長。
預計在預測期內,消耗品和套件將佔據產品市場的最大份額
到 2025 年,預計消耗品和試劑盒部分將主導幹細胞製造市場,佔據 55.4% 的最大市場份額,這得益於幹細胞研究和治療中培養基、試劑和細胞生長補充劑等必需品的頻繁使用。這些消耗品對於維持細胞活力和促進分化至關重要,支持再生醫學的快速發展和越來越多的基於幹細胞的臨床試驗。
幹細胞製造市場區域分析
“北美佔據幹細胞製造市場最大份額”
- 北美在全球幹細胞製造市場佔據主導地位,佔45.7%的市場。這種主導地位得益於先進的研究基礎設施、大量的研發投資、強有力的監管支持、有利的細胞療法審批監管框架以及高採用率、幹細胞療法在臨床應用中的廣泛使用
- 美國引領北美市場,佔據該地區 81.2% 的份額,這得益於高額的研究資金、政府和私營部門對幹細胞研究的大量投資、生物技術中心、領先的生物技術和製藥公司的存在以及臨床試驗活動、大量正在進行的干細胞療法臨床試驗
“亞太地區預計將實現幹細胞製造市場最高複合年增長率”
- 亞太地區預計將見證幹細胞製造市場的最高成長率,預計複合年增長率為 12.4%,這得益於醫療保健投資的增加、醫療保健基礎設施的快速擴張、意識的提高、患者對乾細胞療法的認識不斷提高以及政府的支持、促進生物技術的有利政策
- 中國在區域市場中佔據主導地位,佔據亞太地區 65.2% 的市場份額,這得益於大型生物技術製造、廣泛的生物製藥製造能力、政府資金、對生物技術創新的大力支持以及臨床試驗、大量的幹細胞臨床試驗
- 印度預計將在亞太市場中實現最高的複合年增長率,達到 11.3%,這得益於醫療旅遊業的成長、醫療保健基礎設施的擴大以及研發重點的增加,以及對再生醫學研發的重視
幹細胞製造市佔率
市場競爭格局提供了競爭對手的詳細資訊。詳細資訊包括公司概況、公司財務狀況、收入、市場潛力、研發投資、新市場計劃、全球影響力、生產基地和設施、生產能力、公司優勢和劣勢、產品發布、產品寬度和廣度、應用優勢。以上提供的數據點僅與公司對市場的關注有關。
市場中主要的市場領導者有:
- BD(美國)
- 賽默飛世爾科技公司(們)
- 默克集團(德國)
- 器官發生公司(們)
- Vericel Corporation(美國)
- 前體。有限公司(韓國)
- VistaGen Therapeutics, Inc.(美國)
- American CryoStem Corporation(美國)
- PromoCell(德國)
- 賽多利斯股份公司(德國)
- Vertex Pharmaceuticals Incorporated(美國)
- STEMCELL Technologies(加拿大)
- 武田藥品工業株式會社(日本)
- 第一三共株式會社(日本)
- Bio-Techne(美國)
- REPROCELL公司(日本)
- Catalent, Inc.(美國)
- Mesoblast有限公司(澳洲)
- 安斯泰來製藥公司(日本)
- 富士軟片控股株式會社(日本)
全球幹細胞製造市場的最新發展
- 2025 年 2 月,賽默飛世爾科技公司宣布推出其下一代 Gibco 幹細胞培養系統,旨在增強幹細胞擴增和分化,以用於研究和治療應用。此創新系統採用先進的培養基配方、優化的生長因子和封閉系統生物反應器,旨在提高細胞品質和可擴展性,滿足再生醫學和個人化治療日益增長的需求
- 2024 年 12 月,BD(碧迪公司)推出了用於單細胞 RNA 定序的新型 BD Rhapsody TCR Targeted Panel,可實現精確的免疫分析和幹細胞表徵。該技術為研究人員提供了對細胞群體的高解析度洞察,支持了先進幹細胞療法和免疫療法的發展
- 2024 年 11 月,領先的生物製程解決方案供應商 Sartorius AG 推出了 Sartoclear Dynamics Lab V 過濾系統,該系統專為幹細胞製造中的高效細胞收集而設計。該系統簡化了幹細胞的下游處理,降低了污染風險並提高了整體細胞產量,與產業向封閉系統製造的轉變一致
- 2024 年 10 月,富士軟片控股公司宣布其新的 iPSC 衍生心肌細胞係可供商業使用,用於心臟藥物發現和毒性測試。該產品旨在透過為研究和臨床應用提供高品質、即用型心臟細胞來加速精準醫療的發展,滿足日益增長的患者特異性細胞療法需求
SKU-
Get online access to the report on the World's First Market Intelligence Cloud

- Interactive Data Analysis Dashboard
- Company Analysis Dashboard for high growth potential opportunities
- Research Analyst Access for customization & queries
- Competitor Analysis with Interactive dashboard
- Latest News, Updates & Trend analysis
- Harness the Power of Benchmark Analysis for Comprehensive Competitor Tracking
研究方法
数据收集和基准年分析是使用具有大样本量的数据收集模块完成的。该阶段包括通过各种来源和策略获取市场信息或相关数据。它包括提前检查和规划从过去获得的所有数据。它同样包括检查不同信息源中出现的信息不一致。使用市场统计和连贯模型分析和估计市场数据。此外,市场份额分析和关键趋势分析是市场报告中的主要成功因素。要了解更多信息,请请求分析师致电或下拉您的询问。
DBMR 研究团队使用的关键研究方法是数据三角测量,其中包括数据挖掘、数据变量对市场影响的分析和主要(行业专家)验证。数据模型包括供应商定位网格、市场时间线分析、市场概览和指南、公司定位网格、专利分析、定价分析、公司市场份额分析、测量标准、全球与区域和供应商份额分析。要了解有关研究方法的更多信息,请向我们的行业专家咨询。
可定制
Data Bridge Market Research 是高级形成性研究领域的领导者。我们为向现有和新客户提供符合其目标的数据和分析而感到自豪。报告可定制,包括目标品牌的价格趋势分析、了解其他国家的市场(索取国家列表)、临床试验结果数据、文献综述、翻新市场和产品基础分析。目标竞争对手的市场分析可以从基于技术的分析到市场组合策略进行分析。我们可以按照您所需的格式和数据样式添加您需要的任意数量的竞争对手数据。我们的分析师团队还可以为您提供原始 Excel 文件数据透视表(事实手册)中的数据,或者可以帮助您根据报告中的数据集创建演示文稿。

