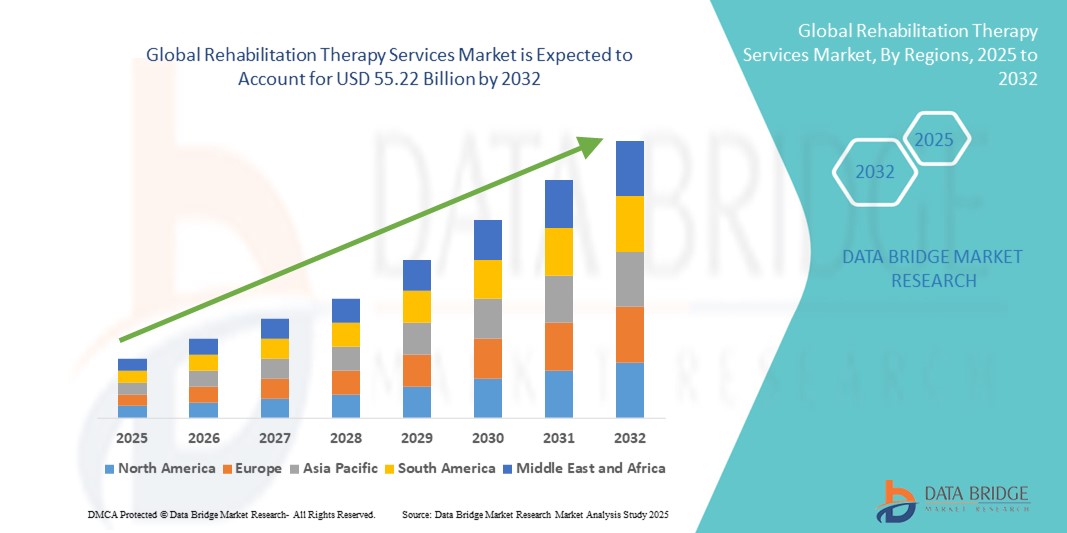
Global Rehabilitation Therapy Services Market
市场规模(十亿美元)
CAGR : %
Forecast Period |
2023 –2030 |
Market Size (Base Year) |
USD 25,112.13 Million |
Market Size (Forecast Year) |
USD 47,400.23 Million |
CAGR |
|
Major Markets Players |
|
>全球康复治疗服务市场,按服务(康复治疗服务、言语治疗、职业治疗、呼吸治疗、认知行为治疗、其他)、年龄组(老年、儿科、成人)、服务类型(门诊康复服务、住院康复服务)、应用(骨科康复治疗服务、神经康复治疗服务、心脏病康复治疗服务、肺康复治疗服务、姑息治疗、运动相关损伤、皮肤康复治疗服务、骨盆护理、其他)、服务类别(医院服务、医生服务、工业服务、雇主服务)、模型(手动、传统)、最终用户(医院、专业护理机构、家庭保健、私人诊所、运动和健身设施中心、康复中心、其他)、服务渠道(直接渠道、在线渠道)– 行业趋势和预测2030 年。
康复治疗服务市场分析及规模
近年来,全球康复治疗服务市场经历了显著增长,推动因素包括人口老龄化、慢性病和残疾增加、医疗技术进步以及人们对康复服务的认识提高。康复治疗服务涵盖各种治疗和干预措施,旨在改善有障碍或残疾的个人的身体、心理和功能能力。这些服务包括物理治疗、职业治疗、言语语言病理学等。市场的特点是对个性化和高效康复服务的需求不断增长,同时努力整合远程监控和远程医疗解决方案技术。
Data Bridge Market Research 分析称,2022 年全球康复治疗服务市场规模为 251.1213 亿美元,预计到 2030 年将达到 474.0023 亿美元,预计在 2023 年至 2030 年的预测期内复合年增长率为 8.2%。由于老年人口的增加,“康复治疗服务”在全球康复治疗服务市场的服务领域中占据主导地位。除了对市场价值、增长率、细分、地理覆盖范围和主要参与者等市场情景的洞察外,Data Bridge Market Research 整理的市场报告还包括深度专家分析、患者流行病学、渠道分析、定价分析和监管框架。
康复治疗服务市场范围和细分
报告指标 |
细节 |
预测期 |
2023 至 2030 年 |
基准年 |
2022 |
历史岁月 |
2021 (可定制为 2015-2020) |
定量单位 |
收入(百万美元)、销量(单位)、定价(美元) |
涵盖的领域 |
服务(康复治疗服务、言语治疗、职业治疗、呼吸治疗、认知行为治疗、其他)、年龄组(老年人、儿科、成人)、服务类型(门诊康复服务、住院康复服务)、应用(骨科康复治疗服务、神经康复治疗服务、心脏病康复治疗服务、肺康复治疗服务、姑息治疗、运动相关损伤、皮肤康复治疗服务、骨盆护理、其他)、服务类别(医院服务、医生服务、工业服务、雇主服务)、模型(手动、常规)、最终用户(医院、专业护理机构、家庭保健、私人诊所、运动和健身设施中心、康复中心、其他)、服务渠道(直接渠道、在线渠道) |
覆盖国家 |
美国、加拿大和墨西哥、德国、法国、英国、荷兰、瑞士、比利时、俄罗斯、意大利、西班牙、土耳其、欧洲其他地区、中国、日本、印度、韩国、新加坡、马来西亚、澳大利亚、泰国、印度尼西亚、菲律宾、亚太地区 (APAC) 其他地区、沙特阿拉伯、阿联酋、南非、埃及、以色列、中东和非洲 (MEA) 其他地区(中东和非洲 (MEA) 的一部分)、巴西、阿根廷和南美洲其他地区(南美洲的一部分) |
涵盖的市场参与者 |
Smart Speech Therapy(美国)、Therapy Solutions(美国)、Benchmark Therapies(美国)、Speed Pathology(澳大利亚)、Priory(英国)、Bellefleur Physiotherapy(加拿大)、SuVitas(印度)、LifeStance Health Inc.(美国)、FYZICAL(美国)、Sutter Health(美国)、Bon Secours Health System, Inc.(美国)、ApoKos Rehab Pvt Ltd.(印度)、Banner Health(美国)、Spectrum Physio(印度)、Select Medical Corporation(美国)、Lifespan Physical Therapy Services(美国)、nMotion Physical Therapy(美国)、CORA Health Services, Inc.(美国)、Athletico Physical Therapy(美国)、fullmotionpt(美国) |
市场机会 |
|
市场定义
康复治疗等健康服务有助于恢复因身体不适、受伤、伤害或残疾而丧失或受损的能力和日常功能。职业治疗、物理治疗和言语治疗是康复治疗的基本类型。康复治疗服务通过帮助儿童、成人或老年人尽可能独立地进行日常活动,促进他们参与教育、工作、娱乐和有意义的生活任务,如照顾家人。
全球康复治疗服务市场动态
驱动程序
- 老年人口增长
老年人口的增长推动了世界各地康复治疗服务市场的成长。此外,促进市场扩张的主要因素之一是成本效益。患者可以获得支持系统,并定期接受简短的门诊康复治疗。康复治疗服务市场正因这一特点而迅速扩张,并且具有巨大的增长潜力。
- 门诊康复服务需求上升
近年来,吸毒或酗酒的人数显著增加。除此之外,世界各地过着不健康生活方式的年轻人数量也显著增加。因此,世界各地对门诊康复服务的需求都在增加。由于需求增加,全球康复治疗服务市场为供应商带来了巨大的机会。
- 康复技术的进步
技术进步改变了康复治疗领域。创新设备、机器人和辅助技术提高了治疗干预的有效性和效率,为改善患者治疗效果提供了机会。为了利用这一驱动力,供应商和制造商投资研发,将尖端技术融入康复治疗。
机会
- 远程康复服务的出现
远程康复服务的出现带来了重大机遇。这种方法使患者能够远程接受治疗,提供便利并扩大康复服务的覆盖范围。为了抓住这一机遇,医疗保健系统投资于远程康复基础设施和平台。
- 康复计划的个性化
根据个人需求定制康复治疗为改善患者治疗效果提供了机会。个性化康复计划考虑到了每位患者的独特特征和目标。为了利用这一机会,医疗保健提供者和机构专注于创建定制治疗方案。
限制/挑战
- 基础设施和资源限制
某些地区医疗基础设施和资源有限,可能会影响康复服务的提供。农村和服务欠缺地区可能缺乏专门的康复设施和专业知识。为了解决这一限制,政府和组织投资将医疗基础设施扩展到服务欠缺的地区。
-
与报销相关的挑战
与康复服务报销相关的挑战可能会影响治疗的可及性。报销模式不充分或不一致可能会使患者在经济上难以获得必要的治疗。
本全球康复治疗服务市场报告详细介绍了最新发展、贸易法规、进出口分析、生产分析、价值链优化、市场份额、国内和本地市场参与者的影响,分析了新兴收入领域的机会、市场法规的变化、战略市场增长分析、市场规模、类别市场增长、应用领域和主导地位、产品批准、产品发布、地域扩展、市场技术创新。如需了解有关全球康复治疗服务市场的更多信息,请联系 Data Bridge 市场研究部门获取分析师简报,我们的团队将帮助您做出明智的市场决策,实现市场增长。
近期发展
- 2021 年 10 月,Sutter Health 和 Landed 共同宣布了一项试点计划,将 Landed 的购房援助计划扩展到医疗保健行业。通过首付帮助和其他购房服务,该计划在过去五年中让购房变得更加容易。这有助于该公司的业务扩张
全球康复治疗服务市场范围
全球康复治疗服务市场根据服务、年龄组、服务类型、应用、服务类别、模式、最终用户和服务渠道进行细分。这些细分市场之间的增长将帮助您分析行业中增长微弱的细分市场,并为用户提供有价值的市场概览和市场洞察,帮助他们做出战略决策,确定核心市场应用。
服务
- 康复治疗服务
- 言语治疗
- 职业治疗
- 呼吸治疗
- 认知行为疗法
- 其他的
年龄组
- 老年
- 儿科
- 成年人
服务类型
- 门诊康复服务
- 住院康复服务
应用
- 骨科康复治疗服务
- 神经康复治疗服务
- 心脏康复治疗服务
- 肺康复治疗服务
- 姑息治疗
- 运动相关伤害
- 皮肤康复治疗服务
- 骨盆护理
- 其他的
服务类别
- 医院服务
- 医师服务
- 工业服务
- 雇主服务
模型
- 手动的
- 传统的
最终用户
- 医院
- 专业护理机构
- 家庭健康
- 私人诊所
- 体育和健身设施中心
- 康复中心
- 其他的
服务渠道
- 直销渠道
- 线上渠道
全球康复治疗服务市场区域分析/见解
对全球康复治疗服务市场进行了分析,并按国家、服务、年龄组、服务类型、应用、服务类别、模型、最终用户和服务渠道提供了市场规模洞察和趋势。
全球康复治疗服务市场报告涵盖的国家包括美国、加拿大和墨西哥、德国、法国、英国、荷兰、瑞士、比利时、俄罗斯、意大利、西班牙、土耳其、欧洲其他地区、中国、日本、印度、韩国、新加坡、马来西亚、澳大利亚、泰国、印度尼西亚、菲律宾、亚太地区其他地区(APAC)、沙特阿拉伯、阿联酋、南非、埃及、以色列、中东和非洲其他地区(MEA)、巴西、阿根廷和南美洲其他地区(南美洲)
北美在市场份额和市场收入方面占据全球康复治疗服务市场的主导地位,并且由于研发支出的增加、政府举措的增多以及各国医疗保健基础设施的改善,北美将在 2023 年至 2030 年的预测期内继续保持主导地位。
另一方面,由于政府对医疗保健领域的支出不断增加以及政府的技术进步和举措不断推进,预计在 2023 年至 2030 年的预测期内,亚太地区将呈现最高的增长率,并成为全球康复治疗服务市场增长最快的地区。
报告的国家部分还提供了影响单个市场因素和国内市场监管变化,这些因素和变化影响了市场的当前和未来趋势。下游和上游价值链分析、技术趋势和波特五力分析、案例研究等数据点是用于预测单个国家市场情景的一些指标。此外,在提供国家数据的预测分析时,还考虑了全球品牌的存在和可用性以及它们因来自本地和国内品牌的大量或稀缺竞争而面临的挑战、国内关税和贸易路线的影响。
医疗保健基础设施增长安装基础和新技术渗透
全球康复治疗服务市场还为您提供每个国家/地区资本设备医疗保健支出增长、全球康复治疗服务市场不同类型产品的安装基数、使用生命线曲线的技术的影响以及医疗保健监管情景的变化及其对全球康复治疗服务市场的影响的详细市场分析。数据适用于 2015-2020 年的历史时期。
竞争格局和全球康复治疗服务市场份额分析
全球康复治疗服务市场竞争格局按竞争对手提供详细信息。详细信息包括公司概况、公司财务状况、收入、市场潜力、研发投资、新市场计划、全球影响力、生产基地和设施、生产能力、公司优势和劣势、产品发布、产品宽度和广度、应用主导地位。以上提供的数据点仅与公司对全球康复治疗服务市场的关注有关。
全球康复治疗服务市场的一些主要参与者包括:
- 智能言语治疗(美国)
- 治疗解决方案(美国)
- 基准疗法(美国)
- 速度病理学(澳大利亚)
- 修道院(英国)
- Bellefleur 物理治疗中心(加拿大)
- SuVitas(印度)
- LifeStance Health Inc.(美国)
- FYZICAL(美国)
- 萨特健康(美国)
- Bon Secours Health System, Inc.(美国)
- ApoKos Rehab Pvt Ltd.(印度)
- Banner Health(美国)
- Spectrum Physio(印度)
- Select Medical Corporation(美国)
- Lifespan 物理治疗服务(美国)
- nMotion 物理治疗(美国)
- CORA Health Services, Inc.(美国)
- Athletico 物理治疗(美国)
- fullmotionpt (美国)
SKU-
Get online access to the report on the World's First Market Intelligence Cloud
- Interactive Data Analysis Dashboard
- Company Analysis Dashboard for high growth potential opportunities
- Research Analyst Access for customization & queries
- Competitor Analysis with Interactive dashboard
- Latest News, Updates & Trend analysis
- Harness the Power of Benchmark Analysis for Comprehensive Competitor Tracking
目录
- introduction
- OBJECTIVES OF THE STUDY
- MARKET DEFINITION
- OVERVIEW of GLOBAl REHABILITATION THERAPY SERVICES MARKET
- LIMITATIONs
- MARKETS COVERED
- MARKET SEGMENTATION
- MARKETS COVERED
- geographical scope
- years considered for the study
- currency and pricing
- DBMR TRIPOD DATA VALIDATION MODEL
- MULTIVARIATE MODELLING
- service LIFELINE CURVE
- primary interviews with key opinion leaders
- DBMR MARKET POSITION GRID
- vendor share analysis
- MARKET application COVERAGE GRID
- secondary sourcEs
- assumptions
- EXECUTIVE SUMMARY
- premium insight
- FAVOURABLE SPENDING TREND
- EXISTING LEGAL FRAMEWORK
- EXPERT OPINION SURVEY
- VIEW POINT OF KEY OPINION LEADERS
- REGULATORY FRAMEWORK
- GLOBAL REHABILITATION THERAPY SERVICES MARKET: REIMBURSEMENT SCENARIO
- Market Overview
- drivers
- increasing prevalence of chronic disease
- WORLDWIDE RISE IN GERIATRIC POPULATION
- Proper reimbursement for rehabilitation services
- RisE IN incidence of disabilities
- Rise in facility expansion by rehab centers
- RestraintS
- Lack of Awareness for rehabilitation
- Complexity associateD with rehabilitation therapies
- Lack of physical therapy center in developing countries
- Market consolidation and high-out of pocket coST
- opportunities
- IncreasE IN MARKET-related collaborationS and acquisitionS
- IncreAsE IN covid-19 related disorders
- Use of Tele-rehabilitation as a new tool for providing care
- challenges
- Insufficient rehabilitation personnelS with appropriate training
- Lack of government support in Developing countries
- IMPACT OF COVID-19 ON THE GLOBAL REHABILITATION THERAPY SERVICES MARKET
- IMPACT ON PRICE
- IMPACT ON DEMAND
- IMPACT ON SUPPLY CHAIN
- STRATEGIC DECISIONS FOR MANUFACTURERS
- CONCLUSION
- GLOBAL REHABILITATION THERAPY SERVICES MARKET, BY SERVICE
- OVERVIEW
- rEHABILITATION THERAPY SERVICES
- Therapeutic Exercise
- Hand Therapy
- Hydrotherapy
- Heat Therapy
- Electric Stimulation
- Ultrasound Based Therapy
- Cryotherapy
- Continuous Passive Motion (CPM)
- Others
- SPEECH THERAPY
- Speech Disorder
- Language Disorder
- Apraxia
- Autism Spectrum Disorder (ASD)
- Others
- OCCUPATIONAL THERAPY
- RESPIRATORY THERAPY
- cOGNITIVE BEHAVIORAL THERAPY
- OTHERS
- GLOBAL REHABILITATION THERAPY SERVICES market, by AGE GROUP
- overview
- PEDIATRICS
- OUTPATIENT TREATMENT
- HOME BASED TREATMENT
- OTHERS
- Inpatient treatment
- CONVALESCENT HOME BASED TREATMENT
- OTHERS
- ADULTS
- OUTPATIENT TREATMENT
- HOME BASED TREATMENT
- oTHERS
- INPATIENT TREATMENT
- CONVALESCENT HOME BASED TREATMENT
- OTHERS
- ELDERLY
- OUTPATIENT TREATMENT
- HOME BASED TREATMENT
- OTHERS
- INPATIENT TREATMENT
- CONVALESCENT HOME BASED TREATMENT
- OTHERS
- Global Rehabilitation Therapy Services Market, By Service Type
- OVERVIEW
- OUTPATIENT REHABILITATION SERVICES
- Home-Based Treatment
- Others
- inpatient rehabilitation services
- Convalescent Home-Based Treatment
- Others
- global rehabilitation therapy services MARKET, BY Application
- overview
- ORTHOPEDIC REHABILITATION THERAPY SERVICES
- fractures
- muscle strains
- ligament sprains
- post-operative conditions
- tendonitis
- brusitis
- meniscus tear
- knee instability
- knee replacement
- patella pain
- Achilles tendon injuries
- Foot and ankle pain
- Plantar fasciitis
- others
- neurological rehabilitation therapy services
- stroke
- vestibular dysfunction
- traumatic brain injuries
- spinal cord injuries
- parkinson’s disease
- multiple sclerosis
- cerebral palsy
- others
- cardiological rehabilitation therapy services
- hypertension
- diabetes
- post-myocardial infarction(mi)
- OTHERS
- pulmonary rehabilitation therapy services
- chronic obstructive pulmonary disease (copd)
- asthma
- pulmonary hypertension
- cystic fibrosis
- COVID-19
- others
- sports related injuries
- concussion
- tennis elbow
- others
- pelvic care
- lymphedema
- others
- integumentary rehabilitation therapy services
- wounds
- burns
- others
- palliative care
- nausea
- shortness of breath
- insomnia
- others
- others
- GLOBAL REHABILITATION THERAPY SERVICES market, by SERVICE CATEGORY
- overview
- HOSPITAL SERVICES
- PHYSICIAN SERVICES
- INDUSTRIAL SERVICES
- EMPLOYER SERVICES
- gLOBAL REHABILITATION THERAPY SERVICES MARKET, BY MODEL
- OVERVIEW
- MANUAL
- massage Therapy
- Soft Tissue Mobilization
- Others
- 1.2 CONVENTIONAL
- Joint Mobilization Technique
- Suspension Therapy
- Relaxation Technique
- Posture Correction Method
- Others
- GLOBAL REHABILITATION THERAPY SERVICES market, by END USER
- overview
- HOSPITALS
- SKILLED NURSING FACILITIES
- HOME HEALTH
- PRIVATE PRACTICES
- SPORTS AND FITNESS FACILITY CENTERS
- REHABILITATION CENTERS
- OTHERS
- GLOBAL REHABILITATION THERAPY SERVICES market, by SERVICE CHANNEL
- overview
- DIRECT CHANNEL
- ONLINE CHANNEL
- GLOBAL rehabilitation therapy SERVICES MARKET, by Geography
- overview
- north america
- u.s.
- Canada
- mexico
- Europe
- GERMANy
- France
- U.K.
- ITALY
- SPAIN
- RUSSIA
- TURKEY
- iRELAND
- iRELAND
- BELGIUM
- NETHERLANDS
- SWITZERLAND
- rest of europe
- ASIA-PACIFIC
- CHINA
- JAPAN
- SOUTH KOREA
- INDIA
- AUSTRALIA
- SINGAPORE
- THAILAND
- Malaysia
- INDONESIA
- PHILIPPINES
- REST OF ASIA-PACIFIC
- middle east & africa
- South Africa
- Saudi Arabia
- UAE
- eGYPT
- ISRAEL
- rest of middle east & africa
- SOUTH america
- BRAZIL
- ARGENTINA
- Rest of South America
- Global rehabilitation therapy services market: COMPANY landscape
- company share analysis: Global
- company share analysis: North America
- company share analysis: Europe
- company share analysis: Asia-Pacific
- swot analysis
- company profile
- select medical corporation
- COMPANY SNAPSHOT
- REVENUE ANALYSIS
- company share analysis
- SERVICE PORTFOLIO
- RECENT DEVELOPMENTS
- UPSTREAM REHABILITATION INC.
- COMPANY SNAPSHOT
- company share analysis
- SERVICE PORTFOLIO
- RECENT DEVELOPMENT
- SUTTER HEALTH
- COMPANY SNAPSHOT
- RECENT FINANCIALS
- company share analysis
- SERVICE PORTFOLIO
- RECENT DEVELOPMENTS
- PRIORY GROUP
- COMPANY SNAPSHOT
- company share analysis
- SERVICE PORTFOLIO
- RECENT DEVELOPMENTS
- BANNER HEALTH
- COMPANY SNAPSHOT
- SERVICE PORTFOLIO
- RECENT DEVELOPMENTS
- ATI PHYSICAL THERAPY
- COMPANY SNAPSHOT
- SERVICE PORTFOLIO
- RECENT DEVELOPMENTS
- apokos rehab pvt ltd. (a joint venture of apollo hospitals and kos italy)
- COMPANY SNAPSHOT
- REVENUE ANALYSIS
- SERVICE PORTFOLIO
- RECENT DEVELOPMENT
- ATHLETICO PHYSICAL THERAPY
- COMPANY SNAPSHOT
- SERVICE PORTFOLIO
- RECENT DEVELOPMENTS
- bellefleur physiotherapy
- COMPANY SNAPSHOT
- SERVICEPORTFOLIO
- RECENT DEVELOPMENT
- benchmark therapies
- COMPANY SNAPSHOT
- PRODUCT PORTFOLIO
- RECENT DEVELOPMENTS
- BON SECOURS USA
- COMPANY SNAPSHOT
- SERVICE PORTFOLIO
- RECENT DEVELOPMENTS
- CORA Health Services. INC.
- COMPANY SNAPSHOT
- SERVICE PORTFOLIO
- RECENT DEVELOPMENTS
- fullmotionpt.net
- COMPANY SNAPSHOT
- SERVICE PORTFOLIO
- RECENT DEVELOPMENT
- FYZICAL
- COMPANY SNAPSHOT
- SERVICE PORTFOLIO
- RECENT DEVELOPMENT
- Genesis rehab services (a subsidiary of genesis healthcare )
- COMPANY SNAPSHOT
- REVENUE ANALYSIS
- PRODUCT PORTFOLIO
- RECENT DEVELOPMENTS
- HUNTERDON HEALTHCARE
- COMPANY SNAPSHOT
- RECENT FINANCIALS
- SERVICE PORTFOLIO
- RECENT DEVELOPMENT
- Interim healthcare inc.
- COMPANY SNAPSHOT
- SERVICE PORTFOLIO
- RECENT DEVELOPMENTS
- KETTERING HEALTH
- COMPANY SNAPSHOT
- SERVICE PORTFOLIO
- RECENT DEVELOPMENTS
- LifeStance health inc.
- COMPANY SNAPSHOT
- SERVICE PORTFOLIO
- RECENT DEVELOPMENT
- lifespan physical therapy services
- COMPANY SNAPSHOT
- SERVICE PORTFOLIO
- RECENT DEVELOPMENT
- nMotion Physical Therapy
- COMPANY SNAPSHOT
- SERVICE PORTFOLIO
- RECENT DEVELOPMENT
- PIVOT PHYSICAL THERAPY
- COMPANY SNAPSHOT
- SERVICE PORTFOLIO
- RECENT DEVELOPMENTS
- PREVEA HEALTH SERVICES
- COMPANY SNAPSHOT
- SERVICE PORTFOLIO
- RECENT DEVELOPMENTS
- smart Speech Therapy
- COMPANY SNAPSHOT
- SERVICE PORTFOLIO
- RECENT DEVELOPMENT
- speech pathology
- COMPANY SNAPSHOT
- SERVICE PORTFOLIO
- RECENT DEVELOPMENT
- SUVITAS
- COMPANY SNAPSHOT
- SERVICE PORTFOLIO
- RECENT DEVELOPMENTS
- Spectrum Physio / The Physio Company
- COMPANY SNAPSHOT
- SERVICE PORTFOLIO
- RECENT DEVELOPMENT
- Therapy Solutions Inc.
- COMPANY SNAPSHOT
- SERVICE PORTFOLIO
- RECENT DEVELOPMENTS
- US Rehabilitation and Health Services
- COMPANY SNAPSHOT
- RECENT FINANCIALS
- SERVICE PORTFOLIO
- RECENT DEVELOPMENTS
- questionnaire
- related reports
表格列表
TABLE 1 global REHABILITATION THERAPY services market, By services, 2019-2028 (USD Million)
TABLE 2 global REHABILITATION THERAPY services market, By services, 2019-2028 (USD Million)
TABLE 3 global REHABILITATION THERAPY services market, By service, 2019-2028 (USD Million)
TABLE 4 global REHABILITATION THERAPY services market, By services, 2019-2028 (USD Million)
TABLE 5 global speech REHABILITATION THERAPY services market, By services, 2019-2028 (USD Million)
TABLE 6 global occupational REHABILITATION THERAPY services market, By services, 2019-2028 (USD Million)
TABLE 7 global respiratory REHABILITATION THERAPY services market, By services, 2019-2028 (USD Million)
TABLE 8 global cognitive behavioral REHABILITATION THERAPY services market, By services, 2019-2028 (USD Million)
TABLE 9 global others REHABILITATION THERAPY services market, By services, 2019-2028 (USD Million)
TABLE 10 GLOBAL REHABILITATION THERAPY SERVICES MARKET, BY AGE GROUP 2019-2028 (USD MILLION)
TABLE 11 GLOBAL PEDIATRICS IN REHABILITATION THERAPY SERVICES MARKET, BY REGION, 2019-2028 (USD MILLION)
TABLE 12 GLOBAL PEDIATRICS IN REHABILITATION THERAPY SERVICES MARKET, BY AGE GROUP, 2019-2028 (USD MILLION)
TABLE 13 GLOBAL OUT-PATIENT TREATMENT IN REHABILITATION THERAPY SERVICES MARKET, BY AGE GROUP, 2019-2028 (USD MILLION)
TABLE 14 GLOBAL IN-PATIENT TREATMENT IN REHABILITATION THERAPY SERVICES MARKET, BY AGE GROUP, 2019-2028 (USD MILLION)
TABLE 15 GLOBAL ADULTS IN REHABILITATION THERAPY SERVICES MARKET, BY REGION, 2019-2028 (USD MILLION)
TABLE 16 GLOBAL ADULTS IN REHABILITATION THERAPY SERVICES MARKET, BY AGE GROUP, 2019-2028 (USD MILLION)
TABLE 17 GLOBAL OUT-PATIENT TREATMENT IN REHABILITATION THERAPY SERVICES MARKET, BY AGE GROUP, 2019-2028 (USD MILLION)
TABLE 18 GLOBAL IN-PATIENT TREATMENT IN REHABILITATION THERAPY SERVICES MARKET, BY AGE GROUP, 2019-2028 (USD MILLION)
TABLE 19 GLOBAL ELDERLY IN REHABILITATION THERAPY SERVICES MARKET, BY REGION, 2019-2028 (USD MILLION)
TABLE 20 GLOBAL ELDERLY IN REHABILITATION THERAPY SERVICES MARKET, BY AGE GROUP, 2019-2028 (USD MILLION)
TABLE 21 GLOBAL OUT-PATIENT TREATMENT IN REHABILITATION THERAPY SERVICES MARKET, BY AGE GROUP, 2019-2028 (USD MILLION)
TABLE 22 GLOBAL IN-PATIENT TREATMENT IN REHABILITATION THERAPY SERVICES MARKET, BY AGE GROUP, 2019-2028 (USD MILLION)
TABLE 23 global REHABILITATION THERAPY services market, By service type, 2019-2028 (USD Million)
TABLE 24 global out-patient REHABILITATION THERAPY services market, By region, 2019-2028 (USD Million)
TABLE 25 global out-patient REHABILITATION THERAPY services market, By service type, 2019-2028 (USD Million)
TABLE 26 global in-patient REHABILITATION THERAPY services market, By region, 2019-2028 (USD Million)
TABLE 27 global in-patient REHABILITATION THERAPY services market, By service type, 2019-2028 (USD Million)
TABLE 28 global REHABILITATION THERAPY SERVICES Market, By Application, 2019-2028 (USD Million)
TABLE 29 Global Orthopedic Rehabilitation Therapy Services in Rehabilitation Therapy Services Market, By Region, 2019-2028 (USD Million)
TABLE 30 Global Orthopedic Rehabilitation Therapy Services in Rehabilitation Therapy Services Market, By Application, 2019-2028 (USD Million)
TABLE 31 Global Neurological Rehabilitation Therapy Services in Rehabilitation Therapy Services Market, By Region, 2019-2028 (USD Million)
TABLE 32 Global neurological Rehabilitation Therapy Services in Rehabilitation Therapy Services Market, By Application, 2019-2028 (USD Million)
TABLE 33 Global Cardiological Rehabilitation Therapy Services in Rehabilitation Therapy Services Market, By Region, 2019-2028 (USD Million)
TABLE 34 Global cardiological Rehabilitation Therapy Services in Rehabilitation Therapy Services Market, By Application, 2019-2028 (USD Million)
TABLE 35 Global Pulmonary Rehabilitation Therapy Services in Rehabilitation Therapy Services Market, By Region, 2019-2028 (USD Million)
TABLE 36 lobal pulmonary Rehabilitation Therapy Services in Rehabilitation Therapy Services Market, By Application, 2019-2028 (USD Million)
TABLE 37 Global Sports Related Injuries in Rehabilitation Therapy Services Market, By Region, 2019-2028 (USD Million)
TABLE 38 Global Sports- Related Injuries in Rehabilitation Therapy Services Market, By Application, 2019-2028 (USD Million)
TABLE 39 globaL pelvic care in REHABILITATION THERAPY SERVICES Market, By Region, 2019-2028 (USD Million)
TABLE 40 Global Pelvic Care in Rehabilitation Therapy Services Market, By Application, 2019-2028 (USD Million)
TABLE 41 globaL integumentary rehabilitation therapy services in REHABILITATION THERAPY SERVICES Market, By Region, 2019-2028 (USD Million)
TABLE 42 Global Integumentary Rehabilitation Therapy Services in Rehabilitation Therapy Services Market, By Application, 2019-2028 (USD Million)
TABLE 43 globaL palliative care in REHABILITATION THERAPY SERVICES Market, By Region, 2019-2028 (USD Million)
TABLE 44 Global palliative care in Rehabilitation Therapy Services Market, By Application, 2019-2028 (USD Million)
TABLE 45 globaL palliative care in REHABILITATION THERAPY SERVICES Market, By Region, 2019-2028 (USD Million)
TABLE 46 GLOBAL REHABILITATION THERAPY SERVICES MARKET, BY SERVICE CATEGORY 2019-2028 (USD MILLION)
TABLE 47 Global Hospital Services in Rehabilitation Therapy Services Market, By Region, 2019-2028 (USD Million)
TABLE 48 Global Physician Services in Rehabilitation Therapy Services Market, By Region, 2019-2028 (USD Million)
TABLE 49 Global Industrial Services in Rehabilitation Therapy Services Market, By Region, 2019-2028 (USD Million)
TABLE 50 Global Employer Services in Rehabilitation Therapy Services Market, By Region, 2019-2028 (USD Million)
TABLE 51 global REHABILITATION THERAPY services market, By model, 2019-2028 (USD Million)
TABLE 52 global manual REHABILITATION THERAPY services market, By region, 2019-2028 (USD Million)
TABLE 53 global manual REHABILITATION THERAPY services market, By model, 2019-2028 (USD Million)
TABLE 54 global conventional REHABILITATION THERAPY services market, By region, 2019-2028 (USD Million)
TABLE 55 global conventional REHABILITATION THERAPY services market, By model, 2019-2028 (USD Million)
TABLE 56 GLOBAL REHABILITATION THERAPY SERVICES MARKET, BY END USER 2019-2028 (USD MILLION)
TABLE 57 Global Hospitals in Rehabilitation Therapy Services Market, By Region, 2019-2028 (USD Million)
TABLE 58 Global Skilled Nursing Facilities in Rehabilitation Therapy Services Market, By Region, 2019-2028 (USD Million)
TABLE 59 Global Home Health in Rehabilitation Therapy Services Market, By Region, 2019-2028 (USD Million)
TABLE 60 Global Private Practices in Rehabilitation Therapy Services Market, By Region, 2019-2028 (USD Million)
TABLE 61 Global Sports & Facility Centers in Rehabilitation Therapy Services Market, By Region, 2019-2028 (USD Million)
TABLE 62 Global Rehabilitation Centers in Rehabilitation Therapy Services Market, By Region, 2019-2028 (USD Million)
TABLE 63 Global Others in Rehabilitation Therapy Services Market, By Region, 2019-2028 (USD Million)
TABLE 64 GLOBAL REHABILITATION THERAPY SERVICES MARKET, BY SERVICE CHANNEL 2019-2028 (USD MILLION)
TABLE 65 Global Direct Channel in Rehabilitation Therapy Services Market, By Region, 2019-2028 (USD Million)
TABLE 66 Global Online Channel in Rehabilitation Therapy Services Market, By Region, 2019-2028 (USD Million)
TABLE 67 Global REHABILITATION THERAPY servicesmarket, By Region, 2019-2028 (USD Million)
TABLE 68 North America REHABILITATION THERAPY SERVICES Market, By COUNTRY, 2019-2028 (USD million)
TABLE 69 North America REHABILITATION THERAPY SERVICES Market, By SERVICE, 2019-2028 (USD Million)
TABLE 70 North America REHABILITATION THERAPY in rehabilitation therapy SERVICES Market, By service, 2019-2028 (USD Million)
TABLE 71 North America SPEECH THERAPY IN REHABILITATION THERAPY SERVICES Market, By SERVICE, 2019-2028 (Units)
TABLE 72 North America Anti-Infectives in REHABILITATION THERAPY SERVICES Market, By AGE GROUP, 2019-2028 (USD Million)
TABLE 73 North America ELDERLY in REHABILITATION THERAPY SERVICES Market, By AGE GROUP, 2019-2028 (USD Million)
TABLE 74 North America OUT-PATIENT TREATMENT in REHABILITATION THERAPY SERVICES Market, By AGE GROUP , 2019-2028 (USD Million)
TABLE 75 North America IN-PATIENT TREATMENT in REHABILITATION THERAPY SERVICES Market, By AGE GROUP, 2019-2028 (USD Million)
TABLE 76 North America PEDIATRICS in REHABILITATION THERAPY SERVICES Market, By AGE GROUP, 2019-2028 (USD Million)
TABLE 77 North America out-patient treatment in REHABILITATION THERAPY SERVICES Market, By age group, 2019-2028 (USD Million)
TABLE 78 North AMERICA IN-PATIENT TREATMENT in REHABILITATION THERAPY SERVICES Market, By AGE GROUP, 2019-2028 (USD Million)
TABLE 79 North America ADULTS in REHABILITATION THERAPY SERVICES Market, By AGE GROUP, 2019-2028 (USD Million)
TABLE 80 North America out-patient treatment in REHABILITATION THERAPY SERVICES Market, By age group, 2019-2028 (USD Million)
TABLE 81 North America IN-PATIENT TREATMENT in REHABILITATION THERAPY SERVICES Market, By AGE GROUP, 2019-2028 (USD Million)
TABLE 82 North America REHABILITATION THERAPY SERVICES Market, By service type, 2019-2028 (USD Million)
TABLE 83 North America out patient REHABILITATION THERAPY SERVICES Market, By service type, 2019-2028 (USD Million)
TABLE 84 North America in patient REHABILITATION THERAPY SERVICES Market, By service type, 2019-2028 (USD Million)
TABLE 85 North America REHABILITATION THERAPY SERVICES Market, By application, 2019-2028 (USD Million)
TABLE 86 North America NEUROLOGICAL REHABILITATION THERAPY SERVICES Market, By APPLICATION, 2019-2028 (USD Million)
TABLE 87 North America PULMONARY REHABILITATION THERAPY SERVICES Market, By APPLICATION, 2019-2028 (USD Million)
TABLE 88 North America CARDIOLOGICAL REHABILITATION THERAPY SERVICES Market, By APPLICATION, 2019-2028 (USD Million)
TABLE 89 North America SPORTS RELATED INJURIES IN REHABILITATION THERAPY SERVICES Market, By APPLICATION, 2019-2028 (USD Million)
TABLE 90 North America PELVIC CARE IN REHABILITATION THERAPY SERVICES Market, By APPLICATION, 2019-2028 (USD Million)
TABLE 91 North America ORTHOPEDIC REHABILITATION THERAPY SERVICES IN REHABILITATION THERAPY SERVICES Market, By APPLICATION, 2019-2028 (USD Million)
TABLE 92 North America INTEGUMENTARY REHABILITATION THERAPY SERVICES IN REHABILITATION THERAPY SERVICES Market, By APPLICATION, 2019-2028 (USD Million)
TABLE 93 North America PALLIATIVE CARE IN REHABILITATION THERAPY SERVICES Market, By APPLICATION, 2019-2028 (USD Million)
TABLE 94 North America REHABILITATION THERAPY SERVICES Market, By SERVICE CATEGORY, 2019-2028 (USD Million)
TABLE 95 North America REHABILITATION THERAPY SERVICES Market, By model, 2019-2028 (USD Million)
TABLE 96 North America MANUAL IN REHABILITATION THERAPY SERVICES Market, By model, 2019-2028 (USD Million)
TABLE 97 North America CONVENTIONAL IN REHABILITATION THERAPY SERVICES Market, By model, 2019-2028 (USD Million)
TABLE 98 North America REHABILITATION THERAPY SERVICES Market, By END USER, 2019-2028 (USD Million)
TABLE 99 North America REHABILITATION THERAPY SERVICES Market, By SERVICE CHANNEL, 2019-2028 (USD Million)
TABLE 100 U.S REHABILITATION THERAPY SERVICES Market, By SERVICE, 2019-2028 (USD Million)
TABLE 101 U.S REHABILITATION THERAPY in rehabilitation therapy SERVICES Market, By service, 2019-2028 (USD Million)
TABLE 102 U.S SPEECH THERAPY IN REHABILITATION THERAPY SERVICES Market, By SERVICE, 2019-2028 (Units)
TABLE 103 U.S REHABILITATION THERAPY SERVICES Market, By AGE GROUP, 2019-2028 (USD Million)
TABLE 104 U.S ELDERLY in REHABILITATION THERAPY SERVICES Market, By AGE GROUP, 2019-2028 (USD Million)
TABLE 105 U.S OUT-PATIENT TREATMENT in REHABILITATION THERAPY SERVICES Market, By AGE GROUP , 2019-2028 (USD Million)
TABLE 106 U.S IN-PATIENT TREATMENT in REHABILITATION THERAPY SERVICES Market, By AGE GROUP, 2019-2028 (USD Million)
TABLE 107 U.S PEDIATRICS in REHABILITATION THERAPY SERVICES Market, By AGE GROUP, 2019-2028 (USD Million)
TABLE 108 U.S out-patient treatment in REHABILITATION THERAPY SERVICES Market, By age group, 2019-2028 (USD Million)
TABLE 109 U.S IN-PATIENT TREATMENT in REHABILITATION THERAPY SERVICES Market, By AGE GROUP, 2019-2028 (USD Million)
TABLE 110 U.S ADULTS in REHABILITATION THERAPY SERVICES Market, By AGE GROUP, 2019-2028 (USD Million)
TABLE 111 U.S out-patient treatment in REHABILITATION THERAPY SERVICES Market, By age group, 2019-2028 (USD Million)
TABLE 112 U.S IN-PATIENT TREATMENT in REHABILITATION THERAPY SERVICES Market, By AGE GROUP, 2019-2028 (USD Million)
TABLE 113 U.S REHABILITATION THERAPY SERVICES Market, By service type, 2019-2028 (USD Million)
TABLE 114 U.S out patient REHABILITATION THERAPY SERVICES Market, By service type, 2019-2028 (USD Million)
TABLE 115 U.S IN-patient REHABILITATION THERAPY SERVICES Market, By service type, 2019-2028 (USD Million)
TABLE 116 U.S REHABILITATION THERAPY SERVICES Market, By application, 2019-2028 (USD Million)
TABLE 117 u.s NEUROLOGICAL REHABILITATION THERAPY SERVICES Market, By APPLICATION, 2019-2028 (USD Million)
TABLE 118 u.s PULMONARY REHABILITATION THERAPY SERVICES Market, By APPLICATION, 2019-2028 (USD Million)
TABLE 119 u.s CARDIOLOGICAL REHABILITATION THERAPY SERVICES Market, By APPLICATION, 2019-2028 (USD Million)
TABLE 120 u.s SPORTS RELATED INJURIES IN REHABILITATION THERAPY SERVICES Market, By APPLICATION, 2019-2028 (USD Million)
TABLE 121 u.s PELVIC CARE IN REHABILITATION THERAPY SERVICES Market, By APPLICATION, 2019-2028 (USD Million)
TABLE 122 u.s ORTHOPEDIC REHABILITATION THERAPY SERVICES IN REHABILITATION THERAPY SERVICES Market, By APPLICATION, 2019-2028 (USD Million)
TABLE 123 u.s INTEGUMENTARY REHABILITATION THERAPY SERVICES IN REHABILITATION THERAPY SERVICES Market, By APPLICATION, 2019-2028 (USD Million)
TABLE 124 u.s PALLIATIVE CARE IN REHABILITATION THERAPY SERVICES Market, By APPLICATION, 2019-2028 (USD Million)
TABLE 125 u.s REHABILITATION THERAPY SERVICES Market, By SERVICE CATEGORY, 2019-2028 (USD Million)
TABLE 126 u.s REHABILITATION THERAPY SERVICES Market, By model, 2019-2028 (USD Million)
TABLE 127 u.s MANUAL IN REHABILITATION THERAPY SERVICES Market, By model, 2019-2028 (USD Million)
TABLE 128 u.s CONVENTIONAL IN REHABILITATION THERAPY SERVICES Market, By model, 2019-2028 (USD Million)
TABLE 129 u.s REHABILITATION THERAPY SERVICES Market, By END USER, 2019-2028 (USD Million)
TABLE 130 u.s REHABILITATION THERAPY SERVICES Market, By SERVICE CHANNEL, 2019-2028 (USD Million)
TABLE 131 CANADA REHABILITATION THERAPY SERVICES Market, By SERVICE, 2019-2028 (USD Million)
TABLE 132 CANADA REHABILITATION THERAPY in rehabilitation therapy SERVICES Market, By service, 2019-2028 (USD Million)
TABLE 133 CANADA SPEECH THERAPY IN REHABILITATION THERAPY SERVICES Market, By SERVICE, 2019-2028 (Units)
TABLE 134 CANADA REHABILITATION THERAPY SERVICES Market, By AGE GROUP, 2019-2028 (USD Million)
TABLE 135 CANADA ELDERLY in REHABILITATION THERAPY SERVICES Market, By AGE GROUP, 2019-2028 (USD Million)
TABLE 136 CANADA OUT-PATIENT TREATMENT in REHABILITATION THERAPY SERVICES Market, By AGE GROUP , 2019-2028 (USD Million)
TABLE 137 canada IN-PATIENT TREATMENT in REHABILITATION THERAPY SERVICES Market, By AGE GROUP, 2019-2028 (USD Million)
TABLE 138 canada PEDIATRICS in REHABILITATION THERAPY SERVICES Market, By AGE GROUP, 2019-2028 (USD Million)
TABLE 139 canada out-patient treatment in REHABILITATION THERAPY SERVICES Market, By age group, 2019-2028 (USD Million)
TABLE 140 canada IN-PATIENT TREATMENT in REHABILITATION THERAPY SERVICES Market, By AGE GROUP, 2019-2028 (USD Million)
TABLE 141 canada ADULTS in REHABILITATION THERAPY SERVICES Market, By AGE GROUP, 2019-2028 (USD Million)
TABLE 142 CANADA out-patient treatment in REHABILITATION THERAPY SERVICES Market, By age group, 2019-2028 (USD Million)
TABLE 143 CANADA IN-PATIENT TREATMENT in REHABILITATION THERAPY SERVICES Market, By AGE GROUP, 2019-2028 (USD Million)
TABLE 144 CANADA REHABILITATION THERAPY SERVICES Market, By service type, 2019-2028 (USD Million)
TABLE 145 CANADA out patient REHABILITATION THERAPY SERVICES Market, By service type, 2019-2028 (USD Million)
TABLE 146 CANADA IN-patient REHABILITATION THERAPY SERVICES Market, By service type, 2019-2028 (USD Million)
TABLE 147 CANADA REHABILITATION THERAPY SERVICES Market, By application, 2019-2028 (USD Million)
TABLE 148 CANADA NEUROLOGICAL REHABILITATION THERAPY SERVICES Market, By APPLICATION, 2019-2028 (USD Million)
TABLE 149 CANADA PULMONARY REHABILITATION THERAPY SERVICES Market, By APPLICATION, 2019-2028 (USD Million)
TABLE 150 CANADA CARDIOLOGICAL REHABILITATION THERAPY SERVICES Market, By APPLICATION, 2019-2028 (USD Million)
TABLE 151 CANADA SPORTS RELATED INJURIES IN REHABILITATION THERAPY SERVICES Market, By APPLICATION, 2019-2028 (USD Million)
TABLE 152 CANADA PELVIC CARE IN REHABILITATION THERAPY SERVICES Market, By APPLICATION, 2019-2028 (USD Million)
TABLE 153 CANADA ORTHOPEDIC REHABILITATION THERAPY SERVICES IN REHABILITATION THERAPY SERVICES Market, By APPLICATION, 2019-2028 (USD Million)
TABLE 154 CANADA INTEGUMENTARY REHABILITATION THERAPY SERVICES IN REHABILITATION THERAPY SERVICES Market, By APPLICATION, 2019-2028 (USD Million)
TABLE 155 CANADA PALLIATIVE CARE IN REHABILITATION THERAPY SERVICES Market, By APPLICATION, 2019-2028 (USD Million)
TABLE 156 CANADA REHABILITATION THERAPY SERVICES Market, By SERVICE CATEGORY, 2019-2028 (USD Million)
TABLE 157 CANADA REHABILITATION THERAPY SERVICES Market, By model, 2019-2028 (USD Million)
TABLE 158 CANADA MANUAL IN REHABILITATION THERAPY SERVICES Market, By model, 2019-2028 (USD Million)
TABLE 159 CANADA CONVENTIONAL IN REHABILITATION THERAPY SERVICES Market, By model, 2019-2028 (USD Million)
TABLE 160 CANADA REHABILITATION THERAPY SERVICES Market, By END USER, 2019-2028 (USD Million)
TABLE 161 CANADA REHABILITATION THERAPY SERVICES Market, By SERVICE CHANNEL, 2019-2028 (USD Million)
TABLE 162 MEXICO REHABILITATION THERAPY SERVICES Market, By SERVICE, 2019-2028 (USD Million)
TABLE 163 MEXICO REHABILITATION THERAPY in rehabilitation therapy SERVICES Market, By service, 2019-2028 (USD Million)
TABLE 164 MEXICO SPEECH THERAPY IN REHABILITATION THERAPY SERVICES Market, By SERVICE, 2019-2028 (Units)
TABLE 165 MEXICO REHABILITATION THERAPY SERVICES Market, By AGE GROUP, 2019-2028 (USD Million)
TABLE 166 MEXICO ELDERLY in REHABILITATION THERAPY SERVICES Market, By AGE GROUP, 2019-2028 (USD Million)
TABLE 167 MEXICO OUT-PATIENT TREATMENT in REHABILITATION THERAPY SERVICES Market, By AGE GROUP , 2019-2028 (USD Million)
TABLE 168 MEXICO IN-PATIENT TREATMENT in REHABILITATION THERAPY SERVICES Market, By AGE GROUP, 2019-2028 (USD Million)
TABLE 169 MEXICO PEDIATRICS in REHABILITATION THERAPY SERVICES Market, By AGE GROUP, 2019-2028 (USD Million)
TABLE 170 MEXICO out-patient treatment in REHABILITATION THERAPY SERVICES Market, By age group, 2019-2028 (USD Million)
TABLE 171 MEXICO IN-PATIENT TREATMENT in REHABILITATION THERAPY SERVICES Market, By AGE GROUP, 2019-2028 (USD Million)
TABLE 172 MEXICO ADULTS in REHABILITATION THERAPY SERVICES Market, By AGE GROUP, 2019-2028 (USD Million)
TABLE 173 MEXICO out-patient treatment in REHABILITATION THERAPY SERVICES Market, By age group, 2019-2028 (USD Million)
TABLE 174 MEXICO IN-PATIENT TREATMENT in REHABILITATION THERAPY SERVICES Market, By AGE GROUP, 2019-2028 (USD Million)
TABLE 175 MEXICO REHABILITATION THERAPY SERVICES Market, By service type, 2019-2028 (USD Million)
TABLE 176 MEXICO out patient REHABILITATION THERAPY SERVICES Market, By service type, 2019-2028 (USD Million)
TABLE 177 MEXICO IN-patient REHABILITATION THERAPY SERVICES Market, By service type, 2019-2028 (USD Million)
TABLE 178 MEXICO REHABILITATION THERAPY SERVICES Market, By application, 2019-2028 (USD Million)
TABLE 179 MEXICO NEUROLOGICAL REHABILITATION THERAPY SERVICES Market, By APPLICATION, 2019-2028 (USD Million)
TABLE 180 MEXICO PULMONARY REHABILITATION THERAPY SERVICES Market, By APPLICATION, 2019-2028 (USD Million)
TABLE 181 MEXICO CARDIOLOGICAL REHABILITATION THERAPY SERVICES Market, By APPLICATION, 2019-2028 (USD Million)
TABLE 182 MEXICO SPORTS RELATED INJURIES IN REHABILITATION THERAPY SERVICES Market, By APPLICATION, 2019-2028 (USD Million)
TABLE 183 MEXICO PELVIC CARE IN REHABILITATION THERAPY SERVICES Market, By APPLICATION, 2019-2028 (USD Million)
TABLE 184 MEXICO ORTHOPEDIC REHABILITATION THERAPY SERVICES IN REHABILITATION THERAPY SERVICES Market, By APPLICATION, 2019-2028 (USD Million)
TABLE 185 MEXICO INTEGUMENTARY REHABILITATION THERAPY SERVICES IN REHABILITATION THERAPY SERVICES Market, By APPLICATION, 2019-2028 (USD Million)
TABLE 186 MEXICO PALLIATIVE CARE IN REHABILITATION THERAPY SERVICES Market, By APPLICATION, 2019-2028 (USD Million)
TABLE 187 MEXICO REHABILITATION THERAPY SERVICES Market, By SERVICE CATEGORY, 2019-2028 (USD Million)
TABLE 188 MEXICO REHABILITATION THERAPY SERVICES Market, By model, 2019-2028 (USD Million)
TABLE 189 MEXICO MANUAL IN REHABILITATION THERAPY SERVICES Market, By model, 2019-2028 (USD Million)
TABLE 190 MEXICO CONVENTIONAL IN REHABILITATION THERAPY SERVICES Market, By model, 2019-2028 (USD Million)
TABLE 191 MEXICO REHABILITATION THERAPY SERVICES Market, By END USER, 2019-2028 (USD Million)
TABLE 192 MEXICO REHABILITATION THERAPY SERVICES Market, By SERVICE CHANNEL, 2019-2028 (USD Million)
TABLE 193 Europe REHABILITATION THERAPY services market, By Country, 2019-2028 (USD Million)
TABLE 194 Europe Rehabilitation Therapy Services Market, By Service, 2019-2028 (USD Million)
TABLE 195 Europe Rehabilitation Therapy in Rehabilitation Therapy Services Market, By Service, 2019-2028 (USD Million)
TABLE 196 Europe Speech Therapy in Rehabilitation Therapy Services Market, By Service, 2019-2028 (USD Million)
TABLE 197 Europe Rehabilitation Therapy Services Market, By Age Group, 2019-2028(USD Million)
TABLE 198 Europe Elderly in Rehabilitation Therapy Services Market, By Age Group, 2019-2028 (USD Million)
TABLE 199 Europe Out-Patient Treatment in Rehabilitation Therapy Services Market, By Age Group, 2019-2028 (USD Million)
TABLE 200 Europe In-Patient Treatment in Rehabilitation Therapy Services Market, By Age Group, 2019-2028 (USD Million)
TABLE 201 Europe Pediatrics in Rehabilitation Therapy Services Market, By Age Group, 2019-2028 (USD Million)
TABLE 202 Europe Out-Patient Treatment in Rehabilitation Therapy Services Market, By Age Group, 2019-2028 (USD Million)
TABLE 203 Europe In-Patient Treatment in Rehabilitation Therapy Services Market, By Age Group, 2019-2028 (USD Million)
TABLE 204 Europe Adults in Rehabilitation Therapy Services Market, By Age Group, 2019-2028 (USD Million)
TABLE 205 Europe Out-Patient Treatment in Rehabilitation Therapy Services Market, By Age Group, 2019-2028 (USD Million)
TABLE 206 Europe In-Patient Treatment in Rehabilitation Therapy Services Market, By Age Group, 2019-2028 (USD Million)
TABLE 207 Europe Rehabilitation Therapy Services Market, By Service Type, 2019-2028 (USD Million)
TABLE 208 Europe Outpatient Rehabilitation Services in Rehabilitation Therapy Services Market, By Service Type, 2019-2028 (USD Million)
TABLE 209 Europe In-Patient Rehabilitation Services in Rehabilitation Therapy Services Market, By Service Type, 2019-2028 (USD Million)
TABLE 210 Europe Rehabilitation Therapy Services Market, By Application, 2019-2028 (USD Million)
TABLE 211 Europe Neurological Rehabilitation Therapy Services in Rehabilitation Therapy Services Market, By Application, 2019-2028 (USD Million)
TABLE 212 Europe Pulmonary Rehabilitation Therapy Services in Rehabilitation Therapy Services Market, By Application, 2019-2028 (USD Million)
TABLE 213 Europe Cardiological Rehabilitation Therapy Services in Rehabilitation Therapy Services Market, By Application, 2019-2028 (USD Million)
TABLE 214 Europe Sports- Related Injuries in Rehabilitation Therapy Services Market, By Application, 2019-2028 (USD Million)
TABLE 215 Europe Pelvic Care in Rehabilitation Therapy Services Market, By Application, 2019-2028 (USD Million)
TABLE 216 Europe Orthopedic Rehabilitation Therapy Services in Rehabilitation Therapy Services Market, By Application, 2019-2028 (USD Million)
TABLE 217 Europe Integumentary Rehabilitation Therapy Services in Rehabilitation Therapy Services Market, By Application, 2019-2028 (USD Million)
TABLE 218 Europe Palliative Care in Rehabilitation Therapy Services Market, By Application, 2019-2028 (USD Million)
TABLE 219 Europe Rehabilitation Therapy Services Market, By Service Category, 2019-2028 (USD Million)
TABLE 220 Europe Rehabilitation Therapy Services Market, By Model, 2019-2028 (USD Million)
TABLE 221 Europe Manual in Rehabilitation Therapy Services Market, By Model, 2019-2028 (USD Million)
TABLE 222 Europe Conventional in Rehabilitation Therapy Services Market, By Model, 2019-2028 (USD Million)
TABLE 223 Europe Rehabilitation Therapy Services Market, By End User, 2019-2028 (USD Million)
TABLE 224 Europe Rehabilitation Therapy Services Market, By Service Channel, 2019-2028 (USD Million)
TABLE 225 Germany Rehabilitation Therapy Services Market, By Service, 2019-2028 (USD Million)
TABLE 226 Germany Rehabilitation Therapy in Rehabilitation Therapy Services Market, By Service, 2019-2028 (USD Million)
TABLE 227 Germany Speech Therapy in Rehabilitation Therapy Services Market, By Service, 2019-2028 (USD Million)
TABLE 228 Germany Rehabilitation Therapy Services Market, By Age Group, 2019-2028(USD Million)
TABLE 229 Germany Elderly in Rehabilitation Therapy Services Market, By Age Group, 2019-2028 (USD Million)
TABLE 230 Germany Out-Patient Treatment in Rehabilitation Therapy Services Market, By Age Group, 2019-2028 (USD Million)
TABLE 231 Germany In-Patient Treatment in Rehabilitation Therapy Services Market, By Age Group, 2019-2028 (USD Million)
TABLE 232 Germany Pediatrics in Rehabilitation Therapy Services Market, By Age Group, 2019-2028 (USD Million)
TABLE 233 Germany Out-Patient Treatment in Rehabilitation Therapy Services Market, By Age Group, 2019-2028 (USD Million)
TABLE 234 Germany In-Patient Treatment in Rehabilitation Therapy Services Market, By Age Group, 2019-2028 (USD Million)
TABLE 235 Germany Adults in Rehabilitation Therapy Services Market, By Age Group, 2019-2028 (USD Million)
TABLE 236 Germany Out-Patient Treatment in Rehabilitation Therapy Services Market, By Age Group, 2019-2028 (USD Million)
TABLE 237 Germany In-Patient Treatment in Rehabilitation Therapy Services Market, By Age Group, 2019-2028 (USD Million)
TABLE 238 Germany Rehabilitation Therapy Services Market, By Service Type, 2019-2028 (USD Million)
TABLE 239 Germany Outpatient Rehabilitation Services in Rehabilitation Therapy Services Market, By Service Type, 2019-2028 (USD Million)
TABLE 240 Germany In-Patient Rehabilitation Services in Rehabilitation Therapy Services Market, By Service Type, 2019-2028 (USD Million)
TABLE 241 Germany Rehabilitation Therapy Services Market, By Application, 2019-2028 (USD Million)
TABLE 242 Germany Neurological Rehabilitation Therapy Services in Rehabilitation Therapy Services Market, By Application, 2019-2028 (USD Million)
TABLE 243 Germany Pulmonary Rehabilitation Therapy Services in Rehabilitation Therapy Services Market, By Application, 2019-2028 (USD Million)
TABLE 244 Germany Cardiological Rehabilitation Therapy Services in Rehabilitation Therapy Services Market, By Application, 2019-2028 (USD Million)
TABLE 245 Germany Sports- Related Injuries in Rehabilitation Therapy Services Market, By Application, 2019-2028 (USD Million)
TABLE 246 Germany Pelvic Care in Rehabilitation Therapy Services Market, By Application, 2019-2028 (USD Million)
TABLE 247 Germany Orthopedic Rehabilitation Therapy Services in Rehabilitation Therapy Services Market, By Application, 2019-2028 (USD Million)
TABLE 248 Germany Integumentary Rehabilitation Therapy Services in Rehabilitation Therapy Services Market, By Application, 2019-2028 (USD Million)
TABLE 249 Germany Palliative Care in Rehabilitation Therapy Services Market, By Application, 2019-2028 (USD Million)
TABLE 250 Germany Rehabilitation Therapy Services Market, By Service Category, 2019-2028 (USD Million)
TABLE 251 Germany Rehabilitation Therapy Services Market, By Model, 2019-2028 (USD Million)
TABLE 252 Germany Manual in Rehabilitation Therapy Services Market, By Model, 2019-2028 (USD Million)
TABLE 253 Germany Conventional in Rehabilitation Therapy Services Market, By Model, 2019-2028 (USD Million)
TABLE 254 Germany Rehabilitation Therapy Services Market, By End User, 2019-2028 (USD Million)
TABLE 255 Germany Rehabilitation Therapy Services Market, By Service Channel, 2019-2028 (USD Million)
TABLE 256 France Rehabilitation Therapy Services Market, By Service, 2019-2028 (USD Million)
TABLE 257 France Rehabilitation Therapy in Rehabilitation Therapy Services Market, By Service, 2019-2028 (USD Million)
TABLE 258 France Speech Therapy in Rehabilitation Therapy Services Market, By Service, 2019-2028 (USD Million)
TABLE 259 France Rehabilitation Therapy Services Market, By Age Group, 2019-2028(USD Million)
TABLE 260 France Elderly in Rehabilitation Therapy Services Market, By Age Group, 2019-2028 (USD Million)
TABLE 261 France Out-Patient Treatment in Rehabilitation Therapy Services Market, By Age Group, 2019-2028 (USD Million)
TABLE 262 France In-Patient Treatment in Rehabilitation Therapy Services Market, By Age Group, 2019-2028 (USD Million)
TABLE 263 France Pediatrics in Rehabilitation Therapy Services Market, By Age Group, 2019-2028 (USD Million)
TABLE 264 France Out-Patient Treatment in Rehabilitation Therapy Services Market, By Age Group, 2019-2028 (USD Million)
TABLE 265 France In-Patient Treatment in Rehabilitation Therapy Services Market, By Age Group, 2019-2028 (USD Million)
TABLE 266 France Adults in Rehabilitation Therapy Services Market, By Age Group, 2019-2028 (USD Million)
TABLE 267 France Out-Patient Treatment in Rehabilitation Therapy Services Market, By Age Group, 2019-2028 (USD Million)
TABLE 268 France In-Patient Treatment in Rehabilitation Therapy Services Market, By Age Group, 2019-2028 (USD Million)
TABLE 269 France Rehabilitation Therapy Services Market, By Service Type, 2019-2028 (USD Million)
TABLE 270 France Outpatient Rehabilitation Services in Rehabilitation Therapy Services Market, By Service Type, 2019-2028 (USD Million)
TABLE 271 France In-Patient Rehabilitation Services in Rehabilitation Therapy Services Market, By Service Type, 2019-2028 (USD Million)
TABLE 272 France Rehabilitation Therapy Services Market, By Application, 2019-2028 (USD Million)
TABLE 273 France Neurological Rehabilitation Therapy Services in Rehabilitation Therapy Services Market, By Application, 2019-2028 (USD Million)
TABLE 274 France Pulmonary Rehabilitation Therapy Services in Rehabilitation Therapy Services Market, By Application, 2019-2028 (USD Million)
TABLE 275 France Cardiological Rehabilitation Therapy Services in Rehabilitation Therapy Services Market, By Application, 2019-2028 (USD Million)
TABLE 276 France Sports- Related Injuries in Rehabilitation Therapy Services Market, By Application, 2019-2028 (USD Million)
TABLE 277 France Pelvic Care in Rehabilitation Therapy Services Market, By Application, 2019-2028 (USD Million)
TABLE 278 France Orthopedic Rehabilitation Therapy Services in Rehabilitation Therapy Services Market, By Application, 2019-2028 (USD Million)
TABLE 279 France Integumentary Rehabilitation Therapy Services in Rehabilitation Therapy Services Market, By Application, 2019-2028 (USD Million)
TABLE 280 France Palliative Care in Rehabilitation Therapy Services Market, By Application, 2019-2028 (USD Million)
TABLE 281 France Rehabilitation Therapy Services Market, By Service Category, 2019-2028 (USD Million)
TABLE 282 France Rehabilitation Therapy Services Market, By Model, 2019-2028 (USD Million)
TABLE 283 France Manual in Rehabilitation Therapy Services Market, By Model, 2019-2028 (USD Million)
TABLE 284 France Conventional in Rehabilitation Therapy Services Market, By Model, 2019-2028 (USD Million)
TABLE 285 France Rehabilitation Therapy Services Market, By End User, 2019-2028 (USD Million)
TABLE 286 France Rehabilitation Therapy Services Market, By Service Channel, 2019-2028 (USD Million)
TABLE 287 U.K. Rehabilitation Therapy Services Market, By Service, 2019-2028 (USD Million)
TABLE 288 U.K. Rehabilitation Therapy in Rehabilitation Therapy Services Market, By Service, 2019-2028 (USD Million)
TABLE 289 U.K. Speech Therapy in Rehabilitation Therapy Services Market, By Service, 2019-2028 (USD Million)
TABLE 290 U.K. Rehabilitation Therapy Services Market, By Age Group, 2019-2028(USD Million)
TABLE 291 U.K. Elderly in Rehabilitation Therapy Services Market, By Age Group, 2019-2028 (USD Million)
TABLE 292 U.K. Out-Patient Treatment in Rehabilitation Therapy Services Market, By Age Group, 2019-2028 (USD Million)
TABLE 293 U.K. In-Patient Treatment in Rehabilitation Therapy Services Market, By Age Group, 2019-2028 (USD Million)
TABLE 294 U.K. Pediatrics in Rehabilitation Therapy Services Market, By Age Group, 2019-2028 (USD Million)
TABLE 295 U.K. Out-Patient Treatment in Rehabilitation Therapy Services Market, By Age Group, 2019-2028 (USD Million)
TABLE 296 U.K. In-Patient Treatment in Rehabilitation Therapy Services Market, By Age Group, 2019-2028 (USD Million)
TABLE 297 U.K. Adults in Rehabilitation Therapy Services Market, By Age Group, 2019-2028 (USD Million)
TABLE 298 U.K. Out-Patient Treatment in Rehabilitation Therapy Services Market, By Age Group, 2019-2028 (USD Million)
TABLE 299 U.K. In-Patient Treatment in Rehabilitation Therapy Services Market, By Age Group, 2019-2028 (USD Million)
TABLE 300 U.K. Rehabilitation Therapy Services Market, By Service Type, 2019-2028 (USD Million)
TABLE 301 U.K. Outpatient Rehabilitation Services in Rehabilitation Therapy Services Market, By Service Type, 2019-2028 (USD Million)
TABLE 302 U.K. In-Patient Rehabilitation Services in Rehabilitation Therapy Services Market, By Service Type, 2019-2028 (USD Million)
TABLE 303 U.K. Rehabilitation Therapy Services Market, By Application, 2019-2028 (USD Million)
TABLE 304 U.K. Neurological Rehabilitation Therapy Services in Rehabilitation Therapy Services Market, By Application, 2019-2028 (USD Million)
TABLE 305 U.K. Pulmonary Rehabilitation Therapy Services in Rehabilitation Therapy Services Market, By Application, 2019-2028 (USD Million)
TABLE 306 U.K. Cardiological Rehabilitation Therapy Services in Rehabilitation Therapy Services Market, By Application, 2019-2028 (USD Million)
TABLE 307 U.K. Sports- Related Injuries in Rehabilitation Therapy Services Market, By Application, 2019-2028 (USD Million)
TABLE 308 U.K. Pelvic Care in Rehabilitation Therapy Services Market, By Application, 2019-2028 (USD Million)
TABLE 309 U.K. Orthopedic Rehabilitation Therapy Services in Rehabilitation Therapy Services Market, By Application, 2019-2028 (USD Million)
TABLE 310 U.K. Integumentary Rehabilitation Therapy Services in Rehabilitation Therapy Services Market, By Application, 2019-2028 (USD Million)
TABLE 311 U.K. Palliative Care in Rehabilitation Therapy Services Market, By Application, 2019-2028 (USD Million)
TABLE 312 U.K. Rehabilitation Therapy Services Market, By Service Category, 2019-2028 (USD Million)
TABLE 313 U.K. Rehabilitation Therapy Services Market, By Model, 2019-2028 (USD Million)
TABLE 314 U.K. Manual in Rehabilitation Therapy Services Market, By Model, 2019-2028 (USD Million)
TABLE 315 U.K. Conventional in Rehabilitation Therapy Services Market, By Model, 2019-2028 (USD Million)
TABLE 316 U.K. Rehabilitation Therapy Services Market, By End User, 2019-2028 (USD Million)
TABLE 317 U.K. Rehabilitation Therapy Services Market, By Service Channel, 2019-2028 (USD Million)
TABLE 318 ITALY Rehabilitation Therapy Services Market, By Service, 2019-2028 (USD Million)
TABLE 319 ITALY Rehabilitation Therapy in Rehabilitation Therapy Services Market, By Service, 2019-2028 (USD Million)
TABLE 320 ITALY Speech Therapy in Rehabilitation Therapy Services Market, By Service, 2019-2028 (USD Million)
TABLE 321 ITALY Rehabilitation Therapy Services Market, By Age Group, 2019-2028(USD Million)
TABLE 322 ITALY Elderly in Rehabilitation Therapy Services Market, By Age Group, 2019-2028 (USD Million)
TABLE 323 ITALY Out-Patient Treatment in Rehabilitation Therapy Services Market, By Age Group, 2019-2028 (USD Million)
TABLE 324 ITALY In-Patient Treatment in Rehabilitation Therapy Services Market, By Age Group, 2019-2028 (USD Million)
TABLE 325 ITALY Pediatrics in Rehabilitation Therapy Services Market, By Age Group, 2019-2028 (USD Million)
TABLE 326 ITALY Out-Patient Treatment in Rehabilitation Therapy Services Market, By Age Group, 2019-2028 (USD Million)
TABLE 327 ITALY In-Patient Treatment in Rehabilitation Therapy Services Market, By Age Group, 2019-2028 (USD Million)
TABLE 328 ITALY Adults in Rehabilitation Therapy Services Market, By Age Group, 2019-2028 (USD Million)
TABLE 329 ITALY Out-Patient Treatment in Rehabilitation Therapy Services Market, By Age Group, 2019-2028 (USD Million)
TABLE 330 ITALY In-Patient Treatment in Rehabilitation Therapy Services Market, By Age Group, 2019-2028 (USD Million)
TABLE 331 ITALY Rehabilitation Therapy Services Market, By Service Type, 2019-2028 (USD Million)
TABLE 332 ITALY Outpatient Rehabilitation Services in Rehabilitation Therapy Services Market, By Service Type, 2019-2028 (USD Million)
TABLE 333 ITALY In-Patient Rehabilitation Services in Rehabilitation Therapy Services Market, By Service Type, 2019-2028 (USD Million)
TABLE 334 ITALY Rehabilitation Therapy Services Market, By Application, 2019-2028 (USD Million)
TABLE 335 ITALY Neurological Rehabilitation Therapy Services in Rehabilitation Therapy Services Market, By Application, 2019-2028 (USD Million)
TABLE 336 ITALY Pulmonary Rehabilitation Therapy Services in Rehabilitation Therapy Services Market, By Application, 2019-2028 (USD Million)
TABLE 337 ITALY Cardiological Rehabilitation Therapy Services in Rehabilitation Therapy Services Market, By Application, 2019-2028 (USD Million)
TABLE 338 ITALY Sports- Related Injuries in Rehabilitation Therapy Services Market, By Application, 2019-2028 (USD Million)
TABLE 339 ITALY Pelvic Care in Rehabilitation Therapy Services Market, By Application, 2019-2028 (USD Million)
TABLE 340 ITALY Orthopedic Rehabilitation Therapy Services in Rehabilitation Therapy Services Market, By Application, 2019-2028 (USD Million)
TABLE 341 ITALY Integumentary Rehabilitation Therapy Services in Rehabilitation Therapy Services Market, By Application, 2019-2028 (USD Million)
TABLE 342 ITALY Palliative Care in Rehabilitation Therapy Services Market, By Application, 2019-2028 (USD Million)
TABLE 343 ITALY Rehabilitation Therapy Services Market, By Service Category, 2019-2028 (USD Million)
TABLE 344 ITALY Rehabilitation Therapy Services Market, By Model, 2019-2028 (USD Million)
TABLE 345 ITALY Manual in Rehabilitation Therapy Services Market, By Model, 2019-2028 (USD Million)
TABLE 346 ITALY Conventional in Rehabilitation Therapy Services Market, By Model, 2019-2028 (USD Million)
TABLE 347 ITALY Rehabilitation Therapy Services Market, By End User, 2019-2028 (USD Million)
TABLE 348 ITALY Rehabilitation Therapy Services Market, By Service Channel, 2019-2028 (USD Million)
TABLE 349 SPAIN Rehabilitation Therapy Services Market, By Service, 2019-2028 (USD Million)
TABLE 350 SPAIN Rehabilitation Therapy in Rehabilitation Therapy Services Market, By Service, 2019-2028 (USD Million)
TABLE 351 SPAIN Speech Therapy in Rehabilitation Therapy Services Market, By Service, 2019-2028 (USD Million)
TABLE 352 SPAIN Rehabilitation Therapy Services Market, By Age Group, 2019-2028(USD Million)
TABLE 353 SPAIN Elderly in Rehabilitation Therapy Services Market, By Age Group, 2019-2028 (USD Million)
TABLE 354 SPAIN Out-Patient Treatment in Rehabilitation Therapy Services Market, By Age Group, 2019-2028 (USD Million)
TABLE 355 SPAIN In-Patient Treatment in Rehabilitation Therapy Services Market, By Age Group, 2019-2028 (USD Million)
TABLE 356 SPAIN Pediatrics in Rehabilitation Therapy Services Market, By Age Group, 2019-2028 (USD Million)
TABLE 357 SPAIN Out-Patient Treatment in Rehabilitation Therapy Services Market, By Age Group, 2019-2028 (USD Million)
TABLE 358 SPAIN In-Patient Treatment in Rehabilitation Therapy Services Market, By Age Group, 2019-2028 (USD Million)
TABLE 359 SPAIN Adults in Rehabilitation Therapy Services Market, By Age Group, 2019-2028 (USD Million)
TABLE 360 SPAIN Out-Patient Treatment in Rehabilitation Therapy Services Market, By Age Group, 2019-2028 (USD Million)
TABLE 361 SPAIN In-Patient Treatment in Rehabilitation Therapy Services Market, By Age Group, 2019-2028 (USD Million)
TABLE 362 SPAIN Rehabilitation Therapy Services Market, By Service Type, 2019-2028 (USD Million)
TABLE 363 SPAIN Outpatient Rehabilitation Services in Rehabilitation Therapy Services Market, By Service Type, 2019-2028 (USD Million)
TABLE 364 SPAIN In-Patient Rehabilitation Services in Rehabilitation Therapy Services Market, By Service Type, 2019-2028 (USD Million)
TABLE 365 SPAIN Rehabilitation Therapy Services Market, By Application, 2019-2028 (USD Million)
TABLE 366 SPAIN Neurological Rehabilitation Therapy Services in Rehabilitation Therapy Services Market, By Application, 2019-2028 (USD Million)
TABLE 367 SPAIN Pulmonary Rehabilitation Therapy Services in Rehabilitation Therapy Services Market, By Application, 2019-2028 (USD Million)
TABLE 368 SPAIN Cardiological Rehabilitation Therapy Services in Rehabilitation Therapy Services Market, By Application, 2019-2028 (USD Million)
TABLE 369 SPAIN Sports- Related Injuries in Rehabilitation Therapy Services Market, By Application, 2019-2028 (USD Million)
TABLE 370 SPAIN Pelvic Care in Rehabilitation Therapy Services Market, By Application, 2019-2028 (USD Million)
TABLE 371 SPAIN Orthopedic Rehabilitation Therapy Services in Rehabilitation Therapy Services Market, By Application, 2019-2028 (USD Million)
TABLE 372 spain Integumentary Rehabilitation Therapy Services in Rehabilitation Therapy Services Market, By Application, 2019-2028 (USD Million)
TABLE 373 spain Palliative Care in Rehabilitation Therapy Services Market, By Application, 2019-2028 (USD Million)
TABLE 374 spain Rehabilitation Therapy Services Market, By Service Category, 2019-2028 (USD Million)
TABLE 375 spain Rehabilitation Therapy Services Market, By Model, 2019-2028 (USD Million)
TABLE 376 spain Manual in Rehabilitation Therapy Services Market, By Model, 2019-2028 (USD Million)
TABLE 377 spain Conventional in Rehabilitation Therapy Services Market, By Model, 2019-2028 (USD Million)
TABLE 378 spain Rehabilitation Therapy Services Market, By End User, 2019-2028 (USD Million)
TABLE 379 spain Rehabilitation Therapy Services Market, By Service Channel, 2019-2028 (USD Million)
TABLE 380 RUSSIA Rehabilitation Therapy Services Market, By Service, 2019-2028 (USD Million)
TABLE 381 RUSSIA Rehabilitation Therapy in Rehabilitation Therapy Services Market, By Service, 2019-2028 (USD Million)
TABLE 382 RUSSIA Speech Therapy in Rehabilitation Therapy Services Market, By Service, 2019-2028 (USD Million)
TABLE 383 RUSSIA Rehabilitation Therapy Services Market, By Age Group, 2019-2028(USD Million)
TABLE 384 russia Elderly in Rehabilitation Therapy Services Market, By Age Group, 2019-2028 (USD Million)
TABLE 385 russia Out-Patient Treatment in Rehabilitation Therapy Services Market, By Age Group, 2019-2028 (USD Million)
TABLE 386 Russia In-Patient Treatment in Rehabilitation Therapy Services Market, By Age Group, 2019-2028 (USD Million)
TABLE 387 RUSSIA Pediatrics in Rehabilitation Therapy Services Market, By Age Group, 2019-2028 (USD Million)
TABLE 388 RUSSIA Out-Patient Treatment in Rehabilitation Therapy Services Market, By Age Group, 2019-2028 (USD Million)
TABLE 389 RUSSIA In-Patient Treatment in Rehabilitation Therapy Services Market, By Age Group, 2019-2028 (USD Million)
TABLE 390 RUSSIA Adults in Rehabilitation Therapy Services Market, By Age Group, 2019-2028 (USD Million)
TABLE 391 RUSSIA Out-Patient Treatment in Rehabilitation Therapy Services Market, By Age Group, 2019-2028 (USD Million)
TABLE 392 RUSSIA In-Patient Treatment in Rehabilitation Therapy Services Market, By Age Group, 2019-2028 (USD Million)
TABLE 393 RUSSIA Rehabilitation Therapy Services Market, By Service Type, 2019-2028 (USD Million)
TABLE 394 RUSSIA Outpatient Rehabilitation Services in Rehabilitation Therapy Services Market, By Service Type, 2019-2028 (USD Million)
TABLE 395 RUSSIA In-Patient Rehabilitation Services in Rehabilitation Therapy Services Market, By Service Type, 2019-2028 (USD Million)
TABLE 396 RUSSIA Rehabilitation Therapy Services Market, By Application, 2019-2028 (USD Million)
TABLE 397 RUSSIA Neurological Rehabilitation Therapy Services in Rehabilitation Therapy Services Market, By Application, 2019-2028 (USD Million)
TABLE 398 RUSSIA Pulmonary Rehabilitation Therapy Services in Rehabilitation Therapy Services Market, By Application, 2019-2028 (USD Million)
TABLE 399 RUSSIA Cardiological Rehabilitation Therapy Services in Rehabilitation Therapy Services Market, By Application, 2019-2028 (USD Million)
TABLE 400 RUSSIA Sports- Related Injuries in Rehabilitation Therapy Services Market, By Application, 2019-2028 (USD Million)
TABLE 401 RUSSIA Pelvic Care in Rehabilitation Therapy Services Market, By Application, 2019-2028 (USD Million)
TABLE 402 RUSSIA Orthopedic Rehabilitation Therapy Services in Rehabilitation Therapy Services Market, By Application, 2019-2028 (USD Million)
TABLE 403 Russia Integumentary Rehabilitation Therapy Services in Rehabilitation Therapy Services Market, By Application, 2019-2028 (USD Million)
TABLE 404 Russia Palliative Care in Rehabilitation Therapy Services Market, By Application, 2019-2028 (USD Million)
TABLE 405 Russia Rehabilitation Therapy Services Market, By Service Category, 2019-2028 (USD Million)
TABLE 406 Russia Rehabilitation Therapy Services Market, By Model, 2019-2028 (USD Million)
TABLE 407 Russia Manual in Rehabilitation Therapy Services Market, By Model, 2019-2028 (USD Million)
TABLE 408 Russia Conventional in Rehabilitation Therapy Services Market, By Model, 2019-2028 (USD Million)
TABLE 409 Russia Rehabilitation Therapy Services Market, By End User, 2019-2028 (USD Million)
TABLE 410 Russia Rehabilitation Therapy Services Market, By Service Channel, 2019-2028 (USD Million)
TABLE 411 TURKEY Rehabilitation Therapy Services Market, By Service, 2019-2028 (USD Million)
TABLE 412 TURKEY Rehabilitation Therapy in Rehabilitation Therapy Services Market, By Service, 2019-2028 (USD Million)
TABLE 413 TURKEY Speech Therapy in Rehabilitation Therapy Services Market, By Service, 2019-2028 (USD Million)
TABLE 414 TURKEY Rehabilitation Therapy Services Market, By Age Group, 2019-2028(USD Million)
TABLE 415 Turkey Elderly in Rehabilitation Therapy Services Market, By Age Group, 2019-2028 (USD Million)
TABLE 416 Turkey Out-Patient Treatment in Rehabilitation Therapy Services Market, By Age Group, 2019-2028 (USD Million)
TABLE 417 Turkey In-Patient Treatment in Rehabilitation Therapy Services Market, By Age Group, 2019-2028 (USD Million)
TABLE 418 TURKEY Pediatrics in Rehabilitation Therapy Services Market, By Age Group, 2019-2028 (USD Million)
TABLE 419 TURKEY Out-Patient Treatment in Rehabilitation Therapy Services Market, By Age Group, 2019-2028 (USD Million)
TABLE 420 TURKEY In-Patient Treatment in Rehabilitation Therapy Services Market, By Age Group, 2019-2028 (USD Million)
TABLE 421 TURKEY Adults in Rehabilitation Therapy Services Market, By Age Group, 2019-2028 (USD Million)
TABLE 422 TURKEY Out-Patient Treatment in Rehabilitation Therapy Services Market, By Age Group, 2019-2028 (USD Million)
TABLE 423 TURKEY In-Patient Treatment in Rehabilitation Therapy Services Market, By Age Group, 2019-2028 (USD Million)
TABLE 424 TURKEY Rehabilitation Therapy Services Market, By Service Type, 2019-2028 (USD Million)
TABLE 425 TURKEY Outpatient Rehabilitation Services in Rehabilitation Therapy Services Market, By Service Type, 2019-2028 (USD Million)
TABLE 426 TURKEY In-Patient Rehabilitation Services in Rehabilitation Therapy Services Market, By Service Type, 2019-2028 (USD Million)
TABLE 427 TURKEY Rehabilitation Therapy Services Market, By Application, 2019-2028 (USD Million)
TABLE 428 TURKEY Neurological Rehabilitation Therapy Services in Rehabilitation Therapy Services Market, By Application, 2019-2028 (USD Million)
TABLE 429 TURKEY Pulmonary Rehabilitation Therapy Services in Rehabilitation Therapy Services Market, By Application, 2019-2028 (USD Million)
TABLE 430 TURKEY Cardiological Rehabilitation Therapy Services in Rehabilitation Therapy Services Market, By Application, 2019-2028 (USD Million)
TABLE 431 TURKEY Sports- Related Injuries in Rehabilitation Therapy Services Market, By Application, 2019-2028 (USD Million)
TABLE 432 TURKEY Pelvic Care in Rehabilitation Therapy Services Market, By Application, 2019-2028 (USD Million)
TABLE 433 TURKEY Orthopedic Rehabilitation Therapy Services in Rehabilitation Therapy Services Market, By Application, 2019-2028 (USD Million)
TABLE 434 Turkey Integumentary Rehabilitation Therapy Services in Rehabilitation Therapy Services Market, By Application, 2019-2028 (USD Million)
TABLE 435 Turkey Palliative Care in Rehabilitation Therapy Services Market, By Application, 2019-2028 (USD Million)
TABLE 436 Turkey Rehabilitation Therapy Services Market, By Service Category, 2019-2028 (USD Million)
TABLE 437 Turkey Rehabilitation Therapy Services Market, By Model, 2019-2028 (USD Million)
TABLE 438 Turkey Manual in Rehabilitation Therapy Services Market, By Model, 2019-2028 (USD Million)
TABLE 439 Turkey Conventional in Rehabilitation Therapy Services Market, By Model, 2019-2028 (USD Million)
TABLE 440 Turkey Rehabilitation Therapy Services Market, By End User, 2019-2028 (USD Million)
TABLE 441 Turkey Rehabilitation Therapy Services Market, By Service Channel, 2019-2028 (USD Million)
TABLE 442 IRELAND Rehabilitation Therapy Services Market, By Service, 2019-2028 (USD Million)
TABLE 443 IRELAND Rehabilitation Therapy in Rehabilitation Therapy Services Market, By Service, 2019-2028 (USD Million)
TABLE 444 IRELAND Speech Therapy in Rehabilitation Therapy Services Market, By Service, 2019-2028 (USD Million)
TABLE 445 IRELAND Rehabilitation Therapy Services Market, By Age Group, 2019-2028(USD Million)
TABLE 446 Ireland Elderly in Rehabilitation Therapy Services Market, By Age Group, 2019-2028 (USD Million)
TABLE 447 Ireland Out-Patient Treatment in Rehabilitation Therapy Services Market, By Age Group, 2019-2028 (USD Million)
TABLE 448 Ireland In-Patient Treatment in Rehabilitation Therapy Services Market, By Age Group, 2019-2028 (USD Million)
TABLE 449 IRELAND Pediatrics in Rehabilitation Therapy Services Market, By Age Group, 2019-2028 (USD Million)
TABLE 450 IRELAND Out-Patient Treatment in Rehabilitation Therapy Services Market, By Age Group, 2019-2028 (USD Million)
TABLE 451 IRELAND In-Patient Treatment in Rehabilitation Therapy Services Market, By Age Group, 2019-2028 (USD Million)
TABLE 452 IRELAND Adults in Rehabilitation Therapy Services Market, By Age Group, 2019-2028 (USD Million)
TABLE 453 IRELAND Out-Patient Treatment in Rehabilitation Therapy Services Market, By Age Group, 2019-2028 (USD Million)
TABLE 454 IRELAND In-Patient Treatment in Rehabilitation Therapy Services Market, By Age Group, 2019-2028 (USD Million)
TABLE 455 Ireland Rehabilitation Therapy Services Market, By Service Type, 2019-2028 (USD Million)
TABLE 456 IRELAND Outpatient Rehabilitation Services in Rehabilitation Therapy Services Market, By Service Type, 2019-2028 (USD Million)
TABLE 457 IRELAND In-Patient Rehabilitation Services in Rehabilitation Therapy Services Market, By Service Type, 2019-2028 (USD Million)
TABLE 458 IRELAND Rehabilitation Therapy Services Market, By Application, 2019-2028 (USD Million)
TABLE 459 IRELAND Neurological Rehabilitation Therapy Services in Rehabilitation Therapy Services Market, By Application, 2019-2028 (USD Million)
TABLE 460 IRELAND Pulmonary Rehabilitation Therapy Services in Rehabilitation Therapy Services Market, By Application, 2019-2028 (USD Million)
TABLE 461 IRELAND Cardiological Rehabilitation Therapy Services in Rehabilitation Therapy Services Market, By Application, 2019-2028 (USD Million)
TABLE 462 IRELAND Sports- Related Injuries in Rehabilitation Therapy Services Market, By Application, 2019-2028 (USD Million)
TABLE 463 IRELAND Pelvic Care in Rehabilitation Therapy Services Market, By Application, 2019-2028 (USD Million)
TABLE 464 IRELAND Orthopedic Rehabilitation Therapy Services in Rehabilitation Therapy Services Market, By Application, 2019-2028 (USD Million)
TABLE 465 Ireland Integumentary Rehabilitation Therapy Services in Rehabilitation Therapy Services Market, By Application, 2019-2028 (USD Million)
TABLE 466 Ireland Palliative Care in Rehabilitation Therapy Services Market, By Application, 2019-2028 (USD Million)
TABLE 467 Ireland Rehabilitation Therapy Services Market, By Service Category, 2019-2028 (USD Million)
TABLE 468 Ireland Rehabilitation Therapy Services Market, By Model, 2019-2028 (USD Million)
TABLE 469 Ireland Manual in Rehabilitation Therapy Services Market, By Model, 2019-2028 (USD Million)
TABLE 470 Ireland Conventional in Rehabilitation Therapy Services Market, By Model, 2019-2028 (USD Million)
TABLE 471 Ireland Rehabilitation Therapy Services Market, By End User, 2019-2028 (USD Million)
TABLE 472 Ireland Rehabilitation Therapy Services Market, By Service Channel, 2019-2028 (USD Million)
TABLE 473 IRELAND Rehabilitation Therapy Services Market, By Service, 2019-2028 (USD Million)
TABLE 474 IRELAND Rehabilitation Therapy in Rehabilitation Therapy Services Market, By Service, 2019-2028 (USD Million)
TABLE 475 IRELAND Speech Therapy in Rehabilitation Therapy Services Market, By Service, 2019-2028 (USD Million)
TABLE 476 IRELAND Rehabilitation Therapy Services Market, By Age Group, 2019-2028(USD Million)
TABLE 477 Ireland Elderly in Rehabilitation Therapy Services Market, By Age Group, 2019-2028 (USD Million)
TABLE 478 Ireland Out-Patient Treatment in Rehabilitation Therapy Services Market, By Age Group, 2019-2028 (USD Million)
TABLE 479 Ireland In-Patient Treatment in Rehabilitation Therapy Services Market, By Age Group, 2019-2028 (USD Million)
TABLE 480 IRELAND Pediatrics in Rehabilitation Therapy Services Market, By Age Group, 2019-2028 (USD Million)
TABLE 481 IRELAND Out-Patient Treatment in Rehabilitation Therapy Services Market, By Age Group, 2019-2028 (USD Million)
TABLE 482 IRELAND In-Patient Treatment in Rehabilitation Therapy Services Market, By Age Group, 2019-2028 (USD Million)
TABLE 483 IRELAND Adults in Rehabilitation Therapy Services Market, By Age Group, 2019-2028 (USD Million)
TABLE 484 IRELAND Out-Patient Treatment in Rehabilitation Therapy Services Market, By Age Group, 2019-2028 (USD Million)
TABLE 485 IRELAND In-Patient Treatment in Rehabilitation Therapy Services Market, By Age Group, 2019-2028 (USD Million)
TABLE 486 Ireland Rehabilitation Therapy Services Market, By Service Type, 2019-2028 (USD Million)
TABLE 487 IRELAND Outpatient Rehabilitation Services in Rehabilitation Therapy Services Market, By Service Type, 2019-2028 (USD Million)
TABLE 488 IRELAND In-Patient Rehabilitation Services in Rehabilitation Therapy Services Market, By Service Type, 2019-2028 (USD Million)
TABLE 489 IRELAND Rehabilitation Therapy Services Market, By Application, 2019-2028 (USD Million)
TABLE 490 IRELAND Neurological Rehabilitation Therapy Services in Rehabilitation Therapy Services Market, By Application, 2019-2028 (USD Million)
TABLE 491 IRELAND Pulmonary Rehabilitation Therapy Services in Rehabilitation Therapy Services Market, By Application, 2019-2028 (USD Million)
TABLE 492 IRELAND Cardiological Rehabilitation Therapy Services in Rehabilitation Therapy Services Market, By Application, 2019-2028 (USD Million)
TABLE 493 IRELAND Sports- Related Injuries in Rehabilitation Therapy Services Market, By Application, 2019-2028 (USD Million)
TABLE 494 iRELAND Pelvic Care in Rehabilitation Therapy Services Market, By Application, 2019-2028 (USD Million)
TABLE 495 IRELAND Orthopedic Rehabilitation Therapy Services in Rehabilitation Therapy Services Market, By Application, 2019-2028 (USD Million)
TABLE 496 Ireland Integumentary Rehabilitation Therapy Services in Rehabilitation Therapy Services Market, By Application, 2019-2028 (USD Million)
TABLE 497 Ireland Palliative Care in Rehabilitation Therapy Services Market, By Application, 2019-2028 (USD Million)
TABLE 498 Ireland Rehabilitation Therapy Services Market, By Service Category, 2019-2028 (USD Million)
TABLE 499 Ireland Rehabilitation Therapy Services Market, By Model, 2019-2028 (USD Million)
TABLE 500 Ireland Manual in Rehabilitation Therapy Services Market, By Model, 2019-2028 (USD Million)
TABLE 501 Ireland Conventional in Rehabilitation Therapy Services Market, By Model, 2019-2028 (USD Million)
TABLE 502 Ireland Rehabilitation Therapy Services Market, By End User, 2019-2028 (USD Million)
TABLE 503 Ireland Rehabilitation Therapy Services Market, By Service Channel, 2019-2028 (USD Million)
TABLE 504 BELGIUM Rehabilitation Therapy Services Market, By Service, 2019-2028 (USD Million)
TABLE 505 BELGIUM Rehabilitation Therapy in Rehabilitation Therapy Services Market, By Service, 2019-2028 (USD Million)
TABLE 506 BELGIUM Speech Therapy in Rehabilitation Therapy Services Market, By Service, 2019-2028 (USD Million)
TABLE 507 BELGIUM Rehabilitation Therapy Services Market, By Age Group, 2019-2028(USD Million)
TABLE 508 Belgium Elderly in Rehabilitation Therapy Services Market, By Age Group, 2019-2028 (USD Million)
TABLE 509 Belgium Out-Patient Treatment in Rehabilitation Therapy Services Market, By Age Group, 2019-2028 (USD Million)
TABLE 510 Belgium In-Patient Treatment in Rehabilitation Therapy Services Market, By Age Group, 2019-2028 (USD Million)
TABLE 511 BELGIUM Pediatrics in Rehabilitation Therapy Services Market, By Age Group, 2019-2028 (USD Million)
TABLE 512 BELGIUM Out-Patient Treatment in Rehabilitation Therapy Services Market, By Age Group, 2019-2028 (USD Million)
TABLE 513 BELGIUM In-Patient Treatment in Rehabilitation Therapy Services Market, By Age Group, 2019-2028 (USD Million)
TABLE 514 BELGIUM Adults in Rehabilitation Therapy Services Market, By Age Group, 2019-2028 (USD Million)
TABLE 515 BELGIUM Out-Patient Treatment in Rehabilitation Therapy Services Market, By Age Group, 2019-2028 (USD Million)
TABLE 516 BELGIUM In-Patient Treatment in Rehabilitation Therapy Services Market, By Age Group, 2019-2028 (USD Million)
TABLE 517 Belgium Rehabilitation Therapy Services Market, By Service Type, 2019-2028 (USD Million)
TABLE 518 BELGIUM Outpatient Rehabilitation Services in Rehabilitation Therapy Services Market, By Service Type, 2019-2028 (USD Million)
TABLE 519 BELGIUM In-Patient Rehabilitation Services in Rehabilitation Therapy Services Market, By Service Type, 2019-2028 (USD Million)
TABLE 520 BELGIUM Rehabilitation Therapy Services Market, By Application, 2019-2028 (USD Million)
TABLE 521 BELGIUM Neurological Rehabilitation Therapy Services in Rehabilitation Therapy Services Market, By Application, 2019-2028 (USD Million)
TABLE 522 BELGIUM Pulmonary Rehabilitation Therapy Services in Rehabilitation Therapy Services Market, By Application, 2019-2028 (USD Million)
TABLE 523 BELGIUM Cardiological Rehabilitation Therapy Services in Rehabilitation Therapy Services Market, By Application, 2019-2028 (USD Million)
TABLE 524 BELGIUM Sports- Related Injuries in Rehabilitation Therapy Services Market, By Application, 2019-2028 (USD Million)
TABLE 525 BELGIUM Pelvic Care in Rehabilitation Therapy Services Market, By Application, 2019-2028 (USD Million)
TABLE 526 BELGIUM Orthopedic Rehabilitation Therapy Services in Rehabilitation Therapy Services Market, By Application, 2019-2028 (USD Million)
TABLE 527 Belgium Integumentary Rehabilitation Therapy Services in Rehabilitation Therapy Services Market, By Application, 2019-2028 (USD Million)
TABLE 528 Belgium Palliative Care in Rehabilitation Therapy Services Market, By Application, 2019-2028 (USD Million)
TABLE 529 Belgium Rehabilitation Therapy Services Market, By Service Category, 2019-2028 (USD Million)
TABLE 530 Belgium Rehabilitation Therapy Services Market, By Model, 2019-2028 (USD Million)
TABLE 531 Belgium Manual in Rehabilitation Therapy Services Market, By Model, 2019-2028 (USD Million)
TABLE 532 Belgium Conventional in Rehabilitation Therapy Services Market, By Model, 2019-2028 (USD Million)
TABLE 533 Belgium Rehabilitation Therapy Services Market, By End User, 2019-2028 (USD Million)
TABLE 534 Belgium Rehabilitation Therapy Services Market, By Service Channel, 2019-2028 (USD Million)
TABLE 535 NETHERLANDS Rehabilitation Therapy Services Market, By Service, 2019-2028 (USD Million)
TABLE 536 NETHERLANDS Rehabilitation Therapy in Rehabilitation Therapy Services Market, By Service, 2019-2028 (USD Million)
TABLE 537 NETHERLANDS Speech Therapy in Rehabilitation Therapy Services Market, By Service, 2019-2028 (USD Million)
TABLE 538 NETHERLANDS Rehabilitation Therapy Services Market, By Age Group, 2019-2028(USD Million)
TABLE 539 Netherlands Elderly in Rehabilitation Therapy Services Market, By Age Group, 2019-2028 (USD Million)
TABLE 540 Netherlands Out-Patient Treatment in Rehabilitation Therapy Services Market, By Age Group, 2019-2028 (USD Million)
TABLE 541 Netherlands In-Patient Treatment in Rehabilitation Therapy Services Market, By Age Group, 2019-2028 (USD Million)
TABLE 542 NETHERLANDS Pediatrics in Rehabilitation Therapy Services Market, By Age Group, 2019-2028 (USD Million)
TABLE 543 NETHERLANDS Out-Patient Treatment in Rehabilitation Therapy Services Market, By Age Group, 2019-2028 (USD Million)
TABLE 544 NETHERLANDS In-Patient Treatment in Rehabilitation Therapy Services Market, By Age Group, 2019-2028 (USD Million)
TABLE 545 NETHERLANDS Adults in Rehabilitation Therapy Services Market, By Age Group, 2019-2028 (USD Million)
TABLE 546 NETHERLANDS Out-Patient Treatment in Rehabilitation Therapy Services Market, By Age Group, 2019-2028 (USD Million)
TABLE 547 NETHERLANDS In-Patient Treatment in Rehabilitation Therapy Services Market, By Age Group, 2019-2028 (USD Million)
TABLE 548 Netherlands Rehabilitation Therapy Services Market, By Service Type, 2019-2028 (USD Million)
TABLE 549 NETHERLANDS Outpatient Rehabilitation Services in Rehabilitation Therapy Services Market, By Service Type, 2019-2028 (USD Million)
TABLE 550 NETHERLANDS In-Patient Rehabilitation Services in Rehabilitation Therapy Services Market, By Service Type, 2019-2028 (USD Million)
TABLE 551 NETHERLANDS Rehabilitation Therapy Services Market, By Application, 2019-2028 (USD Million)
TABLE 552 NETHERLANDS Neurological Rehabilitation Therapy Services in Rehabilitation Therapy Services Market, By Application, 2019-2028 (USD Million)
TABLE 553 NETHERLANDS Pulmonary Rehabilitation Therapy Services in Rehabilitation Therapy Services Market, By Application, 2019-2028 (USD Million)
TABLE 554 NETHERLANDS Cardiological Rehabilitation Therapy Services in Rehabilitation Therapy Services Market, By Application, 2019-2028 (USD Million)
TABLE 555 NETHERLANDS Sports- Related Injuries in Rehabilitation Therapy Services Market, By Application, 2019-2028 (USD Million)
TABLE 556 NETHERLANDS Pelvic Care in Rehabilitation Therapy Services Market, By Application, 2019-2028 (USD Million)
TABLE 557 netherlands Orthopedic Rehabilitation Therapy Services in Rehabilitation Therapy Services Market, By Application, 2019-2028 (USD Million)
TABLE 558 netherlands Integumentary Rehabilitation Therapy Services in Rehabilitation Therapy Services Market, By Application, 2019-2028 (USD Million)
TABLE 559 netherlands Palliative Care in Rehabilitation Therapy Services Market, By Application, 2019-2028 (USD Million)
TABLE 560 netherlands Rehabilitation Therapy Services Market, By Service Category, 2019-2028 (USD Million)
TABLE 561 Netherlands Rehabilitation Therapy Services Market, By Model, 2019-2028 (USD Million)
TABLE 562 Netherlands Manual in Rehabilitation Therapy Services Market, By Model, 2019-2028 (USD Million)
TABLE 563 Netherlands Conventional in Rehabilitation Therapy Services Market, By Model, 2019-2028 (USD Million)
TABLE 564 Netherlands Rehabilitation Therapy Services Market, By End User, 2019-2028 (USD Million)
TABLE 565 Netherlands Rehabilitation Therapy Services Market, By Service Channel, 2019-2028 (USD Million)
TABLE 566 SWITZERLAND Rehabilitation Therapy Services Market, By Service, 2019-2028 (USD Million)
TABLE 567 SWITZERLAND Rehabilitation Therapy in Rehabilitation Therapy Services Market, By Service, 2019-2028 (USD Million)
TABLE 568 SWITZERLAND Speech Therapy in Rehabilitation Therapy Services Market, By Service, 2019-2028 (USD Million)
TABLE 569 SWITZERLAND Rehabilitation Therapy Services Market, By Age Group, 2019-2028(USD Million)
TABLE 570 Switzerland Elderly in Rehabilitation Therapy Services Market, By Age Group, 2019-2028 (USD Million)
TABLE 571 Switzerland Out-Patient Treatment in Rehabilitation Therapy Services Market, By Age Group, 2019-2028 (USD Million)
TABLE 572 Switzerland In-Patient Treatment in Rehabilitation Therapy Services Market, By Age Group, 2019-2028 (USD Million)
TABLE 573 SWITZERLAND Pediatrics in Rehabilitation Therapy Services Market, By Age Group, 2019-2028 (USD Million)
TABLE 574 SWITZERLAND Out-Patient Treatment in Rehabilitation Therapy Services Market, By Age Group, 2019-2028 (USD Million)
TABLE 575 SWITZERLAND In-Patient Treatment in Rehabilitation Therapy Services Market, By Age Group, 2019-2028 (USD Million)
TABLE 576 SWITZERLAND Adults in Rehabilitation Therapy Services Market, By Age Group, 2019-2028 (USD Million)
TABLE 577 SWITZERLAND Out-Patient Treatment in Rehabilitation Therapy Services Market, By Age Group, 2019-2028 (USD Million)
TABLE 578 SWITZERLAND In-Patient Treatment in Rehabilitation Therapy Services Market, By Age Group, 2019-2028 (USD Million)
TABLE 579 Switzerland Rehabilitation Therapy Services Market, By Service Type, 2019-2028 (USD Million)
TABLE 580 SWITZERLAND Outpatient Rehabilitation Services in Rehabilitation Therapy Services Market, By Service Type, 2019-2028 (USD Million)
TABLE 581 SWITZERLAND In-Patient Rehabilitation Services in Rehabilitation Therapy Services Market, By Service Type, 2019-2028 (USD Million)
TABLE 582 SWITZERLAND Rehabilitation Therapy Services Market, By Application, 2019-2028 (USD Million)
TABLE 583 SWITZERLAND Neurological Rehabilitation Therapy Services in Rehabilitation Therapy Services Market, By Application, 2019-2028 (USD Million)
TABLE 584 SWITZERLAND Pulmonary Rehabilitation Therapy Services in Rehabilitation Therapy Services Market, By Application, 2019-2028 (USD Million)
TABLE 585 SWITZERLAND Cardiological Rehabilitation Therapy Services in Rehabilitation Therapy Services Market, By Application, 2019-2028 (USD Million)
TABLE 586 SWITZERLAND Sports- Related Injuries in Rehabilitation Therapy Services Market, By Application, 2019-2028 (USD Million)
TABLE 587 SWITZERLAND Pelvic Care in Rehabilitation Therapy Services Market, By Application, 2019-2028 (USD Million)
TABLE 588 Switzerland Orthopedic Rehabilitation Therapy Services in Rehabilitation Therapy Services Market, By Application, 2019-2028 (USD Million)
TABLE 589 Switzerland Integumentary Rehabilitation Therapy Services in Rehabilitation Therapy Services Market, By Application, 2019-2028 (USD Million)
TABLE 590 Switzerland Palliative Care in Rehabilitation Therapy Services Market, By Application, 2019-2028 (USD Million)
TABLE 591 Switzerland Rehabilitation Therapy Services Market, By Service Category, 2019-2028 (USD Million)
TABLE 592 Switzerland Rehabilitation Therapy Services Market, By Model, 2019-2028 (USD Million)
TABLE 593 Switzerland Manual in Rehabilitation Therapy Services Market, By Model, 2019-2028 (USD Million)
TABLE 594 Switzerland Conventional in Rehabilitation Therapy Services Market, By Model, 2019-2028 (USD Million)
TABLE 595 Switzerland Rehabilitation Therapy Services Market, By End User, 2019-2028 (USD Million)
TABLE 596 Switzerland Rehabilitation Therapy Services Market, By Service Channel, 2019-2028 (USD Million)
TABLE 597 rest of europe Rehabilitation Therapy Services Market, By Service, 2019-2028 (USD Million)
TABLE 598 ASIA-PACIFIC REHABILITATION THERAPY SERVICES Market, By COUNTRY, 2019-2028 (USD million)
TABLE 599 ASIA-PACIFIC REHABILITATION THERAPY SERVICES Market, By SERVICE, 2019-2028 (USD Million)
TABLE 600 ASIA-PACIFIC REHABILITATION THERAPY in rehabilitation therapy SERVICES Market, By service, 2019-2028 (USD Million)
TABLE 601 ASIA-PACIFIC SPEECH THERAPY IN REHABILITATION THERAPY SERVICES Market, By SERVICE, 2019-2028 (Units)
TABLE 602 ASIA-PACIFIC in REHABILITATION THERAPY SERVICES Market, By AGE GROUP, 2019-2028 (USD Million)
TABLE 603 ASIA-PACIFIC ELDERLY in REHABILITATION THERAPY SERVICES Market, By AGE GROUP, 2019-2028 (USD Million)
TABLE 604 ASIA-PACIFIC OUT-PATIENT TREATMENT IN REHABILITATION THERAPY SERVICES MARKET, By AGE GROUP , 2019-2028 (USD Million)
TABLE 605 ASIA-PACIFIC IN-PATIENT TREATMENT IN REHABILITATION THERAPY SERVICES MARKET, By AGE GROUP, 2019-2028 (USD Million)
TABLE 606 ASIA-PACIFIC PEDIATRICS IN REHABILITATION THERAPY SERVICES MARKET, By AGE GROUP, 2019-2028 (USD Million)
TABLE 607 ASIA-PACIFIC OUT-PATIENT TREATMENT IN REHABILITATION THERAPY SERVICES MARKET, By age group, 2019-2028 (USD Million)
TABLE 608 ASIA-PACIFIC IN-PATIENT TREATMENT IN REHABILITATION THERAPY SERVICES MARKET, By AGE GROUP, 2019-2028 (USD Million)
TABLE 609 ASIA-PACIFIC ADULTS IN REHABILITATION THERAPY SERVICES MARKET, BY AGE GROUP, 2019-2028 (USD Million)
TABLE 610 ASIA-PACIFIC OUT-PATIENT TREATMENT IN REHABILITATION THERAPY SERVICES MARKET, By age group, 2019-2028 (USD Million)
TABLE 611 ASIA-PACIFIC IN-PATIENT TREATMENT IN REHABILITATION THERAPY SERVICES MARKET, By AGE GROUP, 2019-2028 (USD Million)
TABLE 612 ASIA-PACIFIC REHABILITATION THERAPY SERVICES Market, By service type, 2019-2028 (USD Million)
TABLE 613 ASIA-PACIFIC out patient REHABILITATION THERAPY SERVICES in rehabilitation therapy services Market, By service type, 2019-2028 (USD Million)
TABLE 614 ASIA-PACIFIC in- patient REHABILITATION THERAPY SERVICES Market, By service type, 2019-2028 (USD Million)
TABLE 615 ASIA-PACIFIC REHABILITATION THERAPY SERVICES Market, By application, 2019-2028 (USD Million)
TABLE 616 ASIA-PACIFIC NEUROLOGICAL REHABILITATION THERAPY SERVICES Market, By APPLICATION, 2019-2028 (USD Million)
TABLE 617 ASIA-PACIFIC PULMONARY REHABILITATION THERAPY SERVICES Market, By APPLICATION, 2019-2028 (USD Million)
TABLE 618 ASIA-PACIFIC CARDIOLOGICAL REHABILITATION THERAPY SERVICES Market, By APPLICATION, 2019-2028 (USD Million)
TABLE 619 ASIA-PACIFIC SPORTS RELATED INJURIES IN REHABILITATION THERAPY SERVICES Market, By APPLICATION, 2019-2028 (USD Million)
TABLE 620 ASIA-PACIFIC PELVIC CARE IN REHABILITATION THERAPY SERVICES Market, By APPLICATION, 2019-2028 (USD Million)
TABLE 621 ASIA-PACIFIC ORTHOPEDIC REHABILITATION THERAPY SERVICES IN REHABILITATION THERAPY SERVICES MARKET, By APPLICATION, 2019-2028 (USD Million)
TABLE 622 ASIA-PACIFIC INTEGUMENTARY REHABILITATION THERAPY SERVICES IN REHABILITATION THERAPY SERVICES Market, By APPLICATION, 2019-2028 (USD Million)
TABLE 623 ASIA-PACIFIC PALLIATIVE CARE IN REHABILITATION THERAPY SERVICES Market, By APPLICATION, 2019-2028 (USD Million)
TABLE 624 ASIA-PACIFIC REHABILITATION THERAPY SERVICES Market, By SERVICE CATEGORY, 2019-2028 (USD Million)
TABLE 625 ASIA-PACIFIC REHABILITATION THERAPY SERVICES Market, By model, 2019-2028 (USD Million)
TABLE 626 ASIA-PACIFIC MANUAL IN REHABILITATION THERAPY SERVICES Market, By model, 2019-2028 (USD Million)
TABLE 627 ASIA-PACIFIC CONVENTIONAL IN REHABILITATION THERAPY SERVICES Market, By model, 2019-2028 (USD Million)
TABLE 628 ASIA-PACIFIC REHABILITATION THERAPY SERVICES Market, By END USER, 2019-2028 (USD Million)
TABLE 629 ASIA-PACIFIC REHABILITATION THERAPY SERVICES Market, By SERVICE CHANNEL, 2019-2028 (USD Million)
TABLE 630 CHINA REHABILITATION THERAPY SERVICES Market, By SERVICE, 2019-2028 (USD Million)
TABLE 631 CHINA REHABILITATION THERAPY in rehabilitation therapy SERVICES Market, By service, 2019-2028 (USD Million)
TABLE 632 CHINA SPEECH THERAPY IN REHABILITATION THERAPY SERVICES Market, By SERVICE, 2019-2028 (Units)
TABLE 633 CHINA REHABILITATION THERAPY SERVICES Market, By AGE GROUP, 2019-2028 (USD Million)
TABLE 634 CHINAELDERLY in REHABILITATION THERAPY SERVICES Market, By AGE GROUP, 2019-2028 (USD Million)
TABLE 635 CHINA OUT-PATIENT TREATMENT IN REHABILITATION THERAPY SERVICES MARKET, By AGE GROUP , 2019-2028 (USD Million)
TABLE 636 CHINA IN-PATIENT TREATMENT IN REHABILITATION THERAPY SERVICES MARKET, By AGE GROUP, 2019-2028 (USD Million)
TABLE 637 CHINA PEDIATRICS IN REHABILITATION THERAPY SERVICES MARKET, By AGE GROUP, 2019-2028 (USD Million)
TABLE 638 CHINA OUT-PATIENT TREATMENT IN REHABILITATION THERAPY SERVICES MARKET, By age group, 2019-2028 (USD Million)
TABLE 639 CHINA IN-PATIENT TREATMENT IN REHABILITATION THERAPY SERVICES MARKET, By AGE GROUP, 2019-2028 (USD Million)
TABLE 640 CHINA ADULTS IN REHABILITATION THERAPY SERVICES MARKET, BY AGE GROUP, 2019-2028 (USD Million)
TABLE 641 CHINA OUT-PATIENT TREATMENT IN REHABILITATION THERAPY SERVICES MARKET, By age group, 2019-2028 (USD Million)
TABLE 642 CHINA IN-PATIENT TREATMENT IN REHABILITATION THERAPY SERVICES MARKET, By AGE GROUP, 2019-2028 (USD Million)
TABLE 643 CHINA REHABILITATION THERAPY SERVICES Market, By service type, 2019-2028 (USD Million)
TABLE 644 CHINA out patient REHABILITATION THERAPY SERVICES Market, By service type, 2019-2028 (USD Million)
TABLE 645 CHINA IN-patient REHABILITATION THERAPY SERVICES Market, By service type, 2019-2028 (USD Million)
TABLE 646 CHINA REHABILITATION THERAPY SERVICES Market, By application, 2019-2028 (USD Million)
TABLE 647 CHINA NEUROLOGICAL REHABILITATION THERAPY SERVICES Market, By APPLICATION, 2019-2028 (USD Million)
TABLE 648 CHINA PULMONARY REHABILITATION THERAPY SERVICES Market, By APPLICATION, 2019-2028 (USD Million)
TABLE 649 CHINA CARDIOLOGICAL REHABILITATION THERAPY SERVICES Market, By APPLICATION, 2019-2028 (USD Million)
TABLE 650 CHINA SPORTS RELATED INJURIES IN REHABILITATION THERAPY SERVICES Market, By APPLICATION, 2019-2028 (USD Million)
TABLE 651 CHINA PELVIC CARE IN REHABILITATION THERAPY SERVICES Market, By APPLICATION, 2019-2028 (USD Million)
TABLE 652 CHINA ORTHOPEDIC REHABILITATION THERAPY SERVICES IN REHABILITATION THERAPY SERVICES MARKET, By APPLICATION, 2019-2028 (USD Million)
TABLE 653 CHINA INTEGUMENTARY REHABILITATION THERAPY SERVICES IN REHABILITATION THERAPY SERVICES Market, By APPLICATION, 2019-2028 (USD Million)
TABLE 654 CHINA PALLIATIVE CARE IN REHABILITATION THERAPY SERVICES Market, By APPLICATION, 2019-2028 (USD Million)
TABLE 655 CHINA REHABILITATION THERAPY SERVICES Market, By SERVICE CATEGORY, 2019-2028 (USD Million)
TABLE 656 CHINA REHABILITATION THERAPY SERVICES Market, By model, 2019-2028 (USD Million)
TABLE 657 CHINAMANUAL IN REHABILITATION THERAPY SERVICES Market, By model, 2019-2028 (USD Million)
TABLE 658 CHINA CONVENTIONAL IN REHABILITATION THERAPY SERVICES Market, By model, 2019-2028 (USD Million)
TABLE 659 CHINA REHABILITATION THERAPY SERVICES Market, By END USER, 2019-2028 (USD Million)
TABLE 660 CHINA REHABILITATION THERAPY SERVICES Market, By SERVICE CHANNEL, 2019-2028 (USD Million)
TABLE 661 JAPAN REHABILITATION THERAPY SERVICES Market, By SERVICE, 2019-2028 (USD Million)
TABLE 662 JAPAN REHABILITATION THERAPY in rehabilitation therapy SERVICES Market, By service, 2019-2028 (USD Million)
TABLE 663 JAPAN SPEECH THERAPY IN REHABILITATION THERAPY SERVICES Market, By SERVICE, 2019-2028 (Units)
TABLE 664 JAPAN REHABILITATION THERAPY SERVICES Market, By AGE GROUP, 2019-2028 (USD Million)
TABLE 665 JAPAN ELDERLY in REHABILITATION THERAPY SERVICES Market, By AGE GROUP, 2019-2028 (USD Million)
TABLE 666 JAPAN OUT-PATIENT TREATMENT IN REHABILITATION THERAPY SERVICES MARKET, By AGE GROUP , 2019-2028 (USD Million)
TABLE 667 JAPAN IN-PATIENT TREATMENT IN REHABILITATION THERAPY SERVICES MARKET, By AGE GROUP, 2019-2028 (USD Million)
TABLE 668 JAPAN PEDIATRICS IN REHABILITATION THERAPY SERVICES MARKET, By AGE GROUP, 2019-2028 (USD Million)
TABLE 669 JAPAN OUT-PATIENT TREATMENT IN REHABILITATION THERAPY SERVICES MARKET, By age group, 2019-2028 (USD Million)
TABLE 670 JAPAN IN-PATIENT TREATMENT IN REHABILITATION THERAPY SERVICES MARKET, By AGE GROUP, 2019-2028 (USD Million)
TABLE 671 JAPAN ADULTS IN REHABILITATION THERAPY SERVICES MARKET, BY AGE GROUP, 2019-2028 (USD Million)
TABLE 672 JAPAN OUT-PATIENT TREATMENT IN REHABILITATION THERAPY SERVICES MARKET, By age group, 2019-2028 (USD Million)
TABLE 673 JAPAN IN-PATIENT TREATMENT IN REHABILITATION THERAPY SERVICES MARKET, By AGE GROUP, 2019-2028 (USD Million)
TABLE 674 JAPAN REHABILITATION THERAPY SERVICES Market, By service type, 2019-2028 (USD Million)
TABLE 675 JAPAN out patient REHABILITATION THERAPY SERVICES Market, By service type, 2019-2028 (USD Million)
TABLE 676 JAPAN IN-patient REHABILITATION THERAPY SERVICES Market, By service type, 2019-2028 (USD Million)
TABLE 677 JAPAN REHABILITATION THERAPY SERVICES Market, By application, 2019-2028 (USD Million)
TABLE 678 JAPAN NEUROLOGICAL REHABILITATION THERAPY SERVICES Market, By APPLICATION, 2019-2028 (USD Million)
TABLE 679 JAPAN PULMONARY REHABILITATION THERAPY SERVICES Market, By APPLICATION, 2019-2028 (USD Million)
TABLE 680 JAPAN CARDIOLOGICAL REHABILITATION THERAPY SERVICES Market, By APPLICATION, 2019-2028 (USD Million)
TABLE 681 JAPAN SPORTS RELATED INJURIES IN REHABILITATION THERAPY SERVICES Market, By APPLICATION, 2019-2028 (USD Million)
TABLE 682 JAPAN PELVIC CARE IN REHABILITATION THERAPY SERVICES Market, By APPLICATION, 2019-2028 (USD Million)
TABLE 683 JAPAN ORTHOPEDIC REHABILITATION THERAPY SERVICES IN REHABILITATION THERAPY SERVICES MARKET, By APPLICATION, 2019-2028 (USD Million)
TABLE 684 JAPAN INTEGUMENTARY REHABILITATION THERAPY SERVICES IN REHABILITATION THERAPY SERVICES Market, By APPLICATION, 2019-2028 (USD Million)
TABLE 685 JAPAN PALLIATIVE CARE IN REHABILITATION THERAPY SERVICES Market, By APPLICATION, 2019-2028 (USD Million)
TABLE 686 JAPAN REHABILITATION THERAPY SERVICES Market, By SERVICE CATEGORY, 2019-2028 (USD Million)
TABLE 687 JAPAN REHABILITATION THERAPY SERVICES Market, By model, 2019-2028 (USD Million)
TABLE 688 JAPAN MANUAL IN REHABILITATION THERAPY SERVICES Market, By model, 2019-2028 (USD Million)
TABLE 689 JAPAN CONVENTIONAL IN REHABILITATION THERAPY SERVICES Market, By model, 2019-2028 (USD Million)
TABLE 690 JAPAN REHABILITATION THERAPY SERVICES Market, By END USER, 2019-2028 (USD Million)
TABLE 691 JAPAN REHABILITATION THERAPY SERVICES Market, By SERVICE CHANNEL, 2019-2028 (USD Million)
TABLE 692 SOUTH KOREA REHABILITATION THERAPY SERVICES Market, By SERVICE, 2019-2028 (USD Million)
TABLE 693 SOUTH KOREA REHABILITATION THERAPY in rehabilitation therapy SERVICES Market, By service, 2019-2028 (USD Million)
TABLE 694 SOUTH KOREA SPEECH THERAPY IN REHABILITATION THERAPY SERVICES Market, By SERVICE, 2019-2028 (Units)
TABLE 695 SOUTH KOREA REHABILITATION THERAPY SERVICES Market, By AGE GROUP, 2019-2028 (USD Million)
TABLE 696 SOUTH KOREA ELDERLY in REHABILITATION THERAPY SERVICES Market, By AGE GROUP, 2019-2028 (USD Million)
TABLE 697 SOUTH KOREA OUT-PATIENT TREATMENT IN REHABILITATION THERAPY SERVICES MARKET, By AGE GROUP , 2019-2028 (USD Million)
TABLE 698 SOUTH KOREA IN-PATIENT TREATMENT IN REHABILITATION THERAPY SERVICES MARKET, By AGE GROUP, 2019-2028 (USD Million)
TABLE 699 SOUTH KOREA PEDIATRICS IN REHABILITATION THERAPY SERVICES MARKET, By AGE GROUP, 2019-2028 (USD Million)
TABLE 700 SOUTH KOREA OUT-PATIENT TREATMENT IN REHABILITATION THERAPY SERVICES MARKET, By age group, 2019-2028 (USD Million)
TABLE 701 SOUTH KOREA IN-PATIENT TREATMENT IN REHABILITATION THERAPY SERVICES MARKET, By AGE GROUP, 2019-2028 (USD Million)
TABLE 702 sOUTH KOREA ADULTS IN REHABILITATION THERAPY SERVICES MARKET, BY AGE GROUP, 2019-2028 (USD Million)
TABLE 703 SOUTH KOREA OUT-PATIENT TREATMENT IN REHABILITATION THERAPY SERVICES MARKET, By age group, 2019-2028 (USD Million)
TABLE 704 SOUTH KOREA IN-PATIENT TREATMENT IN REHABILITATION THERAPY SERVICES MARKET, By AGE GROUP, 2019-2028 (USD Million)
TABLE 705 SOUTH KOREA REHABILITATION THERAPY SERVICES Market, By service type, 2019-2028 (USD Million)
TABLE 706 SOUTH KOREA out patient REHABILITATION THERAPY SERVICES Market, By service type, 2019-2028 (USD Million)
TABLE 707 SOUTH KOREA IN-patient REHABILITATION THERAPY SERVICES Market, By service type, 2019-2028 (USD Million)
TABLE 708 SOUTH KOREA REHABILITATION THERAPY SERVICES Market, By application, 2019-2028 (USD Million)
TABLE 709 SOUTH KOREA NEUROLOGICAL REHABILITATION THERAPY SERVICES Market, By APPLICATION, 2019-2028 (USD Million)
TABLE 710 SOUTH KOREA PULMONARY REHABILITATION THERAPY SERVICES Market, By APPLICATION, 2019-2028 (USD Million)
TABLE 711 SOUTH KOREA CARDIOLOGICAL REHABILITATION THERAPY SERVICES Market, By APPLICATION, 2019-2028 (USD Million)
TABLE 712 SOUTH KOREA SPORTS RELATED INJURIES IN REHABILITATION THERAPY SERVICES Market, By APPLICATION, 2019-2028 (USD Million)
TABLE 713 SOUTH KOREA PELVIC CARE IN REHABILITATION THERAPY SERVICES Market, By APPLICATION, 2019-2028 (USD Million)
TABLE 714 SOUTH KOREA ORTHOPEDIC REHABILITATION THERAPY SERVICES IN REHABILITATION THERAPY SERVICES MARKET, By APPLICATION, 2019-2028 (USD Million)
TABLE 715 SOUTH KOREA INTEGUMENTARY REHABILITATION THERAPY SERVICES IN REHABILITATION THERAPY SERVICES Market, By APPLICATION, 2019-2028 (USD Million)
TABLE 716 SOUTH KOREA PALLIATIVE CARE IN REHABILITATION THERAPY SERVICES Market, By APPLICATION, 2019-2028 (USD Million)
TABLE 717 SOUTH KOREA REHABILITATION THERAPY SERVICES Market, By SERVICE CATEGORY, 2019-2028 (USD Million)
TABLE 718 SOUTH KOREA REHABILITATION THERAPY SERVICES Market, By model, 2019-2028 (USD Million)
TABLE 719 SOUTH KOREA MANUAL IN REHABILITATION THERAPY SERVICES Market, By model, 2019-2028 (USD Million)
TABLE 720 SOUTH KOREA CONVENTIONAL IN REHABILITATION THERAPY SERVICES Market, By model, 2019-2028 (USD Million)
TABLE 721 SOUTH KOREA REHABILITATION THERAPY SERVICES Market, By END USER, 2019-2028 (USD Million)
TABLE 722 SOUTH KOREA REHABILITATION THERAPY SERVICES Market, By SERVICE CHANNEL, 2019-2028 (USD Million)
TABLE 723 INDIA REHABILITATION THERAPY SERVICES Market, By SERVICE, 2019-2028 (USD Million)
TABLE 724 INDIA REHABILITATION THERAPY in rehabilitation therapy SERVICES Market, By service, 2019-2028 (USD Million)
TABLE 725 INDIA SPEECH THERAPY IN REHABILITATION THERAPY SERVICES Market, By SERVICE, 2019-2028 (Units)
TABLE 726 INDIA REHABILITATION THERAPY SERVICES Market, By AGE GROUP, 2019-2028 (USD Million)
TABLE 727 INDIAELDERLY in REHABILITATION THERAPY SERVICES Market, By AGE GROUP, 2019-2028 (USD Million)
TABLE 728 INDIA OUT-PATIENT TREATMENT IN REHABILITATION THERAPY SERVICES MARKET, By AGE GROUP , 2019-2028 (USD Million)
TABLE 729 INDIA IN-PATIENT TREATMENT IN REHABILITATION THERAPY SERVICES MARKET, By AGE GROUP, 2019-2028 (USD Million)
TABLE 730 INDIA PEDIATRICS IN REHABILITATION THERAPY SERVICES MARKET, By AGE GROUP, 2019-2028 (USD Million)
TABLE 731 INDIA OUT-PATIENT TREATMENT IN REHABILITATION THERAPY SERVICES MARKET, By age group, 2019-2028 (USD Million)
TABLE 732 INDIA IN-PATIENT TREATMENT IN REHABILITATION THERAPY SERVICES MARKET, By AGE GROUP, 2019-2028 (USD Million)
TABLE 733 INDIA ADULTS IN REHABILITATION THERAPY SERVICES MARKET, BY AGE GROUP, 2019-2028 (USD Million)
TABLE 734 INDIA OUT-PATIENT TREATMENT IN REHABILITATION THERAPY SERVICES MARKET, By age group, 2019-2028 (USD Million)
TABLE 735 INDIA IN-PATIENT TREATMENT IN REHABILITATION THERAPY SERVICES MARKET, By AGE GROUP, 2019-2028 (USD Million)
TABLE 736 INDIA REHABILITATION THERAPY SERVICES Market, By service type, 2019-2028 (USD Million)
TABLE 737 INDIA out patient REHABILITATION THERAPY SERVICES Market, By service type, 2019-2028 (USD Million)
TABLE 738 INDIA IN-patient REHABILITATION THERAPY SERVICES Market, By service type, 2019-2028 (USD Million)
TABLE 739 INDIA REHABILITATION THERAPY SERVICES Market, By application, 2019-2028 (USD Million)
TABLE 740 INDIA NEUROLOGICAL REHABILITATION THERAPY SERVICES Market, By APPLICATION, 2019-2028 (USD Million)
TABLE 741 INDIA PULMONARY REHABILITATION THERAPY SERVICES Market, By APPLICATION, 2019-2028 (USD Million)
TABLE 742 INDIA CARDIOLOGICAL REHABILITATION THERAPY SERVICES Market, By APPLICATION, 2019-2028 (USD Million)
TABLE 743 INDIA SPORTS RELATED INJURIES IN REHABILITATION THERAPY SERVICES Market, By APPLICATION, 2019-2028 (USD Million)
TABLE 744 INDIA PELVIC CARE IN REHABILITATION THERAPY SERVICES Market, By APPLICATION, 2019-2028 (USD Million)
TABLE 745 INDIA ORTHOPEDIC REHABILITATION THERAPY SERVICES IN REHABILITATION THERAPY SERVICES MARKET, By APPLICATION, 2019-2028 (USD Million)
TABLE 746 INDIAINTEGUMENTARY REHABILITATION THERAPY SERVICES IN REHABILITATION THERAPY SERVICES Market, By APPLICATION, 2019-2028 (USD Million)
TABLE 747 INDIA PALLIATIVE CARE IN REHABILITATION THERAPY SERVICES Market, By APPLICATION, 2019-2028 (USD Million)
TABLE 748 INDIA REHABILITATION THERAPY SERVICES Market, By SERVICE CATEGORY, 2019-2028 (USD Million)
TABLE 749 INDIA REHABILITATION THERAPY SERVICES Market, By model, 2019-2028 (USD Million)
TABLE 750 INDIA MANUAL IN REHABILITATION THERAPY SERVICES Market, By model, 2019-2028 (USD Million)
TABLE 751 INDIA CONVENTIONAL IN REHABILITATION THERAPY SERVICES Market, By model, 2019-2028 (USD Million)
TABLE 752 INDIA REHABILITATION THERAPY SERVICES Market, By END USER, 2019-2028 (USD Million)
TABLE 753 INDIA REHABILITATION THERAPY SERVICES Market, By SERVICE CHANNEL, 2019-2028 (USD Million)
TABLE 754 AUSTRALIA REHABILITATION THERAPY SERVICES Market, By SERVICE, 2019-2028 (USD Million)
TABLE 755 AUSTRALIA REHABILITATION THERAPY in rehabilitation therapy SERVICES Market, By service, 2019-2028 (USD Million)
TABLE 756 AUSTRALIA SPEECH THERAPY IN REHABILITATION THERAPY SERVICES Market, By SERVICE, 2019-2028 (Units)
TABLE 757 AUSTRALIA REHABILITATION THERAPY SERVICES Market, By AGE GROUP, 2019-2028 (USD Million)
TABLE 758 AUSTRALIA ELDERLY in REHABILITATION THERAPY SERVICES Market, By AGE GROUP, 2019-2028 (USD Million)
TABLE 759 AUSTRALIA OUT-PATIENT TREATMENT IN REHABILITATION THERAPY SERVICES MARKET, By AGE GROUP , 2019-2028 (USD Million)
TABLE 760 AUSTRALIA IN-PATIENT TREATMENT IN REHABILITATION THERAPY SERVICES MARKET, By AGE GROUP, 2019-2028 (USD Million)
TABLE 761 AUSTRALIA PEDIATRICS IN REHABILITATION THERAPY SERVICES MARKET, By AGE GROUP, 2019-2028 (USD Million)
TABLE 762 AUSTRALIA OUT-PATIENT TREATMENT IN REHABILITATION THERAPY SERVICES MARKET, By age group, 2019-2028 (USD Million)
TABLE 763 AUSTRALIA IN-PATIENT TREATMENT IN REHABILITATION THERAPY SERVICES MARKET, By AGE GROUP, 2019-2028 (USD Million)
TABLE 764 AUSTRALIA ADULTS IN REHABILITATION THERAPY SERVICES MARKET, BY AGE GROUP, 2019-2028 (USD Million)
TABLE 765 AUSTRALIA OUT-PATIENT TREATMENT IN REHABILITATION THERAPY SERVICES MARKET, By age group, 2019-2028 (USD Million)
TABLE 766 AUSTRALIA IN-PATIENT TREATMENT IN REHABILITATION THERAPY SERVICES MARKET, By AGE GROUP, 2019-2028 (USD Million)
TABLE 767 AUSTRALIA REHABILITATION THERAPY SERVICES Market, By service type, 2019-2028 (USD Million)
TABLE 768 AUSTRALIA out patient REHABILITATION THERAPY SERVICES Market, By service type, 2019-2028 (USD Million)
TABLE 769 AUSTRALIA IN-patient REHABILITATION THERAPY SERVICES Market, By service type, 2019-2028 (USD Million)
TABLE 770 AUSTRALIA REHABILITATION THERAPY SERVICES Market, By application, 2019-2028 (USD Million)
TABLE 771 AUSTRALIA NEUROLOGICAL REHABILITATION THERAPY SERVICES Market, By APPLICATION, 2019-2028 (USD Million)
TABLE 772 AUSTRALIA PULMONARY REHABILITATION THERAPY SERVICES Market, By APPLICATION, 2019-2028 (USD Million)
TABLE 773 AUSTRALIA CARDIOLOGICAL REHABILITATION THERAPY SERVICES Market, By APPLICATION, 2019-2028 (USD Million)
TABLE 774 AUSTRALIA SPORTS RELATED INJURIES IN REHABILITATION THERAPY SERVICES Market, By APPLICATION, 2019-2028 (USD Million)
TABLE 775 AUSTRALIA PELVIC CARE IN REHABILITATION THERAPY SERVICES Market, By APPLICATION, 2019-2028 (USD Million)
TABLE 776 AUSTRALIA ORTHOPEDIC REHABILITATION THERAPY SERVICES IN REHABILITATION THERAPY SERVICES MARKET, By APPLICATION, 2019-2028 (USD Million)
TABLE 777 AUSTRALIA INTEGUMENTARY REHABILITATION THERAPY SERVICES IN REHABILITATION THERAPY SERVICES Market, By APPLICATION, 2019-2028 (USD Million)
TABLE 778 AUSTRALIA PALLIATIVE CARE IN REHABILITATION THERAPY SERVICES Market, By APPLICATION, 2019-2028 (USD Million)
TABLE 779 AUSTRALIA REHABILITATION THERAPY SERVICES Market, By SERVICE CATEGORY, 2019-2028 (USD Million)
TABLE 780 AUSTRALIA REHABILITATION THERAPY SERVICES Market, By model, 2019-2028 (USD Million)
TABLE 781 AUSTRALIA MANUAL IN REHABILITATION THERAPY SERVICES Market, By model, 2019-2028 (USD Million)
TABLE 782 AUSTRALIA CONVENTIONAL IN REHABILITATION THERAPY SERVICES Market, By model, 2019-2028 (USD Million)
TABLE 783 AUSTRALIA REHABILITATION THERAPY SERVICES Market, By END USER, 2019-2028 (USD Million)
TABLE 784 AUSTRALIA REHABILITATION THERAPY SERVICES Market, By SERVICE CHANNEL, 2019-2028 (USD Million)
TABLE 785 SINGAPORE REHABILITATION THERAPY SERVICES Market, By SERVICE, 2019-2028 (USD Million)
TABLE 786 SINGAPORE REHABILITATION THERAPY in rehabilitation therapy SERVICES Market, By service, 2019-2028 (USD Million)
TABLE 787 SINGAPORE SPEECH THERAPY IN REHABILITATION THERAPY SERVICES Market, By SERVICE, 2019-2028 (Units)
TABLE 788 SINGAPORE REHABILITATION THERAPY SERVICES Market, By AGE GROUP, 2019-2028 (USD Million)
TABLE 789 SINGAPORE ELDERLY in REHABILITATION THERAPY SERVICES Market, By AGE GROUP, 2019-2028 (USD Million)
TABLE 790 SINGAPORE OUT-PATIENT TREATMENT IN REHABILITATION THERAPY SERVICES MARKET, By AGE GROUP , 2019-2028 (USD Million)
TABLE 791 SINGAPORE IN-PATIENT TREATMENT IN REHABILITATION THERAPY SERVICES MARKET, By AGE GROUP, 2019-2028 (USD Million)
TABLE 792 SINGAPORE PEDIATRICS IN REHABILITATION THERAPY SERVICES MARKET, By AGE GROUP, 2019-2028 (USD Million)
TABLE 793 SINGAPORE OUT-PATIENT TREATMENT IN REHABILITATION THERAPY SERVICES MARKET, By age group, 2019-2028 (USD Million)
TABLE 794 SINGAPORE IN-PATIENT TREATMENT IN REHABILITATION THERAPY SERVICES MARKET, By AGE GROUP, 2019-2028 (USD Million)
TABLE 795 SINGAPORE ADULTS IN REHABILITATION THERAPY SERVICES MARKET, BY AGE GROUP, 2019-2028 (USD Million)
TABLE 796 SINGAPORE OUT-PATIENT TREATMENT IN REHABILITATION THERAPY SERVICES MARKET, By age group, 2019-2028 (USD Million)
TABLE 797 SINGAPORE IN-PATIENT TREATMENT IN REHABILITATION THERAPY SERVICES MARKET, By AGE GROUP, 2019-2028 (USD Million)
TABLE 798 SINGAPORE REHABILITATION THERAPY SERVICES Market, By service type, 2019-2028 (USD Million)
TABLE 799 SINGAPORE out patient REHABILITATION THERAPY SERVICES Market, By service type, 2019-2028 (USD Million)
TABLE 800 SINGAPORE IN-patient REHABILITATION THERAPY SERVICES Market, By service type, 2019-2028 (USD Million)
TABLE 801 SINGAPORE REHABILITATION THERAPY SERVICES Market, By application, 2019-2028 (USD Million)
TABLE 802 SINGAPORE NEUROLOGICAL REHABILITATION THERAPY SERVICES Market, By APPLICATION, 2019-2028 (USD Million)
TABLE 803 SINGAPORE PULMONARY REHABILITATION THERAPY SERVICES Market, By APPLICATION, 2019-2028 (USD Million)
TABLE 804 SINGAPORE CARDIOLOGICAL REHABILITATION THERAPY SERVICES Market, By APPLICATION, 2019-2028 (USD Million)
TABLE 805 SINGAPORE SPORTS RELATED INJURIES IN REHABILITATION THERAPY SERVICES Market, By APPLICATION, 2019-2028 (USD Million)
TABLE 806 SINGAPORE PELVIC CARE IN REHABILITATION THERAPY SERVICES Market, By APPLICATION, 2019-2028 (USD Million)
TABLE 807 SINGAPORE ORTHOPEDIC REHABILITATION THERAPY SERVICES IN REHABILITATION THERAPY SERVICES MARKET, By APPLICATION, 2019-2028 (USD Million)
TABLE 808 SINGAPORE INTEGUMENTARY REHABILITATION THERAPY SERVICES IN REHABILITATION THERAPY SERVICES Market, By APPLICATION, 2019-2028 (USD Million)
TABLE 809 SINGAPORE PALLIATIVE CARE IN REHABILITATION THERAPY SERVICES Market, By APPLICATION, 2019-2028 (USD Million)
TABLE 810 SINGAPORE REHABILITATION THERAPY SERVICES Market, By SERVICE CATEGORY, 2019-2028 (USD Million)
TABLE 811 SINGAPORE REHABILITATION THERAPY SERVICES Market, By model, 2019-2028 (USD Million)
TABLE 812 SINGAPORE MANUAL IN REHABILITATION THERAPY SERVICES Market, By model, 2019-2028 (USD Million)
TABLE 813 SINGAPORE CONVENTIONAL IN REHABILITATION THERAPY SERVICES Market, By model, 2019-2028 (USD Million)
TABLE 814 SINGAPORE REHABILITATION THERAPY SERVICES Market, By END USER, 2019-2028 (USD Million)
TABLE 815 SINGAPORE REHABILITATION THERAPY SERVICES Market, By SERVICE CHANNEL, 2019-2028 (USD Million)
TABLE 816 THAILAND REHABILITATION THERAPY SERVICES Market, By SERVICE, 2019-2028 (USD Million)
TABLE 817 THAILAND REHABILITATION THERAPY in rehabilitation therapy SERVICES Market, By service, 2019-2028 (USD Million)
TABLE 818 thailand SPEECH THERAPY IN REHABILITATION THERAPY SERVICES Market, By SERVICE, 2019-2028 (Units)
TABLE 819 THAILAND REHABILITATION THERAPY SERVICES Market, By AGE GROUP, 2019-2028 (USD Million)
TABLE 820 THAILAND ELDERLY in REHABILITATION THERAPY SERVICES Market, By AGE GROUP, 2019-2028 (USD Million)
TABLE 821 THAILAND OUT-PATIENT TREATMENT IN REHABILITATION THERAPY SERVICES MARKET, By AGE GROUP , 2019-2028 (USD Million)
TABLE 822 THAILAND IN-PATIENT TREATMENT IN REHABILITATION THERAPY SERVICES MARKET, By AGE GROUP, 2019-2028 (USD Million)
TABLE 823 THAILAND PEDIATRICS IN REHABILITATION THERAPY SERVICES MARKET, By AGE GROUP, 2019-2028 (USD Million)
TABLE 824 THAILAND OUT-PATIENT TREATMENT IN REHABILITATION THERAPY SERVICES MARKET, By age group, 2019-2028 (USD Million)
TABLE 825 THAILAND IN-PATIENT TREATMENT IN REHABILITATION THERAPY SERVICES MARKET, By AGE GROUP, 2019-2028 (USD Million)
TABLE 826 THAILAND ADULTS IN REHABILITATION THERAPY SERVICES MARKET, BY AGE GROUP, 2019-2028 (USD Million)
TABLE 827 THAILAND OUT-PATIENT TREATMENT IN REHABILITATION THERAPY SERVICES MARKET, By age group, 2019-2028 (USD Million)
TABLE 828 THAILAND IN-PATIENT TREATMENT IN REHABILITATION THERAPY SERVICES MARKET, By AGE GROUP, 2019-2028 (USD Million)
TABLE 829 THAILAND REHABILITATION THERAPY SERVICES Market, By service type, 2019-2028 (USD Million)
TABLE 830 THAILAND out patient REHABILITATION THERAPY SERVICES Market, By service type, 2019-2028 (USD Million)
TABLE 831 THAILAND IN-patient REHABILITATION THERAPY SERVICES Market, By service type, 2019-2028 (USD Million)
TABLE 832 THAILAND REHABILITATION THERAPY SERVICES Market, By application, 2019-2028 (USD Million)
TABLE 833 THAILAND NEUROLOGICAL REHABILITATION THERAPY SERVICES Market, By APPLICATION, 2019-2028 (USD Million)
TABLE 834 THAILAND PULMONARY REHABILITATION THERAPY SERVICES Market, By APPLICATION, 2019-2028 (USD Million)
TABLE 835 THAILAND CARDIOLOGICAL REHABILITATION THERAPY SERVICES Market, By APPLICATION, 2019-2028 (USD Million)
TABLE 836 THAILAND SPORTS RELATED INJURIES IN REHABILITATION THERAPY SERVICES Market, By APPLICATION, 2019-2028 (USD Million)
TABLE 837 THAILAND PELVIC CARE IN REHABILITATION THERAPY SERVICES Market, By APPLICATION, 2019-2028 (USD Million)
TABLE 838 THAILAND ORTHOPEDIC REHABILITATION THERAPY SERVICES IN REHABILITATION THERAPY SERVICES MARKET, By APPLICATION, 2019-2028 (USD Million)
TABLE 839 THAILAND INTEGUMENTARY REHABILITATION THERAPY SERVICES IN REHABILITATION THERAPY SERVICES Market, By APPLICATION, 2019-2028 (USD Million)
TABLE 840 THAILAND PALLIATIVE CARE IN REHABILITATION THERAPY SERVICES Market, By APPLICATION, 2019-2028 (USD Million)
TABLE 841 THAILAND REHABILITATION THERAPY SERVICES Market, By SERVICE CATEGORY, 2019-2028 (USD Million)
TABLE 842 THAILAND REHABILITATION THERAPY SERVICES Market, By model, 2019-2028 (USD Million)
TABLE 843 THAILAND MANUAL IN REHABILITATION THERAPY SERVICES Market, By model, 2019-2028 (USD Million)
TABLE 844 THAILAND CONVENTIONAL IN REHABILITATION THERAPY SERVICES Market, By model, 2019-2028 (USD Million)
TABLE 845 THAILAND REHABILITATION THERAPY SERVICES Market, By END USER, 2019-2028 (USD Million)
TABLE 846 THAILAND REHABILITATION THERAPY SERVICES Market, By SERVICE CHANNEL, 2019-2028 (USD Million)
TABLE 847 MALAYSIA REHABILITATION THERAPY SERVICES Market, By SERVICE, 2019-2028 (USD Million)
TABLE 848 MALAYSIA REHABILITATION THERAPY in rehabilitation therapy SERVICES Market, By service, 2019-2028 (USD Million)
TABLE 849 MALAYSIA SPEECH THERAPY IN REHABILITATION THERAPY SERVICES Market, By SERVICE, 2019-2028 (Units)
TABLE 850 MALAYSIA REHABILITATION THERAPY SERVICES Market, By AGE GROUP, 2019-2028 (USD Million)
TABLE 851 MALAYSIA ELDERLY in REHABILITATION THERAPY SERVICES Market, By AGE GROUP, 2019-2028 (USD Million)
TABLE 852 MALAYSIA OUT-PATIENT TREATMENT in REHABILITATION THERAPY SERVICES Market, By AGE GROUP , 2019-2028 (USD Million)
TABLE 853 MALAYSIA IN-PATIENT TREATMENT in REHABILITATION THERAPY SERVICES Market, By AGE GROUP, 2019-2028 (USD Million)
TABLE 854 MALAYSIA PEDIATRICS in REHABILITATION THERAPY SERVICES Market, By AGE GROUP, 2019-2028 (USD Million)
TABLE 855 MALAYSIA out-patient treatment in REHABILITATION THERAPY SERVICES Market, By age group, 2019-2028 (USD Million)
TABLE 856 MALAYSIA IN-PATIENT TREATMENT in REHABILITATION THERAPY SERVICES Market, By AGE GROUP, 2019-2028 (USD Million)
TABLE 857 MALAYSIA ADULTS in REHABILITATION THERAPY SERVICES Market, By AGE GROUP, 2019-2028 (USD Million)
TABLE 858 MALAYSIA out-patient treatment in REHABILITATION THERAPY SERVICES Market, By age group, 2019-2028 (USD Million)
TABLE 859 MALAYSIA IN-PATIENT TREATMENT in REHABILITATION THERAPY SERVICES Market, By AGE GROUP, 2019-2028 (USD Million)
TABLE 860 MALAYSIA REHABILITATION THERAPY SERVICES Market, By service type, 2019-2028 (USD Million)
TABLE 861 MALAYSIA out patient REHABILITATION THERAPY SERVICES Market, By service type, 2019-2028 (USD Million)
TABLE 862 MALAYSIA IN-patient REHABILITATION THERAPY SERVICES Market, By service type, 2019-2028 (USD Million)
TABLE 863 MALAYSIA REHABILITATION THERAPY SERVICES Market, By application, 2019-2028 (USD Million)
TABLE 864 MALAYSIA NEUROLOGICAL REHABILITATION THERAPY SERVICES Market, By APPLICATION, 2019-2028 (USD Million)
TABLE 865 MALAYSIA PULMONARY REHABILITATION THERAPY SERVICES Market, By APPLICATION, 2019-2028 (USD Million)
TABLE 866 MALAYSIA CARDIOLOGICAL REHABILITATION THERAPY SERVICES Market, By APPLICATION, 2019-2028 (USD Million)
TABLE 867 MALAYSIA SPORTS RELATED INJURIES IN REHABILITATION THERAPY SERVICES Market, By APPLICATION, 2019-2028 (USD Million)
TABLE 868 MALAYSIA PELVIC CARE IN REHABILITATION THERAPY SERVICES Market, By APPLICATION, 2019-2028 (USD Million)
TABLE 869 MALAYSIA ORTHOPEDIC REHABILITATION THERAPY SERVICES IN REHABILITATION THERAPY SERVICES Market, By APPLICATION, 2019-2028 (USD Million)
TABLE 870 MALAYSIA INTEGUMENTARY REHABILITATION THERAPY SERVICES IN REHABILITATION THERAPY SERVICES Market, By APPLICATION, 2019-2028 (USD Million)
TABLE 871 MALAYSIA PALLIATIVE CARE IN REHABILITATION THERAPY SERVICES Market, By APPLICATION, 2019-2028 (USD Million)
TABLE 872 MALAYSIA REHABILITATION THERAPY SERVICES Market, By SERVICE CATEGORY, 2019-2028 (USD Million)
TABLE 873 MALAYSIA REHABILITATION THERAPY SERVICES Market, By model, 2019-2028 (USD Million)
TABLE 874 MALAYSIA MANUAL IN REHABILITATION THERAPY SERVICES Market, By model, 2019-2028 (USD Million)
TABLE 875 MALAYSIA CONVENTIONAL IN REHABILITATION THERAPY SERVICES Market, By model, 2019-2028 (USD Million)
TABLE 876 MALAYSIA REHABILITATION THERAPY SERVICES Market, By END USER, 2019-2028 (USD Million)
TABLE 877 MALAYSIA REHABILITATION THERAPY SERVICES Market, By SERVICE CHANNEL, 2019-2028 (USD Million)
TABLE 878 INDONESIA REHABILITATION THERAPY SERVICES Market, By SERVICE, 2019-2028 (USD Million)
TABLE 879 INDONESIA REHABILITATION THERAPY in rehabilitation therapy SERVICES Market, By service, 2019-2028 (USD Million)
TABLE 880 INDONESIA SPEECH THERAPY IN REHABILITATION THERAPY SERVICES Market, By SERVICE, 2019-2028 (Units)
TABLE 881 INDONESIA REHABILITATION THERAPY SERVICES Market, By AGE GROUP, 2019-2028 (USD Million)
TABLE 882 INDONESIA ELDERLY in REHABILITATION THERAPY SERVICES Market, By AGE GROUP, 2019-2028 (USD Million)
TABLE 883 INDONESIA OUT-PATIENT TREATMENT in REHABILITATION THERAPY SERVICES Market, By AGE GROUP , 2019-2028 (USD Million)
TABLE 884 INDONESIA IN-PATIENT TREATMENT in REHABILITATION THERAPY SERVICES Market, By AGE GROUP, 2019-2028 (USD Million)
TABLE 885 INDONESIA PEDIATRICS in REHABILITATION THERAPY SERVICES Market, By AGE GROUP, 2019-2028 (USD Million)
TABLE 886 INDONESIA out-patient treatment in REHABILITATION THERAPY SERVICES Market, By age group, 2019-2028 (USD Million)
TABLE 887 INDONESIA IN-PATIENT TREATMENT in REHABILITATION THERAPY SERVICES Market, By AGE GROUP, 2019-2028 (USD Million)
TABLE 888 INDONESIA ADULTS in REHABILITATION THERAPY SERVICES Market, By AGE GROUP, 2019-2028 (USD Million)
TABLE 889 INDONESIA out-patient treatment in REHABILITATION THERAPY SERVICES Market, By age group, 2019-2028 (USD Million)
TABLE 890 INDONESIAIN-PATIENT TREATMENT in REHABILITATION THERAPY SERVICES Market, By AGE GROUP, 2019-2028 (USD Million)
TABLE 891 INDONESIA REHABILITATION THERAPY SERVICES Market, By service type, 2019-2028 (USD Million)
TABLE 892 INDONESIA out patient REHABILITATION THERAPY SERVICES Market, By service type, 2019-2028 (USD Million)
TABLE 893 INDONESIA IN-patient REHABILITATION THERAPY SERVICES Market, By service type, 2019-2028 (USD Million)
TABLE 894 INDONESIA REHABILITATION THERAPY SERVICES Market, By application, 2019-2028 (USD Million)
TABLE 895 INDONESIA NEUROLOGICAL REHABILITATION THERAPY SERVICES Market, By APPLICATION, 2019-2028 (USD Million)
TABLE 896 INDONESIA PULMONARY REHABILITATION THERAPY SERVICES Market, By APPLICATION, 2019-2028 (USD Million)
TABLE 897 INDONESIA CARDIOLOGICAL REHABILITATION THERAPY SERVICES Market, By APPLICATION, 2019-2028 (USD Million)
TABLE 898 INDONESIA SPORTS RELATED INJURIES IN REHABILITATION THERAPY SERVICES Market, By APPLICATION, 2019-2028 (USD Million)
TABLE 899 INDONESIAPELVIC CARE IN REHABILITATION THERAPY SERVICES Market, By APPLICATION, 2019-2028 (USD Million)
TABLE 900 INDONESIA ORTHOPEDIC REHABILITATION THERAPY SERVICES IN REHABILITATION THERAPY SERVICES Market, By APPLICATION, 2019-2028 (USD Million)
TABLE 901 INDONESIA INTEGUMENTARY REHABILITATION THERAPY SERVICES IN REHABILITATION THERAPY SERVICES Market, By APPLICATION, 2019-2028 (USD Million)
TABLE 902 INDONESIA PALLIATIVE CARE IN REHABILITATION THERAPY SERVICES Market, By APPLICATION, 2019-2028 (USD Million)
TABLE 903 INDONESIA REHABILITATION THERAPY SERVICES Market, By SERVICE CATEGORY, 2019-2028 (USD Million)
TABLE 904 INDONESIA REHABILITATION THERAPY SERVICES Market, By model, 2019-2028 (USD Million)
TABLE 905 INDONESIA MANUAL IN REHABILITATION THERAPY SERVICES Market, By model, 2019-2028 (USD Million)
TABLE 906 INDONESIA CONVENTIONAL IN REHABILITATION THERAPY SERVICES Market, By model, 2019-2028 (USD Million)
TABLE 907 INDONESIA REHABILITATION THERAPY SERVICES Market, By END USER, 2019-2028 (USD Million)
TABLE 908 INDONESIA REHABILITATION THERAPY SERVICES Market, By SERVICE CHANNEL, 2019-2028 (USD Million)
TABLE 909 PHILIPPINES REHABILITATION THERAPY SERVICES Market, By SERVICE, 2019-2028 (USD Million)
TABLE 910 PHILIPPINES REHABILITATION THERAPY in rehabilitation therapy SERVICES Market, By service, 2019-2028 (USD Million)
TABLE 911 PHILIPPINES SPEECH THERAPY IN REHABILITATION THERAPY SERVICES Market, By SERVICE, 2019-2028 (Units)
TABLE 912 PHILIPPINES REHABILITATION THERAPY SERVICES Market, By AGE GROUP, 2019-2028 (USD Million)
TABLE 913 PHILIPPINES ELDERLY in REHABILITATION THERAPY SERVICES Market, By AGE GROUP, 2019-2028 (USD Million)
TABLE 914 PHILIPPINES OUT-PATIENT TREATMENT in REHABILITATION THERAPY SERVICES Market, By AGE GROUP , 2019-2028 (USD Million)
TABLE 915 PHILIPPINES IN-PATIENT TREATMENT in REHABILITATION THERAPY SERVICES Market, By AGE GROUP, 2019-2028 (USD Million)
TABLE 916 PHILIPPINES PEDIATRICS in REHABILITATION THERAPY SERVICES Market, By AGE GROUP, 2019-2028 (USD Million)
TABLE 917 PHILIPPINES out-patient treatment in REHABILITATION THERAPY SERVICES Market, By age group, 2019-2028 (USD Million)
TABLE 918 PHILIPPINES IN-PATIENT TREATMENT in REHABILITATION THERAPY SERVICES Market, By AGE GROUP, 2019-2028 (USD Million)
TABLE 919 PHILIPPINES ADULTS in REHABILITATION THERAPY SERVICES Market, By AGE GROUP, 2019-2028 (USD Million)
TABLE 920 PHILIPPINES out-patient treatment in REHABILITATION THERAPY SERVICES Market, By age group, 2019-2028 (USD Million)
TABLE 921 PHILIPPINES IN-PATIENT TREATMENT in REHABILITATION THERAPY SERVICES Market, By AGE GROUP, 2019-2028 (USD Million)
TABLE 922 PHILIPPINES REHABILITATION THERAPY SERVICES Market, By service type, 2019-2028 (USD Million)
TABLE 923 PHILIPPINES out patient REHABILITATION THERAPY SERVICES Market, By service type, 2019-2028 (USD Million)
TABLE 924 PHILIPPINESIN-patient REHABILITATION THERAPY SERVICES Market, By service type, 2019-2028 (USD Million)
TABLE 925 PHILIPPINESREHABILITATION THERAPY SERVICES Market, By application, 2019-2028 (USD Million)
TABLE 926 PHILIPPINES NEUROLOGICAL REHABILITATION THERAPY SERVICES Market, By APPLICATION, 2019-2028 (USD Million)
TABLE 927 PHILIPPINESPULMONARY REHABILITATION THERAPY SERVICES Market, By APPLICATION, 2019-2028 (USD Million)
TABLE 928 PHILIPPINES CARDIOLOGICAL REHABILITATION THERAPY SERVICES Market, By APPLICATION, 2019-2028 (USD Million)
TABLE 929 PHILIPPINES SPORTS RELATED INJURIES IN REHABILITATION THERAPY SERVICES Market, By APPLICATION, 2019-2028 (USD Million)
TABLE 930 PHILIPPINES PELVIC CARE IN REHABILITATION THERAPY SERVICES Market, By APPLICATION, 2019-2028 (USD Million)
TABLE 931 PHILIPPINES ORTHOPEDIC REHABILITATION THERAPY SERVICES IN REHABILITATION THERAPY SERVICES Market, By APPLICATION, 2019-2028 (USD Million)
TABLE 932 PHILIPPINES INTEGUMENTARY REHABILITATION THERAPY SERVICES IN REHABILITATION THERAPY SERVICES Market, By APPLICATION, 2019-2028 (USD Million)
TABLE 933 PHILIPPINESPALLIATIVE CARE IN REHABILITATION THERAPY SERVICES Market, By APPLICATION, 2019-2028 (USD Million)
TABLE 934 PHILIPPINESREHABILITATION THERAPY SERVICES Market, By SERVICE CATEGORY, 2019-2028 (USD Million)
TABLE 935 PHILIPPINES REHABILITATION THERAPY SERVICES Market, By model, 2019-2028 (USD Million)
TABLE 936 PHILIPPINES MANUAL IN REHABILITATION THERAPY SERVICES Market, By model, 2019-2028 (USD Million)
TABLE 937 PHILIPPINES CONVENTIONAL IN REHABILITATION THERAPY SERVICES Market, By model, 2019-2028 (USD Million)
TABLE 938 PHILIPPINES REHABILITATION THERAPY SERVICES Market, By END USER, 2019-2028 (USD Million)
TABLE 939 PHILIPPINES REHABILITATION THERAPY SERVICES Market, By SERVICE CHANNEL, 2019-2028 (USD Million)
TABLE 940 REST OF ASIA-PACIFIC REHABILITATION THERAPY SERVICES Market, By SERVICE, 2019-2028 (USD Million)
TABLE 941 middle east & africa REHABILITATION THERAPY services market, By Country, 2019-2028 (USD Million)
TABLE 942 MIDDLE EAST & AFRICA Rehabilitation Therapy Services Market, By Service, 2019-2028 (USD Million)
TABLE 943 MIDDLE EAST & AFRICA Rehabilitation Therapy in Rehabilitation Therapy Services Market, By Service, 2019-2028 (USD Million)
TABLE 944 MIDDLE EAST & AFRICA Speech Therapy in Rehabilitation Therapy Services Market, By Service, 2019-2028 (USD Million)
TABLE 945 MIDDLE EAST & AFRICA Rehabilitation Therapy Services Market, By Age Group, 2019-2028(USD Million)
TABLE 946 MIDDLE EAST & AFRICA Elderly in Rehabilitation Therapy Services Market, By Age Group, 2019-2028 (USD Million)
TABLE 947 MIDDLE EAST & AFRICA Out-Patient Treatment in Rehabilitation Therapy Services Market, By Age Group, 2019-2028 (USD Million)
TABLE 948 MIDDLE EAST & AFRICA In-Patient Treatment in Rehabilitation Therapy Services Market, By Age Group, 2019-2028 (USD Million)
TABLE 949 MIDDLE EAST & AFRICA Pediatrics in Rehabilitation Therapy Services Market, By Age Group, 2019-2028 (USD Million)
TABLE 950 MIDDLE EAST & AFRICA Out-Patient Treatment in Rehabilitation Therapy Services Market, By Age Group, 2019-2028 (USD Million)
TABLE 951 MIDDLE EAST & AFRICA In-Patient Treatment in Rehabilitation Therapy Services Market, By Age Group, 2019-2028 (USD Million)
TABLE 952 MIDDLE EAST & AFRICA Adults in Rehabilitation Therapy Services Market, By Age Group, 2019-2028 (USD Million)
TABLE 953 MIDDLE EAST & AFRICA Out-Patient Treatment in Rehabilitation Therapy Services Market, By Age Group, 2019-2028 (USD Million)
TABLE 954 MIDDLE EAST & AFRICA In-Patient Treatment in Rehabilitation Therapy Services Market, By Age Group, 2019-2028 (USD Million)
TABLE 955 MIDDLE EAST & AFRICA Rehabilitation Therapy Services Market, By Service Type, 2019-2028 (USD Million)
TABLE 956 MIDDLE EAST & AFRICA Outpatient Rehabilitation Services in Rehabilitation Therapy Services Market, By Service Type, 2019-2028 (USD Million)
TABLE 957 MIDDLE EAST & AFRICA In-Patient Rehabilitation Services in Rehabilitation Therapy Services Market, By Service Type, 2019-2028 (USD Million)
TABLE 958 mIDDLE EAST & AFRICA Rehabilitation Therapy Services Market, By Application, 2019-2028 (USD Million)
TABLE 959 MIDDLE EAST & AFRICA Neurological Rehabilitation Therapy Services in Rehabilitation Therapy Services Market, By Application, 2019-2028 (USD Million)
TABLE 960 MIDDLE EAST & AFRICA Pulmonary Rehabilitation Therapy Services in Rehabilitation Therapy Services Market, By Application, 2019-2028 (USD Million)
TABLE 961 MIDDLE EAST & AFRICA Cardiological Rehabilitation Therapy Services in Rehabilitation Therapy Services Market, By Application, 2019-2028 (USD Million)
TABLE 962 MIDDLE EAST & AFRICA Sports- Related Injuries in Rehabilitation Therapy Services Market, By Application, 2019-2028 (USD Million)
TABLE 963 MIDDLE EAST & AFRICA Pelvic Care in Rehabilitation Therapy Services Market, By Application, 2019-2028 (USD Million)
TABLE 964 MIDDLE EAST & AFRICA Orthopedic Rehabilitation Therapy Services in Rehabilitation Therapy Services Market, By Application, 2019-2028 (USD Million)
TABLE 965 MIDDLE EAST & AFRICA Integumentary Rehabilitation Therapy Services in Rehabilitation Therapy Services Market, By Application, 2019-2028 (USD Million)
TABLE 966 MIDDLE EAST & AFRICA Palliative Care in Rehabilitation Therapy Services Market, By Application, 2019-2028 (USD Million)
TABLE 967 MIDDLE EAST & AFRICA Rehabilitation Therapy Services Market, By Service Category, 2019-2028 (USD Million)
TABLE 968 MIDDLE EAST & AFRICA Rehabilitation Therapy Services Market, By Model, 2019-2028 (USD Million)
TABLE 969 MIDDLE EAST & AFRICA Manual in Rehabilitation Therapy Services Market, By Model, 2019-2028 (USD Million)
TABLE 970 MIDDLE EAST & AFRICA Conventional in Rehabilitation Therapy Services Market, By Model, 2019-2028 (USD Million)
TABLE 971 MIDDLE EAST & AFRICA Rehabilitation Therapy Services Market, By End User, 2019-2028 (USD Million)
TABLE 972 MIDDLE EAST & AFRICA Rehabilitation Therapy Services Market, By Service Channel, 2019-2028 (USD Million)
TABLE 973 South Africa Rehabilitation Therapy Services Market, By Service, 2019-2028 (USD Million)
TABLE 974 South Africa Rehabilitation Therapy in Rehabilitation Therapy Services Market, By Service, 2019-2028 (USD Million)
TABLE 975 South Africa Speech Therapy in Rehabilitation Therapy Services Market, By Service, 2019-2028 (USD Million)
TABLE 976 South Africa Rehabilitation Therapy Services Market, By Age Group, 2019-2028(USD Million)
TABLE 977 South Africa Elderly in Rehabilitation Therapy Services Market, By Age Group, 2019-2028 (USD Million)
TABLE 978 South Africa Out-Patient Treatment in Rehabilitation Therapy Services Market, By Age Group, 2019-2028 (USD Million)
TABLE 979 South Africa In-Patient Treatment in Rehabilitation Therapy Services Market, By Age Group, 2019-2028 (USD Million)
TABLE 980 South Africa Pediatrics in Rehabilitation Therapy Services Market, By Age Group, 2019-2028 (USD Million)
TABLE 981 South Africa Out-Patient Treatment in Rehabilitation Therapy Services Market, By Age Group, 2019-2028 (USD Million)
TABLE 982 South Africa In-Patient Treatment in Rehabilitation Therapy Services Market, By Age Group, 2019-2028 (USD Million)
TABLE 983 South Africa Adults in Rehabilitation Therapy Services Market, By Age Group, 2019-2028 (USD Million)
TABLE 984 South Africa Out-Patient Treatment in Rehabilitation Therapy Services Market, By Age Group, 2019-2028 (USD Million)
TABLE 985 South Africa In-Patient Treatment in Rehabilitation Therapy Services Market, By Age Group, 2019-2028 (USD Million)
TABLE 986 South Africa Rehabilitation Therapy Services Market, By Service Type, 2019-2028 (USD Million)
TABLE 987 South Africa Outpatient Rehabilitation Services in Rehabilitation Therapy Services Market, By Service Type, 2019-2028 (USD Million)
TABLE 988 South Africa In-Patient Rehabilitation Services in Rehabilitation Therapy Services Market, By Service Type, 2019-2028 (USD Million)
TABLE 989 South Africa Rehabilitation Therapy Services Market, By Application, 2019-2028 (USD Million)
TABLE 990 South Africa Neurological Rehabilitation Therapy Services in Rehabilitation Therapy Services Market, By Application, 2019-2028 (USD Million)
TABLE 991 South Africa Pulmonary Rehabilitation Therapy Services in Rehabilitation Therapy Services Market, By Application, 2019-2028 (USD Million)
TABLE 992 South Africa Cardiological Rehabilitation Therapy Services in Rehabilitation Therapy Services Market, By Application, 2019-2028 (USD Million)
TABLE 993 South Africa Sports- Related Injuries in Rehabilitation Therapy Services Market, By Application, 2019-2028 (USD Million)
TABLE 994 South Africa Pelvic Care in Rehabilitation Therapy Services Market, By Application, 2019-2028 (USD Million)
TABLE 995 South Africa Orthopedic Rehabilitation Therapy Services in Rehabilitation Therapy Services Market, By Application, 2019-2028 (USD Million)
TABLE 996 South Africa Integumentary Rehabilitation Therapy Services in Rehabilitation Therapy Services Market, By Application, 2019-2028 (USD Million)
TABLE 997 South Africa Palliative Care in Rehabilitation Therapy Services Market, By Application, 2019-2028 (USD Million)
TABLE 998 South Africa Rehabilitation Therapy Services Market, By Service Category, 2019-2028 (USD Million)
TABLE 999 South Africa Rehabilitation Therapy Services Market, By Model, 2019-2028 (USD Million)
TABLE 1000 South Africa Manual in Rehabilitation Therapy Services Market, By Model, 2019-2028 (USD Million)
TABLE 1001 South Africa Conventional in Rehabilitation Therapy Services Market, By Model, 2019-2028 (USD Million)
TABLE 1002 South Africa Rehabilitation Therapy Services Market, By End User, 2019-2028 (USD Million)
TABLE 1003 South Africa Rehabilitation Therapy Services Market, By Service Channel, 2019-2028 (USD Million)
TABLE 1004 Saudi Arabia Rehabilitation Therapy Services Market, By Service, 2019-2028 (USD Million)
TABLE 1005 Saudi Arabia Rehabilitation Therapy in Rehabilitation Therapy Services Market, By Service, 2019-2028 (USD Million)
TABLE 1006 Saudi Arabia Speech Therapy in Rehabilitation Therapy Services Market, By Service, 2019-2028 (USD Million)
TABLE 1007 Saudi Arabia Rehabilitation Therapy Services Market, By Age Group, 2019-2028(USD Million)
TABLE 1008 Saudi Arabia Elderly in Rehabilitation Therapy Services Market, By Age Group, 2019-2028 (USD Million)
TABLE 1009 Saudi Arabia Out-Patient Treatment in Rehabilitation Therapy Services Market, By Age Group, 2019-2028 (USD Million)
TABLE 1010 Saudi Arabia In-Patient Treatment in Rehabilitation Therapy Services Market, By Age Group, 2019-2028 (USD Million)
TABLE 1011 Saudi Arabia Pediatrics in Rehabilitation Therapy Services Market, By Age Group, 2019-2028 (USD Million)
TABLE 1012 Saudi Arabia Out-Patient Treatment in Rehabilitation Therapy Services Market, By Age Group, 2019-2028 (USD Million)
TABLE 1013 Saudi Arabia In-Patient Treatment in Rehabilitation Therapy Services Market, By Age Group, 2019-2028 (USD Million)
TABLE 1014 Saudi Arabia Adults in Rehabilitation Therapy Services Market, By Age Group, 2019-2028 (USD Million)
TABLE 1015 Saudi Arabia Out-Patient Treatment in Rehabilitation Therapy Services Market, By Age Group, 2019-2028 (USD Million)
TABLE 1016 Saudi Arabia In-Patient Treatment in Rehabilitation Therapy Services Market, By Age Group, 2019-2028 (USD Million)
TABLE 1017 Saudi Arabia Rehabilitation Therapy Services Market, By Service Type, 2019-2028 (USD Million)
TABLE 1018 Saudi Arabia Outpatient Rehabilitation Services in Rehabilitation Therapy Services Market, By Service Type, 2019-2028 (USD Million)
TABLE 1019 Saudi Arabia In-Patient Rehabilitation Services in Rehabilitation Therapy Services Market, By Service Type, 2019-2028 (USD Million)
TABLE 1020 Saudi Arabia Rehabilitation Therapy Services Market, By Application, 2019-2028 (USD Million)
TABLE 1021 Saudi Arabia Neurological Rehabilitation Therapy Services in Rehabilitation Therapy Services Market, By Application, 2019-2028 (USD Million)
TABLE 1022 Saudi Arabia Pulmonary Rehabilitation Therapy Services in Rehabilitation Therapy Services Market, By Application, 2019-2028 (USD Million)
TABLE 1023 Saudi Arabia Cardiological Rehabilitation Therapy Services in Rehabilitation Therapy Services Market, By Application, 2019-2028 (USD Million)
TABLE 1024 Saudi Arabia Sports- Related Injuries in Rehabilitation Therapy Services Market, By Application, 2019-2028 (USD Million)
TABLE 1025 Saudi Arabia Pelvic Care in Rehabilitation Therapy Services Market, By Application, 2019-2028 (USD Million)
TABLE 1026 Saudi Arabia Orthopedic Rehabilitation Therapy Services in Rehabilitation Therapy Services Market, By Application, 2019-2028 (USD Million)
TABLE 1027 Saudi Arabia Integumentary Rehabilitation Therapy Services in Rehabilitation Therapy Services Market, By Application, 2019-2028 (USD Million)
TABLE 1028 Saudi Arabia Palliative Care in Rehabilitation Therapy Services Market, By Application, 2019-2028 (USD Million)
TABLE 1029 Saudi Arabia Rehabilitation Therapy Services Market, By Service Category, 2019-2028 (USD Million)
TABLE 1030 Saudi Arabia Rehabilitation Therapy Services Market, By Model, 2019-2028 (USD Million)
TABLE 1031 Saudi Arabia Manual in Rehabilitation Therapy Services Market, By Model, 2019-2028 (USD Million)
TABLE 1032 Saudi Arabia Conventional in Rehabilitation Therapy Services Market, By Model, 2019-2028 (USD Million)
TABLE 1033 Saudi Arabia Rehabilitation Therapy Services Market, By End User, 2019-2028 (USD Million)
TABLE 1034 Saudi Arabia Rehabilitation Therapy Services Market, By Service Channel, 2019-2028 (USD Million)
TABLE 1035 UAE Rehabilitation Therapy Services Market, By Service, 2019-2028 (USD Million)
TABLE 1036 UAE Rehabilitation Therapy in Rehabilitation Therapy Services Market, By Service, 2019-2028 (USD Million)
TABLE 1037 UAE Speech Therapy in Rehabilitation Therapy Services Market, By Service, 2019-2028 (USD Million)
TABLE 1038 UAE Rehabilitation Therapy Services Market, By Age Group, 2019-2028(USD Million)
TABLE 1039 UAE Elderly in Rehabilitation Therapy Services Market, By Age Group, 2019-2028 (USD Million)
TABLE 1040 UAE Out-Patient Treatment in Rehabilitation Therapy Services Market, By Age Group, 2019-2028 (USD Million)
TABLE 1041 UAE In-Patient Treatment in Rehabilitation Therapy Services Market, By Age Group, 2019-2028 (USD Million)
TABLE 1042 UAE Pediatrics in Rehabilitation Therapy Services Market, By Age Group, 2019-2028 (USD Million)
TABLE 1043 UAE Out-Patient Treatment in Rehabilitation Therapy Services Market, By Age Group, 2019-2028 (USD Million)
TABLE 1044 UAE In-Patient Treatment in Rehabilitation Therapy Services Market, By Age Group, 2019-2028 (USD Million)
TABLE 1045 UAE Adults in Rehabilitation Therapy Services Market, By Age Group, 2019-2028 (USD Million)
TABLE 1046 UAE Out-Patient Treatment in Rehabilitation Therapy Services Market, By Age Group, 2019-2028 (USD Million)
TABLE 1047 UAE In-Patient Treatment in Rehabilitation Therapy Services Market, By Age Group, 2019-2028 (USD Million)
TABLE 1048 UAE Rehabilitation Therapy Services Market, By Service Type, 2019-2028 (USD Million)
TABLE 1049 UAE Outpatient Rehabilitation Services in Rehabilitation Therapy Services Market, By Service Type, 2019-2028 (USD Million)
TABLE 1050 UAE In-Patient Rehabilitation Services in Rehabilitation Therapy Services Market, By Service Type, 2019-2028 (USD Million)
TABLE 1051 UAE Rehabilitation Therapy Services Market, By Application, 2019-2028 (USD Million)
TABLE 1052 UAE Neurological Rehabilitation Therapy Services in Rehabilitation Therapy Services Market, By Application, 2019-2028 (USD Million)
TABLE 1053 UAE Pulmonary Rehabilitation Therapy Services in Rehabilitation Therapy Services Market, By Application, 2019-2028 (USD Million)
TABLE 1054 UAE Cardiological Rehabilitation Therapy Services in Rehabilitation Therapy Services Market, By Application, 2019-2028 (USD Million)
TABLE 1055 UAE Sports- Related Injuries in Rehabilitation Therapy Services Market, By Application, 2019-2028 (USD Million)
TABLE 1056 UAE Pelvic Care in Rehabilitation Therapy Services Market, By Application, 2019-2028 (USD Million)
TABLE 1057 UAE Orthopedic Rehabilitation Therapy Services in Rehabilitation Therapy Services Market, By Application, 2019-2028 (USD Million)
TABLE 1058 UAE Integumentary Rehabilitation Therapy Services in Rehabilitation Therapy Services Market, By Application, 2019-2028 (USD Million)
TABLE 1059 UAE Palliative Care in Rehabilitation Therapy Services Market, By Application, 2019-2028 (USD Million)
TABLE 1060 UAE Rehabilitation Therapy Services Market, By Service Category, 2019-2028 (USD Million)
TABLE 1061 UAE Rehabilitation Therapy Services Market, By Model, 2019-2028 (USD Million)
TABLE 1062 UAE Manual in Rehabilitation Therapy Services Market, By Model, 2019-2028 (USD Million)
TABLE 1063 UAE Conventional in Rehabilitation Therapy Services Market, By Model, 2019-2028 (USD Million)
TABLE 1064 UAE Rehabilitation Therapy Services Market, By End User, 2019-2028 (USD Million)
TABLE 1065 UAE Rehabilitation Therapy Services Market, By Service Channel, 2019-2028 (USD Million)
TABLE 1066 EGYPT Rehabilitation Therapy Services Market, By Service, 2019-2028 (USD Million)
TABLE 1067 EGYPT Rehabilitation Therapy in Rehabilitation Therapy Services Market, By Service, 2019-2028 (USD Million)
TABLE 1068 EGYPT Speech Therapy in Rehabilitation Therapy Services Market, By Service, 2019-2028 (USD Million)
TABLE 1069 EGYPT Rehabilitation Therapy Services Market, By Age Group, 2019-2028(USD Million)
TABLE 1070 EGYPT Elderly in Rehabilitation Therapy Services Market, By Age Group, 2019-2028 (USD Million)
TABLE 1071 EGYPT Out-Patient Treatment in Rehabilitation Therapy Services Market, By Age Group, 2019-2028 (USD Million)
TABLE 1072 EGYPT In-Patient Treatment in Rehabilitation Therapy Services Market, By Age Group, 2019-2028 (USD Million)
TABLE 1073 EGYPT Pediatrics in Rehabilitation Therapy Services Market, By Age Group, 2019-2028 (USD Million)
TABLE 1074 EGYPT Out-Patient Treatment in Rehabilitation Therapy Services Market, By Age Group, 2019-2028 (USD Million)
TABLE 1075 EGYPT In-Patient Treatment in Rehabilitation Therapy Services Market, By Age Group, 2019-2028 (USD Million)
TABLE 1076 EGYPT Adults in Rehabilitation Therapy Services Market, By Age Group, 2019-2028 (USD Million)
TABLE 1077 EGYPT Out-Patient Treatment in Rehabilitation Therapy Services Market, By Age Group, 2019-2028 (USD Million)
TABLE 1078 EGYPT In-Patient Treatment in Rehabilitation Therapy Services Market, By Age Group, 2019-2028 (USD Million)
TABLE 1079 EGYPT Rehabilitation Therapy Services Market, By Service Type, 2019-2028 (USD Million)
TABLE 1080 EGYPT Outpatient Rehabilitation Services in Rehabilitation Therapy Services Market, By Service Type, 2019-2028 (USD Million)
TABLE 1081 EGYPT In-Patient Rehabilitation Services in Rehabilitation Therapy Services Market, By Service Type, 2019-2028 (USD Million)
TABLE 1082 EGYPT Rehabilitation Therapy Services Market, By Application, 2019-2028 (USD Million)
TABLE 1083 EGYPT Neurological Rehabilitation Therapy Services in Rehabilitation Therapy Services Market, By Application, 2019-2028 (USD Million)
TABLE 1084 EGYPT Pulmonary Rehabilitation Therapy Services in Rehabilitation Therapy Services Market, By Application, 2019-2028 (USD Million)
TABLE 1085 EGYPT Cardiological Rehabilitation Therapy Services in Rehabilitation Therapy Services Market, By Application, 2019-2028 (USD Million)
TABLE 1086 EGYPT Sports- Related Injuries in Rehabilitation Therapy Services Market, By Application, 2019-2028 (USD Million)
TABLE 1087 EGYPT Pelvic Care in Rehabilitation Therapy Services Market, By Application, 2019-2028 (USD Million)
TABLE 1088 EGYPT Orthopedic Rehabilitation Therapy Services in Rehabilitation Therapy Services Market, By Application, 2019-2028 (USD Million)
TABLE 1089 EGYPT Integumentary Rehabilitation Therapy Services in Rehabilitation Therapy Services Market, By Application, 2019-2028 (USD Million)
TABLE 1090 EGYPT Palliative Care in Rehabilitation Therapy Services Market, By Application, 2019-2028 (USD Million)
TABLE 1091 EGYPT Rehabilitation Therapy Services Market, By Service Category, 2019-2028 (USD Million)
TABLE 1092 EGYPT Rehabilitation Therapy Services Market, By Model, 2019-2028 (USD Million)
TABLE 1093 EGYPT Manual in Rehabilitation Therapy Services Market, By Model, 2019-2028 (USD Million)
TABLE 1094 EGYPT Conventional in Rehabilitation Therapy Services Market, By Model, 2019-2028 (USD Million)
TABLE 1095 EGYPT Rehabilitation Therapy Services Market, By End User, 2019-2028 (USD Million)
TABLE 1096 EGYPT Rehabilitation Therapy Services Market, By Service Channel, 2019-2028 (USD Million)
TABLE 1097 ISRAEL Rehabilitation Therapy Services Market, By Service, 2019-2028 (USD Million)
TABLE 1098 ISRAEL Rehabilitation Therapy in Rehabilitation Therapy Services Market, By Service, 2019-2028 (USD Million)
TABLE 1099 ISRAEL Speech Therapy in Rehabilitation Therapy Services Market, By Service, 2019-2028 (USD Million)
TABLE 1100 ISRAEL Rehabilitation Therapy Services Market, By Age Group, 2019-2028(USD Million)
TABLE 1101 ISRAEL Elderly in Rehabilitation Therapy Services Market, By Age Group, 2019-2028 (USD Million)
TABLE 1102 ISRAEL Out-Patient Treatment in Rehabilitation Therapy Services Market, By Age Group, 2019-2028 (USD Million)
TABLE 1103 ISRAEL In-Patient Treatment in Rehabilitation Therapy Services Market, By Age Group, 2019-2028 (USD Million)
TABLE 1104 ISRAEL Pediatrics in Rehabilitation Therapy Services Market, By Age Group, 2019-2028 (USD Million)
TABLE 1105 ISRAEL Out-Patient Treatment in Rehabilitation Therapy Services Market, By Age Group, 2019-2028 (USD Million)
TABLE 1106 ISRAEL In-Patient Treatment in Rehabilitation Therapy Services Market, By Age Group, 2019-2028 (USD Million)
TABLE 1107 ISRAEL Adults in Rehabilitation Therapy Services Market, By Age Group, 2019-2028 (USD Million)
TABLE 1108 ISRAEL Out-Patient Treatment in Rehabilitation Therapy Services Market, By Age Group, 2019-2028 (USD Million)
TABLE 1109 ISRAEL In-Patient Treatment in Rehabilitation Therapy Services Market, By Age Group, 2019-2028 (USD Million)
TABLE 1110 ISRAEL Rehabilitation Therapy Services Market, By Service Type, 2019-2028 (USD Million)
TABLE 1111 ISRAEL Outpatient Rehabilitation Services in Rehabilitation Therapy Services Market, By Service Type, 2019-2028 (USD Million)
TABLE 1112 ISRAEL In-Patient Rehabilitation Services in Rehabilitation Therapy Services Market, By Service Type, 2019-2028 (USD Million)
TABLE 1113 ISRAEL Rehabilitation Therapy Services Market, By Application, 2019-2028 (USD Million)
TABLE 1114 ISRAEL Neurological Rehabilitation Therapy Services in Rehabilitation Therapy Services Market, By Application, 2019-2028 (USD Million)
TABLE 1115 ISRAEL Pulmonary Rehabilitation Therapy Services in Rehabilitation Therapy Services Market, By Application, 2019-2028 (USD Million)
TABLE 1116 ISRAEL Cardiological Rehabilitation Therapy Services in Rehabilitation Therapy Services Market, By Application, 2019-2028 (USD Million)
TABLE 1117 ISRAEL Sports- Related Injuries in Rehabilitation Therapy Services Market, By Application, 2019-2028 (USD Million)
TABLE 1118 ISRAEL Pelvic Care in Rehabilitation Therapy Services Market, By Application, 2019-2028 (USD Million)
TABLE 1119 ISRAEL Orthopedic Rehabilitation Therapy Services in Rehabilitation Therapy Services Market, By Application, 2019-2028 (USD Million)
TABLE 1120 Israel Integumentary Rehabilitation Therapy Services in Rehabilitation Therapy Services Market, By Application, 2019-2028 (USD Million)
TABLE 1121 Israel Palliative Care in Rehabilitation Therapy Services Market, By Application, 2019-2028 (USD Million)
TABLE 1122 Israel Rehabilitation Therapy Services Market, By Service Category, 2019-2028 (USD Million)
TABLE 1123 Israel Rehabilitation Therapy Services Market, By Model, 2019-2028 (USD Million)
TABLE 1124 Israel Manual in Rehabilitation Therapy Services Market, By Model, 2019-2028 (USD Million)
TABLE 1125 Israel Conventional in Rehabilitation Therapy Services Market, By Model, 2019-2028 (USD Million)
TABLE 1126 Israel Rehabilitation Therapy Services Market, By End User, 2019-2028 (USD Million)
TABLE 1127 Israel Rehabilitation Therapy Services Market, By Service Channel, 2019-2028 (USD Million)
TABLE 1128 REST OF MIDDLE EAST & AFRICARehabilitation Therapy Services Market, By Service, 2019-2028 (USD Million)
TABLE 1129 SOUTH AMERICA REHABILITATION THERAPY SERVICES Market, By COUNTRY, 2019-2028 (USD million)
TABLE 1130 SOUTH AMERICA REHABILITATION THERAPY SERVICES Market, By SERVICE, 2019-2028 (USD Million)
TABLE 1131 SOUTH AMERICA REHABILITATION THERAPY in rehabilitation therapy SERVICES Market, By service, 2019-2028 (USD Million)
TABLE 1132 SOUTH AMERICA SPEECH THERAPY IN REHABILITATION THERAPY SERVICES Market, By SERVICE, 2019-2028 (Units)
TABLE 1133 SOUTH AMERICA in REHABILITATION THERAPY SERVICES Market, By AGE GROUP, 2019-2028 (USD Million)
TABLE 1134 SOUTH AMERICA ELDERLY in REHABILITATION THERAPY SERVICES Market, By AGE GROUP, 2019-2028 (USD Million)
TABLE 1135 SOUTH AMERICA OUT-PATIENT TREATMENT in REHABILITATION THERAPY SERVICES Market, By AGE GROUP , 2019-2028 (USD Million)
TABLE 1136 SOUTH AMERICA IN-PATIENT TREATMENT in REHABILITATION THERAPY SERVICES Market, By AGE GROUP, 2019-2028 (USD Million)
TABLE 1137 SOUTH AMERICA PEDIATRICS in REHABILITATION THERAPY SERVICES Market, By AGE GROUP, 2019-2028 (USD Million)
TABLE 1138 SOUTH AMERICA out-patient treatment in REHABILITATION THERAPY SERVICES Market, By age group, 2019-2028 (USD Million)
TABLE 1139 SOUTH AMERICA IN-PATIENT TREATMENT in REHABILITATION THERAPY SERVICES Market, By AGE GROUP, 2019-2028 (USD Million)
TABLE 1140 SOUTH AMERICA ADULTS in REHABILITATION THERAPY SERVICES Market, By AGE GROUP, 2019-2028 (USD Million)
TABLE 1141 SOUTH AMERICA out-patient treatment in REHABILITATION THERAPY SERVICES Market, By age group, 2019-2028 (USD Million)
TABLE 1142 SOUTH AMERICA IN-PATIENT TREATMENT in REHABILITATION THERAPY SERVICES Market, By AGE GROUP, 2019-2028 (USD Million)
TABLE 1143 SOUTH AMERICA REHABILITATION THERAPY SERVICES Market, By service type, 2019-2028 (USD Million)
TABLE 1144 SOUTH AMERICA out patient REHABILITATION THERAPY SERVICES in rehabilitation therapy services Market, By service type, 2019-2028 (USD Million)
TABLE 1145 SOUTH AMERICA in- patient REHABILITATION THERAPY SERVICES Market, By service type, 2019-2028 (USD Million)
TABLE 1146 SOUTH AMERICA REHABILITATION THERAPY SERVICES Market, By application, 2019-2028 (USD Million)
TABLE 1147 SOUTH AMERICA NEUROLOGICAL REHABILITATION THERAPY SERVICES Market, By APPLICATION, 2019-2028 (USD Million)
TABLE 1148 SOUTH AMERICA PULMONARY REHABILITATION THERAPY SERVICES Market, By APPLICATION, 2019-2028 (USD Million)
TABLE 1149 SOUTH AMERICA CARDIOLOGICAL REHABILITATION THERAPY SERVICES Market, By APPLICATION, 2019-2028 (USD Million)
TABLE 1150 SOUTH AMERICA SPORTS RELATED INJURIES IN REHABILITATION THERAPY SERVICES Market, By APPLICATION, 2019-2028 (USD Million)
TABLE 1151 SOUTH AMERICA PELVIC CARE IN REHABILITATION THERAPY SERVICES Market, By APPLICATION, 2019-2028 (USD Million)
TABLE 1152 SOUTH AMERICA ORTHOPEDIC REHABILITATION THERAPY SERVICES IN REHABILITATION THERAPY SERVICES Market, By APPLICATION, 2019-2028 (USD Million)
TABLE 1153 SOUTH AMERICA INTEGUMENTARY REHABILITATION THERAPY SERVICES IN REHABILITATION THERAPY SERVICES Market, By APPLICATION, 2019-2028 (USD Million)
TABLE 1154 SOUTH AMERICA PALLIATIVE CARE IN REHABILITATION THERAPY SERVICES Market, By APPLICATION, 2019-2028 (USD Million)
TABLE 1155 SOUTH America REHABILITATION THERAPY SERVICES Market, By SERVICE CATEGORY, 2019-2028 (USD Million)
TABLE 1156 SOUTH America REHABILITATION THERAPY SERVICES Market, By model, 2019-2028 (USD Million)
TABLE 1157 SOUTH America MANUAL IN REHABILITATION THERAPY SERVICES Market, By model, 2019-2028 (USD Million)
TABLE 1158 SOUTH America CONVENTIONAL IN REHABILITATION THERAPY SERVICES Market, By model, 2019-2028 (USD Million)
TABLE 1159 SOUTH America REHABILITATION THERAPY SERVICES Market, By END USER, 2019-2028 (USD Million)
TABLE 1160 SOUTH America REHABILITATION THERAPY SERVICES Market, By SERVICE CHANNEL, 2019-2028 (USD Million)
TABLE 1161 BRAZIL REHABILITATION THERAPY SERVICES Market, By SERVICE, 2019-2028 (USD Million)
TABLE 1162 BRAZIL REHABILITATION THERAPY in rehabilitation therapy SERVICES Market, By service, 2019-2028 (USD Million)
TABLE 1163 BRAZIL SPEECH THERAPY IN REHABILITATION THERAPY SERVICES Market, By SERVICE, 2019-2028 (Units)
TABLE 1164 BRAZIL REHABILITATION THERAPY SERVICES Market, By AGE GROUP, 2019-2028 (USD Million)
TABLE 1165 BRAZIL ELDERLY in REHABILITATION THERAPY SERVICES Market, By AGE GROUP, 2019-2028 (USD Million)
TABLE 1166 BRAZIL OUT-PATIENT TREATMENT in REHABILITATION THERAPY SERVICES Market, By AGE GROUP , 2019-2028 (USD Million)
TABLE 1167 BRAZIL IN-PATIENT TREATMENT in REHABILITATION THERAPY SERVICES Market, By AGE GROUP, 2019-2028 (USD Million)
TABLE 1168 BRAZIL PEDIATRICS in REHABILITATION THERAPY SERVICES Market, By AGE GROUP, 2019-2028 (USD Million)
TABLE 1169 BRAZIL out-patient treatment in REHABILITATION THERAPY SERVICES Market, By age group, 2019-2028 (USD Million)
TABLE 1170 BRAZIL IN-PATIENT TREATMENT in REHABILITATION THERAPY SERVICES Market, By AGE GROUP, 2019-2028 (USD Million)
TABLE 1171 BRAZIL ADULTS in REHABILITATION THERAPY SERVICES Market, By AGE GROUP, 2019-2028 (USD Million)
TABLE 1172 BRAZIL out-patient treatment in REHABILITATION THERAPY SERVICES Market, By age group, 2019-2028 (USD Million)
TABLE 1173 BRAZIL IN-PATIENT TREATMENT in REHABILITATION THERAPY SERVICES Market, By AGE GROUP, 2019-2028 (USD Million)
TABLE 1174 BRAZIL REHABILITATION THERAPY SERVICES Market, By service type, 2019-2028 (USD Million)
TABLE 1175 BRAZIL out patient REHABILITATION THERAPY SERVICES Market, By service type, 2019-2028 (USD Million)
TABLE 1176 BRAZIL IN-patient REHABILITATION THERAPY SERVICES Market, By service type, 2019-2028 (USD Million)
TABLE 1177 BRAZIL REHABILITATION THERAPY SERVICES Market, By application, 2019-2028 (USD Million)
TABLE 1178 Brazil NEUROLOGICAL REHABILITATION THERAPY SERVICES Market, By APPLICATION, 2019-2028 (USD Million)
TABLE 1179 Brazil PULMONARY REHABILITATION THERAPY SERVICES Market, By APPLICATION, 2019-2028 (USD Million)
TABLE 1180 Brazil CARDIOLOGICAL REHABILITATION THERAPY SERVICES Market, By APPLICATION, 2019-2028 (USD Million)
TABLE 1181 Brazil SPORTS RELATED INJURIES IN REHABILITATION THERAPY SERVICES Market, By APPLICATION, 2019-2028 (USD Million)
TABLE 1182 Brazil PELVIC CARE IN REHABILITATION THERAPY SERVICES Market, By APPLICATION, 2019-2028 (USD Million)
TABLE 1183 Brazil ORTHOPEDIC REHABILITATION THERAPY SERVICES IN REHABILITATION THERAPY SERVICES Market, By APPLICATION, 2019-2028 (USD Million)
TABLE 1184 Brazil INTEGUMENTARY REHABILITATION THERAPY SERVICES IN REHABILITATION THERAPY SERVICES Market, By APPLICATION, 2019-2028 (USD Million)
TABLE 1185 Brazil PALLIATIVE CARE IN REHABILITATION THERAPY SERVICES Market, By APPLICATION, 2019-2028 (USD Million)
TABLE 1186 Brazil REHABILITATION THERAPY SERVICES Market, By SERVICE CATEGORY, 2019-2028 (USD Million)
TABLE 1187 Brazil REHABILITATION THERAPY SERVICES Market, By model, 2019-2028 (USD Million)
TABLE 1188 Brazil REHABILITATION THERAPY SERVICES Market, By model, 2019-2028 (USD Million)
TABLE 1189 Brazil CONVENTIONAL IN REHABILITATION THERAPY SERVICES Market, By model, 2019-2028 (USD Million)
TABLE 1190 Brazil REHABILITATION THERAPY SERVICES Market, By END USER, 2019-2028 (USD Million)
TABLE 1191 BRAZIL REHABILITATION THERAPY SERVICES Market, By SERVICE CHANNEL, 2019-2028 (USD Million)
TABLE 1192 ARGENTINA REHABILITATION THERAPY SERVICES Market, By SERVICE, 2019-2028 (USD Million)
TABLE 1193 ARGENTINA REHABILITATION THERAPY in rehabilitation therapy SERVICES Market, By service, 2019-2028 (USD Million)
TABLE 1194 ARGENTINA SPEECH THERAPY IN REHABILITATION THERAPY SERVICES Market, By SERVICE, 2019-2028 (Units)
TABLE 1195 ARGENTINA REHABILITATION THERAPY SERVICES Market, By AGE GROUP, 2019-2028 (USD Million)
TABLE 1196 ARGENTINA ELDERLY in REHABILITATION THERAPY SERVICES Market, By AGE GROUP, 2019-2028 (USD Million)
TABLE 1197 ARGENTINA OUT-PATIENT TREATMENT in REHABILITATION THERAPY SERVICES Market, By AGE GROUP , 2019-2028 (USD Million)
TABLE 1198 ARGENTINA IN-PATIENT TREATMENT in REHABILITATION THERAPY SERVICES Market, By AGE GROUP, 2019-2028 (USD Million)
TABLE 1199 ARGENTINA PEDIATRICS in REHABILITATION THERAPY SERVICES Market, By AGE GROUP, 2019-2028 (USD Million)
TABLE 1200 ARGENTINA out-patient treatment in REHABILITATION THERAPY SERVICES Market, By age group, 2019-2028 (USD Million)
TABLE 1201 ARGENTINA IN-PATIENT TREATMENT in REHABILITATION THERAPY SERVICES Market, By AGE GROUP, 2019-2028 (USD Million)
TABLE 1202 ARGENTINA ADULTS in REHABILITATION THERAPY SERVICES Market, By AGE GROUP, 2019-2028 (USD Million)
TABLE 1203 ARGENTINA out-patient treatment in REHABILITATION THERAPY SERVICES Market, By age group, 2019-2028 (USD Million)
TABLE 1204 ARGENTINA IN-PATIENT TREATMENT in REHABILITATION THERAPY SERVICES Market, By AGE GROUP, 2019-2028 (USD Million)
TABLE 1205 ARGENTINA REHABILITATION THERAPY SERVICES Market, By service type, 2019-2028 (USD Million)
TABLE 1206 ARGENTINA out patient REHABILITATION THERAPY SERVICES Market, By service type, 2019-2028 (USD Million)
TABLE 1207 ARGENTINA IN-patient REHABILITATION THERAPY SERVICES Market, By service type, 2019-2028 (USD Million)
TABLE 1208 ARGENTINA REHABILITATION THERAPY SERVICES Market, By application, 2019-2028 (USD Million)
TABLE 1209 ARGENTINA NEUROLOGICAL REHABILITATION THERAPY SERVICES Market, By APPLICATION, 2019-2028 (USD Million)
TABLE 1210 ARGENTINA PULMONARY REHABILITATION THERAPY SERVICES Market, By APPLICATION, 2019-2028 (USD Million)
TABLE 1211 ARGENTINA CARDIOLOGICAL REHABILITATION THERAPY SERVICES Market, By APPLICATION, 2019-2028 (USD Million)
TABLE 1212 ARGENTINA SPORTS RELATED INJURIES IN REHABILITATION THERAPY SERVICES Market, By APPLICATION, 2019-2028 (USD Million)
TABLE 1213 ARGENTINA PELVIC CARE IN REHABILITATION THERAPY SERVICES Market, By APPLICATION, 2019-2028 (USD Million)
TABLE 1214 ARGENTINA ORTHOPEDIC REHABILITATION THERAPY SERVICES IN REHABILITATION THERAPY SERVICES Market, By APPLICATION, 2019-2028 (USD Million)
TABLE 1215 ARGENTINA INTEGUMENTARY REHABILITATION THERAPY SERVICES IN REHABILITATION THERAPY SERVICES Market, By APPLICATION, 2019-2028 (USD Million)
TABLE 1216 ARGENTINA PALLIATIVE CARE IN REHABILITATION THERAPY SERVICES Market, By APPLICATION, 2019-2028 (USD Million)
TABLE 1217 ARGENTINA REHABILITATION THERAPY SERVICES Market, By SERVICE CATEGORY, 2019-2028 (USD Million)
TABLE 1218 ARGENTINA REHABILITATION THERAPY SERVICES Market, By model, 2019-2028 (USD Million)
TABLE 1219 ARGENTINA MANUAL IN REHABILITATION THERAPY SERVICES Market, By model, 2019-2028 (USD Million)
TABLE 1220 ARGENTINA CONVENTIONAL IN REHABILITATION THERAPY SERVICES Market, By model, 2019-2028 (USD Million)
TABLE 1221 ARGENTINA REHABILITATION THERAPY SERVICES Market, By END USER, 2019-2028 (USD Million)
TABLE 1222 ARGENTINA REHABILITATION THERAPY SERVICES Market, By SERVICE CHANNEL, 2019-2028 (USD Million)
TABLE 1223 Rest of South America REHABILITATION THERAPY SERVICES Market, By SERVICE, 2019-2028 (USD Million)
图片列表
FIGURE 1 Global rehabilitation therapy services MARKET: SEGMENTATION
FIGURE 2 GLOBAL rehabilitation therapy services MARKET: DATA TRIANGULATION
FIGURE 3 global REHABILITATION THERAPY SERVICES Market: DROC ANALYSIS
FIGURE 4 Global REHABILITATION THERAPY SERVICES market: Global VS REGIONAL MARKET ANALYSIS
FIGURE 5 Global REHABILITATION THERAPY SERVICES Market: COMPANY RESEARCH ANALYSIS
FIGURE 6 GLOBAL REHABILITATION THERAPY SERVICES MARKET: MULTIVARIATE MODELLING
FIGURE 7 GLOBAL REHABILITATION THERAPY SERVICES MARKET: INTERVIEW DEMOGRAPHICS
FIGURE 8 GLOBAL REHABILITATION THERAPY SERVICES MARKET: DBMR MARKET POSITION GRID
FIGURE 9 GLOBAL REHABILITATION THERAPY SERVICES MARKET: VENDOR SHARE ANALYSIS
FIGURE 10 GLOBAL REHABILITATION THERAPY SERVICES MARKET: MARKET application COVERAGE GRID
FIGURE 11 Global REHABILITATION THERAPY SERVICES market: SEGMENTATION
FIGURE 12 NORTH AMERICA is expected to DOMINATE THE REHABILITATION THERAPY SERVICES market AND ASIA-PACIFIC IS EXPECTED TO GROW WITH THE HIGHEST CAGR IN THE FORECAST PERIOD OF 2021 TO 2028
FIGURE 13 INCREASING PREVALENCE OF CHRONIC DISEASE is expected to DRIVe THE global REHABILITATION THERAPY SERVICES MARKET IN THE FORECAST PERIOD OF 2021 to 2028
FIGURE 14 rehabilitation therapy services SEGMENT is expected to account for the largest share of the global REHABILITATION THERAPY SERVICES MARKET in 2021 & 2028
FIGURE 15 ASIA-PACIFIC is the fastest growing market FOR the REHABILITATION THERAPY SERVICES MANUFACTURERS IN THE FORECAST PERIOD OF 2021 TO 2028
FIGURE 16 DRIVERS, RESTRAINTS, OPPORTUNITIES, AND CHALLENGEs OF GLOBAL REHABILITATION THERAPY SERVICES MARKET
FIGURE 17 Global Chronic Disease Burden
FIGURE 18 geriatric population in the European region
FIGURE 19 Population Suffering for Certain Disability
FIGURE 20 global rehabilitation treatment market: BY services, 2020
FIGURE 21 global rehabilitation treatment market: BY services, 2020-2028 (USD Million)
FIGURE 22 global rehabilitation treatment market: BY services, CAGR (2020-2028)
FIGURE 23 global rehabilitation treatment market: BY services, LIFELINE CURVE
FIGURE 24 GLOBAL REHABILITATION THERAPY SERVICES MARKET: BY AGE GROUP, 2020
FIGURE 25 GLOBAL REHABILITATION THERAPY SERVICES MARKET: BY AGE GROUP, 2020-2028 (USD MILLION)
FIGURE 26 GLOBAL REHABILITATION THERAPY SERVICES MARKET: BY AGE GROUP, CAGR (2021-2028)
FIGURE 27 GLOBAL REHABILITATION THERAPY SERVICES MARKET: BY AGE GROUP, LIFELINE CURVE
FIGURE 28 global rehabilitation treatment market: BY service type, 2020
FIGURE 29 global rehabilitation treatment market: BY service type, 2020-2028 (USD Million)
FIGURE 30 global rehabilitation treatment market: BY service type, CAGR (2020-2028)
FIGURE 31 global rehabilitation treatment market: BY service type, LIFELINE CURVE
FIGURE 32 global REHABILITATION THERAPY SERVICES market: BY application, 2020
FIGURE 33 global REHABILITATION THERAPY SERVICES market: BY application, 2020-2028 (USD Million)
FIGURE 34 global REHABILITATION THERAPY SERVICES market: BY application, CAGR (2021-2028)
FIGURE 35 global REHABILITATION THERAPY SERVICES market: BY Application, LIFELINE CURVE
FIGURE 36 GLOBAL REHABILITATION THERAPY SERVICE MARKET: BY SERVICE CATEGORY, 2020
FIGURE 37 GLOBAL REHABILITATION THERAPY SERVICES MARKET: BY SERVICE CATEGORY , 2020-2028 (USD MILLION)
FIGURE 38 GLOBAL REHABILIATION THERAPY SERVICE MARKET: BY SERVICE CATEGORY, CAGR (2021-2028)
FIGURE 39 global rehabiliation THERAPY SERVICES MARKET: BY SERVICE CATEGORY, LIFELINE CURVE
FIGURE 40 global rehabilitation treatment market: BY model, 2020
FIGURE 41 global rehabilitation treatment market: BY model, 2020-2028 (USD Million)
FIGURE 42 global rehabilitation treatment market: BY model, CAGR (2020-2028)
FIGURE 43 global rehabilitation treatment market: BY model, LIFELINE CURVE
FIGURE 44 GLOBAL REHABILITATION THERAPY SERVICES MARKET: BY END USER, 2020
FIGURE 45 GLOBAL REHABILITATION THERAPY SERVICES MARKET: BY END USER, 2020-2028 (USD MILLION)
FIGURE 46 GLOBAL REHABILITATION THERAPY SERVICES MARKET: BY END USER, CAGR (2021-2028)
FIGURE 47 GLOBAL REHABILITATION THERAPY SERVICES MARKET: BY END USER, LIFELINE CURVE
FIGURE 48 GLOBAL REHABILITATION THERAPY SERVICES MARKET: BY SERVICE CHANNEL, 2020
FIGURE 49 GLOBAL REHABILITATION THERAPY SERVICES MARKET: BY SERVICE CHANNEL, 2020-2028 (USD MILLION)
FIGURE 50 GLOBAL REHABILITATION THERAPY SERVICES MARKET: BY SERVICE CHANNEL, CAGR (2021-2028)
FIGURE 51 GLOBAL REHABILITATION THERAPY SERVICES MARKET: BY SERVICE CHANNEL, LIFELINE CURVE
FIGURE 52 Global REHABILITATION THERAPY services market: SNAPSHOT (2020)
FIGURE 53 Global REHABILITATION THERAPY services market: BY Region (2020)
FIGURE 54 Global REHABILITATION THERAPY services market: BY Region (2021 & 2028)
FIGURE 55 Global REHABILITATION THERAPY services market: BY Region (2020 & 2028)
FIGURE 56 Global REHABILITATION THERAPY services market: BY Service (2021-2028)
FIGURE 57 North America REHABILITATION THERAPY SERVICES MARKET: SNAPSHOT (2020)
FIGURE 58 North America REHABILITATION THERAPY SERVICES MARKET: BY COUNTRY (2020)
FIGURE 59 North America REHABILITATION THERAPY SERVICES MARKET: BY COUNTRY (2021 & 2028)
FIGURE 60 North America REHABILITATION THERAPY SERVICES MARKET: BY COUNTRY (2020 & 2028)
FIGURE 61 North America REHABILITATION THERAPY SERVICES MARKET: BY type (2021-2028)
FIGURE 62 Europe REHABILITATION THERAPY SERVICES MARKET: SNAPSHOT (2020)
FIGURE 63 Europe REHABILITATION THERAPY SERVICES MARKET: BY COUNTRY (2020)
FIGURE 64 Europe REHABILITATION THERAPY SERVICES MARKET: BY COUNTRY (2021 & 2028)
FIGURE 65 Europe REHABILITATION THERAPY SERVICES MARKET: BY COUNTRY (2021 & 2028)
FIGURE 66 Europe REHABILITATION THERAPY SERVICES MARKET: BY service (2021-2028)
FIGURE 67 ASIA-PACIFIC REHABILITATION THERAPY SERVICES MARKET: SNAPSHOT (2020)
FIGURE 68 ASIA-PACIFIC REHABILITATION THERAPY SERVICES MARKET: BY COUNTRY (2020)
FIGURE 69 ASIA-PACIFIC REHABILITATION THERAPY SERVICES MARKET: BY COUNTRY (2021 & 2028)
FIGURE 70 ASIA-PACIFIC REHABILITATION THERAPY SERVICES MARKET: BY COUNTRY (2020 & 2028)
FIGURE 71 ASIA-PACIFIC REHABILITATION THERAPY SERVICES MARKET: BY type (2021-2028)
FIGURE 72 middle east & africa REHABILITATION THERAPY SERVICES MARKET: SNAPSHOT (2020)
FIGURE 73 middle east & africa REHABILITATION THERAPY SERVICES MARKET: BY COUNTRY (2020)
FIGURE 74 middle east & africa REHABILITATION THERAPY SERVICES MARKET: BY COUNTRY (2021 & 2028)
FIGURE 75 middle east & africa REHABILITATION THERAPY SERVICES MARKET: BY COUNTRY (2021 & 2028)
FIGURE 76 middle east & africa REHABILITATION THERAPY SERVICES MARKET: BY service (2021-2028)
FIGURE 77 SOUTHAmerica REHABILITATION THERAPY SERVICES MARKET: SNAPSHOT (2020)
FIGURE 78 SOUTH America REHABILITATION THERAPY SERVICES MARKET: BY COUNTRY (2020)
FIGURE 79 SOUTH America REHABILITATION THERAPY SERVICES MARKET: BY COUNTRY (2021 & 2028)
FIGURE 80 SOUTH America REHABILITATION THERAPY SERVICES MARKET: BY COUNTRY (2020 & 2028)
FIGURE 81 SOUTH America REHABILITATION THERAPY SERVICES MARKET: BY type (2021-2028)
FIGURE 82 Global rehabilitation therapy services Market: company share 2020 (%)
FIGURE 83 North America rehabilitation therapy services Market: company share 2020 (%)
FIGURE 84 Europe rehabilitation therapy services Market: company share 2020 (%)
FIGURE 85 Asia-Pacific rehabilitation therapy services Market: company share 2020 (%)
研究方法
Data collection and base year analysis are done using data collection modules with large sample sizes. The stage includes obtaining market information or related data through various sources and strategies. It includes examining and planning all the data acquired from the past in advance. It likewise envelops the examination of information inconsistencies seen across different information sources. The market data is analysed and estimated using market statistical and coherent models. Also, market share analysis and key trend analysis are the major success factors in the market report. To know more, please request an analyst call or drop down your inquiry.
The key research methodology used by DBMR research team is data triangulation which involves data mining, analysis of the impact of data variables on the market and primary (industry expert) validation. Data models include Vendor Positioning Grid, Market Time Line Analysis, Market Overview and Guide, Company Positioning Grid, Patent Analysis, Pricing Analysis, Company Market Share Analysis, Standards of Measurement, Global versus Regional and Vendor Share Analysis. To know more about the research methodology, drop in an inquiry to speak to our industry experts.
可定制
Data Bridge Market Research is a leader in advanced formative research. We take pride in servicing our existing and new customers with data and analysis that match and suits their goal. The report can be customized to include price trend analysis of target brands understanding the market for additional countries (ask for the list of countries), clinical trial results data, literature review, refurbished market and product base analysis. Market analysis of target competitors can be analyzed from technology-based analysis to market portfolio strategies. We can add as many competitors that you require data about in the format and data style you are looking for. Our team of analysts can also provide you data in crude raw excel files pivot tables (Fact book) or can assist you in creating presentations from the data sets available in the report.