Global Display Quantum Dots Market
市场规模(十亿美元)
CAGR : %
Forecast Period |
2022 –2029 |
Market Size (Base Year) |
USD 4.50 Billion |
Market Size (Forecast Year) |
USD 28.26 Billion |
CAGR |
|
Major Markets Players |
全球显示量子点市场,按组件(管、薄膜、LED)、产品(智能手机、个人电脑显示器、平板电脑、电视)、材料(含镉、无镉)、应用(光电子、生物成像、安全和视频监控、量子光学、可再生能源)、垂直(消费电子、医疗保健、汽车、信息技术 (IT) 和电信、其他)划分 – 行业趋势和预测至 2029 年
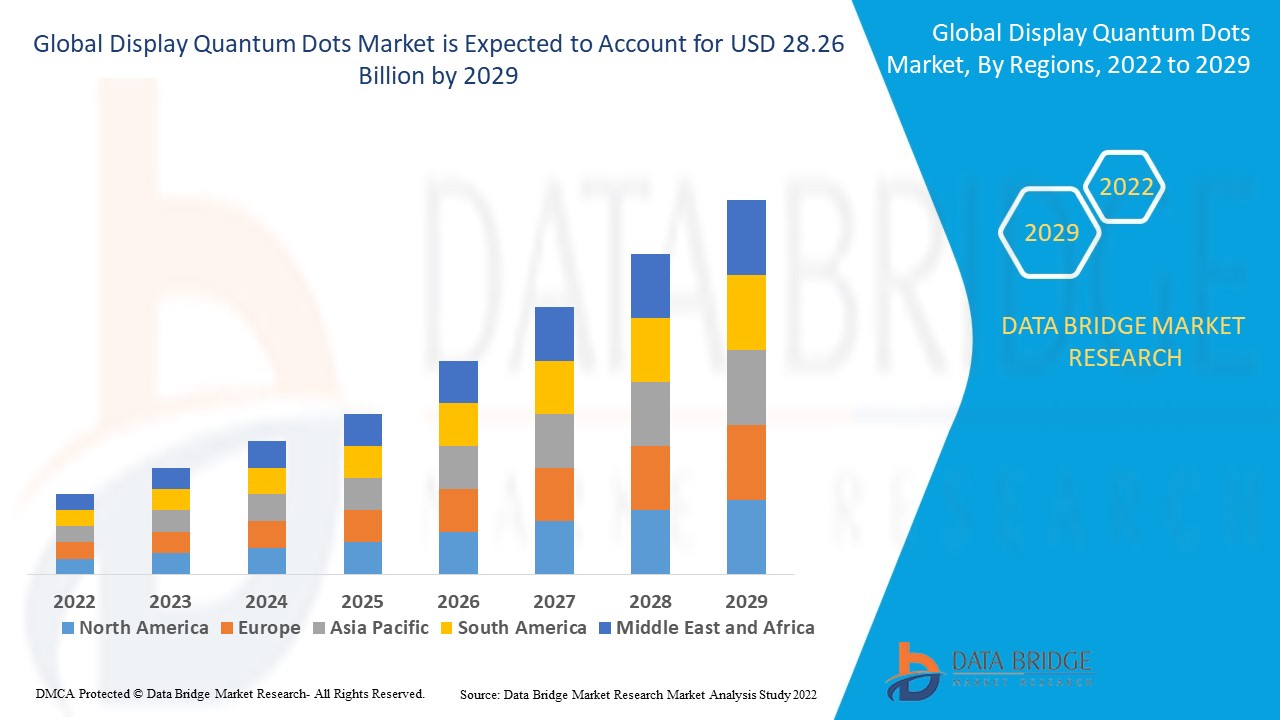
显示量子点市场分析及规模
显示量子点是广泛应用于智能手机、个人电脑、平板电脑等显示设备的量子点。LED 照明中量子点的广泛采用以及对大尺寸和更高分辨率显示器的更大需求将进一步为显示量子点市场在预测期内创造巨大的增长机会。
2021 年全球显示量子点市场价值为 45 亿美元,预计到 2029 年将达到 282.6 亿美元,在 2022-2029 年的预测期内复合年增长率为 25.82%。除了对市场价值、增长率、细分、地理覆盖范围和主要参与者等市场情景的洞察外,Data Bridge Market Research 策划的市场报告还包括深入的专家分析、按地理代表的公司生产和产能、分销商和合作伙伴的网络布局、详细和更新的价格趋势分析以及供应链和需求的缺口分析。
报告范围和市场细分
报告指标 |
细节 |
预测期 |
2022 至 2029 年 |
基准年 |
2021 |
历史岁月 |
2020(可定制为 2014 - 2019) |
定量单位 |
收入(单位:十亿美元)、销量(单位:台)、定价(美元) |
涵盖的领域 |
元件(管、膜、LED)、产品(智能手机、PC 显示器、平板电脑、电视)、材料(含镉、无镉)、应用(光电子、生物成像、安全和监控、量子光学、可再生能源)、垂直(消费电子、医疗保健、汽车、信息技术 (IT) 和电信、其他) |
覆盖国家 |
北美洲的美国、加拿大和墨西哥、德国、法国、英国、荷兰、瑞士、比利时、俄罗斯、意大利、西班牙、土耳其、欧洲其他地区、中国、日本、印度、韩国、新加坡、马来西亚、澳大利亚、泰国、印度尼西亚、菲律宾、亚太地区 (APAC) 的其他地区、沙特阿拉伯、阿联酋、南非、埃及、以色列、中东和非洲 (MEA) 的其他地区、巴西、阿根廷和南美洲其他地区 |
涵盖的市场参与者 |
Nanosys Inc. (U.S.), Dow (U.S.), SAMSUNG (South Korea), LG DISPLAY CO., LTD. (South Korea), Nanoco Group plc (U.K.), SHARP COPORATION (Japan), Quantum Materials Corporation (U.S.), Sony Corporation (Japan), 3M (U.S.), Ocean NanoTech (U.S.), QD Laser (Japan), MicroVision (U.S.), NNCrystal US Corporation (U.S.) |
Market Opportunities |
|
Market Definition
A display quantum dots are the quantum dots used extensively in display devices such as smartphones, PCs, tablets, TVs and others. High adoption of quantum dots in LED lightings and larger demands for large-sized and higher resolution displays and the enhanced energy effectiveness along with the high brightness are some beneficial factors delivered by the display quantum dots.
Global Display Quantum Dots Market Dynamics
This section deals with understanding the market drivers, advantages, opportunities, restraints and challenges. All of this is discussed in detail as below:
Drivers
- Growing demands for the display quantum dots across the globe
Growing demands for the display quantum dots due to the advanced features of quantum dots is the primary factor driving the growth of the display quantum dots market over the forecasted period. The enhanced energy effectiveness, high brightness, high adoption of quantum dots in LED lightings and larger demands for large-sized and higher resolution displays are significant factors projected to drive the growth of the display quantum dots market over the forecasted period.
- Increasing investments in the R&D sector
The increased investments in the research and development sectors across various end-users such as fuels the market growth. Various end-users such as consumer electronics, healthcare, automotive, information technology (IT), telecommunication, and others are adopting the display quantum dots to serve a wide range of applications such as optoelectronics, biological imaging, security and surveillance and others. All these factors are expected to drive the growth of the quantum display dots market over the forecasted period.
Opportunities
- Growing penetration and advancements
The growing penetration of LED across the globe is estimated to generate lucrative opportunities for the market, which will further expand the display quantum dots market's growth rate in the future. Moreover, the high adoption of quantum dots in LED lightings and larger demands for large-sized and higher resolution displays will further create significant growth opportunities for the display quantum dots market over the forecasted period.
Additionally, the technological advancements in consumer electronics, healthcare, automotive, information technology (IT) and telecommunication and other sectors will also offer numerous growth opportunities within the market.
Restraints/Challenges
- Limited availability of raw materials
The limited availability of rare-earth materials and unfavorable impact of falling prices of conventional OLED and LED/LCD displays on quantum dot displays are the major factors projected to create challenges for the display quantum dots market over the forecast period.
This display quantum dots market report provides details of new recent developments, trade regulations, import-export analysis, production analysis, value chain optimization, market share, impact of domestic and localized market players, analyses opportunities in terms of emerging revenue pockets, changes in market regulations, strategic market growth analysis, market size, category market growths, application niches and dominance, product approvals, product launches, geographic expansions, technological innovations in the market. To gain more info on the display quantum dots market contact Data Bridge Market Research for an Analyst Brief, our team will help you take an informed market decision to achieve market growth.
Impact and Current Market Scenario of Raw Material Shortage and Shipping Delays
Data Bridge Market Research offers a high-level analysis of the market and delivers information by keeping in account the impact and current market environment of raw material shortage and shipping delays. This translates into assessing strategic possibilities, creating effective action plans, and assisting businesses in making important decisions.
Apart from the standard report, we also offer in-depth analysis of the procurement level from forecasted shipping delays, distributor mapping by region, commodity analysis, production analysis, price mapping trends, sourcing, category performance analysis, supply chain risk management solutions, advanced benchmarking, and other services for procurement and strategic support.
Covid-19 impact on Display Quantum Dots Market
The covid-19 has led to severe crisis across the world and several causalities. Supply chain disruptions were created due to lockdown that was being imposed in several regions. Key manufacturers of quantum dost were severely affected during the first two quarters of 2020 due to the outbreak of the pandemic. Hence, an imbalance in the demand and supply was witnessed, leading to companies not manufacturing to their complete capacity. However, in the third quarter of 2020, lockdowns were lifted, leading to the market's steady recovery with the significant increase in the demands.
Expected Impact of Economic Slowdown on the Pricing and Availability of Products
When economic activity slows, industries begin to suffer. The forecasted effects of the economic downturn on the pricing and accessibility of the products are taken into account in the market insight reports and intelligence services provided by DBMR. With this, our clients can typically keep one step ahead of their competitors, project their sales and revenue, and estimate their profit and loss expenditures.
Recent developments
- 2019 年,三星投资 110 亿美元建造了全球首个专用量子点显示器制造工厂。该工厂将成为该地区制造量子显示点的新中心。
- 2019年,Nanosys 展示了其革命性的量子效率无重金属红、绿、蓝 QDEL 系统,并在其实验室中成功利用喷墨技术打印了显示器。
全球显示量子点市场范围
显示量子点市场根据组件、产品、材料、应用和垂直细分。这些细分市场之间的增长将帮助您分析行业中增长微弱的细分市场,并为用户提供有价值的市场概览和市场洞察,帮助他们做出战略决策,确定核心市场应用。
成分
- 管子
- 电影
- 引领
产品
- 手机
- 电脑显示器
- 平板电脑
- 电视
材料
- 含镉
- 不含镉
应用
- 光电子
- 生物成像
- 安全与监控
- 量子光学
- 可再生能源
垂直的
- 消费电子产品
- 卫生保健
- 汽车
- 信息技术(IT)和电信
- 其他的
全球显示量子点市场区域分析/见解
对显示量子点市场进行了分析,并按上述组件、产品、材料、应用和垂直提供了市场规模洞察和趋势。
显示量子点市场报告涵盖的国家包括北美的美国、加拿大和墨西哥,欧洲的德国、法国、英国、荷兰、瑞士、比利时、俄罗斯、意大利、西班牙、土耳其,欧洲其他地区,亚太地区的中国、日本、印度、韩国、新加坡、马来西亚、澳大利亚、泰国、印度尼西亚、菲律宾,亚太地区的亚太其他地区,沙特阿拉伯、阿联酋、南非、埃及、以色列,中东和非洲其他地区,以及南美洲的巴西、阿根廷和南美洲其他地区。
北美在显示量子点市场占据主导地位,因为该地区对节能设备的需求不断增长、基础设施完善以及消费电子领域对无镉量子点的兴趣日益浓厚。
由于显示量子点设备的需求不断增长以及该地区对节能解决方案的需求不断增长,预计亚太地区将在 2022 年至 2029 年的预测期内出现显著增长。
报告的国家部分还提供了影响单个市场因素和国内市场监管变化,这些因素和变化会影响市场的当前和未来趋势。下游和上游价值链分析、技术趋势和波特五力分析、案例研究等数据点是用于预测单个国家市场情景的一些指标。此外,在提供国家数据的预测分析时,还考虑了全球品牌的存在和可用性以及它们因来自本地和国内品牌的激烈或稀缺竞争而面临的挑战、国内关税和贸易路线的影响。
竞争格局和显示量子点市场份额分析
显示量子点市场竞争格局按竞争对手提供详细信息。详细信息包括公司概况、公司财务状况、收入、市场潜力、研发投资、新市场计划、全球影响力、生产基地和设施、生产能力、公司优势和劣势、产品发布、产品宽度和广度、应用主导地位。以上提供的数据点仅与公司对显示量子点市场的关注有关。
显示量子点市场的一些主要参与者包括
- Nanosys Inc.(美国)
- 陶氏(美国)
- 三星(韩国)
- LG DISPLAY 有限公司(韩国)
- Nanoco Group plc(英国)
- 夏普株式会社(日本)
- 量子材料公司(美国)
- 索尼公司(日本)
- 3M(美国)
- Ocean NanoTech(美国)
- QD 激光器(日本)
- MicroVision (美国)
- NNCrystal US Corporation(美国)
SKU-
Get online access to the report on the World's First Market Intelligence Cloud
- Interactive Data Analysis Dashboard
- Company Analysis Dashboard for high growth potential opportunities
- Research Analyst Access for customization & queries
- Competitor Analysis with Interactive dashboard
- Latest News, Updates & Trend analysis
- Harness the Power of Benchmark Analysis for Comprehensive Competitor Tracking
研究方法
Data collection and base year analysis are done using data collection modules with large sample sizes. The stage includes obtaining market information or related data through various sources and strategies. It includes examining and planning all the data acquired from the past in advance. It likewise envelops the examination of information inconsistencies seen across different information sources. The market data is analysed and estimated using market statistical and coherent models. Also, market share analysis and key trend analysis are the major success factors in the market report. To know more, please request an analyst call or drop down your inquiry.
The key research methodology used by DBMR research team is data triangulation which involves data mining, analysis of the impact of data variables on the market and primary (industry expert) validation. Data models include Vendor Positioning Grid, Market Time Line Analysis, Market Overview and Guide, Company Positioning Grid, Patent Analysis, Pricing Analysis, Company Market Share Analysis, Standards of Measurement, Global versus Regional and Vendor Share Analysis. To know more about the research methodology, drop in an inquiry to speak to our industry experts.
可定制
Data Bridge Market Research is a leader in advanced formative research. We take pride in servicing our existing and new customers with data and analysis that match and suits their goal. The report can be customized to include price trend analysis of target brands understanding the market for additional countries (ask for the list of countries), clinical trial results data, literature review, refurbished market and product base analysis. Market analysis of target competitors can be analyzed from technology-based analysis to market portfolio strategies. We can add as many competitors that you require data about in the format and data style you are looking for. Our team of analysts can also provide you data in crude raw excel files pivot tables (Fact book) or can assist you in creating presentations from the data sets available in the report.