全球增强分析市场规模、份额和趋势分析报告 – 行业概况和 2031 年预测

请求目录 请求目录 与分析师交谈 与分析师交谈 立即购买 立即购买 购买前请咨询 提前咨询 免费样本报告 免费样本报告

全球增强分析市场规模、份额和趋势分析报告 – 行业概况和 2031 年预测

  • ICT
  • Upcoming Report
  • Oct 2024
  • Global
  • 350 页面
  • 桌子數: 220
  • 图号: 60

Global Augmented Analytics Market

市场规模(十亿美元)

CAGR :  % Diagram

Diagram Forecast Period
2024 –2031
Diagram Market Size (Base Year)
USD 17.95 Billion
Diagram Market Size (Forecast Year)
USD 148.27 Billion
Diagram CAGR
%
Diagram Major Markets Players
  • Dummy1
  • Dummy2
  • Dummy3
  • Dummy4
  • Dummy5

>全球增强分析市场细分,按组件(软件和服务)、组织规模(大型企业和中小型企业)、部署类型(云和本地)、垂直行业(银行、金融服务和保险、电信和 IT、零售和消费品、医疗保健和生命科学、制造业、政府和国防、能源和公用事业、运输和物流、媒体和娱乐等)– 行业趋势和预测到 2031 年

增强分析市场

增强分析市场分析

增强分析市场正在经历显著增长,这得益于机器学习、自然语言处理和数据可视化技术的进步。这些创新使用户能够更直观地分析大量数据集,从而减少对数据科学家的依赖。一种值得注意的方法是自动化数据准备,它简化了数据清理和集成过程,使组织能够更快地产生见解。

此外,先进的可视化工具有助于创建交互式仪表板,让用户能够动态探索数据。云解决方案的采用也在增加,因为它们具有可扩展性和灵活性,使各种规模的企业都可以使用增强分析。

医疗保健、金融和零售等行业正在利用这些技术来增强决策能力。例如,医疗保健提供商利用增强分析来识别患者趋势并提高护理质量,而零售商则分析消费者行为以制定个性化营销策略。

总体而言,增强分析的发展正在培育一种数据驱动的文化,使组织能够充分利用其数据资产的潜力并快速做出明智的决策。随着越来越多的企业认识到数据在推动战略计划方面的价值,这一趋势预计将持续下去。

增强分析市场规模

2023 年全球增强分析市场规模价值 179.5 亿美元,预计到 2031 年将达到 1482.7 亿美元,2024 年至 2031 年预测期内的复合年增长率为 30.20%。除了市场价值、增长率、细分市场、地理覆盖范围、市场参与者和市场情景等市场洞察外,Data Bridge 市场研究团队策划的市场报告还包括深入的专家分析、进出口分析、定价分析、生产消费分析和 pestle 分析。

增强分析市场趋势

“自助分析的激增”

One specific trend driving growth in the augmented analytics market is the proliferation of self-service analytics tools. Organizations are increasingly adopting these solutions to empower non-technical users to generate insights without relying on IT departments. For instance, In September 2023, Hadean, a British scale-up, partnered with BAE Systems to develop advanced digital technologies for military training. The collaboration utilizes a new enterprise license allowing BAE to integrate state-of-the-art AI and Large Language Models into the Hadean Platform for Defence. This partnership aims to provide military personnel with immersive, scalable, and interoperable collective training solutions, enhancing their readiness and effectiveness across various services and domains.

Report Scope and Augmented Analytics Market Segmentation         

Attributes

Augmented Analytics Key Market Insights

Segments Covered

  • By Component: Software and Services
  • By Organization Size: Large Enterprises and Small and Medium-Sized Enterprises
  • By Deployment Type: Cloud and On-Premise
  • By Vertical: Banking, Financial Services, and Insurance, Telecom and IT, Retail and Consumer Goods, Healthcare and Life Sciences, Manufacturing, Government and Defense, Energy and Utilities, Transportation and Logistics, Media and Entertainment, and Others

Countries Covered

U.S., Canada and Mexico in North America, Germany, France, U.K., Netherlands, Switzerland, Belgium, Russia, Italy, Spain, Turkey, Rest of Europe in Europe, China, Japan, India, South Korea, Singapore, Malaysia, Australia, Thailand, Indonesia, Philippines, Rest of Asia-Pacific (APAC) in the Asia-Pacific (APAC), Saudi Arabia, U.A.E, South Africa, Egypt, Israel, Rest of Middle East and Africa (MEA) as a part of Middle East and Africa (MEA), Brazil, Argentina and Rest of South America as part of South America

Key Market Players

Salesforce (U.S.), SAP SE (Germany), IBM Corporation (U.S.), Microsoft (U.S.), Oracle (U.S.), Tableau Software (U.S.), MicroStrategy Incorporated (U.S.), SAS Institute Inc. (U.S.), QlikTech (Qlik) (Sweden), TIBCO Software Inc. (U.S.), Sisense Inc. (U.S.), Yellowfin International (Australia), ThoughtSpot Inc. (U.S.), and Domo, Inc. (U.S.)

Market Opportunities

  • Integration of AI and Machine Learning
  • Integration with Existing Business Intelligence Tools

Value Added Data Infosets

In addition to the market insights such as market value, growth rate, market segments, geographical coverage, market players, and market scenario, the market report curated by the Data Bridge Market Research team includes in-depth expert analysis, import/export analysis, pricing analysis, production consumption analysis, and pestle analysis.

Augmented Analytics Market Definition

Augmented analytics is an advanced data analysis technique that leverages machine learning, artificial intelligence, and natural language processing to enhance data preparation, analysis, and visualization. It automates complex processes, enabling users to uncover insights more quickly and intuitively, even without extensive data expertise. By simplifying data interactions, augmented analytics empowers business users to ask questions, receive answers in real-time, and make data-driven decisions efficiently. This approach is transforming how organizations handle data, fostering a culture of self-service analytics and democratizing access to insights across various levels of the enterprise.

Augmented Analytics Market Dynamics

Drivers

  • Demand for Self-Service Analytics

The demand for self-service analytics is a significant driver of the augmented analytics market. Businesses are increasingly adopting tools that empower non-technical users to derive insights without heavy reliance on IT departments. Augmented analytics platforms, such as Tableau and Microsoft Power BI, offer intuitive interfaces and drag-and-drop functionalities, making data exploration accessible to all employees. For instance, in May 2024, Oracle and Accenture joined forces to accelerate the adoption of generative AI, focusing on innovative solutions that empower Chief Financial Officers (CFOs) with AI-driven financial planning and analysis tools. This collaboration aims to optimize operations, drive efficiency, and fuel growth within organizations. By integrating AI capabilities into financial strategies, Oracle and Accenture are enabling businesses to make more informed decisions based on real-time data insights.

  • Growth of Cloud-Based Solutions

The rise of cloud computing significantly drives the augmented analytics market by allowing organizations to adopt solutions with minimal upfront investments. Cloud-based platforms, such as Microsoft Azure and Google Cloud, provide scalable and flexible analytics tools that can be customized to meet varying business needs. For instance, in May 2024, IBM unveiled significant updates to its Watson X platform, enhancing its offerings with the release of a family of Granite models as open source. The launch also included InstructLab and new generative AI-powered data products, expanding the platform's capabilities. These updates aim to streamline AI development, allowing businesses to leverage advanced data analytics and artificial intelligence for improved decision-making and operational efficiency across various industries.

Opportunities

  • Integration of AI and Machine Learning

The integration of AI and machine learning in augmented analytics presents significant market opportunities. These technologies automate data preparation, visualization, and insights generation, making analytics more efficient and accessible. For instance, in July 2024, Qlik announced the general availability of Qlik Talend Cloud, a robust solution that integrates advanced artificial intelligence with reliable data foundations. This comprehensive offering aims to facilitate seamless and secure adoption of AI technologies across organizations at scale. By combining data integration and AI capabilities, Qlik Talend Cloud empowers businesses to leverage data-driven insights, enhancing decision-making processes and operational efficiency.

  • Integration with Existing Business Intelligence Tools

The integration of augmented analytics with existing business intelligence (BI) tools creates significant market opportunities. Many organizations utilize BI platforms such as Tableau, Power BI, or Qlik, and augmented analytics enhances these tools' capabilities by automating data preparation and analysis. For instance, in January 2023, Seerist Inc., a leader in augmented analytics for threat and security professionals, announced enhancements to its solution designed to elevate user experience. These new capabilities allow users to gain significant contextual intelligence, effectively filtering through data "noise" to extract meaningful insights. Furthermore, the updates enable organizations to customize the solution, targeting critical operational areas and enhancing their ability to respond to emerging threats and security challenges.

Restraints/Challenges

  • High Implementation Costs

High implementation costs significantly restrain the augmented analytics market, particularly for small to medium enterprises (SMEs). These organizations often face budget constraints that make it difficult to invest in advanced analytics tools and technologies. The initial costs associated with purchasing software, integrating systems, and training personnel can be prohibitive, leading to reluctance in adopting these solutions. In addition, ongoing maintenance and subscription fees can further strain limited budgets, deterring SMEs from investing in augmented analytics. As a result, the high financial barriers restrict market growth, limiting the widespread adoption of augmented analytics and preventing potential competitive advantages that such tools could provide.

  • Data Quality Issues

Data quality issues significantly hinder the augmented analytics market. The effectiveness of these tools relies heavily on the accuracy, completeness, and consistency of the underlying data. Poor data quality can lead to inaccurate insights, which may result in misguided business decisions and wasted resources. Consequently, organizations may become reluctant to adopt augmented analytics solutions, fearing that the potential risks outweigh the benefits. In addition, ongoing data maintenance and cleansing require substantial effort and resources, further complicating the implementation process. As businesses grapple with these challenges, the overall growth and adoption of the augmented analytics market may be severely impacted, limiting its potential benefits.

This market report provides details of new recent developments, trade regulations, import-export analysis, production analysis, value chain optimization, market share, impact of domestic and localized market players, analyses opportunities in terms of emerging revenue pockets, changes in market regulations, strategic market growth analysis, market size, category market growths, application niches and dominance, product approvals, product launches, geographic expansions, technological innovations in the market. To gain more info on the market contact Data Bridge Market Research for an Analyst Brief, our team will help you take an informed market decision to achieve market growth.

Augmented Analytics Market Scope

The market is segmented on the basis of components, organization size, deployment type and vertical. The growth amongst these segments will help you analyze meagre growth segments in the industries and provide the users with a valuable market overview and market insights to help them make strategic decisions for identifying core market applications.

Component

  • Software
  • Services
    • Training and Consulting Services
    • Deployment and Integration
    •  Support and Maintenance

 Organization Size

  • Large Enterprises
  • Small and Medium-Sized Enterprises

 Deployment Type

  • Cloud
  • On-Premise

 Vertical

  • Banking, Financial Services, and Insurance
  • Telecom and IT
  • Retail and Consumer Goods
  • Healthcare and Life Sciences
  • Manufacturing
  • Government and Defense
  • Energy and Utilities
  • Transportation and Logistics
  • Media and Entertainment
  • Others

Augmented Analytics Market Regional Analysis

The market is analyzed and market size insights and trends are provided by components, organization size, deployment type and vertical as referenced above.

市场报告涉及的国家包括北美洲的美国、加拿大、墨西哥、德国、瑞典、波兰、丹麦、意大利、英国、法国、西班牙、荷兰、比利时、瑞士、土耳其、俄罗斯、欧洲的其他地区、欧洲的日本、中国、印度、韩国、新西兰、越南、澳大利亚、新加坡、马来西亚、泰国、印度尼西亚、菲律宾、亚太地区 (APAC) 的其他地区、巴西、阿根廷、南美洲的其他地区(南美洲的一部分)、阿联酋、沙特阿拉伯、阿曼、卡塔尔、科威特、南非、中东和非洲 (MEA) 的其他地区(中东和非洲 (MEA) 的一部分)。

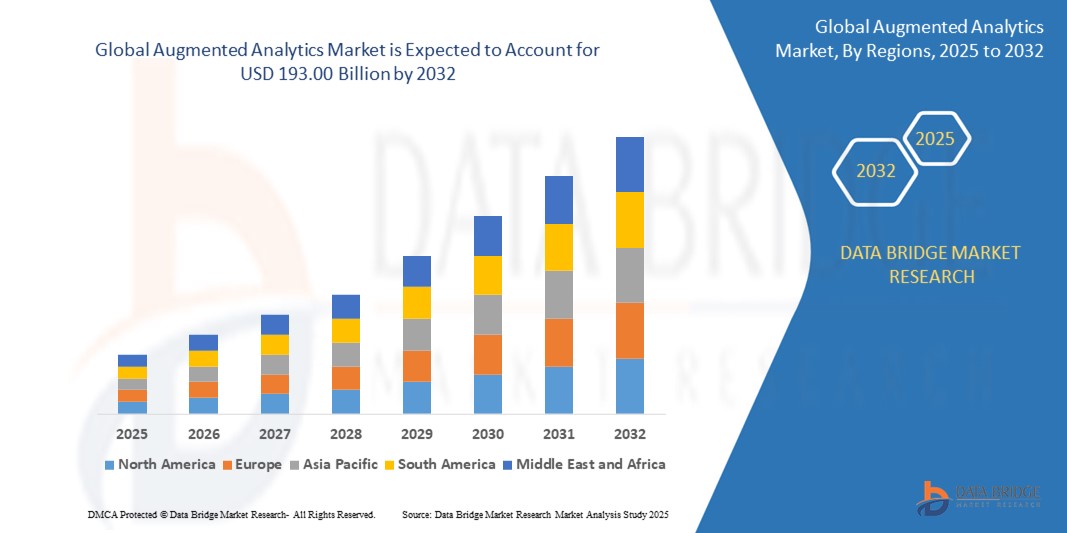
由于自然语言处理 (NLP)、机器学习 (ML) 以及智能数据准备和发现等高级分析解决方案和实践的初步采用和创新举措,北美预计将在增强分析市场中占据主导地位。此外,在预测期内,增强分析市场在商业智能中的应用不断增长,将进一步推动该地区增强分析市场的增长。

由于数据发现的应用,亚太地区的增强分析市场预计将出现大幅增长。此外,商业智能工具的日益普及预计将在未来几年进一步推动该地区增强分析市场的增长。

报告的国家部分还提供了影响市场当前和未来趋势的各个市场影响因素和市场监管变化。下游和上游价值链分析、技术趋势和波特五力分析、案例研究等数据点是用于预测各个国家市场情景的一些指标。此外,在提供国家数据的预测分析时,还考虑了全球品牌的存在和可用性以及它们因来自本地和国内品牌的大量或稀缺竞争而面临的挑战、国内关税和贸易路线的影响。

增强分析市场份额

市场竞争格局按竞争对手提供详细信息。详细信息包括公司概况、公司财务状况、产生的收入、市场潜力、研发投资、新市场计划、全球影响力、生产基地和设施、生产能力、公司优势和劣势、产品发布、产品宽度和广度、应用主导地位。以上提供的数据点仅与公司对市场的关注有关。

在市场上运营的增强分析市场领导者是:

  • Salesforce(美国)
  • SAP SE(德国)
  • IBM 公司(美国)
  • 微软 (美国)
  • 甲骨文 (美国)
  • Tableau 软件(美国)
  • MicroStrategy Incorporated(美国)
  • SAS Institute Inc.(美国)
  • QlikTech (Qlik) (瑞典)
  • TIBCO Software Inc.(美国)
  • Sisense Inc.(美国)
  • Yellowfin International(澳大利亚)
  • ThoughtSpot Inc.(美国)
  • Domo, Inc.(美国)

增强分析市场的最新发展

  • 2024 年 4 月,Cloud Software Group, Inc. 与微软达成了为期八年的战略合作伙伴关系,并承诺投资 16.5 亿美元巩固双方的合作。此次合作旨在增强微软的云和 AI 产品,旨在提供创新的联合解决方案,为超过 1 亿用户带来积极影响。通过专注于生成 AI,此次合作旨在改变组织利用云技术和数据分析的方式
  • 2024 年 5 月,甲骨文和埃森哲联手加速采用生成式人工智能,重点关注创新解决方案,为首席财务官 (CFO) 提供人工智能驱动的财务规划和分析工具。此次合作旨在优化运营、提高效率并促进组织内部增长。通过将人工智能功能集成到财务战略中,甲骨文和埃森哲使企业能够根据实时数据洞察做出更明智的决策
  • 2024 年 5 月,IBM 发布了其 Watson X 平台的重大更新,通过发布一系列开源 Granite 模型增强了其产品。此次发布还包括 InstructLab 和新的生成式 AI 数据产品,扩展了该平台的功能。这些更新旨在简化 AI 开发,使企业能够利用高级数据分析和人工智能来提高各个行业的决策能力和运营效率
  • 2024 年 3 月,SAP 和 NVIDIA 宣布扩大合作伙伴关系,以加速将生成式 AI 集成到 SAP 的云解决方案中。此次合作利用了 NVIDIA 在大规模提供 AI 功能方面的专业知识,帮助企业客户采用变革性技术。通过利用先进的 AI 功能增强 SAP 的云产品,该合作伙伴关系旨在推动创新并改进业务流程,使公司能够充分利用其数据的潜力
  • 2023 年 8 月,Qlik 凭借其创新解决方案入选 Constellation ShortLists 的两项大奖:Qlik AutoML 人工智能和机器学习,以及 Qlik Sense 增强型 BI 和分析。这些荣誉凸显了 Qlik 致力于帮助早期采用者和快速跟随者实现数字化转型。通过提供尖端技术和服务,Qlik 使组织能够做出数据驱动的决策并有效增强其分析能力
  • 2023 年 9 月,英国企业 Hadean 与 BAE Systems 合作开发用于军事训练的先进数字技术。此次合作采用了新的企业许可证,允许 BAE 将最先进的 AI 和大型语言模型集成到 Hadean 国防平台中。此次合作旨在为军事人员提供沉浸式、可扩展且可互操作的集体训练解决方案,提高他们在各个军种和领域的战备能力和效率
  • 2023 年 5 月,TrinityLife Sciences 和 WhizAI 宣布建立战略合作伙伴关系,旨在彻底改变生命科学公司的 AI 驱动洞察。此次合作使组织能够快速高效地生成和共享增强分析。WhizAI 的技术可以与 Trinity 的企业报告平台无缝集成,为利益相关者提供可操作的洞察。此次合作的最终目的是增强决策流程并提高生命科学和医疗保健领域的运营效率


SKU-

Get online access to the report on the World's First Market Intelligence Cloud

  • Interactive Data Analysis Dashboard
  • Company Analysis Dashboard for high growth potential opportunities
  • Research Analyst Access for customization & queries
  • Competitor Analysis with Interactive dashboard
  • Latest News, Updates & Trend analysis
  • Harness the Power of Benchmark Analysis for Comprehensive Competitor Tracking
Request for Demo

研究方法

Data collection and base year analysis are done using data collection modules with large sample sizes. The stage includes obtaining market information or related data through various sources and strategies. It includes examining and planning all the data acquired from the past in advance. It likewise envelops the examination of information inconsistencies seen across different information sources. The market data is analysed and estimated using market statistical and coherent models. Also, market share analysis and key trend analysis are the major success factors in the market report. To know more, please request an analyst call or drop down your inquiry.

The key research methodology used by DBMR research team is data triangulation which involves data mining, analysis of the impact of data variables on the market and primary (industry expert) validation. Data models include Vendor Positioning Grid, Market Time Line Analysis, Market Overview and Guide, Company Positioning Grid, Patent Analysis, Pricing Analysis, Company Market Share Analysis, Standards of Measurement, Global versus Regional and Vendor Share Analysis. To know more about the research methodology, drop in an inquiry to speak to our industry experts.

可定制

Data Bridge Market Research is a leader in advanced formative research. We take pride in servicing our existing and new customers with data and analysis that match and suits their goal. The report can be customized to include price trend analysis of target brands understanding the market for additional countries (ask for the list of countries), clinical trial results data, literature review, refurbished market and product base analysis. Market analysis of target competitors can be analyzed from technology-based analysis to market portfolio strategies. We can add as many competitors that you require data about in the format and data style you are looking for. Our team of analysts can also provide you data in crude raw excel files pivot tables (Fact book) or can assist you in creating presentations from the data sets available in the report.

Frequently Asked Questions

North America region holds the largest share in the market.
The countries covered in the augmented analytics market report are the U.S., Canada, and Mexico in North America, Brazil, Argentina, and the rest of South America as part of South America, Germany, Italy, U.K., France, Spain, Netherlands, Belgium, Switzerland, Turkey, Russia, Rest of Europe in Europe, Japan, China, India, South Korea, Australia, Singapore, Malaysia, Thailand, Indonesia, Philippines, Rest of Asia-Pacific (APAC) in the Asia-Pacific (APAC), Saudi Arabia, U.A.E, South Africa, Egypt, Israel, Rest of Middle East and Africa (MEA) as a part of the Middle East and Africa (MEA).
Major players operating in the augmented analytics market are Salesforce, SAP Analytics Cloud, IBM Corporation, Microsoft, Oracle, TABLEAU SOFTWARE, MicroStrategy Incorporated, SAS Institute Inc., QlikTech, TIBCO Software Inc., Sisense Inc., Information Builders, Yellowfin International, ThoughtSpot Inc., and Domo, Inc.