全球人工血液替代品市场 – 行业趋势及 2030 年预测

请求目录 请求目录 与分析师交谈 与分析师交谈 立即购买 立即购买 购买前请咨询 提前咨询 免费样本报告 免费样本报告

全球人工血液替代品市场 – 行业趋势及 2030 年预测

  • Healthcare
  • Upcoming Report
  • Dec 2023
  • Global
  • 350 页面
  • 桌子數: 220
  • 图号: 60

Global Artificial Blood Substitutes Market

市场规模(十亿美元)

CAGR :  % Diagram

Diagram Forecast Period
2023 –2030
Diagram Market Size (Base Year)
USD 6.67 Million
Diagram Market Size (Forecast Year)
USD 29.24 Million
Diagram CAGR
%
Diagram Major Markets Players
  • Aurum Biosciences
  • HEMARINA
  • Hemoglobin Oxygen Therapeutics LLC
  • KaloCyte
  • SpheriTech

全球人工血液替代品市场,按产品类型(全氟碳 (PFC)、基于血红蛋白的氧载体 (HBOC))、来源(人血、动物血、基于微生物的重组 HB、合成聚合物、干细胞)、应用(心血管疾病、恶性肿瘤、损伤、新生儿疾病、器官移植、产妇疾病)、最终用户(医院和诊所、血库、其他)划分 - 行业趋势和预测到 2030 年。

人造血液替代品市场

人工血液替代品市场分析及规模

人造血液用于创伤失血后恢复氧气输送,特别是在紧急情况和战场情况下,从而避免手术期间输血的需要。它是一种替代血液产品,可以发挥血液最重要的功能,即输送氧气和二氧化碳。人造血液可以成为一种救命措施,特别是在大型灾难期间严重失血时;然而,目前正在开发的产品无法发挥血液的次要功能,例如抗击感染。

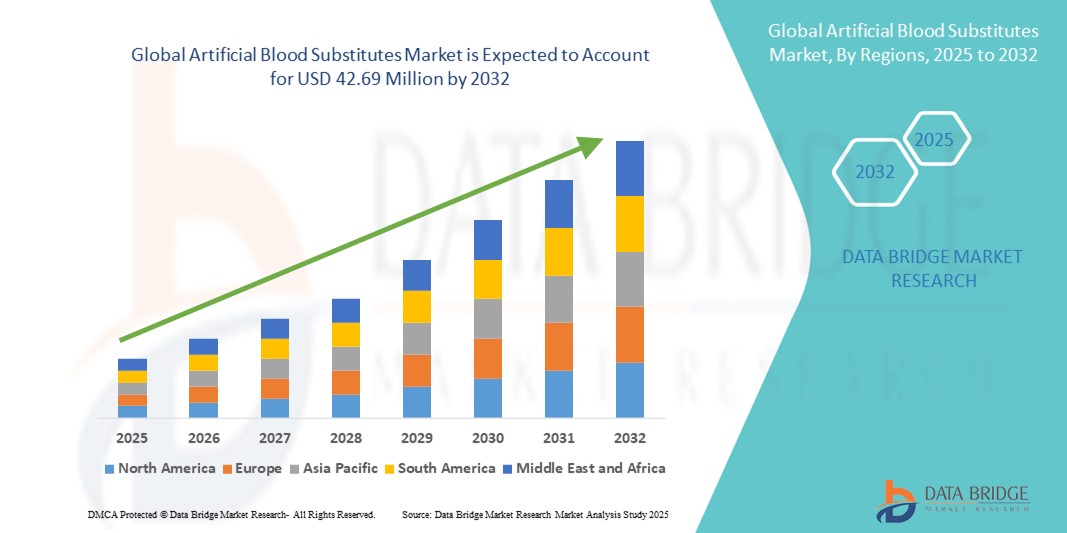
Data Bridge Market Research 分析称,全球人造血液替代品市场在 2022 年为 667 万美元,预计到 2030 年将达到 2924 万美元,预测期内复合年增长率可能达到 20.4%。由于对更好的诊断和治疗方法的需求不断增长,“医院和诊所”在全球人造血液替代品市场的终端用户细分市场中占据主导地位。除了对市场价值、增长率、细分、地理覆盖范围和主要参与者等市场情景的洞察外,Data Bridge Market Research 整理的市场报告还包括深度专家分析、患者流行病学、渠道分析、定价分析和监管框架。

报告范围和市场细分

报告指标

细节

预测期

2023 至 2030 年

基准年

2022

历史岁月

2021 (可定制为 2016-2020)

定量单位

收入(百万美元)、销量(单位)、定价(美元)

涵盖的领域

按产品类型(全氟碳 (PFCs)、血红蛋白基氧载体 (HBOCs))、来源(人血、动物血、基于微生物的重组 HB、合成聚合物、干细胞)、应用(心血管疾病、恶性肿瘤、损伤、新生儿疾病、器官移植、产妇疾病)、最终用户(医院和诊所、血库、其他)

覆盖国家

北美的美国、加拿大和墨西哥、德国、法国、英国、荷兰、瑞士、比利时、俄罗斯、意大利、西班牙、土耳其、欧洲其他地区、中国、日本、印度、韩国、新加坡、马来西亚、澳大利亚、泰国、印度尼西亚、菲律宾、亚太其他地区、沙特阿拉伯、阿联酋、南非、埃及、以色列、中东和非洲其他地区、巴西、阿根廷和南美洲其他地区

涵盖的市场参与者

Aurum Biosciences(英国)、HEMARINA(法国)、Hemoglobin Oxygen Therapeutics LLC(美国)、KaloCyte Inc.(美国)、SpheriTech Ltd.(英国)、Centrum Medyczne VisusMed(波兰)、欧洲药品管理局(荷兰)、OPK Biotech Inc.(美国)、NuvOx Pharma(美国)、Prolong Pharmaceuticals, LLC(美国)、Boston Pharmaceuticals(美国)、OXYVITA Inc(美国)、NanoBlood LLC(美国)

市场机会

  • 由于道路交通事故发生率上升,对人工血液替代品的需求不断增加
  • 人们对人造血液替代品益处的认识不断提高
  • 输血手术的技术进步


市场定义

氧疗法或基于血红蛋白的氧载体是人造血液替代品的另一种说法。它用于模拟生物血液的功能并提供输血的替代方案。人造血液用于替代库存红细胞的输血,旨在克服诸如缺乏献血者、高污染风险和需要交叉配血等限制。同种异体输血具有多种风险,包括传染病传播、输血反应、输血相关急性肺损伤、术后伤口愈合延迟、免疫调节和癌症复发风险。它有望成为一种新型的、挽救生命的医疗方法。

全球人工血液替代品市场动态

驱动程序

  • 人造血液替代品的使用不断增加

动物血液、人类血液、微生物、重组血红蛋白、干细胞和其他来源都可用于制造人造血液。人造血液比人类血液具有多种优势,因为它属于通用血型,无论何种血型都可以给患者使用。人造血液替代品也不会引起任何免疫反应。此外,人造血液替代品消除了输血过程中感染疾病或污染的风险,并且比人类血液具有更长的保质期,因为它可以在室温下保存 3 年或更长时间,而人类血液的保质期为 42 天。人造血液可用于紧急情况,并且易于储存。对于因宗教信仰而不接受献血的患者来说,它也是一个很好的选择。这些都是推动市场增长的某些因素。

  • 人们对人造血液益处的认识不断提高

人们对人造血液益处的认识不断提高,对人造血液的需求不断增加,再加上献血者数量不足,这些因素推动了市场的增长。制造血液替代品时,细菌和病毒可以被消灭。这降低了输血时感染传染病的风险,而输血是撒哈拉以南非洲许多地区的主要问题。人造血液研究和开发的增加正在推动全球人造血液替代品市场的发展。

机会

  • 外科手术数量不断增加

越来越多的外科手术需要使用人造血液替代品来代替捐献的人体血浆或红细胞。政府和私人组织增加了对人造血液替代品研究的资助,这很可能导致创新和新产品的推出。

限制/挑战

  • 人造血液替代品成本高昂

人造血液替代品的高成本以及新兴和欠发达国家的低采用率将阻碍市场的增长。例如,大多数基于血红蛋白的产品在体内只能维持 20-30 小时。相比之下,全血输血可以维持 34 天。此外,这些血液替代品无法模拟血液对抗疾病和凝血的能力。

本人造血液代用品市场报告详细介绍了最新发展、贸易法规、进出口分析、生产分析、价值链优化、市场份额、国内和本地市场参与者的影响,分析了新兴收入来源、市场法规变化、战略市场增长分析、市场规模、类别市场增长、应用领域和主导地位、产品批准、产品发布、地域扩展、市场技术创新等方面的机会。如需了解有关人造血液代用品市场的更多信息,请联系 Data Bridge Market Research 获取分析师简报,我们的团队将帮助您做出明智的市场决策,实现市场增长。

最新动态

  • 2020 年 11 月,Hemarina 发表了一篇关于 M 101(一种用于治疗牙周炎的氧气转运蛋白)的抗炎和抗菌特性的科学报告。这项研究验证了源自海洋沙蚕血红蛋白的 M 101 分子的质量
  • 2020 年 6 月,KaloCyte, Inc. 获得了马里兰大学系统 (USM) 动力基金的 30 万美元资助,用于开发 ErythroMer,这是一种合成的、仿生的红血球替代品。这笔资金使该公司能够加速开发 ErythroMer
  • 2020 年 5 月,KaloCyte, Inc. 获得了美国国立卫生研究院 (NIH) 颁发的 373,000 美元小企业创新研究 (SBIR) 第一阶段资助。这笔资助帮助该公司推进 KaloCyte 产品的临床前安全性和有效性测试,为上市做准备

全球人工血液替代品市场范围

人造血液替代品市场根据产品类型、来源、应用和最终用户进行细分。这些细分市场之间的增长情况将帮助您分析行业中增长缓慢的细分市场,并为用户提供有价值的市场概览和市场洞察,帮助他们做出战略决策,确定核心市场应用。

产品类型

  • 全氟碳 (PFC)
  • 血红蛋白携氧系统 (HBOC)

 来源

  • 人类血液
  • 动物血
  • 基于微生物的重组乙肝病毒
  • 合成聚合物和干细胞

 应用

  • 心血管疾病
  • 恶性肿瘤
  • 受伤
  • 新生儿疾病
  • 器官移植和产妇状况

 最终用户

  • 医院和诊所
  • 血库
  • 其他的

 全球人工血液替代品市场区域分析/见解

对人工血液替代品市场进行了分析,并按国家、产品类型、来源、应用和最终用户提供了市场规模洞察和趋势。

人工血液替代品市场报告涉及的国家包括北美洲的美国、加拿大和墨西哥、欧洲的德国、法国、英国、荷兰、瑞士、比利时、俄罗斯、意大利、西班牙、土耳其、欧洲其他地区、亚太地区 (APAC) 的中国、日本、印度、韩国、新加坡、马来西亚、澳大利亚、泰国、印度尼西亚、菲律宾、亚太地区 (APAC) 的其他地区、中东和非洲 (MEA) 的其他地区、南美洲的巴西、阿根廷和南美洲的其他地区。

由于道路交通事故发生率上升、慢性病发病率上升以及因医疗状况而进行的手术增加等因素,预计北美将主导人工血液替代品市场。

预计亚太地区将在 2022 年至 2029 年的预测期内实现最高增长率,原因是糖尿病病例增加,以及与糖尿病视网膜病变导致失明而导致的眼科手术相关的手术增加等因素,而这些都是该地区使用的 HBOC 的主要应用。

报告的国家部分还提供了影响单个市场因素和国内市场监管变化,这些因素和变化会影响市场的当前和未来趋势。下游和上游价值链分析、技术趋势和波特五力分析、案例研究等数据点是用于预测单个国家市场情景的一些指标。此外,在提供国家数据的预测分析时,还考虑了全球品牌的存在和可用性以及它们因来自本地和国内品牌的激烈或稀缺竞争而面临的挑战、国内关税和贸易路线的影响。

竞争格局和全球人工血液替代品市场份额分析

人造血液替代品市场竞争格局按竞争对手提供详细信息。详细信息包括公司概况、公司财务状况、收入、市场潜力、研发投资、新市场计划、全球影响力、生产基地和设施、生产能力、公司优势和劣势、产品发布、产品宽度和广度、应用主导地位。以上提供的数据点仅与公司对人造血液替代品市场的关注有关。

人工血液替代品市场的一些主要参与者包括:

  • Aurum Biosciences(英国)
  • HEMARINA(法国)
  • 血红蛋白氧治疗公司 (美国)
  • KaloCyte Inc.(美国)
  • SpheriTech Ltd.(英国)
  • Centrum Medyczne VisusMed(波兰)
  • 欧洲药品管理局(荷兰)
  • OPK Biotech Inc.(美国)
  • NuvOx Pharma(美国)
  • Prolong Pharmaceuticals, LLC(美国)
  • 波士顿制药公司(美国)
  • OXYVITA Inc(美国)
  • NanoBlood LLC(美国)


SKU-

Get online access to the report on the World's First Market Intelligence Cloud

  • Interactive Data Analysis Dashboard
  • Company Analysis Dashboard for high growth potential opportunities
  • Research Analyst Access for customization & queries
  • Competitor Analysis with Interactive dashboard
  • Latest News, Updates & Trend analysis
  • Harness the Power of Benchmark Analysis for Comprehensive Competitor Tracking
Request for Demo

目录

  1. introduction
    1. OBJECTIVES OF THE STUDY
    2. MARKET DEFINITION
    3. OVERVIEW OF GLOBAL ARTIFICIAL BLOOD SUBSTITUTES MARKET
    4. LIMITATIONS
    5. MARKETS COVERED
  2. MARKET SEGMENTATION
    1. MARKETS COVERED
    2. geographical scope
    3. years considered for the study
    4. Currency and pricing
    5. DBMR TRIPOD DATA VALIDATION MODEL
    6. primary interviews with key opinion leaders
    7. MULTIVARIATE MODELLING
    8. PRODUCT TYPE LIFELINE CURVE
    9. DBMR MARKET POSITION GRID
    10. market APPLICATION coverage grid
    11. vendor share analysis
    12. secondary sourcEs
    13. assumptions
  3. EXECUTIVE SUMMARY
  4. PREMIUM INSIGHTS
  5. PATENT ANALYSIS OF GLOBAL ARTIFICIAL BLOOD SUBSTITUTES MARKET
    1. DBMR ANALYSIS
    2. COUNTRY-LEVEL ANALYSIS
    3. YEARWISE ANALYSIS
  6. GLOBAL ARTIFICIAL BLOOD SUBSTITUTES MARKET: PIPELINE ANALYSIS
  7. Market Overview
    1. drivers
      1. IncreasE IN demand for blood transfusion
      2. Increased funding for product development
      3. rise in blood-related disorders and trauma cases
      4. limited availability of fresh blood and small storage periods of fresh blood
    2. Restraints
      1. stringent regulatory approval process
      2. high-cost production of artificial blood substitute
      3. unawareness about the artificial blood substitutes
    3. OPPORTUNITIES
      1. increase in awareness regarding the advantages of artificial blood over human blood
      2. risE IN demand for blood substituteS and insufficient number of blood donors
      3. RISE IN number of research & developments on artificial blood
      4. ample amount of sources for production of artificial blood substitute
    4. Challenges
      1. instability of artificial blood product
      2. extended clinical trails
      3. side effects of artificial blood substitutes
  8. IMPACT OF COVID-19 ON THE GLOBAL ARTIFICIAL BLOOD SUBSTITUTES MARKET
    1. Aftermath of COVID-19
    2. Impact on Supply and Demand
    3. The increasing demand for blood transfusion is leading the artificial blood substitutes market.
    4. Conclusion
  9. Global Artificial blood substitutes market, by Product Type
    1. overview
    2. Hemoglobin-Based Oxygen Carries (HBOCS)
      1. oxyglobin
      2. hemopure
    3. Perfluorocarbon (PFCS)
      1. perftoran
      2. others
  10. Global Artificial blood substitutes market, by Source
    1. overview
    2. animal blood
    3. Human Blood
    4. Microorganism Based Recombinant Hb
    5. Stem Cells
    6. Synthetic Polymers
  11. Global Artificial blood substitutes market, by Application
    1. overview
    2. injuries
    3. Cardiovascular Diseases
    4. Organ Transplant
    5. Maternal Condition
    6. Malignant Neoplasma
    7. Neonatal Conditions
  12. Global Artificial blood substitutes market, by End user
    1. overview
    2. hospital and clinics
    3. blood banks
    4. others
  13. Global Artificial blood SUBSTITUTEs MARKET, by Region
    1. Overview
    2. NORTH AMERICA
      1. U.S.
      2. MEXICO
    3. Middle East & Africa
      1. South Africa
      2. Rest Of Middle East & Africa
    4. EUROPE
      1. FRANCE
      2. RUSSIA
      3. NETHERLAND
      4. U.K.
      5. REST OF EUROPE
    5. asia-pacific
      1. China
      2. Rest Of asia-pacific
  14. global artificial blood substitutes market: COMPANY landscape
    1. company share analysis: Global
    2. global artificial blood substitutes market: company share 2020 (%)
    3. company share analysis: North America
    4. North America artificial blood substitutes market: company share 2020 (%)
    5. company share analysis: Europe
    6. Europe artificial blood substitutes market: company share 2020 (%)
  15. swot
  16. company profile
    1. kalocyte, inc.
      1. COMPANY SNAPSHOT
      2. Company sahre Analysis
      3. PRODUCT PORTFOLIo
      4. RECENT DEVELOPMENTS
    2. hemarina
      1. COMPANY SNAPSHOT
      2. company share analysis
      3. PRODUCT PORTFOLIo
      4. RECENT DEVELOPMENTS
    3. hemoglobin oxygen therapeutics llc
      1. COMPANY SNAPSHOT
      2. company share analysis
      3. PRODUCT PORTFOLIo
      4. RECENT DEVELOPMENTS
    4. llc “visusmed”
      1. COMPANY SNAPSHOT
      2. company share analysis
      3. PRODUCT PORTFOLIo
      4. RECENT DEVELOPMENT
    5. European Medicines Agency
      1. COMPANY SNAPSHOT
      2. Revenue Analysis
      3. company share analysis
      4. PRODUCT PORTFOLIo
      5. RECENT DEVELOPMENT
    6. aurum biosciences
      1. COMPANY SNAPSHOT
      2. PRODUCT PORTFOLIo
      3. RECENT DEVELOPMENTS
    7. boston therapeutics, inc.
      1. COMPANY SNAPSHOT
      2. Revenue Analysis
      3. PRODUCT PORTFOLIo
      4. RECENT DEVELOPMENT
    8. nanoblood llc
      1. COMPANY SNAPSHOT
      2. PRODUCT PORTFOLIo
      3. RECENT DEVELOPMENT
    9. nuvox pharma
      1. COMPANY SNAPSHOT
      2. PRODUCT PORTFOLIo
      3. RECENT DEVELOPMENTS
    10. opk biotech llc
      1. COMPANY SNAPSHOT
      2. PRODUCT PORTFOLIo
      3. RECENT DEVELOPMENT
    11. oxyvita inc
      1. COMPANY SNAPSHOT
      2. PRODUCT PORTFOLIo
      3. RECENT DEVELOPMENT
    12. prolong pharmaceuticals, llc
      1. COMPANY SNAPSHOT
      2. PRODUCT PORTFOLIo
      3. RECENT DEVELOPMENT
  17. questionnaire
  18. related reports

表格列表

TABLE 1 global Artificial blood substitutes Market, Product Type, 2019-2028 (USD Thousand)

TABLE 2 global Hemoglobin-Based Oxygen Carries (HBOCS) in Artificial blood substitutes Market, by region, 2019-2028 (USD Thousand)

TABLE 3 global HEMOGLOBIN-based oxygen carriers (HBOCs) in Artificial blood substitutes Market, by Product Type, 2019-2028 (USD Thousand)

TABLE 4 global Perfluorocarbon (PFCS) in Artificial blood substitutes Market, by region, 2019-2028 (USD Thousand)

TABLE 5 global Perfluorocarbon (PFCS) in Artificial blood substitutes Market, by Product Type, 2019-2028 (USD Thousand)

TABLE 6 global Artificial blood substitutes Market, by Source, 2019-2028 (USD Thousand)

TABLE 7 global animal blood in Artificial blood substitutes Market, by region, 2019-2028 (USD Thousand)

TABLE 8 global human blood in Artificial blood substitutes Market, by region, 2019-2028 (USD Thousand)

TABLE 9 global microorganism based recombinant hb in Artificial blood substitutes Market, by region, 2019-2028 (USD Thousand)

TABLE 10 global stem cells in Artificial blood substitutes Market, by region, 2019-2028 (USD Thousand)

TABLE 11 global synthetic polymers in Artificial blood substitutes Market, by region, 2019-2028 (USD Thousand)

TABLE 12 global Artificial blood substitutes Market, by Application, 2019-2028 (USD Thousand)

TABLE 13 global injuries in Artificial blood substitutes Market, by region, 2019-2028 (USD Thousand)

TABLE 14 global cardiovascular diseases in Artificial blood substitutes Market, by region, 2019-2028 (USD Thousand)

TABLE 15 global organ transplant in Artificial blood substitutes Market, by region, 2019-2028 (USD Thousand)

TABLE 16 global maternal condition in Artificial blood substitutes Market, by region, 2019-2028 (USD Thousand)

TABLE 17 global malignant neoplasma in Artificial blood substitutes Market, by region, 2019-2028 (USD Thousand)

TABLE 18 global neonatal conditions in Artificial blood substitutes Market, by region, 2019-2028 (USD Thousand)

TABLE 19 global Artificial blood substitutes Market, by End user, 2019-2028 (USD Thousand)

TABLE 20 global hospitals and clinics in Artificial blood substitutes Market, by region, 2019-2028 (USD Thousand)

TABLE 21 global blood banks in Artificial blood substitutes Market, by region, 2019-2028 (USD Thousand)

TABLE 22 global others in Artificial blood substitutes Market, by region, 2019-2028 (USD Thousand)

TABLE 23 GLOBAL Artificial blood substitutes MARKET, BY REGION, 2021-2028 (USD THOUSAND)

TABLE 24 North AMERICA Artificial blood substitutes Market, By country, 2019-2028 (USD Thousand)

TABLE 25 NORTH AMERICA Artificial blood substitutes Market, By Product type, 2019-2028 (USD Thousand)

TABLE 26 North America Hemoglobin-Based Oxygen Carries (HBOCS) In Artificial Blood Substitutes Market, By Product Type, 2019-2028 (USD Thousand)

TABLE 27 North America Perfluorocarbon (PFCS) In Artificial Blood Substitutes Market, By Product Type, 2019-2028 (USD Thousand)

TABLE 28 North America Artificial Blood Substitutes Market, By Source, 2019-2028 (USD Thousand)

TABLE 29 North America Artificial Blood Substitutes Market, By Application, 2019-2028 (USD Thousand)

TABLE 30 North America Artificial Blood Substitutes Market, By End User, 2019-2028 (USD Thousand)

TABLE 31 U.S. Artificial blood substitutes Market, By Product type, 2019-2028 (USD Thousand)

TABLE 32 U.S. Hemoglobin-Based Oxygen Carries (HBOCS) In Artificial Blood Substitutes Market, By Product Type, 2019-2028 (USD Thousand)

TABLE 33 U.S. Perfluorocarbon (PFCS) In Artificial Blood Substitutes Market, By Product Type, 2019-2028 (USD Thousand)

TABLE 34 U.S. Artificial Blood Substitutes Market, By Source, 2019-2028 (USD Thousand)

TABLE 35 U.S. Artificial Blood Substitutes Market, By Application, 2019-2028 (USD Thousand)

TABLE 36 U.S. Artificial Blood Substitutes Market, By End User, 2019-2028 (USD Thousand)

TABLE 37 MEXICO Artificial blood substitutes Market, By Product type, 2019-2028 (USD Thousand)

TABLE 38 MEXICO Hemoglobin-Based Oxygen Carries (HBOCS) In Artificial Blood Substitutes Market, By Product Type, 2019-2028 (USD Thousand)

TABLE 39 MEXICO Perfluorocarbon (PFCS) In Artificial Blood Substitutes Market, By Product Type, 2019-2028 (USD Thousand)

TABLE 40 MEXICO Artificial Blood Substitutes Market, By Source, 2019-2028 (USD Thousand)

TABLE 41 MEXICO Artificial Blood Substitutes Market, By Application, 2019-2028 (USD Thousand)

TABLE 42 MEXICO Artificial Blood Substitutes Market, By End User, 2019-2028 (USD Thousand)

TABLE 43 Middle East & Africa artificial blood substitutes market, By COUNTRY, 2019-2028 (USD Thousand)

TABLE 44 Middle East & Africa artificial blood substitutes market, By product type, 2019-2028 (USD thousand)

TABLE 45 Middle East & Africa Hemoglobin-based oxygen carriers (HBOCs) in artificial blood substitutes market, By product type, 2019-2028 (USD thousand)

TABLE 46 Middle East & Africa perfluorocarbon (pfcs) in artificial blood substitutes market, By product type, 2019-2028 (USD thousand)

TABLE 47 Middle East & Africa artificial blood substitutes market, By Source, 2019-2028 (USD thousand)

TABLE 48 Middle East & Africa artificial blood substitutes market, By application, 2019-2028 (USD thousand)

TABLE 49 Middle East & Africa artificial blood substitutes market, By end user, 2019-2028 (USD thousand)

TABLE 50 South Africa artificial blood substitutes market, By product type, 2019-2028 (USD thousand)

TABLE 51 South Africa Hemoglobin-based oxygen carriers (HBOCs) in artificial blood substitutes market, By product type, 2019-2028 (USD thousand)

TABLE 52 South Africa perfluorocarbon (pfcs) in artificial blood substitutes market, By product type, 2019-2028 (USD thousand)

TABLE 53 South Africa artificial blood substitutes market, By Source, 2019-2028 (USD thousand)

TABLE 54 South Africa artificial blood substitutes market, By application, 2019-2028 (USD thousand)

TABLE 55 South Africa artificial blood substitutes market, By end user, 2019-2028 (USD thousand)

TABLE 56 rest of Middle East & Africa artificial blood substitutes market, By product type, 2019-2028 (USD thousand)

TABLE 57 Europe artificial blood substitute Market, By COUNTRY, 2019-2028 (USD Thousand)

TABLE 58 EUROPE artificial blood substitute Market, By Product type, 2019-2028 (USD Thousand)

TABLE 59 Europe Hemoglobin-Based Oxygen Carries (HBOCS) In artificial Blood Substitute Market, By Product Type, 2019-2028 (USD Thousand)

TABLE 60 Europe Perfluorocarbon (PFCS) In artificial Blood Substitute Market, By Product Type, 2019-2028 (USD Thousand)

TABLE 61 Europe artificial Blood Substitute Market, By Source, 2019-2028 (USD Thousand)

TABLE 62 Europe artificial Blood Substitute Market, By Application, 2019-2028 (USD Thousand)

TABLE 63 Europe artificial Blood Substitute Market, By End User, 2019-2028 (USD Thousand)

TABLE 64 FRANCE artificial blood substitute Market, By Product type, 2019-2028 (USD Thousand)

TABLE 65 FRANCE Hemoglobin-Based Oxygen Carries (HBOCS) In artificial Blood Substitute Market, By Product Type, 2019-2028 (USD Thousand)

TABLE 66 FRANCE Perfluorocarbon (PFCS) In artificial Blood Substitute Market, By Product Type, 2019-2028 (USD Thousand)

TABLE 67 FRANCE artificial Blood Substitute Market, By Source, 2019-2028 (USD Thousand)

TABLE 68 FRANCE artificial Blood Substitute Market, By Application, 2019-2028 (USD Thousand)

TABLE 69 FRANCE artificial Blood Substitute Market, By End User, 2019-2028 (USD Thousand)

TABLE 70 RUSSIA artificial blood substitute Market, By Product type, 2019-2028 (USD Thousand)

TABLE 71 RUSSIA Hemoglobin-Based Oxygen Carries (HBOCS) In artificial Blood Substitute Market, By Product Type, 2019-2028 (USD Thousand)

TABLE 72 RUSSIA Perfluorocarbon (PFCS) In artificial Blood Substitute Market, By Product Type, 2019-2028 (USD Thousand)

TABLE 73 RUSSIA artificial Blood Substitute Market, By Source, 2019-2028 (USD Thousand)

TABLE 74 RUSSIA artificial Blood Substitute Market, By Application, 2019-2028 (USD Thousand)

TABLE 75 RUSSIA artificial Blood Substitute Market, By End User, 2019-2028 (USD Thousand)

TABLE 76 NETHERLAND artificial blood substitute Market, By Product type, 2019-2028 (USD Thousand)

TABLE 77 NETHERLAND Hemoglobin-Based Oxygen Carries (HBOCS) In artificial Blood Substitute Market, By Product Type, 2019-2028 (USD Thousand)

TABLE 78 NETHERLAND Perfluorocarbon (PFCS) In artificial Blood Substitute Market, By Product Type, 2019-2028 (USD Thousand)

TABLE 79 NETHERLAND artificial Blood Substitute Market, By Source, 2019-2028 (USD Thousand)

TABLE 80 NETHERLAND artificial Blood Substitute Market, By Application, 2019-2028 (USD Thousand)

TABLE 81 NETHERLAND artificial Blood Substitute Market, By End User, 2019-2028 (USD Thousand)

TABLE 82 U.K. artificial blood substitute Market, By Product type, 2019-2028 (USD Thousand)

TABLE 83 U.K. Hemoglobin-Based Oxygen Carries (HBOCS) In artificial Blood Substitute Market, By Product Type, 2019-2028 (USD Thousand)

TABLE 84 U.K. Perfluorocarbon (PFCS) In artificial Blood Substitute Market, By Product Type, 2019-2028 (USD Thousand)

TABLE 85 U.K. artificial Blood Substitute Market, By Source, 2019-2028 (USD Thousand)

TABLE 86 U.K. artificial Blood Substitute Market, By Application, 2019-2028 (USD Thousand)

TABLE 87 U.K. artificial Blood Substitute Market, By End User, 2019-2028 (USD Thousand)

TABLE 88 REST OF EUROPE ARTIFICIAL blood substitute Market, By Product type, 2019-2028 (USD Thousand)

TABLE 89 Asia-Pacific artificial blood substitute market, By COUNTRY, 2019-2028 (USD Thousand)

TABLE 90 asia-pacific artificial blood substitute market, By product type, 2019-2028 (USD thousand)

TABLE 91 asia-pacific Hemoglobin-based oxygen carriers (HBOCs) in artificial blood substitute market, By product type, 2019-2028 (USD thousand)

TABLE 92 asia-pacific perfluorocarbon (pfcs) in artificial blood substitute market, By product type, 2019-2028 (USD thousand)

TABLE 93 asia-pacific artificial blood substitute market, By Source, 2019-2028 (USD thousand)

TABLE 94 asia-pacific artificial blood substitute market, By application, 2019-2028 (USD thousand)

TABLE 95 asia-pacific artificial blood substitute market, By end user, 2019-2028 (USD thousand)

TABLE 96 China artificial blood substitute market, By product type, 2019-2028 (USD thousand)

TABLE 97 China Hemoglobin-based oxygen carriers (HBOCs) in artificial blood substitute market, By product type, 2019-2028 (USD thousand)

TABLE 98 China perfluorocarbon (pfcs) in artificial blood substitute market, By product type, 2019-2028 (USD thousand)

TABLE 99 China artificial blood substitute market, By Source, 2019-2028 (USD thousand)

TABLE 100 China artificial blood substitute market, By application, 2019-2028 (USD thousand)

TABLE 101 China artificial blood substitute market, By end user, 2019-2028 (USD thousand)

TABLE 102 rest of asia-pacific artificial blood substitute market, By product type, 2019-2028 (USD thousand)

图片列表

FIGURE 1 GLOBAL ARTIFICIAL BLOOD SUBSTITUTES MARKET: segmentation

FIGURE 2 global artificial blood substitutes market: data triangulation

FIGURE 3 GLOBAL ARTIFICIAL BLOOD SUBSTITUTES MARKET: DROC ANALYSIS

FIGURE 4 Global artificial blood substitutes market: GLOBAL vs REGIONAL MARKET ANALYSIS

FIGURE 5 GLOBAL ARTIFICIAL BLOOD SUBSTITUTES MARKET: COMPANY RESEARCH ANALYSIS

FIGURE 6 GLOBAL ARTIFICIAL BLOOD SUBSTITUTES MARKET: INTERVIEW DEMOGRAPHICS

FIGURE 7 GLOBAL ARTIFICIAL BLOOD SUBSTITUTES MARKET: DBMR MARKET POSITION GRID

FIGURE 8 GLOBAL ARTIFICIAL BLOOD SUBSTITUTES MARKET: market APPLICATION COVERAGE GRID

FIGURE 9 GLOBAL ARTIFICIAL BLOOD SUBSTITUTES MARKET: DBMR VENDOR SHARE ANALYSIS

FIGURE 10 GLOBAL ARTIFICIAL BLOOD SUBSTITUTES MARKET: SEGMENTATION

FIGURE 11 north america is expected to DOMINATE THE global artificial blood substitutes market AND GROWing WITH THE HIGHEST share IN the forecast period of 2021 To 2028

FIGURE 12 increased DEMAND FOR BLOOD TRANSFUSION is expected to drive the global artificial blood substitutes market in THE FORECAST PERIOD OF 2021 TO 2028

FIGURE 13 haemoglobin-based oxygen carriers (hbocs) SEgment is expected to account for the largest share of the GLOBAL ARTIFICIAL BLOOD SUBSTITUTES MARKET in 2021 & 2028

FIGURE 14 north america is the fastest growing market for artificial blood substitutes manufacturers in the forEcast period of 2021 to 2028

FIGURE 15 PATENT REGISTERED FOR ARTIFICIAL BLOOD SUBSTITUTES, BY COUNTRY

FIGURE 16 PATENT REGISTERED YEAR (2017 - 2021)

FIGURE 17 DRIVERS, RESTRAINTS, OPPORTUNITIES, AND CHALLENGEs OF GLOBAL artificial blood substituteS MARKET

FIGURE 18 global Artificial blood substitutes Market, By Product Type, 2020

FIGURE 19 global Artificial blood substitutes Market, By Source, 2020

FIGURE 20 global Artificial blood substitutes Market, By Application, 2020

FIGURE 21 global Artificial blood substitutes Market, By End user, 2020

FIGURE 22 GLOBAL Artificial blood substitutes market: SNAPSHOT (2020)

FIGURE 23 GLOBAL Artificial blood substitutes market: BY REGION (2020)

FIGURE 24 GLOBAL Artificial blood substitutes market: BY REGION (2021 & 2028)

FIGURE 25 GLOBAL Artificial blood substitutes market: BY REGION (2020 & 2028)

FIGURE 26 GLOBAL Artificial blood substitutes market: BY Product Type (2021-2028)

FIGURE 27 North America ARTIFICIAL BLOOD SUBSTITUTES MARKET: SNAPSHOT (2020)

FIGURE 28 North America ARTIFICIAL BLOOD SUBSTITUTES MARKET: BY COUNTRY (2020)

FIGURE 29 North America ARTIFICIAL BLOOD SUBSTITUTES MARKET: BY COUNTRY (2021 & 2028)

FIGURE 30 North America ARTIFICIAL BLOOD SUBSTITUTES MARKET: BY COUNTRY (2020 & 2028)

FIGURE 31 North America ARTIFICIAL BLOOD SUBSTITUTES MARKET: BY product type (2021-2028)

FIGURE 32 Middle East & Africa artificial blood substitutes market: SNAPSHOT (2020)

FIGURE 33 Middle East & Africa artificial blood substitutes market: BY COUNTRY (2020)

FIGURE 34 Middle East & Africa artificial blood substitutes market: BY COUNTRY (2021 & 2028)

FIGURE 35 Middle East & Africa artificial blood substitutes market: BY COUNTRY (2020 & 2028)

FIGURE 36 Middle East & Africa artificial blood substitutes market: BY PRODUCT TYPE (2021 & 2028)

FIGURE 37 Europe ARTIFICIAL BLOOD SUBSTITUTE MARKET: SNAPSHOT (2020)

FIGURE 38 Europe ARTIFICIAL BLOOD SUBSTITUTE MARKET: BY COUNTRY (2020)

FIGURE 39 Europe ARTIFICIAL BLOOD SUBSTITUTE MARKET: BY COUNTRY (2021 & 2028)

FIGURE 40 Europe ARTIFICIAL BLOOD SUBSTITUTE MARKET: BY COUNTRY (2020 & 2028)

FIGURE 41 Europe ARTIFICIAL BLOOD SUBSTITUTE MARKET: BY product type (2021-2028)

FIGURE 42 Asia-Pacific artificial blood substitute market: SNAPSHOT (2020)

FIGURE 43 Asia-Pacific artificial blood substitute market: BY COUNTRY (2020)

FIGURE 44 Asia-Pacific artificial blood substitute market: BY COUNTRY (2021 & 2028)

FIGURE 45 Asia-Pacific artificial blood substitute market: BY COUNTRY (2020 & 2028)

FIGURE 46 Asia-Pacific artificial blood substitute market: BY product TYPE (2020 & 2028)

查看详细信息 Right Arrow

研究方法

Data collection and base year analysis are done using data collection modules with large sample sizes. The stage includes obtaining market information or related data through various sources and strategies. It includes examining and planning all the data acquired from the past in advance. It likewise envelops the examination of information inconsistencies seen across different information sources. The market data is analysed and estimated using market statistical and coherent models. Also, market share analysis and key trend analysis are the major success factors in the market report. To know more, please request an analyst call or drop down your inquiry.

The key research methodology used by DBMR research team is data triangulation which involves data mining, analysis of the impact of data variables on the market and primary (industry expert) validation. Data models include Vendor Positioning Grid, Market Time Line Analysis, Market Overview and Guide, Company Positioning Grid, Patent Analysis, Pricing Analysis, Company Market Share Analysis, Standards of Measurement, Global versus Regional and Vendor Share Analysis. To know more about the research methodology, drop in an inquiry to speak to our industry experts.

可定制

Data Bridge Market Research is a leader in advanced formative research. We take pride in servicing our existing and new customers with data and analysis that match and suits their goal. The report can be customized to include price trend analysis of target brands understanding the market for additional countries (ask for the list of countries), clinical trial results data, literature review, refurbished market and product base analysis. Market analysis of target competitors can be analyzed from technology-based analysis to market portfolio strategies. We can add as many competitors that you require data about in the format and data style you are looking for. Our team of analysts can also provide you data in crude raw excel files pivot tables (Fact book) or can assist you in creating presentations from the data sets available in the report.

Frequently Asked Questions

The market is segmented based on , By Product Type (Perflurocarbon (PFCs), Hemoglobin-Based Oxygen Carries (HBOCs)), Source (Human Blood, Animal Blood, Microorganism Based Recombinant HB, Synthetic Polymers, Stem Cells), Application (Cardiovascular Diseases, Malignant Neoplasma, Injuries, Neonatal Conditions, Organ Transplant, Maternal Condition), End User (Hospital and Clinics, Blood Banks, Others) – Industry Trends and Forecast to 2030. .
The Global Artificial Blood Substitutes Market size was valued at USD 6.67 USD Million in 2022.
The Global Artificial Blood Substitutes Market is projected to grow at a CAGR of 20.4% during the forecast period of 2023 to 2030.
The major players operating in the market include Aurum Biosciences, HEMARINA, Hemoglobin Oxygen Therapeutics LLC, KaloCyte , SpheriTech , Centrum Medyczne VisusMed, European Medicines Agency, OPK Biotech , NuvOx Pharma, Prolong Pharmaceuticals LLC, Boston Pharmaceuticals, OXYVITA , NanoBlood LLC.
The market report covers data from the U.S., Canada and Mexico in North America, Germany, France, U.K., Netherlands, Switzerland, Belgium, Russia, Italy, Spain, Turkey, Rest of Europe in Europe, China, Japan, India, South Korea, Singapore, Malaysia, Australia, Thailand, Indonesia, Philippines, Rest of Asia-Pacific, Saudi Arabia, U.A.E, South Africa, Egypt, Israel, Rest of Middle East and Africa, Brazil, Argentina and Rest of South America.