欧洲运动可穿戴设备市场 – 行业趋势及 2028 年预测

请求目录 请求目录 与分析师交谈 与分析师交谈 立即购买 立即购买 购买前请咨询 提前咨询 免费样本报告 免费样本报告

欧洲运动可穿戴设备市场 – 行业趋势及 2028 年预测

  • Medical Devices
  • Published Report
  • Sep 2021
  • Europe
  • 350 页面
  • 桌子數: 136
  • 图号: 43

欧洲运动可穿戴设备市场,按组件(硬件、软件)、产品类型(计步器、健身和心率监测器、智能面料、智能相机、投篮追踪器等)、站点(头带、手持、手臂和手腕、夹子、鞋传感器等)、应用程序(步数、卡路里燃烧、心率监测、睡眠追踪等)、最终用户(运动中心、健身中心、家庭护理环境等)、分销渠道(独立零售店、大卖场/超市、品牌店、在线销售渠道)、国家(德国、法国、英国、意大利、西班牙、荷兰、俄罗斯、瑞士、比利时、土耳其、欧洲其他地区)行业趋势和预测到 2028 年。

欧洲运动可穿戴设备市场

市场分析与洞察:欧洲运动可穿戴设备市场

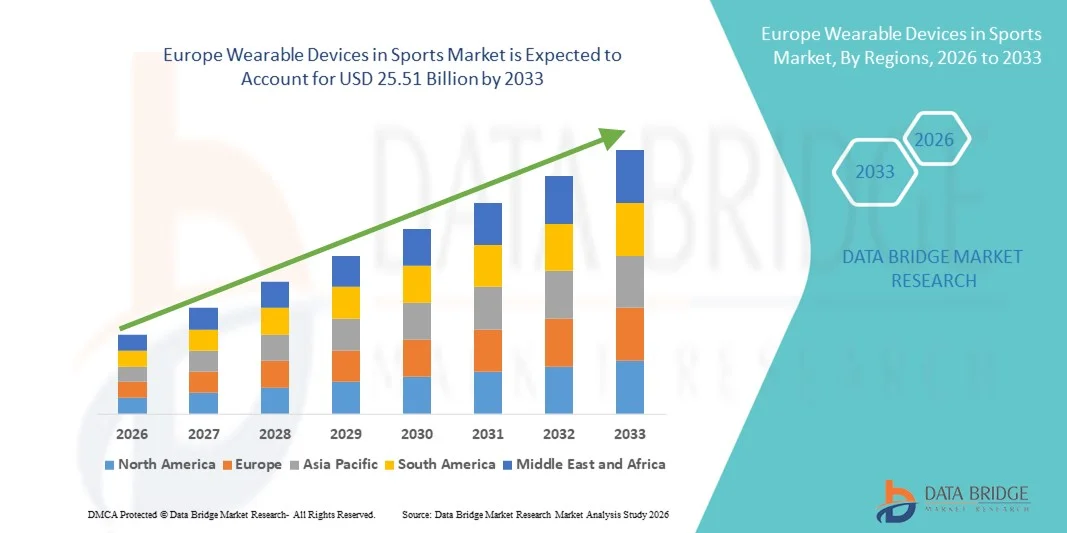
预计欧洲运动可穿戴设备市场将在 2021 年至 2028 年的预测期内实现市场增长。Data Bridge Market Research 分析称,在 2021 年至 2028 年的预测期内,该市场的复合年增长率为 15.8%,预计到 2028 年将达到 122.6304 亿美元。医疗保健支出的增加和新兴市场的崛起是预测期内推动市场需求的主要驱动力。

运动中的可穿戴设备是各种产品的混合体,旨在为用户提供协助和帮助。这些可穿戴设备的开发和设计旨在利用技术协助运动员。这些可穿戴设备使用物联网、蓝牙和 Wi-Fi 等技术来提供个人整体表现的信息。它们帮助运动员测量他们的健康参数,如心跳、耐力等。这些可穿戴设备配有 GPS 追踪器,可记录用户的步速、心率、步数、卡路里消耗等信息。这些设备可保持用户训练的身体活动并防止过度训练。这些设备还可以跟踪睡眠时间表和训练习惯。

可穿戴设备通常用于跟踪与位置、健康和健身甚至指示情绪的生物反馈相关的生命体征数据。尽管它存在一些问题,例如隐私问题以及它们可能对社交互动方式和佩戴者外观的影响程度以及用户友好性问题,但它正被全球数百万用户使用,从智能手表到健身追踪器、戒指和手环,甚至智能眼镜。可支配收入的增加和智能手机的普及为运动市场的可穿戴设备带来了机会。然而,电池寿命短和初始成本高是预计在预测期内制约市场增长的因素。

The wearable devices in sports market report provides details of market share, new developments, and product pipeline analysis, impact of domestic and localized market players, analyses opportunities in terms of emerging revenue pockets, changes in market regulations, product approvals, strategic decisions, product launches, geographic expansions, and technological innovations in the market. To understand the analysis and the market scenario contact us for an analyst brief, our team will help you create a revenue impact solution to achieve your desired goal.

欧洲运动可穿戴设备市场

Europe Wearable Devices in Sports Market Scope and Market Size

Wearable devices in sports market is segmented on the basis of component, product type, site, application, end user and distribution channel. The growth among segments helps you analyze niche pockets of growth and strategies to approach the market and determine your core application areas and the difference in your target markets.

  • On the basis of component, the Europe wearable devices in sports market is segmented into hardware and software. In 2021, the software segment is dominating the Europe wearable devices in sports market due to increasing popularity among professional athletes and increasing smartphone penetration are predicted to dominate the market.
  • On the basis of product type, the Europe wearable devices in sports market is segmented into pedometers, fitness & heart rate monitors, smart fabrics, smart camera, shot tracker, others. In 2021, Pedometers is dominating the Europe wearable devices in sports market due to benefits of wearable electronics are predicted to dominate the market.
  • On the basis of site, the Europe wearable devices in sports market is segmented into headband, handheld, arm & wrist, clip, shoe sensor, others. In 2021, the handheld, arm and wrist segment is dominating the Europe wearable devices in sports market due to presence of major market players are predicted to dominate the market.
  • On the basis of application, the Europe wearable devices in sports market is segmented into step counts, calorie burnt, heart rate monitoring, sleep tracking, others. In 2021, the step counts segment is dominating the Europe wearable devices in sports market due to rising healthcare expenditure and disposable income are predicted to dominate the market.
  • On the basis of end user, the Europe wearable devices in sports market is segmented into sports centers, fitness centers, homecare settings, others. in 2021, the sports centers segment is dominating the Europe wearable devices in sports market due to multi-featured and hybrid application mobile devices is predicted to dominate the market.
  • On the basis of distribution channel, the Europe wearable devices in sports market is segmented into independent retail store, hypermarket/supermarket, brand store, online sale channel. In 2021, independent retail store segment is dominating the Europe wearable devices in sports market due to emerging markets and multiple application coverage are predicted to dominate the market.

Wearable Devices in Sports Market Country Level Analysis

Wearable devices in sports market is segmented on the basis of component, product type, site, application, end user and distribution channel.

The countries covered in the wearable devices in sports market report are Germany, France, U.K., Italy, Germany, Spain, Netherlands, Russia, Switzerland, Turkey, and Rest of Europe.

Germany is expected to dominate the Europe region because of multiple application coverage and rising disposable income.

The country section of the report also provides individual market impacting factors and changes in regulation in the market domestically that impacts the current and future trends of the market. Data points such as new sales, replacement sales, country demographics, regulatory acts and import-export tariffs are some of the major pointers used to forecast the market scenario for individual countries. Also, presence and availability of Europe brands and their challenges faced due to large or scarce competition from local and domestic brands, impact of sales channels are considered while providing forecast analysis of the country data.

Strategic initiatives by market players and are increasing smartphone penetration are boosting the Market Growth of Wearable Devices in Sports.

Wearable devices in sports market also provides you with detailed market analysis for every country growth in wearable devices in sports products industry with drugs sales, impact of advancement, technology and changes in regulatory scenarios with their support for the wearable devices in sports market. The data is available for historic period 2010 to 2019.

Competitive Landscape and Wearable Devices in sports Market Share Analysis

Wearable devices in sports market competitive landscape provides details by competitor. Details included are company overview, company financials, revenue generated, market potential, investment in research and development, new market initiatives, production sites and facilities, company strengths and weaknesses, product launch, product trials pipelines, product approvals, patents, product width and breadth, application dominance, technology lifeline curve. The above data points provided are only related to the company’s focus related to wearable devices in sports market.

全球经营运动可穿戴设备的主要公司包括华为技术有限公司、Zepp Health corporation、苹果公司、Fitbit Inc.(谷歌有限责任公司的子公司)、耐克公司、Under Armour, Inc.、Garmin Ltd.、荷兰皇家飞利浦公司、StretchSense a Sensor Holdings Limited company、Catapult、Withings、广东创思医疗电子有限公司、三星、Hocoma、Masimo、雅培、美敦力、Bio-Beat、Halo Neuroscience、SIGMA SPORT、TomTom International BV、Carre Technologies inc (Hexoskin)、Activinsights Ltd.、欧姆龙株式会社、Sotera Wireless, Inc.、Polar Electro、Sensoria、GN Store Nord A/S、IMeasureU Ltd.、Hykso、WEARABLE X 等。

全球范围内众多公司也发起了多项产品发布和协议,这也加速了可穿戴设备在运动市场的发展。

例如,

  • 2021 年 7 月,Apple Inc. 获得了 35 项黄金时段艾美奖提名,其中包括《Ted Lasso》的 20 项提名,该剧打破了纪录,成为年度得票率最高的喜剧系列,也是过去得票率最高的新喜剧系列。这是该公司许多节目取得的令人难以置信的成就,通过各种团体获得了电视学院的认可,公司为所有参与其中的人感到自豪。
  • 2021年6月,华为技术有限公司宣布在巴塞罗那推出一系列面向“1+N”5G目标网的5G产品和解决方案,助力多天线技术向欧洲全频段推进。
  • 2020 年 10 月,三星宣布荣获 Interbrain 最佳全球品牌奖。这提高了该公司的客户参与度。

市场参与者的合作、产品发布、业务扩展、奖励和认可、合资企业和其他策略正在增强公司在运动可穿戴设备市场中的地位,这也为组织改进其在运动可穿戴设备方面的供应提供了好处。


SKU-

Get online access to the report on the World's First Market Intelligence Cloud

  • Interactive Data Analysis Dashboard
  • Company Analysis Dashboard for high growth potential opportunities
  • Research Analyst Access for customization & queries
  • Competitor Analysis with Interactive dashboard
  • Latest News, Updates & Trend analysis
  • Harness the Power of Benchmark Analysis for Comprehensive Competitor Tracking
Request for Demo

目录

1 INTRODUCTION

1.1 OBJECTIVES OF THE STUDY

1.2 MARKET DEFINITION

1.3 OVERVIEW OF THE EUROPE WEARABLE DEVICES IN SPORTS MARKET

1.4 LIMITATIONS

1.5 MARKETS COVERED

2 EUROPE WEARABLE DEVICES IN SPORTS MARKET: SEGMENTATION

2.1 MARKETS COVERED

2.2 GEOGRAPHICAL SCOPE

2.3 YEARS CONSIDERED FOR THE STUDY

2.4 CURRENCY AND PRICING

2.5 DBMR TRIPOD DATA VALIDATION MODEL

2.6 PRIMARY INTERVIEWS WITH KEY OPINION LEADERS

2.7 MULTIVARIATE MODELLING

2.8 COMPONENT LIFELINE CURVE

2.9 DBMR MARKET POSITION GRID

2.1 VENDOR SHARE ANALYSIS

2.11 MARKET END USER COVERAGE GRID

2.12 SECONDARY SOURCES

2.13 ASSUMPTIONS

3 EXECUTIVE SUMMARY

4 PREMIUM INSIGHTS

5 EUROPE WEARABLE DEVICES IN SPORTS MARKET: REGULATIONS

5.1 REGULATION IN US:

5.2 REGULATION IN EUROPE

5.3 REGULATIONS IN JAPAN

5.4 REGULATIONS IN INDIA

5.5 REGULATIONS IN CANADA

5.6 REGULATIONS IN SOUTH AFRICA

6 MARKET OVERVIEW

6.1 DRIVERS

6.1.1 INCREASING POPULARITY AMONG PROFESSIONAL ATHLETES

6.1.2 INCREASING SMARTPHONE PENETRATION

6.1.3 BENEFITS OF WEARABLE ELECTRONICS

6.1.4 RISING SOCIAL AWARENESS

6.1.5 PRESENCE OF MAJOR MARKET PLAYERS

6.2 RESTRAINTS

6.2.1 DATA PRIVACY IS A MAJOR CONCERN

6.2.2 SMALLER SIZE LEADS TO RELIABILITY ISSUES

6.2.3 STRINGENT REGULATORY & REIMBURSEMENT OF WEARABLE MEDICAL DEVICES

6.3 OPPORTUNITIES

6.3.1 RISING HEALTHCARE EXPENDITURE AND DISPOSABLE INCOME

6.3.2 MULTI-FEATURED AND HYBRID APPLICATION MOBILE DEVICES

6.3.3 EMERGING MARKETS

6.3.4 MULTIPLE APPLICATION COVERAGE

6.4 CHALLENGES

6.4.1 HIGH INITIAL COSTS

6.4.2 LIMITED BATTERY LIFE

7 IMPACT OF COVID-19 PANDEMIC ON THE EUROPE WEARABLE DEVICES IN SPORTS MARKET

7.1 PRICE IMPACT

7.2 IMPACT ON DEMAND

7.3 IMPACT ON SUPPLY CHAIN

7.4 STRATEGIC DECISIONS OFMANUFACTURERS/ SERVICE PROVIDER

7.5 CONCLUSION

8 EUROPE WEARABLE DEVICES IN SPORTS MARKET, BY COMPONENT

8.1 OVERVIEW

8.2 SOFTWARE

8.3 HARDWARE

9 EUROPE WEARABLE DEVICES IN SPORTS MARKET, BY PRODUCT TYPE

9.1 OVERVIEW

9.2 PEDOMETERS

9.2.1 PIEZOELECTRIC

9.2.2 SPRING-LEVERED

9.3 FITNESS & HEART RATE MONITORS

9.3.1 BASIC FITNESS TRACKER

9.3.2 HEART RATE MONITORING TRACKERS

9.3.3 HEART RATE MONITORING TRACKERS WITH GPS

9.4 SMART FABRICS

9.4.1 PASSIVE

9.4.2 ACTIVE

9.4.3 ADVANCED

9.5 SHOT TRACKER

9.6 SMART CAMERA

9.7 OTHERS

10 EUROPE WEARABLE DEVICES IN SPORTS MARKET, BY SITE

10.1 OVERVIEW

10.2 HANDHELD, ARM & WRIST

10.3 HEADBAND

10.4 CLIP

10.5 SHOE SENSOR

10.6 OTHERS

11 EUROPE WEARABLE DEVICES IN SPORTS MARKET, BY APPLICATION

11.1 OVERVIEW

11.2 STEP COUNTS

11.3 CALORIE BURNT

11.4 HEART RATE MONITORING

11.5 SLEEP TRACKING

11.6 OTHERS

12 EUROPE WEARABLE DEVICES IN SPORTS MARKET, BY END USER

12.1 OVERVIEW

12.2 SPORTS CENTERS

12.3 FITNESS CENTERS

12.4 HOMECARE SETTINGS

12.5 OTHERS

13 EUROPE WEARABLE DEVICES IN SPORTS MARKET, BY DISTRIBUTION CHANNEL

13.1 OVERVIEW

13.2 INDEPENDENT RETAIL STORE

13.3 HYPERMARKET/ SUPERMARKET

13.4 ONLINE SALE CHANNEL

13.5 BRAND STORE

14 EUROPE WEARABLE DEVICES IN SPORTS MARKET, BY REGION

14.1 EUROPE

14.1.1 GERMANY

14.1.2 FRANCE

14.1.3 U.K.

14.1.4 ITALY

14.1.5 SPAIN

14.1.6 RUSSIA

14.1.7 TURKEY

14.1.8 BELGIUM

14.1.9 NETHERLANDS

14.1.10 SWITZERLAND

14.1.11 REST OF EUROPE

15 EUROPE WEARABLE DEVICES IN SPORTS MARKET: COMPANY LANDSCAPE

15.1 COMPANY SHARE ANALYSIS: EUROPE

16 SWOT ANALYSIS

17 COMPANY PROFILE

17.1 APPLE INC.

17.1.1 COMPANY SNAPSHOT

17.1.2 REVENUE ANALYSIS

17.1.3 COMPANY SHARE ANLYSIS

17.1.4 SERVICE PORTFOLIO

17.1.5 RECENT DEVELOPMENTS

17.2 HUAWEI TECHNOLOGY CO., LTD.

17.2.1 COMPANY SNAPSHOT

17.2.2 COMPANY SHARE ANLYSIS

17.2.3 PRODUCT PORTFOLIO

17.2.4 RECENT DEVELOPMENTS

17.3 FITBIT INC. (A SUBSIDIARY OF GOOGLE LLC)

17.3.1 COMPANY SNAPSHOT

17.3.2 REVENUE ANALYSIS

17.3.3 COMPANY SHARE ANLYSIS

17.3.4 SERVICE PORTFOLIO

17.3.5 RECENT DEVELOPMENTS

17.4 SAMSUNG

17.4.1 COMPANY SNAPSHOT

17.4.2 REVENUE ANALYSIS

17.4.3 COMPANY SHARE ANLYSIS

17.4.4 PRODUCT PORTFOLIO

17.4.5 RECENT DEVELOPMENTS

17.5 ZEPP HEALTH CORPORATION

17.5.1 COMPANY SNAPSHOT

17.5.2 REVENUE ANALYSIS

17.5.3 COMPANY SHARE ANLYSIS

17.5.4 PRODUCT PORTFOLIO

17.5.5 RECENT DEVELOPMENTS

17.6 ABBOTT

17.6.1 COMPANY SNAPSHOT

17.6.2 REVENUE ANALYSIS

17.6.3 PRODUCT PORTFOLIO

17.6.4 RECENT DEVELOPMENTS

17.7 ACTIVEINSIGHTS LTD.

17.7.1 COMPANY SNAPSHOT

17.7.2 PRODUCT PORTFOLIO

17.7.3 RECENT DEVELOPMENTS

17.8 BIO-BEAT

17.8.1 COMPANY SNAPSHOT

17.8.2 PRODUCT PORTFOLIO

17.8.3 RECENT DEVELOPMENTS

17.9 CARRE TECHNOLOGIES INC (HEXOSKIN)

17.9.1 COMPANY SNAPSHOT

17.9.2 PRODUCT PORTFOLIO

17.9.3 RECENT DEVELOPMENTS

17.1 CATAPULT

17.10.1 COMPANY SNAPSHOT

17.10.2 REVENUE ANALYSIS

17.10.3 PRODUCT PORTFOLIO

17.10.4 RECENT DEVELOPMENTS

17.11 GARMIN LTD.

17.11.1 COMPANY SNAPSHOT

17.11.2 REVENUE ANALYSIS

17.11.3 SERVICE PORTFOLIO

17.11.4 RECENT DEVELOPMENTS

17.12 GUANGDONG TRANSTEK MEDICAL ELETRONICS CO., LTD.

17.12.1 COMPANY SNAPSHOT

17.12.2 REVENUE ANALYSIS

17.12.3 PRODUCT PORTFOLIO

17.12.4 RECENT DEVELOPMENTS

17.13 HALO NEUROSCIENCE

17.13.1 COMPANY SNAPSHOT

17.13.2 PRODUCT PORTFOLIO

17.13.3 RECENT DEVELOPMENT

17.14 HOCOMA

17.14.1 COMPANY SNAPSHOT

17.14.2 PRODUCT PORTFOLIO

17.14.3.3 RECENT DEVELOPMENTS

17.15 HYKSO

17.15.1 COMPANY SNAPSHOT

17.15.2 PRODUCT PORTFOLIO

17.15.3 RECENT DEVELOPMENT

17.16 IMEASURE U LTD.

17.16.1 COMPANY SNAPSHOT

17.16.2 SERVICE PORTFOLIO

17.16.3 RECENT DEVELOPMENT

17.17 GN STORE NORD A/S

17.17.1 COMPANY SNAPSHOT

17.17.2 REVENUE ANALYSIS

17.17.3 PRODUCT PORTFOLIO

17.17.4 RECENT DEVELOPMENTS

17.18 KONINKLIJKE PHILIPS N.V.

17.18.1 COMPANY SNAPSHOT

17.18.2 REVENUE ANALYSIS

17.18.3 PRODUCT PORTFOLIO

17.18.4 RECENT DEVELOPMENTS

17.19 MASIMO

17.19.1 COMPANY SNAPSHOT

17.19.2 REVENUE ANALYSIS

17.19.3 PRODUCT PORTFOLIO

17.19.4 RECENT DEVELOPMENTS

17.2 MEDTRONIC

17.20.1 COMPANY SNAPSHOT

17.20.2 REVENUE ANALYSIS

17.20.3 PRODUCT PORTFOLIO

17.20.4 RECENT DEVELOPMENTS

17.21 NIKE INC.

17.21.1 COMPANY SNAPSHOT

17.21.2 REVENUE ANALYSIS

17.21.3 SERVICE PORTFOLIO

17.21.4 RECENT DEVELOPMENTS

17.22 OMRON CORPORATION

17.22.1 COMPANY SNAPSHOT

17.22.2 REVENUE ANALYSIS

17.22.3 PRODUCT PORTFOLIO

17.22.4 RECENT DEVELOPMENTS

17.23 POLAR ELECTRO

17.23.1 COMPANY SNAPSHOT

17.23.2 SERVICE PORTFOLIO

17.23.3 RECENT DEVELOPMENTS

17.24 SENSORIA

17.24.1 COMPANY SNAPSHOT

17.24.2 SERVICE PORTFOLIO

17.24.3.3 RECENT DEVELOPMENTS

17.25 STRETCHSENSE, A SENSOR HOLDINGS LIMITED COMPANY

17.25.1 COMPANY SNAPSHOT

17.25.2 PRODUCT PORTFOLIO

17.25.3 RECENT DEVELOPMENTS

17.26 SIGMA SPORT

17.26.1 COMPANY SNAPSHOT

17.26.2 PRODUCT PORTFOLIO

17.26.3 RECENT DEVELOPMENT

17.27 TOMTOM INTERNATIONAL BV.

17.27.1 COMPANY SNAPSHOT

17.27.2 REVENUEANALYSIS

17.27.3 PRODUCT PORTFOLIO

17.27.4 RECENT DEVELOPMENT

17.28 UNDER ARMOUR INC.

17.28.1 COMPANY SNAPSHOT

17.28.2 REVENUE ANALYSIS

17.28.3 SERVICE PORTFOLIO

17.28.4 RECENT DEVELOPMENTS

17.29 WEARABLE X

17.29.1 COMPANY SNAPSHOT

17.29.2.2 SERVICE PORTFOLIO

17.29.3.3 RECENT DEVELOPMENT

17.3 WITHINGS

17.30.1 COMPANY SNAPSHOT

17.30.2 PRODUCT PORTFOLIO

17.30.3 RECENT DEVELOPMENTS

18 QUESTIONNAIRE

19 RELATED REPORTS

表格列表

TABLE 1 EUROPE WEARABLE DEVICES IN SPORTS MARKET, BY COMPONENT, 2019-2028 (USD MILLION)

TABLE 2 EUROPE SOFTWARE IN WEARABLE DEVICES IN SPORTS MARKET, BY REGION, 2019-2028 (USD MILLION)

TABLE 3 EUROPE HARDWARE IN WEARABLE DEVICES IN SPORTS MARKET, BY REGION, 2019-2028 (USD MILLION)

TABLE 4 EUROPE WEARABLE DEVICES IN SPORTS MARKET, BY PRODUCT TYPE, 2019-2028 (USD MILLION)

TABLE 5 EUROPE PEDOMETERS IN WEARABLE DEVICES IN SPORTS MARKET, BY REGION, 2019-2028 (USD MILLION)

TABLE 6 EUROPE PEDOMETERS IN WEARABLE DEVICES IN SPORTS MARKET, BY PRODUCT TYPE, 2019-2028 (USD MILLION)

TABLE 7 EUROPE FITNESS & HEART RATE MONITORS IN WEARABLE DEVICES IN SPORTS MARKET, BY REGION, 2019-2028 (USD MILLION)

TABLE 8 EUROPE FITNESS & HEART RATE MONITORS IN WEARABLE DEVICES IN SPORTS MARKET, BY PRODUCT TYPE, 2019-2028 (USD MILLION)

TABLE 9 EUROPE SMART FABRICS IN WEARABLE DEVICES IN SPORTS MARKET, BY REGION, 2019-2028 (USD MILLION)

TABLE 10 EUROPE SMART FABRICS IN WEARABLE DEVICES IN SPORTS MARKET, BY PRODUCT TYPE, 2019-2028 (USD MILLION)

TABLE 11 EUROPE SHOT TRACKER IN WEARABLE DEVICES IN SPORTS MARKET, BY REGION, 2019-2028 (USD MILLION)

TABLE 12 EUROPE SMART CAMERA IN WEARABLE DEVICES IN SPORTS MARKET, BY REGION, 2019-2028 (USD MILLION)

TABLE 13 EUROPE OTHERS IN WEARABLE DEVICES IN SPORTS MARKET, BY REGION, 2019-2028 (USD MILLION)

TABLE 14 EUROPE WEARABLE DEVICES IN SPORTS MARKET, BY SITE, 2019-2028 (USD MILLION)

TABLE 15 EUROPE HANDHELD, ARM & WRIST IN WEARABLE DEVICES IN SPORTS MARKET, BY REGION, 2019-2028 (USD MILLION)

TABLE 16 EUROPE HEADBAND IN WEARABLE DEVICES IN SPORTS MARKET, BY REGION, 2019-2028 (USD MILLION)

TABLE 17 EUROPE CLIP IN WEARABLE DEVICES IN SPORTS MARKET, BY REGION, 2019-2028 (USD MILLION)

TABLE 18 EUROPE SHOE SENSOR IN WEARABLE DEVICES IN SPORTS MARKET, BY REGION, 2019-2028 (USD MILLION)

TABLE 19 EUROPE OTHERS IN WEARABLE DEVICES IN SPORTS MARKET, BY REGION, 2019-2028 (USD MILLION)

TABLE 20 EUROPE WEARABLE DEVICES IN SPORTS MARKET, BY APPLICATION, 2019-2028 (USD MILLION)

TABLE 21 EUROPE STEP COUNTS IN WEARABLE DEVICES IN SPORTS MARKET, BY REGION, 2019-2028 (USD MILLION)

TABLE 22 EUROPE CALORIE BURNT IN WEARABLE DEVICES IN SPORTS MARKET, BY REGION, 2019-2028 (USD MILLION)

TABLE 23 EUROPE HEART RATE MONITORING IN WEARABLE DEVICES IN SPORTS MARKET, BY REGION, 2019-2028 (USD MILLION)

TABLE 24 EUROPE SLEEP TRACKING IN WEARABLE DEVICES IN SPORTS MARKET, BY REGION, 2019-2028 (USD MILLION)

TABLE 25 EUROPE OTHERS IN WEARABLE DEVICES IN SPORTS MARKET, BY REGION, 2019-2028 (USD MILLION)

TABLE 26 EUROPE WEARABLE DEVICES IN SPORTS MARKET, BY END USER, 2019-2028 (USD MILLION)

TABLE 27 EUROPE SPORTS CENTERS IN WEARABLE DEVICES IN SPORTS MARKET, BY REGION, 2019-2028 (USD MILLION)

TABLE 28 EUROPE FITNESS CENTERS IN WEARABLE DEVICES IN SPORTS MARKET, BY REGION, 2019-2028 (USD MILLION)

TABLE 29 EUROPE HOMECARE SETTINGS IN WEARABLE DEVICES IN SPORTS MARKET, BY REGION, 2019-2028 (USD MILLION)

TABLE 30 EUROPE OTHERS IN WEARABLE DEVICES IN SPORTS MARKET, BY REGION, 2019-2028 (USD MILLION)

TABLE 31 EUROPE WEARABLE DEVICES IN SPORTS MARKET, BY DISTRIBUTION CHANNEL, 2019-2028 (USD MILLION)

TABLE 32 EUROPE INDEPENDENT RETAIL STORE IN WEARABLE DEVICES IN SPORTS MARKET, BY REGION, 2019-2028 (USD MILLION)

TABLE 33 EUROPE HYPERMARKET/ SUPERMARKET IN WEARABLE DEVICES IN SPORTS MARKET, BY REGION, 2019-2028 (USD MILLION)

TABLE 34 EUROPE ONLINE SALE CHANNEL IN WEARABLE DEVICES IN SPORTS MARKET, BY REGION, 2019-2028 (USD MILLION)

TABLE 35 EUROPE BRAND STORE IN WEARABLE DEVICES IN SPORTS MARKET, BY REGION, 2019-2028 (USD MILLION)

TABLE 36 EUROPE WEARABLE DEVICES IN SPORTS MARKET, BY COUNTRY, 2019-2028 (USD MILLION)

TABLE 37 EUROPE WEARABLE DEVICES IN SPORTS MARKET, BY COMPONENT, 2019-2028 (USD MILLION)

TABLE 38 EUROPE WEARABLE DEVICES IN SPORTS MARKET, BY PRODUCT TYPE, 2019-2028 (UNITS)

TABLE 39 EUROPE PEDOMETERS IN WEARABLE DEVICES IN SPORTS MARKET, BY PRODUCT TYPE, 2019-2028 (USD MILLION)

TABLE 40 EUROPE FITNESS & HEART RATE MONITORS IN WEARABLE DEVICES IN SPORTS MARKET, BY PRODUCT TYPE, 2019-2028 (USD MILLION)

TABLE 41 EUROPE SMART FABRICS IN WEARABLE DEVICES IN SPORTS MARKET, BY PRODUCT TYPE, 2019-2028 (USD MILLION)

TABLE 42 EUROPE WEARABLE DEVICES IN SPORTS MARKET, BY SITE, 2019-2028 (USD MILLION)

TABLE 43 EUROPE WEARABLE DEVICES IN SPORTS MARKET, BY APPLICATION, 2019-2028 (USD MILLION)

TABLE 44 EUROPE WEARABLE DEVICES IN SPORTS MARKET, BY END USER, 2019-2028 (USD MILLION)

TABLE 45 EUROPE WEARABLE DEVICES IN SPORTS MARKET, BY DISTRIBUTION CHANNEL, 2019-2028 (USD MILLION)

TABLE 46 GERMANY WEARABLE DEVICES IN SPORTS MARKET, BY COMPONENT, 2019-2028 (USD MILLION)

TABLE 47 GERMANY WEARABLE DEVICES IN SPORTS MARKET, BY PRODUCT TYPE, 2019-2028 (UNITS)

TABLE 48 GERMANY PEDOMETERS IN WEARABLE DEVICES IN SPORTS MARKET, BY PRODUCT TYPE, 2019-2028 (USD MILLION)

TABLE 49 GERMANY FITNESS & HEART RATE MONITORS IN WEARABLE DEVICES IN SPORTS MARKET, BY PRODUCT TYPE, 2019-2028 (USD MILLION)

TABLE 50 GERMANY SMART FABRICS IN WEARABLE DEVICES IN SPORTS MARKET, BY PRODUCT TYPE, 2019-2028 (USD MILLION)

TABLE 51 GERMANY WEARABLE DEVICES IN SPORTS MARKET, BY SITE, 2019-2028 (USD MILLION)

TABLE 52 GERMANY WEARABLE DEVICES IN SPORTS MARKET, BY APPLICATION, 2019-2028 (USD MILLION)

TABLE 53 GERMANY WEARABLE DEVICES IN SPORTS MARKET, BY END USER, 2019-2028 (USD MILLION)

TABLE 54 GERMANY WEARABLE DEVICES IN SPORTS MARKET, BY DISTRIBUTION CHANNEL, 2019-2028 (USD MILLION)

TABLE 55 FRANCE WEARABLE DEVICES IN SPORTS MARKET, BY COMPONENT, 2019-2028 (USD MILLION)

TABLE 56 FRANCE WEARABLE DEVICES IN SPORTS MARKET, BY PRODUCT TYPE, 2019-2028 (UNITS)

TABLE 57 FRANCE PEDOMETERS IN WEARABLE DEVICES IN SPORTS MARKET, BY PRODUCT TYPE, 2019-2028 (USD MILLION)

TABLE 58 FRANCE FITNESS & HEART RATE MONITORS IN WEARABLE DEVICES IN SPORTS MARKET, BY PRODUCT TYPE, 2019-2028 (USD MILLION)

TABLE 59 FRANCE SMART FABRICS IN WEARABLE DEVICES IN SPORTS MARKET, BY PRODUCT TYPE, 2019-2028 (USD MILLION)

TABLE 60 FRANCE WEARABLE DEVICES IN SPORTS MARKET, BY SITE, 2019-2028 (USD MILLION)

TABLE 61 FRANCE WEARABLE DEVICES IN SPORTS MARKET, BY APPLICATION, 2019-2028 (USD MILLION)

TABLE 62 FRANCE WEARABLE DEVICES IN SPORTS MARKET, BY END USER, 2019-2028 (USD MILLION)

TABLE 63 FRANCE WEARABLE DEVICES IN SPORTS MARKET, BY DISTRIBUTION CHANNEL, 2019-2028 (USD MILLION)

TABLE 64 U.K. WEARABLE DEVICES IN SPORTS MARKET, BY COMPONENT, 2019-2028 (USD MILLION)

TABLE 65 U.K. WEARABLE DEVICES IN SPORTS MARKET, BY PRODUCT TYPE, 2019-2028 (UNITS)

TABLE 66 U.K. PEDOMETERS IN WEARABLE DEVICES IN SPORTS MARKET, BY PRODUCT TYPE, 2019-2028 (USD MILLION)

TABLE 67 U.K. FITNESS & HEART RATE MONITORS IN WEARABLE DEVICES IN SPORTS MARKET, BY PRODUCT TYPE, 2019-2028 (USD MILLION)

TABLE 68 U.K. SMART FABRICS IN WEARABLE DEVICES IN SPORTS MARKET, BY PRODUCT TYPE, 2019-2028 (USD MILLION)

TABLE 69 U.K. WEARABLE DEVICES IN SPORTS MARKET, BY SITE, 2019-2028 (USD MILLION)

TABLE 70 U.K. WEARABLE DEVICES IN SPORTS MARKET, BY APPLICATION, 2019-2028 (USD MILLION)

TABLE 71 U.K. WEARABLE DEVICES IN SPORTS MARKET, BY END USER, 2019-2028 (USD MILLION)

TABLE 72 U.K. WEARABLE DEVICES IN SPORTS MARKET, BY DISTRIBUTION CHANNEL, 2019-2028 (USD MILLION)

TABLE 73 ITALY WEARABLE DEVICES IN SPORTS MARKET, BY COMPONENT, 2019-2028 (USD MILLION)

TABLE 74 ITALY WEARABLE DEVICES IN SPORTS MARKET, BY PRODUCT TYPE, 2019-2028 (UNITS)

TABLE 75 ITALY PEDOMETERS IN WEARABLE DEVICES IN SPORTS MARKET, BY PRODUCT TYPE, 2019-2028 (USD MILLION)

TABLE 76 ITALY FITNESS & HEART RATE MONITORS IN WEARABLE DEVICES IN SPORTS MARKET, BY PRODUCT TYPE, 2019-2028 (USD MILLION)

TABLE 77 ITALY SMART FABRICS IN WEARABLE DEVICES IN SPORTS MARKET, BY PRODUCT TYPE, 2019-2028 (USD MILLION)

TABLE 78 ITALY WEARABLE DEVICES IN SPORTS MARKET, BY SITE, 2019-2028 (USD MILLION)

TABLE 79 ITALY WEARABLE DEVICES IN SPORTS MARKET, BY APPLICATION, 2019-2028 (USD MILLION)

TABLE 80 ITALY WEARABLE DEVICES IN SPORTS MARKET, BY END USER, 2019-2028 (USD MILLION)

TABLE 81 ITALY WEARABLE DEVICES IN SPORTS MARKET, BY DISTRIBUTION CHANNEL, 2019-2028 (USD MILLION)

TABLE 82 SPAIN WEARABLE DEVICES IN SPORTS MARKET, BY COMPONENT, 2019-2028 (USD MILLION)

TABLE 83 SPAIN WEARABLE DEVICES IN SPORTS MARKET, BY PRODUCT TYPE, 2019-2028 (UNITS)

TABLE 84 SPAIN PEDOMETERS IN WEARABLE DEVICES IN SPORTS MARKET, BY PRODUCT TYPE, 2019-2028 (USD MILLION)

TABLE 85 SPAIN FITNESS & HEART RATE MONITORS IN WEARABLE DEVICES IN SPORTS MARKET, BY PRODUCT TYPE, 2019-2028 (USD MILLION)

TABLE 86 SPAIN SMART FABRICS IN WEARABLE DEVICES IN SPORTS MARKET, BY PRODUCT TYPE, 2019-2028 (USD MILLION)

TABLE 87 SPAIN WEARABLE DEVICES IN SPORTS MARKET, BY SITE, 2019-2028 (USD MILLION)

TABLE 88 SPAIN WEARABLE DEVICES IN SPORTS MARKET, BY APPLICATION, 2019-2028 (USD MILLION)

TABLE 89 SPAIN WEARABLE DEVICES IN SPORTS MARKET, BY END USER, 2019-2028 (USD MILLION)

TABLE 90 SPAIN WEARABLE DEVICES IN SPORTS MARKET, BY DISTRIBUTION CHANNEL, 2019-2028 (USD MILLION)

TABLE 91 RUSSIA WEARABLE DEVICES IN SPORTS MARKET, BY COMPONENT, 2019-2028 (USD MILLION)

TABLE 92 RUSSIA WEARABLE DEVICES IN SPORTS MARKET, BY PRODUCT TYPE, 2019-2028 (UNITS)

TABLE 93 RUSSIA PEDOMETERS IN WEARABLE DEVICES IN SPORTS MARKET, BY PRODUCT TYPE, 2019-2028 (USD MILLION)

TABLE 94 RUSSIA FITNESS & HEART RATE MONITORS IN WEARABLE DEVICES IN SPORTS MARKET, BY PRODUCT TYPE, 2019-2028 (USD MILLION)

TABLE 95 RUSSIA SMART FABRICS IN WEARABLE DEVICES IN SPORTS MARKET, BY PRODUCT TYPE, 2019-2028 (USD MILLION)

TABLE 96 RUSSIA WEARABLE DEVICES IN SPORTS MARKET, BY SITE, 2019-2028 (USD MILLION)

TABLE 97 RUSSIA WEARABLE DEVICES IN SPORTS MARKET, BY APPLICATION, 2019-2028 (USD MILLION)

TABLE 98 RUSSIA WEARABLE DEVICES IN SPORTS MARKET, BY END USER, 2019-2028 (USD MILLION)

TABLE 99 RUSSIA WEARABLE DEVICES IN SPORTS MARKET, BY DISTRIBUTION CHANNEL, 2019-2028 (USD MILLION)

TABLE 100 TURKEY WEARABLE DEVICES IN SPORTS MARKET, BY COMPONENT, 2019-2028 (USD MILLION)

TABLE 101 TURKEY WEARABLE DEVICES IN SPORTS MARKET, BY PRODUCT TYPE, 2019-2028 (UNITS)

TABLE 102 TURKEY PEDOMETERS IN WEARABLE DEVICES IN SPORTS MARKET, BY PRODUCT TYPE, 2019-2028 (USD MILLION)

TABLE 103 TURKEY FITNESS & HEART RATE MONITORS IN WEARABLE DEVICES IN SPORTS MARKET, BY PRODUCT TYPE, 2019-2028 (USD MILLION)

TABLE 104 TURKEY SMART FABRICS IN WEARABLE DEVICES IN SPORTS MARKET, BY PRODUCT TYPE, 2019-2028 (USD MILLION)

TABLE 105 TURKEY WEARABLE DEVICES IN SPORTS MARKET, BY SITE, 2019-2028 (USD MILLION)

TABLE 106 TURKEY WEARABLE DEVICES IN SPORTS MARKET, BY APPLICATION, 2019-2028 (USD MILLION)

TABLE 107 TURKEY WEARABLE DEVICES IN SPORTS MARKET, BY END USER, 2019-2028 (USD MILLION)

TABLE 108 TURKEY WEARABLE DEVICES IN SPORTS MARKET, BY DISTRIBUTION CHANNEL, 2019-2028 (USD MILLION)

TABLE 109 BELGIUM WEARABLE DEVICES IN SPORTS MARKET, BY COMPONENT, 2019-2028 (USD MILLION)

TABLE 110 BELGIUM WEARABLE DEVICES IN SPORTS MARKET, BY PRODUCT TYPE, 2019-2028 (UNITS)

TABLE 111 BELGIUM PEDOMETERS IN WEARABLE DEVICES IN SPORTS MARKET, BY PRODUCT TYPE, 2019-2028 (USD MILLION)

TABLE 112 BELGIUM FITNESS & HEART RATE MONITORS IN WEARABLE DEVICES IN SPORTS MARKET, BY PRODUCT TYPE, 2019-2028 (USD MILLION)

TABLE 113 BELGIUM SMART FABRICS IN WEARABLE DEVICES IN SPORTS MARKET, BY PRODUCT TYPE, 2019-2028 (USD MILLION)

TABLE 114 BELGIUM WEARABLE DEVICES IN SPORTS MARKET, BY SITE, 2019-2028 (USD MILLION)

TABLE 115 BELGIUM WEARABLE DEVICES IN SPORTS MARKET, BY APPLICATION, 2019-2028 (USD MILLION)

TABLE 116 BELGIUM WEARABLE DEVICES IN SPORTS MARKET, BY END USER, 2019-2028 (USD MILLION)

TABLE 117 BELGIUM WEARABLE DEVICES IN SPORTS MARKET, BY DISTRIBUTION CHANNEL, 2019-2028 (USD MILLION)

TABLE 118 NETHERLANDS WEARABLE DEVICES IN SPORTS MARKET, BY COMPONENT, 2019-2028 (USD MILLION)

TABLE 119 NETHERLANDS WEARABLE DEVICES IN SPORTS MARKET, BY PRODUCT TYPE, 2019-2028 (UNITS)

TABLE 120 NETHERLANDS PEDOMETERS IN WEARABLE DEVICES IN SPORTS MARKET, BY PRODUCT TYPE, 2019-2028 (USD MILLION)

TABLE 121 NETHERLANDS FITNESS & HEART RATE MONITORS IN WEARABLE DEVICES IN SPORTS MARKET, BY PRODUCT TYPE, 2019-2028 (USD MILLION)

TABLE 122 NETHERLANDS SMART FABRICS IN WEARABLE DEVICES IN SPORTS MARKET, BY PRODUCT TYPE, 2019-2028 (USD MILLION)

TABLE 123 NETHERLANDS WEARABLE DEVICES IN SPORTS MARKET, BY SITE, 2019-2028 (USD MILLION)

TABLE 124 NETHERLANDS WEARABLE DEVICES IN SPORTS MARKET, BY APPLICATION, 2019-2028 (USD MILLION)

TABLE 125 NETHERLANDS WEARABLE DEVICES IN SPORTS MARKET, BY END USER, 2019-2028 (USD MILLION)

TABLE 126 NETHERLANDS WEARABLE DEVICES IN SPORTS MARKET, BY DISTRIBUTION CHANNEL, 2019-2028 (USD MILLION)

TABLE 127 SWITZERLAND WEARABLE DEVICES IN SPORTS MARKET, BY COMPONENT, 2019-2028 (USD MILLION)

TABLE 128 SWITZERLAND WEARABLE DEVICES IN SPORTS MARKET, BY PRODUCT TYPE, 2019-2028 (UNITS)

TABLE 129 SWITZERLAND PEDOMETERS IN WEARABLE DEVICES IN SPORTS MARKET, BY PRODUCT TYPE, 2019-2028 (USD MILLION)

TABLE 130 SWITZERLAND FITNESS & HEART RATE MONITORS IN WEARABLE DEVICES IN SPORTS MARKET, BY PRODUCT TYPE, 2019-2028 (USD MILLION)

TABLE 131 SWITZERLAND SMART FABRICS IN WEARABLE DEVICES IN SPORTS MARKET, BY PRODUCT TYPE, 2019-2028 (USD MILLION)

TABLE 132 SWITZERLAND WEARABLE DEVICES IN SPORTS MARKET, BY SITE, 2019-2028 (USD MILLION)

TABLE 133 SWITZERLAND WEARABLE DEVICES IN SPORTS MARKET, BY APPLICATION, 2019-2028 (USD MILLION)

TABLE 134 SWITZERLAND WEARABLE DEVICES IN SPORTS MARKET, BY END USER, 2019-2028 (USD MILLION)

TABLE 135 SWITZERLAND WEARABLE DEVICES IN SPORTS MARKET, BY DISTRIBUTION CHANNEL, 2019-2028 (USD MILLION)

TABLE 136 REST OF EUROPE WEARABLE DEVICES IN SPORTS MARKET, BY COMPONENT, 2019-2028 (USD MILLION)

图片列表

FIGURE 1 EUROPE WEARABLE DEVICES IN SPORTS MARKET: SEGMENTATION

FIGURE 2 EUROPE WEARABLE DEVICES IN SPORTS MARKET: DATA TRIANGULATION

FIGURE 3 EUROPE WEARABLE DEVICES IN SPORTS MARKET: DROC ANALYSIS

FIGURE 4 EUROPE WEARABLE DEVICES IN SPORTS MARKET: EUROPE VS REGIONAL ANALYSIS

FIGURE 5 EUROPE WEARABLE DEVICES IN SPORTS MARKET: COMPANY RESEARCH ANALYSIS

FIGURE 6 EUROPE WEARABLE DEVICES IN SPORTS MARKET: INTERVIEW DEMOGRAPHICS

FIGURE 7 EUROPE WEARABLE DEVICES IN SPORTS MARKET: DBMR MARKET POSITION GRID

FIGURE 8 EUROPE WEARABLE DEVICES IN SPORTS MARKET: VENDOR SHARE ANALYSIS

FIGURE 9 EUROPE WEARABLE DEVICES IN SPORTS MARKET: MARKET END USER COVERAGE GRID

FIGURE 10 EUROPE WEARABLE DEVICES IN SPORTS MARKET: SEGMENTATION

FIGURE 11 RISE IN POPULARITY AMONG PROFESSIONAL ATHLETES IS EXPECTED TO DRIVE THE EUROPE WEARABLE DEVICES IN SPORTS MARKET IN THE FORECAST PERIOD OF 2021 TO 2028

FIGURE 12 SOFTWARE SEGMENT IS EXPECTED TO ACCOUNT FOR THE LARGEST SHARE OF THE EUROPE WEARABLE DEVICES IN SPORTS MARKET IN 2021 & 2028

FIGURE 13 DRIVERS, RESTRAINTS, OPPORTUNITIES AND CHALLENGES OF EUROPE WEARABLE DEVICES IN SPORTS MARKET

FIGURE 14 EUROPE WEARABLE DEVICES IN SPORTS MARKET: BY COMPONENT, 2020

FIGURE 15 EUROPE WEARABLE DEVICES IN SPORTS MARKET: BY COMPONENT, 2019-2028 (USD MILLION)

FIGURE 16 EUROPE WEARABLE DEVICES IN SPORTS MARKET: BY COMPONENT, CAGR (2021-2028)

FIGURE 17 EUROPE WEARABLE DEVICES IN SPORTS MARKET: BY COMPONENT, LIFELINE CURVE

FIGURE 18 EUROPE WEARABLE DEVICES IN SPORTS MARKET: BY PRODUCT TYPE, 2020

FIGURE 19 EUROPE WEARABLE DEVICES IN SPORTS MARKET: BY PRODUCT TYPE, 2019-2028 (USD MILLION)

FIGURE 20 EUROPE WEARABLE DEVICES IN SPORTS MARKET: BY PRODUCT TYPE, CAGR (2021-2028)

FIGURE 21 EUROPE WEARABLE DEVICES IN SPORTS MARKET: BY PRODUCT TYPE, LIFELINE CURVE

FIGURE 22 EUROPE WEARABLE DEVICES IN SPORTS MARKET: BY SITE, 2020

FIGURE 23 EUROPE WEARABLE DEVICES IN SPORTS MARKET: BY SITE, 2019-2028 (USD MILLION)

FIGURE 24 EUROPE WEARABLE DEVICES IN SPORTS MARKET: BY SITE, CAGR (2021-2028)

FIGURE 25 EUROPE WEARABLE DEVICES IN SPORTS MARKET: BY SITE, LIFELINE CURVE

FIGURE 26 EUROPE WEARABLE DEVICES IN SPORTS MARKET: BY APPLICATION, 2020

FIGURE 27 EUROPE WEARABLE DEVICES IN SPORTS MARKET: BY APPLICATION, 2019-2028 (USD MILLION)

FIGURE 28 EUROPE WEARABLE DEVICES IN SPORTS MARKET: BY APPLICATION, CAGR (2021-2028)

FIGURE 29 EUROPE WEARABLE DEVICES IN SPORTS MARKET: BY APPLICATION, LIFELINE CURVE

FIGURE 30 EUROPE WEARABLE DEVICES IN SPORTS MARKET: BY END USER, 2020

FIGURE 31 EUROPE WEARABLE DEVICES IN SPORTS MARKET: BY END USER, 2019-2028 (USD MILLION)

FIGURE 32 EUROPE WEARABLE DEVICES IN SPORTS MARKET: BY END USER, CAGR (2021-2028)

FIGURE 33 EUROPE WEARABLE DEVICES IN SPORTS MARKET: BY END USER, LIFELINE CURVE

FIGURE 34 EUROPE WEARABLE DEVICES IN SPORTS MARKET: BY DISTRIBUTION CHANNEL, 2020

FIGURE 35 EUROPE WEARABLE DEVICES IN SPORTS MARKET: BY DISTRIBUTION CHANNEL, 2019-2028 (USD MILLION)

FIGURE 36 EUROPE WEARABLE DEVICES IN SPORTS MARKET: BY DISTRIBUTION CHANNEL, CAGR (2021-2028)

FIGURE 37 EUROPE WEARABLE DEVICES IN SPORTS MARKET: BY DISTRIBUTION CHANNEL, LIFELINE CURVE

FIGURE 38 EUROPE WEARABLE DEVICES IN SPORTS MARKET: SNAPSHOT (2020)

FIGURE 39 EUROPE WEARABLE DEVICES IN SPORTS MARKET: BY COUNTRY (2020)

FIGURE 40 EUROPE WEARABLE DEVICES IN SPORTS MARKET: BY COUNTRY (2021 & 2028)

FIGURE 41 EUROPE WEARABLE DEVICES IN SPORTS MARKET: BY COUNTRY (2020 & 2028)

FIGURE 42 EUROPE WEARABLE DEVICES IN SPORTS MARKET: BY COMPONENT (2021-2028)

FIGURE 43 EUROPE WEARABLE DEVICES IN SPORTS MARKET: COMPANY SHARE 2020 (%)

查看详细信息 Right Arrow

研究方法

Data collection and base year analysis are done using data collection modules with large sample sizes. The stage includes obtaining market information or related data through various sources and strategies. It includes examining and planning all the data acquired from the past in advance. It likewise envelops the examination of information inconsistencies seen across different information sources. The market data is analysed and estimated using market statistical and coherent models. Also, market share analysis and key trend analysis are the major success factors in the market report. To know more, please request an analyst call or drop down your inquiry.

The key research methodology used by DBMR research team is data triangulation which involves data mining, analysis of the impact of data variables on the market and primary (industry expert) validation. Data models include Vendor Positioning Grid, Market Time Line Analysis, Market Overview and Guide, Company Positioning Grid, Patent Analysis, Pricing Analysis, Company Market Share Analysis, Standards of Measurement, Global versus Regional and Vendor Share Analysis. To know more about the research methodology, drop in an inquiry to speak to our industry experts.

可定制

Data Bridge Market Research is a leader in advanced formative research. We take pride in servicing our existing and new customers with data and analysis that match and suits their goal. The report can be customized to include price trend analysis of target brands understanding the market for additional countries (ask for the list of countries), clinical trial results data, literature review, refurbished market and product base analysis. Market analysis of target competitors can be analyzed from technology-based analysis to market portfolio strategies. We can add as many competitors that you require data about in the format and data style you are looking for. Our team of analysts can also provide you data in crude raw excel files pivot tables (Fact book) or can assist you in creating presentations from the data sets available in the report.

Frequently Asked Questions

The Europe Wearable Devices in Sports Market Will be worth USD 12,263.04 million by 2028.
The Growth Rate of the Europe Wearable Devices in Sports Market will be 15.8% by 2028.
The major companies in the Europe Wearable Devices in Sports Market are Huawei Technologies Co., Ltd., Zepp Health corporation, Apple Inc., Fitbit Inc. (A Subsidiary of Google LLC), Nike, Inc., Under Armour, Inc., Garmin Ltd., Koninklijke Philips N.V., , StretchSense a Sensor Holdings Limited company, Catapult, Withings, Guangdong Transtek Medical Electronics Co., Ltd, SAMSUNG, Hocoma, Masimo, Abbott, Medtronic, Bio-Beat, Halo Neuroscience, SIGMA SPORT, TomTom International BV, Carre Technologies inc.
The component, product type, site, application, end user, and distribution channel are the factors on which the Europe Wearable Devices in Sports Market research is based.
The Step Counts, Calorie Burnt, Heart Rate Monitoring, Sleep Tracking are the market applications of the Europe Wearable Devices in Sports Market.