
Europe Water Detection Sensors Market
市场规模(十亿美元)
CAGR :
% 
 USD
571.18 Million
USD
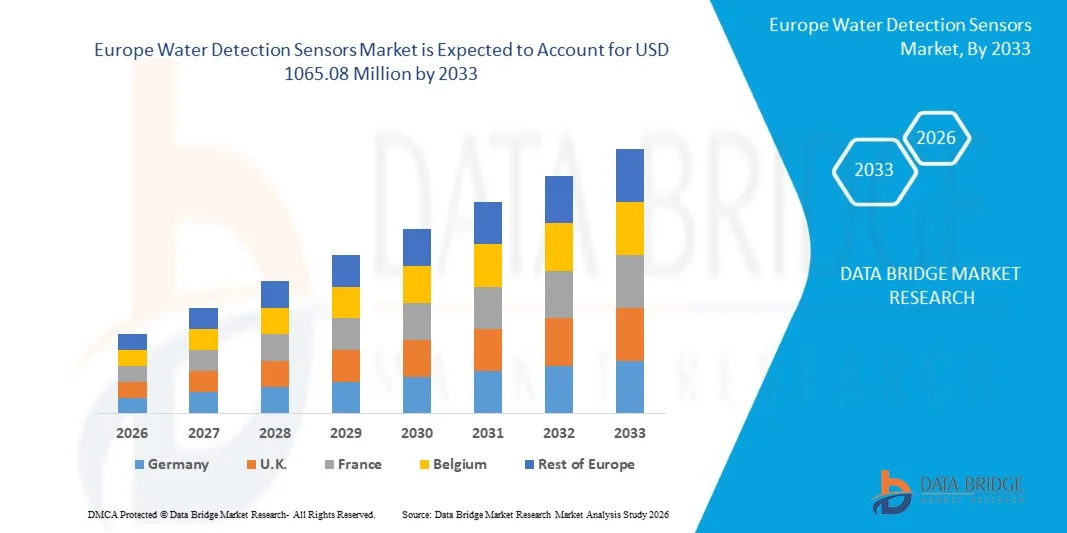
1,065.08 Million
2025
2033
USD
571.18 Million
USD
1,065.08 Million
2025
2033
| 2026 –2033 | |
| USD 571.18 Million | |
| USD 1,065.08 Million | |
| % | |
|
歐洲水質檢測感測器市場細分,按感測器類型(餘氯感測器、pH感測器、TOC感測器、ORP感測器、電導率感測器及其他)、尺寸(小於38毫米和大於38毫米)、重量(小於60克和大於60克)、裝置範圍(小於250英尺及大於250英尺)、電壓範圍(小於15VDC、15VDC至25VDC和大於25VDC)、用途(檢測水中成分(化學濃度、固體含量)和測量替代指標)、連接方式(無線和有線)、最終用途(工業、飲用水、地下水、水產養殖、廢水及其他)劃分-產業趨勢及至2033年的預測
歐洲水檢測感測器市場規模
- 2025年歐洲水檢測感測器市場規模為5.7118億美元 ,預計 2033年將達到10.6508億美元,預測期內 複合年增長率為8.10%。
- 市場成長主要受工業、商業和住宅領域對自動洩漏檢測需求不斷增長的推動。
- 物聯網智慧感測器在水質監測和管理領域的日益普及正在推動市場擴張。
歐洲水檢測感測器市場分析
- 市場正經歷技術的快速發展,包括用於精確檢測漏水和水位的無線、智慧和多參數感測器。
- 在智慧建築、工業廠房和市政供水系統中日益普及水檢測感測器,正在提高運作效率並降低維護成本。
- 2025 年,德國在水檢測感測器市場佔據主導地位,收入份額最大,這主要得益於嚴格的工業安全法規、智慧建築技術的日益普及以及節水意識的提高。
- 由於政府加大節水力度、對即時洩漏檢測解決方案的需求不斷增長,以及工業和商業領域對物聯網智慧水管理系統的廣泛應用,預計英國將成為歐洲水檢測感測器市場中複合年增長率(CAGR)最高的國家。
- 2025年,餘氯感測器細分市場佔據最大的市場份額,這主要得益於其在工業和飲用水水質監測領域的廣泛應用。這些感測器能夠提供精確的即時氯含量測量值,從而確保水質安全、符合監管要求並提高營運效率。
報告範圍及歐洲水質檢測感測器市場細分
|
屬性 |
歐洲水質檢測感測器市場關鍵洞察 |
|
涵蓋部分 |
|
|
覆蓋國家/地區 |
歐洲
|
|
主要市場參與者 |
|
|
市場機遇 |
• 採用物聯網水質偵測感測器 |
|
加值資料資訊集 |
除了對市場狀況(如市場價值、成長率、細分、地理覆蓋範圍和主要參與者)的洞察之外,Data Bridge Market Research 精心編制的市場報告還包括深入的專家分析、按地域劃分的公司生產和產能、分銷商和合作夥伴的網絡佈局、詳細和最新的價格趨勢分析以及供應鏈和需求的缺口分析。 |
歐洲水質檢測感測器市場趨勢
“智慧型即時水體偵測系統的崛起”
智慧水檢測感測器的日益普及正在改變水資源管理格局,實現即時監測和洩漏檢測。這些感測器能夠立即識別進水或管道洩漏,從而減少營運損失並防止財產損失。與物聯網平台整合後,可實現自動警報和預測性維護,進一步減少停機時間和昂貴的維修費用。進階分析功能可為優化用水和資源節約提供切實可行的建議。
工業、商業和住宅領域對快速精準檢測的需求日益增長,正在加速物聯網感測器和自動化警報系統的應用。這些解決方案在關鍵基礎設施領域尤其有效,因為及時偵測可以避免代價高昂的停機和水災損失。智慧感測器還支援透過行動和雲端應用程式進行遠端監控,使操作人員能夠有效率地管理多個站點。收集的數據可用於合規性報告和預測性維護計劃。
現代水質檢測感測器價格實惠、易於部署且可擴展,使其極具吸引力,並有望廣泛應用。操作人員無需進行繁重的人工巡檢即可實現持續監測,從而提高預防性維護和營運效率。模組化感測器設計使其能夠靈活安裝在新建和現有基礎設施中,降低了改造成本。這些解決方案既適用於大型工業設施,也適用於小型商業或住宅應用,從而拓寬了市場覆蓋範圍。
例如,2023年,多家商業設施在其建築管理系統中整合了智慧水感測器,從而實現了早期洩漏檢測,減少了水資源浪費,並降低了維護成本。自動通知功能使維修團隊能夠立即回應,防止了更大的損失。這些感測器的應用也有助於降低保險費用,並提升設施的整體永續性。
智慧型偵測系統雖然能夠改善水資源管理並減少損失,但其有效性取決於持續創新、與建築系統的整合以及易於維護。製造商必須專注於開發穩健、可擴展且經濟高效的解決方案,以充分滿足不斷增長的市場需求。提高與其他樓宇自動化系統的互通性以及人工智慧分析技術的應用,將進一步提升營運效率並減少誤報。
歐洲水質檢測感測器市場動態
司機
“加大節水力度,重視基礎設施安全”
人們日益關注水資源短缺問題以及高效水資源管理的需求,這推動了先進水檢測感測器的應用。這些系統有助於偵測洩漏、防止水資源浪費,並支持永續發展措施。它們在最大限度地減少環境影響以及促進商業和工業領域的資源合理管理方面也發揮關鍵作用。廣泛的節水宣傳活動進一步促進了這些感測器的應用。
• 對智慧建築基礎設施和自動化監控系統的投資不斷增長,推動了對可與樓宇管理平台整合的聯網水感測器的需求。這種整合實現了即時儀錶板、遠端警報和預測性維護,從而確保營運的連續性。各組織機構正越來越多地利用基於雲端的分析技術來優化用水、降低營運成本,同時滿足監管要求。
• 工業和商業業者越來越重視預防水災,以避免代價高昂的維修、停機和監管處罰,加速了智慧檢測技術的部署。持續監控關鍵點並預測潛在故障的能力有助於最大限度地降低營運風險。水感測器目前正被納入更廣泛的設施管理策略中,以確保永續性、安全性和合規性。
例如,2023年,多家製造工廠部署了基於物聯網的漏水偵測感測器,減少了與水相關的營運中斷,提高了資源利用效率。這些部署還實現了預測性維護計劃,避免了代價高昂的緊急維修。此外,各公司報告稱,營運關鍵績效指標(KPI)有所改善,例如漏水減少、資產使用壽命延長和營運停機時間縮短。
儘管消費者意識的提高和技術的普及推動了市場成長,但感測器的可靠性、整合能力和系統可擴展性對於市場的持續擴張仍然至關重要。感測器精度、無線連接性和基於人工智慧的數據分析能力的不斷提升,對於最大化投資回報至關重要。強大的售後支援和用戶友好的介面對於維持高普及率也至關重要。
克制/挑戰
“先進水體檢測系統的高成本和維護要求”
• 先進的水質偵測感測器,尤其是支援物聯網或即時監測系統的感測器,初始投資較高,限制了小型設施和居民用戶的採用。實施成本,包括安裝、軟體許可和感測器校準,可能非常高昂。小型營運商可能會推遲採用,直到成本降低或整合解決方案更加經濟實惠。
• 精密感測器的維護和校準要求會增加操作的複雜性和成本,從而降低整體可用性。感測器需要定期測試、韌體更新,有時還需要更換零件以保持精確度。管理這些流程需要專業人員,這進一步增加了營運成本,影響了資源受限環境中的應用。
與現有樓宇或工業管理系統整合方面的挑戰可能會延遲部署並降低營運效率。與傳統系統或第三方平台的兼容性問題可能需要對中間件或客製化整合進行額外投資。在確保系統安全的同時實現無縫互通性,對許多營運商而言仍然是一項挑戰。
例如,2023年,一些小型商業業者由於設備和整合成本高昂而推遲了感測器的安裝,凸顯了價格承受能力是主要障礙。在某些情況下,延遲實施導致與水相關的損失增加,這表明成本和風險緩解之間存在權衡。企業強調需要模組化、易於安裝的解決方案來克服這些挑戰。
儘管技術創新不斷提升感測器的性能,但解決成本效益、維護簡單性和系統無縫整合等問題對於充分釋放市場潛力至關重要。專注於即插即用解決方案、訂閱式定價模式和人工智慧驅動的預測性維護的製造商,有望更快地獲得市場認可和更高的市場滲透率。
歐洲水檢測感測器市場範圍
市場按感測器類型、尺寸、重量、設備範圍、電壓範圍、用途、連接方式和最終用途進行細分。
• 依感測器類型
根據感測器類型,歐洲水質檢測感測器市場可細分為餘氯感測器、pH感測器、總有機碳(TOC)感測器、氧化還原電位(ORP)感測器、電導率感測器和其他感測器。餘氯感測器在2025年佔據最大的市場份額,這主要得益於其在工業和飲用水水質監測領域的廣泛應用。這些感測器能夠提供精確的即時氯含量測量值,從而確保水質安全、符合監管要求並提高營運效率。
預計2026年至2033年間,pH感測器市場將迎來最快成長,這主要得益於其在維持水系統化學平衡和防止腐蝕方面發揮的關鍵作用。 pH感測器越來越多地與物聯網監控系統集成,從而實現即時警報和遠端管理。其緊湊的尺寸和便捷的安裝方式使其適用於各種工業和市政水處理應用,並有助於永續水資源管理實踐。
• 依尺寸
根據尺寸,歐洲水檢測感測器市場可分為小於 38 毫米和大於 38 毫米兩類。由於市場對緊湊、節省空間且易於安裝在狹窄管道和封閉水系統中的感測器的需求,小於 38 毫米的感測器在 2025 年佔據了最大的市場份額。小型感測器越來越受到模組化安裝和便攜式檢測設備的青睞。
由於其適用於高流量工業水系統和大型水處理廠等對耐用性和可靠性要求較高的應用場景,預計2026年至2033年間,尺寸大於38毫米的傳感器市場將實現最快增長。尺寸較大的感測器具有更高的測量穩定性和更長的使用壽命,使其成為連續監測應用的理想選擇。
• 按重量
根據重量,歐洲水質檢測感測器市場可分為小於 60 克和大於 60 克兩類。預計到 2025 年,小於 60 克的感測器市場份額最大,這主要得益於輕巧易攜、便於操作和安裝的水質感測器日益普及。這類感測器尤其適用於現場偵測、移動水質測試和遠端監控。
預計2026年至2033年間,60克以上重量級感測器市場將實現最快成長,這主要得益於市場對重型工業級感測器的需求,這類感測器具有更高的耐用性和更強的抗惡劣工況能力。這些感測器廣泛應用於廢水處理和大型水產養殖系統,在這些應用中,感測器的可靠性至關重要。
• 依設備範圍
根據設備探測範圍,歐洲水質檢測感測器市場可分為小於 250 英尺和大於 250 英尺兩類。 2025 年,小於 250 英尺的細分市場佔據了最大的收入份額,這主要得益於其適用於住宅、工業和市政環境中的局部水質監測。短程感測器能夠精確監測小型系統,並降低資料擷取的延遲。
由於其在大型配水管網和工業廠房中的廣泛應用,預計2026年至2033年間,傳輸距離超過250英尺的管網將呈現最快的增長速度。遠端感測器支援集中監控並與SCADA系統集成,從而實現對大型供水管網的即時預警和預防性維護。
• 按電壓範圍
根據電壓範圍,歐洲水質檢測感測器市場可分為低於15VDC、15VDC至25VDC以及高於25VDC三個部分。低於15VDC的感測器在2025年佔據了最大的市場份額,這主要得益於其低功耗以及與電池供電和便攜式水質檢測設備的兼容性。節能型感測器在永續水質監測系統中越來越受歡迎。
由於15VDC至25VDC電壓段在功率效率和感測器性能之間取得了良好的平衡,預計該電壓段將在2026年至2033年間實現最快成長。這些感測器廣泛應用於工業領域,在這些領域中,穩定的電壓運行對於精確測量至關重要。
• 有目的
根據用途,歐洲水質檢測感測器市場可分為水體成分檢測(化學濃度、固體)和替代物測量兩大類。受日益嚴格的監管合規要求和對水污染物進行精確監測的需求推動,水體成分檢測類感測器在2025年佔據了最大的市場份額。這類感測器能夠即時檢測化學物質濃度、固體含量和污染物。
預計2026年至2033年間,替代指標測量領域將迎來最快成長,這主要得益於市場對利用替代指標估算水質參數的間接監測解決方案的需求。替代指標測量能夠經濟高效地快速評估水系統,從而減少頻繁的實驗室檢測需求。
• 透過連接
根據連接方式,歐洲水質檢測感測器市場可分為無線和有線兩大類。由於其可靠性高、數據傳輸穩定且易於整合到現有水質監測網路中,有線感測器在2025年佔據了最大的市場份額。有線感測器廣泛應用於工業廠房、水處理廠和大型市政系統。
預計2026年至2033年間,無線領域將實現最快成長,主要得益於物聯網水質監測系統日益普及。無線連接能夠實現遠端監測,降低安裝成本,並可靈活地對現有管道和分散式供水網路進行改造。
• 依最終用途
根據最終用途,歐洲水質檢測感測器市場可細分為工業、飲用水、地下水、水產養殖、廢水和其他領域。由於製造工廠、食品飲料和化學工業對洩漏檢測和品質監測的迫切需求,工業領域在2025年佔據了最大的市場份額。工業應用需要持續、精確的監測,以防止營運損失並確保符合環境法規。
由於民眾對健康、安全以及飲用水安全監管要求的日益重視,預計2026年至2033年間,飲用水領域將迎來最快的成長。飲用水系統中的感測器可即時監測化學和微生物參數,從而確保水質標準並降低污染風險。
歐洲水檢測感測器市場區域分析
• 2025 年,德國在水檢測感測器市場佔據主導地位,收入份額最大,這得益於嚴格的工業安全法規、智慧建築技術的日益普及以及節水意識的提高。
• 營運商非常重視即時監控、早期洩漏偵測以及與樓宇管理和工業自動化系統的無縫整合。
• 技術創新、永續發展措施以及對預測性維護解決方案不斷增長的投資進一步推動了這一廣泛應用,使水檢測感測器成為工業和商業應用的關鍵要素。
英國水質檢測感測器市場洞察
受智慧基礎設施、主動洩漏檢測和高效水資源管理需求不斷增長的推動,英國水質檢測感測器市場預計將在2026年至2033年間實現最快成長。各設施正越來越多地部署物聯網感測器,以實現早期檢測、提高營運效率並確保符合安全法規。政府推行的可持續用水舉措以及將感測器與即時監控平台集成,也進一步促進了感測器的應用。
歐洲水檢測感測器市場份額
歐洲水質檢測感測器產業主要由一些知名企業主導,其中包括:
- 恩德斯豪斯(瑞士)
- 哈希朗格有限公司(德國)
- Vega Grieshaber KG(德國)
- 西門子股份公司(德國)
- ABB有限公司(瑞士)
- 施耐德電機公司(法國)
- 科隆集團(德國)
- 賽萊默公司(德國)
- S::can Messtechnik GmbH(奧地利)
- 伊創公司(法國)
SKU-
Get online access to the report on the World's First Market Intelligence Cloud

- Interactive Data Analysis Dashboard
- Company Analysis Dashboard for high growth potential opportunities
- Research Analyst Access for customization & queries
- Competitor Analysis with Interactive dashboard
- Latest News, Updates & Trend analysis
- Harness the Power of Benchmark Analysis for Comprehensive Competitor Tracking
研究方法
数据收集和基准年分析是使用具有大样本量的数据收集模块完成的。该阶段包括通过各种来源和策略获取市场信息或相关数据。它包括提前检查和规划从过去获得的所有数据。它同样包括检查不同信息源中出现的信息不一致。使用市场统计和连贯模型分析和估计市场数据。此外,市场份额分析和关键趋势分析是市场报告中的主要成功因素。要了解更多信息,请请求分析师致电或下拉您的询问。
DBMR 研究团队使用的关键研究方法是数据三角测量,其中包括数据挖掘、数据变量对市场影响的分析和主要(行业专家)验证。数据模型包括供应商定位网格、市场时间线分析、市场概览和指南、公司定位网格、专利分析、定价分析、公司市场份额分析、测量标准、全球与区域和供应商份额分析。要了解有关研究方法的更多信息,请向我们的行业专家咨询。
可定制
Data Bridge Market Research 是高级形成性研究领域的领导者。我们为向现有和新客户提供符合其目标的数据和分析而感到自豪。报告可定制,包括目标品牌的价格趋势分析、了解其他国家的市场(索取国家列表)、临床试验结果数据、文献综述、翻新市场和产品基础分析。目标竞争对手的市场分析可以从基于技术的分析到市场组合策略进行分析。我们可以按照您所需的格式和数据样式添加您需要的任意数量的竞争对手数据。我们的分析师团队还可以为您提供原始 Excel 文件数据透视表(事实手册)中的数据,或者可以帮助您根据报告中的数据集创建演示文稿。

