欧洲血浆分馏市场 – 行业趋势和 2028 年预测

请求目录 请求目录 与分析师交谈 与分析师交谈 立即购买 立即购买 购买前请咨询 提前咨询 免费样本报告 免费样本报告

欧洲血浆分馏市场 – 行业趋势和 2028 年预测

  • Healthcare
  • Published Report
  • Jul 2021
  • Europe
  • 350 页面
  • 桌子數: 117
  • 图号: 43

欧洲血浆分馏市场,按产品类型(免疫球蛋白、凝血因子浓缩物、白蛋白、蛋白酶抑制剂和其他产品)、应用(神经病学、免疫学、血液学、重症监护、肺病学、血液肿瘤学、风湿病学和其他)、加工技术(离子交换色谱、亲和色谱、低温保存、超滤和微滤)、模式(现代血浆分馏和传统血浆分馏)、最终用户(医院和诊所、临床研究实验室学术机构等)、分销渠道(直接招标、第三方分销等)、国家(德国、英国、意大利、法国、西班牙、瑞士、荷兰、俄罗斯、土耳其和欧洲其他地区)行业趋势和预测到 2028 年。

欧洲血浆分离市场市场分析与洞察:欧洲血浆分馏市场

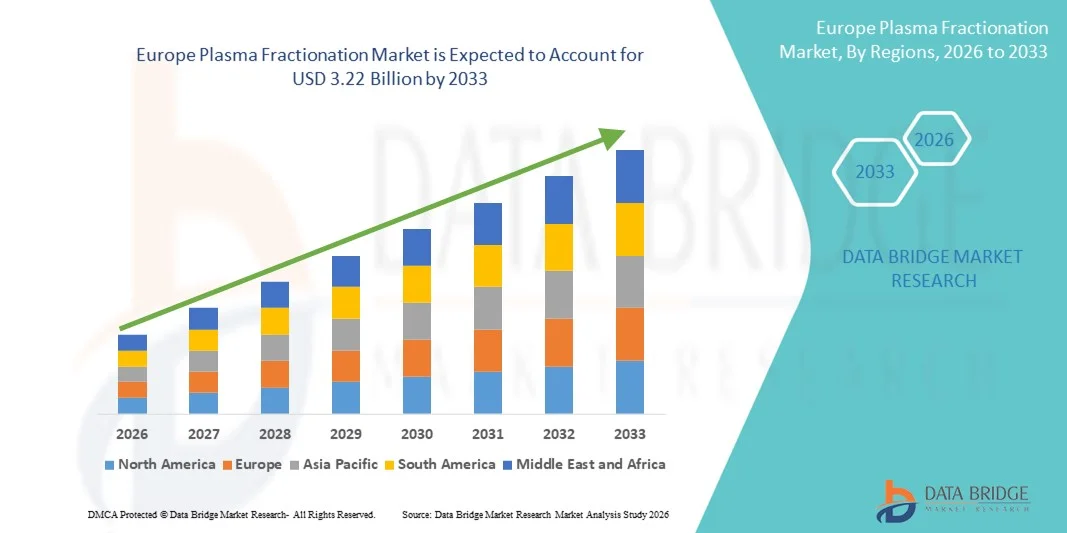
预计欧洲血浆分离市场将在 2021 年至 2028 年的预测期内实现市场增长。Data Bridge Market Research 分析,在 2021 年至 2028 年的预测期内,该市场的复合年增长率为 5.9%,预计到 2028 年将达到 24.2333 亿美元。大量的血浆收集中心有助于血浆分离市场需求的增长。

血浆是一种血液成分,通过血浆置换从全血中提取,用于各种治疗和医疗应用。人血浆是多种不同蛋白质的来源。然而,只有少数蛋白质用于生产治疗性血浆产品。从血浆中分离、提取和纯化这些蛋白质的过程称为分馏过程。

欧洲血浆分离市场正在增长,原因是全球呼吸系统疾病增加、患有血液相关疾病的老龄人口增加以及免疫球蛋白的使用增加。需要使用血浆疗法或血浆衍生物的罕见疾病的增加也是市场增长的主要因素。研发投资的增加也使欧洲血浆分离市场蓬勃发展。

然而,政府对血浆疗法的严格监管限制了血浆分离市场的增长。此外,血浆蛋白的短缺也阻碍了市场的增长。

This plasma fractionation market report provides details of market share, new developments, and product pipeline analysis, impact of domestic and localised market players, analyses opportunities in terms of emerging revenue pockets, changes in market regulations, product approvals, strategic decisions, product launches, geographic expansions, and technological innovations in the market. To understand the analysis and the market scenario contact us for an Analyst Brief, our team will help you create a revenue impact solution to achieve your desired goal.

欧洲血浆分离市场Europe Plasma Fractionation Market Scope and Market Size

Europe plasma fractionation market is segmented into six notable segments which are based on the product type, application, processing technology, mode, end user and distribution channel. The growth among segments helps you analyse niche pockets of growth and strategies to approach the market and determine your core application areas and the difference in your target markets.

  • On the basis of product type, the plasma fractionation market is segmented into immunoglobulins, coagulation factor concentrate, albumin, protease inhibitors and other products. In 2021, immunoglobulin has the largest market share owing to the factors that they can be used in the treatment of immunodeficiency and auto immune disorders treatments.
  • On the basis of application, the plasma fractionation market is segmented into neurology, immunology, haematology, critical care, pulmonology, hemato- oncology, rheumatology and others. In 2021, immunology has the largest market share owing to the factors increasing in the incidences of immunology disorders among the patients.
  • On the basis of processing technology, the plasma fractionation market is segmented into Ion- exchange chromatography, affinity chromatography, cryopreservation, ultrafiltration and microfiltration. In 2021, Ion- exchange chromatography has the largest market share owing to the factor such as the increasing efficiency by using ionic substances and charged molecules.
  • On the basis of mode, the plasma fractionation market is segmented into modern plasma fraction and traditional plasma fractionation. In 2021, modern plasma fractions have the largest market share owing to the factors such as the adopting new equipment and techniques for the plasma fractionation process.
  • On the basis of end user, the plasma fractionation market is segmented into Hospitals & clinics, clinical research laboratories academic institutions and others. In 2021, hospitals & clinics has the largest market share due to increase in the emergency cases where the patients need to be treated effective and permanently.
  • On the basis of distribution channel, the plasma fractionation market is segmented into direct tenders, third party distribution and others. In 2021, direct tenders have the largest market share due to the ease if distribution of the plasma products with a lot of consumer interest.

Europe Plasma Fractionation Market: Country Level Analysis

Europe plasma fractionation market is analysed and market size information is provided by country, product type, application, processing technology, mode, end user and distribution channel as referenced above.

The countries covered in the Europe plasma fractionation market report are Germany, France, U.K., Italy, Spain, Russia, Turkey, Netherlands, Switzerland and rest of Europe.

Germany is dominating in the Europe plasma fractionation market with the highest CAGR due to increase in the demand for plasma fractionation and growing concern over the human health.

The country section of the report also provides individual market impacting factors and changes in regulation in the market domestically that impacts the current and future trends of the market. Data points such as new sales, replacement sales, country demographics, regulatory acts and import-export tariffs are some of the major pointers used to forecast the market scenario for individual countries. Also, presence and availability of Europe brands and their challenges faced due to large or scarce competition from local and domestic brands, impact of sales channels are considered while providing forecast analysis of the country data.

Rising Demand of Plasma Fractionation

Europe plasma fractionation market also provides you with detailed market analysis for every country growth in industry with sales, components sales, impact of technological development in plasma fractionation and changes in regulatory scenarios with their support for the plasma fractionation product market. The data is available for historic period 2010-2019.

Competitive Landscape and Europe Plasma Fractionation Market Share Analysis

Europe plasma fractionation market competitive landscape provides details by competitor. Details included are company overview, company financials, revenue generated, market potential, investment in research and development, new market initiatives, India presence, production sites and facilities, company strengths and weaknesses, product launch, product trials pipelines, product approvals, patents, product width and breadth, application dominance, technology lifeline curve. The above data points provided are only related to the companies’ focus related to Europe plasma fractionation market.

Some of the major players operating in the plasma fractionation market are Grifols, S.A., Takeda Pharmaceutical Company Limited, Octapharma AG, CSL Plasma, LFB SA, Green Cross Corp., Baxter, Bio Products Laboratory Ltd., Novasep Holding SAS, Pall Corporation, Bharat Serums and Vaccines Limited (BSV), Kedrion S.p.A, Sanquin, Biotest AG, Merck KGaA, ADMA Biologics, Inc., Boccard, Intas Pharmaceuticals Ltd. and CENTURION Ilaç Sanayi ve Ticaret A.S. among others. DBMR analysts understand competitive strengths and provide competitive analysis for each competitor separately.

全球各地的公司也推出了许多产品,这也加速了欧洲血浆分离市场的增长。

例如,

  • 2020 年 4 月,Grifols 在血浆分馏市场推出了 3 毫升瓶装 Hyper RAB,这是一种狂犬病免疫球蛋白,可帮助治疗世界各地的狂犬病病例。

市场参与者的合作、合资和其他策略正在扩大公司在血浆分馏市场的影响力,这也为组织的增长速度带来了益处。


SKU-

Get online access to the report on the World's First Market Intelligence Cloud

  • Interactive Data Analysis Dashboard
  • Company Analysis Dashboard for high growth potential opportunities
  • Research Analyst Access for customization & queries
  • Competitor Analysis with Interactive dashboard
  • Latest News, Updates & Trend analysis
  • Harness the Power of Benchmark Analysis for Comprehensive Competitor Tracking
Request for Demo

目录

  1. introduction
    1. OBJECTIVES OF THE STUDY
    2. MARKET DEFINITION
    3. OVERVIEW of Europe plasma fractionation market
    4. LIMITATIONs
    5. MARKETS COVERED
  2. MARKET SEGMENTATION
    1. MARKETS COVERED
    2. geographical scope
    3. years considered for the study
    4. currency and pricing
    5. DBMR TRIPOD DATA VALIDATION MODEL
    6. MULTIVARIATE MODELLING
    7. product type LIFELINE CURVE
    8. primary interviews with key opinion leaders
    9. DBMR MARKET POSITION GRID
    10. vendor share analysis
    11. MARKET APPLICATION COVERAGE GRID
    12. secondary sourcEs
    13. assumptions
  3. EXECUTIVE SUMMARY
  4. premium insights
    1. PRODUCTION FACILITIES FOR BLOOD PLASMA:
    2. Suppliers of process lines for plasma fractionation
      1. RAW MATERIAL PROCUREMENT
      2. MANUFACTURING
      3. MARKETING & DISTRIBUTION
      4. END-USERS
  5. EUROPE PLASMA FRACTIONATION MARKET: REGULATORY
    1. THE U.S.
    2. INDIA
    3. EUROPE
    4. BRAZIL
    5. SOUTH AFRICA
  6. MARKET OVERVIEW
    1. 3.1 DRIVERS
      1. 3.1.1 INCREASE IN RARE DISEASES THAT REQUIRES USE OF PLASMA THERAPY OR PLASMA DERIVATIVE
      2. RISE IN RESPIRATORY DISEASES ACROSS THE WORLD
      3. INCREASE IN AGING POPULATION WITH BLOOD-RELATED AILMENTS
      4. INCREASE USAGE OF IMMUNOGLOBULIN
    2. RESTRAINTS
      1. GROWING USAGE OF RECOMBINANT PROTEIN PRODUCTS
      2. STRINGENT GOVERNMENT REGULATIONS REGARDING PLASMA THERAPY
      3. RISK OF QUALITY AND SAFETY
    3. OPPORTUNITIES
      1. INCREASE IN PLASMA COLLECTION CENTRES
      2. UNHEALTHY LIFESTYLE POSSESS SERIOUS INFLAMMATION RISK
      3. ADVANCEMENT IN TECHNOLOGIES
    4. CHALLENGES
      1. SHORTAGE OF PLASMA PROTEINS
      2. HIGH COST OF PLASMA THERAPY
  7. IMPACT OF COVID-19 ON THE EUROPE PLASMA FRACTIONATION MARKET
    1. IMPACT ON PRICE
    2. IMPACT ON DEMAND
    3. IMPACT ON SUPPLY CHAIN
    4. STRATEGIC DECISIONS FOR MANUFACTURERS
    5. CONCLUSION
  8. Europe Plasma fractionation market, by Product type
    1. overview
    2. immunoglobulins
      1. Intravenous Immunoglobulins
      2. Subcutaneous Immunoglobulins
      3. Other Immunoglobulins
    3. coagulation factor concentrates
      1. factor IX
      2. Factor VIII
      3. Fibrinogen Concentrates
      4. Prothrombin Complex Concentrate
      5. Von Willebrand Factor
      6. factor XIII
    4. Albumin
    5. Protease Inhibitors
    6. other Products
  9. Europe Plasma fractionation market, by Application
    1. overview
    2. Immunology
    3. Haematology
    4. critical Care
    5. Neurology
    6. Pulmonology
    7. Haemato-Oncology
    8. Rheumatology
    9. other Application
  10. Europe Plasma fractionation market, by Processing Technology
    1. overview
    2. Ion-Exchange Chromatography
    3. Affinity Chromatography
    4. Ultrafiltration
    5. Microfiltration
    6. Cryoprecipitation
  11. Europe Plasma fractionation market, by mode
    1. overview
    2. Modern Plasma fractionation
    3. Traditional Plasma fractionation
  12. Europe Plasma fractionation market, by end user
    1. overview
    2. Hospitals & Clinics
    3. Clinical Research Laboratories
    4. Academic Institutes
    5. others
  13. Europe Plasma fractionation market, by distribution channel
    1. overview
    2. Direct Tenders
    3. Third Party Distribution
    4. others
  14. EUROPE Plasma Fractionation market, by REGION
    1. Europe
      1. GERMANY
      2. France
      3. U.K.
      4. italy
      5. spain
      6. russia
      7. turkey
      8. netherlands
      9. switzerland
      10. rest of europe
  15. Europe PLASMA FRACTIONATION Market: COMPANY landscape
    1. company share analysis: Europe
  16. swot analysis
  17. company profile
    1. CSL PLASMA
      1. COMPANY SNAPSHOT
      2. company share analysis
      3. PRODUCT PORTFOLIO
      4. RECENT DEVELOPMENTS
    2. GRIFOLS, S.A.
      1. COMPANY SNAPSHOT
      2. REVENUE ANALYSIS
      3. company share analysis
      4. PRODUCT PORTFOLIO
      5. RECENT DEVELOPMENTS
    3. OCTAPHARMA ag
      1. COMPANY SNAPSHOT
      2. company share analysis
      3. PRODUCT PORTFOLIO
      4. RECENT DEVELOPMENTS
    4. KENDRION S.P.A
      1. COMPANY SNAPSHOT
      2. REVENUE ANALYSIS
      3. company share analysis
      4. PRODUCT PORTFOLIO
      5. RECENT DEVELOPMENTS
    5. Takeda Pharmaceutical Company Limited
      1. COMPANY SNAPSHOT
      2. REVENUE ANALYSIS
      3. PRODUCT PORTFOLIO
      4. RECENT DEVELOPMENTS
    6. baxter
      1. COMPANY SNAPSHOT
      2. REVENUE ANALYSIS
      3. PRODUCT PORTFOLIO
      4. RECENT DEVELOPMENT
    7. ADMA BIOLOGICS INC.
      1. COMPANY SNAPSHOT
      2. REVENUE ANALYSIS
      3. PRODUCT PORTFOLIO
      4. RECENT DEVELOPMENT
    8. bharat serums and vaccines limited (BSV)
      1. COMPANY SNAPSHOT
      2. PRODUCT PORTFOLIO
      3. RECENT DEVELOPMENT
    9. Bio Products Laboratory Ltd.
      1. COMPANY SNAPSHOT
      2. PRODUCT PORTFOLIO
      3. RECENT DEVELOPMENT
    10. biotest AG
      1. COMPANY SNAPSHOT
      2. REVENUE ANALYSIS
      3. PRODUCT PORTFOLIO
      4. RECENT DEVELOPMENTS
    11. Boccard
      1. COMPANY SNAPSHOT
      2. PRODUCT PORTFOLIO
      3. RECENT DEVELOPMENT
    12. CENTURION İlaç Sanayi ve Ticaret A.Ş.
      1. COMPANY SNAPSHOT
      2. PRODUCT PORTFOLIO
      3. RECENT DEVELOPMENT
    13. China Biologic Products Holdings, Inc.
      1. COMPANY SNAPSHOT
      2. PRODUCT PORTFOLIO
      3. RECENT DEVELOPMENTS
    14. green cross CORP.
      1. COMPANY SNAPSHOT
      2. REVENUE ANALYSIS
      3. PRODUCT PORTFOLIO
      4. RECENT DEVELOPMENTS
    15. intas pharmaceutical ltd.
      1. COMPANY SNAPSHOT
      2. PRODUCT PORTFOLIO
      3. RECENT DEVELOPMENT
    16. japan blood products Organization
      1. COMPANY SNAPSHOT
      2. PRODUCT PORTFOLIO
      3. RECENT DEVELOPMENT
    17. KABAFUSION
      1. COMPANY SNAPSHOT
      2. PRODUCT PORTFOLIO
      3. RECENT DEVELOPMENTS
    18. LFB SA
      1. COMPANY SNAPSHOT
      2. PRODUCT PORTFOLIO
      3. RECENT DEVELOPMENTS
    19. Merck kgaa
      1. COMPANY SNAPSHOT
      2. REVENUE ANALYSIS
      3. PRODUCT PORTFOLIO
      4. RECENT DEVELOPMENT
    20. NOVASEP HOLDING SAS
      1. COMPANY SNAPSHOT
      2. PRODUCT PORTFOLIO
      3. RECENT DEVELOPMENTS
    21. PALL CORPORATION
      1. COMPANY SNAPSHOT
      2. PRODUCT PORTFOLIO
      3. RECENT DEVELOPMENT
    22. sanquin
      1. COMPANY SNAPSHOT
      2. REVENUE ANALYSIS
      3. PRODUCT PORTFOLIO
      4. RECENT DEVELOPMENT
    23. shanghai raas
      1. COMPANY SNAPSHOT
      2. REVENUE ANALYSIS
      3. PRODUCT PORTFOLIO
      4. RECENT DEVELOPMENT
    24. SICHUAN YUANDA SHUYANG PHARMACEUTICAL CO., LTD
      1. COMPANY SNAPSHOT
      2. PRODUCT PORTFOLIO
      3. RECENT DEVELOPMENTS
    25. Sk plasma
      1. COMPANY SNAPSHOT
      2. PRODUCT PORTFOLIO
      3. RECENT DEVELOPMENT
  18. questionnaire
  19. related reports

表格列表

TABLE 1 Europe Plasma fractionation Market, by Product type, 2019-2028 (USD million)

TABLE 2 Europe Immunoglobulins in Plasma fractionation Market, By Region, 2019-2028 (USD Million)

TABLE 3 Europe Immunoglobulins in Plasma fractionation Market, Product type, 2019-2028 (USD million)

TABLE 4 Europe Coagulation factor concentrates in Plasma fractionation Market, by region, 2019-2028 (USD million)

TABLE 5 Europe Coagulation factor concentrates in Plasma fractionation Market, Product type, 2019-2028 (USD million)

TABLE 6 Europe Albumin in Plasma fractionation Market, by region, 2019-2028 (USD million)

TABLE 7 Europe Protease Inhibitors in Plasma fractionation Market, by region, 2019-2028 (USD million)

TABLE 8 Europe Other Products in Plasma fractionation Market, By Region, 2019-2028 (USD Million)

TABLE 9 Europe Plasma fractionation Market, application, 2019-2028 (USD million)

TABLE 10 Europe Immunology in Plasma fractionation Market, by region, 2019-2028 (USD million)

TABLE 11 Europe Haematology in Plasma fractionation Market, by region, 2019-2028 (USD million)

TABLE 12 Europe Critical care in Plasma fractionation Market, by region, 2019-2028 (USD million)

TABLE 13 Europe Neurology in Plasma fractionation Market, by region, 2019-2028 (USD million)

TABLE 14 Europe Pulmonology in Plasma fractionation Market, by region, 2019-2028 (USD million)

TABLE 15 Europe Haemato-Oncology in Plasma fractionation Market, by region, 2019-2028 (USD million)

TABLE 16 Europe Rheumatology in Plasma fractionation Market, by region, 2019-2028 (USD million)

TABLE 17 Europe Other Application in Plasma fractionation Market, by region, 2019-2028 (USD million)

TABLE 18 Europe Plasma fractionation Market, Processing Technology, 2019-2028 (USD million)

TABLE 19 Europe Ion-Exchange Chromatography in Plasma fractionation Market, by region, 2019-2028 (USD million)

TABLE 20 Europe Affinity Chromatography in Plasma fractionation Market, by region, 2019-2028 (USD million)

TABLE 21 Europe Ultrafiltration in Plasma fractionation Market, by region, 2019-2028 (USD million)

TABLE 22 Europe Microfiltration in Plasma fractionation Market, by region, 2019-2028 (USD million)

TABLE 23 Europe Cryoprecipitation in Plasma fractionation Market, by region, 2019-2028 (USD million)

TABLE 24 Europe Plasma fractionation Market, mode, 2019-2028 (USD million)

TABLE 25 Europe Modern Plasma fractionation in Plasma fractionation Market, by region, 2019-2028 (USD million)

TABLE 26 Europe Traditional Plasma fractionation in Plasma fractionation Market, by region, 2019-2028 (USD million)

TABLE 27 Europe Plasma fractionation Market, end user, 2019-2028 (USD million)

TABLE 28 Europe Hospitals & Clinics in Plasma fractionation Market, by region, 2019-2028 (USD million)

TABLE 29 Europe Clinical Research Laboratories in Plasma fractionation Market, by region, 2019-2028 (USD million)

TABLE 30 Europe Academic Institutes in Plasma fractionation Market, by region, 2019-2028 (USD million)

TABLE 31 Europe Others in Plasma fractionation Market, by region, 2019-2028 (USD million)

TABLE 32 Europe Plasma fractionation Market, distribution channel, 2019-2028 (USD million)

TABLE 33 Europe Direct Tenders in Plasma fractionation Market, by region, 2019-2028 (USD million)

TABLE 34 Europe Third Party Distribution in Plasma fractionation Market, by region, 2019-2028 (USD million)

TABLE 35 Europe Others in Plasma fractionation Market, by region, 2019-2028 (USD million)

TABLE 36 Europe plasma fractionation market, By COUNTRY, 2019-2028 (USD million)

TABLE 37 Europe Plasma fractionation Market, By Product type, 2019-2028 (USD Million)

TABLE 38 Europe immunoglobulins in plasma fractionation market, By product type, 2019-2028 (USD million)

TABLE 39 Europe Coagulation factor concentrates in Plasma fractionation Market, By product type, 2019-2028 (USD Million)

TABLE 40 Europe Plasma fractionation Market, By application, 2019-2028 (USD Million)

TABLE 41 Europe Plasma fractionation Market, By processing technology, 2019-2028 (USD Million)

TABLE 42 Europe Plasma fractionation Market, By mode, 2019-2028 (USD Million)

TABLE 43 Europe Plasma fractionation Market, By end user, 2019-2028 (USD Million)

TABLE 44 Europe Plasma fractionation Market, By distribution channel, 2019-2028 (USD MILLION)

TABLE 45 Germany Plasma fractionation Market, By Product type, 2019-2028 (USD Million)

TABLE 46 Germany immunoglobulins in plasma fractionation market, By product type, 2019-2028 (USD million)

TABLE 47 Germany Coagulation factor concentrates in Plasma fractionation Market, By product type, 2019-2028 (USD Million)

TABLE 48 Germany Plasma fractionation Market, By application, 2019-2028 (USD Million)

TABLE 49 Germany Plasma fractionation Market, By processing technology, 2019-2028 (USD Million)

TABLE 50 Germany Plasma fractionation Market, By mode, 2019-2028 (USD Million)

TABLE 51 Germany Plasma fractionation Market, By end user, 2019-2028 (USD Million)

TABLE 52 Germany Plasma fractionation Market, By distribution channel, 2019-2028 (USD MILLION)

TABLE 53 france Plasma fractionation Market, By Product type, 2019-2028 (USD Million)

TABLE 54 france immunoglobulins in plasma fractionation market, By product type, 2019-2028 (USD million)

TABLE 55 france Coagulation factor concentrates in Plasma fractionation Market, By product type, 2019-2028 (USD Million)

TABLE 56 france Plasma fractionation Market, By application, 2019-2028 (USD Million)

TABLE 57 france Plasma fractionation Market, By processing technology, 2019-2028 (USD Million)

TABLE 58 france Plasma fractionation Market, By mode, 2019-2028 (USD Million)

TABLE 59 france Plasma fractionation Market, By end user, 2019-2028 (USD Million)

TABLE 60 france Plasma fractionation Market, By distribution channel, 2019-2028 (USD MILLION)

TABLE 61 U.K. Plasma fractionation Market, By Product type, 2019-2028 (USD Million)

TABLE 62 U.K. immunoglobulins in plasma fractionation market, By product type, 2019-2028 (USD million)

TABLE 63 U.K. Coagulation factor concentrates in Plasma fractionation Market, By product type, 2019-2028 (USD Million)

TABLE 64 U.K. Plasma fractionation Market, By application, 2019-2028 (USD Million)

TABLE 65 U.K. Plasma fractionation Market, By processing technology, 2019-2028 (USD Million)

TABLE 66 U.K. Plasma fractionation Market, By mode, 2019-2028 (USD Million)

TABLE 67 U.K. Plasma fractionation Market, By end user, 2019-2028 (USD Million)

TABLE 68 U.K. Plasma fractionation Market, By distribution channel, 2019-2028 (USD MILLION)

TABLE 69 italy Plasma fractionation Market, By Product type, 2019-2028 (USD Million)

TABLE 70 italy immunoglobulins in plasma fractionation market, By product type, 2019-2028 (USD million)

TABLE 71 italy Coagulation factor concentrates in Plasma fractionation Market, By product type, 2019-2028 (USD Million)

TABLE 72 italy Plasma fractionation Market, By application, 2019-2028 (USD Million)

TABLE 73 italy Plasma fractionation Market, By processing technology, 2019-2028 (USD Million)

TABLE 74 italy Plasma fractionation Market, By mode, 2019-2028 (USD Million)

TABLE 75 italy Plasma fractionation Market, By end user, 2019-2028 (USD Million)

TABLE 76 italy Plasma fractionation Market, By distribution channel, 2019-2028 (USD MILLION)

TABLE 77 Spain Plasma fractionation Market, By Product type, 2019-2028 (USD Million)

TABLE 78 Spain immunoglobulins in plasma fractionation market, By product type, 2019-2028 (USD million)

TABLE 79 Spain Coagulation factor concentrates in Plasma fractionation Market, By product type, 2019-2028 (USD Million)

TABLE 80 Spain Plasma fractionation Market, By application, 2019-2028 (USD Million)

TABLE 81 Spain Plasma fractionation Market, By processing technology, 2019-2028 (USD Million)

TABLE 82 Spain Plasma fractionation Market, By mode, 2019-2028 (USD Million)

TABLE 83 Spain Plasma fractionation Market, By end user, 2019-2028 (USD Million)

TABLE 84 Spain Plasma fractionation Market, By distribution channel, 2019-2028 (USD MILLION)

TABLE 85 Russia Plasma fractionation Market, By Product type, 2019-2028 (USD Million)

TABLE 86 Russia immunoglobulins in plasma fractionation market, By product type, 2019-2028 (USD million)

TABLE 87 Russia Coagulation factor concentrates in Plasma fractionation Market, By product type, 2019-2028 (USD Million)

TABLE 88 Russia Plasma fractionation Market, By application, 2019-2028 (USD Million)

TABLE 89 Russia Plasma fractionation Market, By processing technology, 2019-2028 (USD Million)

TABLE 90 Russia Plasma fractionation Market, By mode, 2019-2028 (USD Million)

TABLE 91 Russia Plasma fractionation Market, By end user, 2019-2028 (USD Million)

TABLE 92 Russia Plasma fractionation Market, By distribution channel, 2019-2028 (USD MILLION)

TABLE 93 Turkey Plasma fractionation Market, By Product type, 2019-2028 (USD Million)

TABLE 94 Turkey immunoglobulins in plasma fractionation market, By product type, 2019-2028 (USD million)

TABLE 95 Turkey Coagulation factor concentrates in Plasma fractionation Market, By product type, 2019-2028 (USD Million)

TABLE 96 Turkey Plasma fractionation Market, By application, 2019-2028 (USD Million)

TABLE 97 Turkey Plasma fractionation Market, By processing technology, 2019-2028 (USD Million)

TABLE 98 Turkey Plasma fractionation Market, By mode, 2019-2028 (USD Million)

TABLE 99 Turkey Plasma fractionation Market, By end user, 2019-2028 (USD Million)

TABLE 100 Turkey Plasma fractionation Market, By distribution channel, 2019-2028 (USD MILLION)

TABLE 101 Netherlands Plasma fractionation Market, By Product type, 2019-2028 (USD Million)

TABLE 102 Netherlands immunoglobulins in plasma fractionation market, By product type, 2019-2028 (USD million)

TABLE 103 Netherlands Coagulation factor concentrates in Plasma fractionation Market, By product type, 2019-2028 (USD Million)

TABLE 104 Netherlands Plasma fractionation Market, By application, 2019-2028 (USD Million)

TABLE 105 Netherlands Plasma fractionation Market, By processing technology, 2019-2028 (USD Million)

TABLE 106 Netherlands Plasma fractionation Market, By mode, 2019-2028 (USD Million)

TABLE 107 Netherlands Plasma fractionation Market, By end user, 2019-2028 (USD Million)

TABLE 108 Netherlands Plasma fractionation Market, By distribution channel, 2019-2028 (USD MILLION)

TABLE 109 Switzerland Plasma fractionation Market, By Product type, 2019-2028 (USD Million)

TABLE 110 Switzerland immunoglobulins in plasma fractionation market, By product type, 2019-2028 (USD million)

TABLE 111 Switzerland Coagulation factor concentrates in Plasma fractionation Market, By product type, 2019-2028 (USD Million)

TABLE 112 Switzerland Plasma fractionation Market, By application, 2019-2028 (USD Million)

TABLE 113 Switzerland Plasma fractionation Market, By processing technology, 2019-2028 (USD Million)

TABLE 114 Switzerland Plasma fractionation Market, By mode, 2019-2028 (USD Million)

TABLE 115 Switzerland Plasma fractionation Market, By end user, 2019-2028 (USD Million)

TABLE 116 Switzerland Plasma fractionation Market, By distribution channel, 2019-2028 (USD MILLION)

TABLE 117 Rest of Europe Plasma fractionation Market, By Product type, 2019-2028 (USD Million)

图片列表

FIGURE 1 Europe plasma fractionation MARKET: segmentation

FIGURE 2 EUROPE PLASMA FRACTIONATION MARKET : data triangulation

FIGURE 3 Europe plasma fractionation MARKET: DROC ANALYSIS

FIGURE 4 Europe plasma fractionation MARKET: EUROPE VS REGIONAL MARKET ANALYSIS

FIGURE 5 EUROPE PLASMA FRACTIONATION MARKET : COMPANY RESEARCH ANALYSIS

FIGURE 6 EUROPE PLASMA FRACTIONATION MARKET : INTERVIEW DEMOGRAPHICS

FIGURE 7 Europe plasma fractionation MARKET: DBMR MARKET POSITION GRID

FIGURE 8 EUROPE PLASMA FRACTIONATION MARKET : vendor share analysis

FIGURE 9 Europe plasma fractionation market: MARKET APPLICATION COVERAGE GRID

FIGURE 10 Europe plasma fractionation MARKET: SEGMENTATION

FIGURE 11 Increase in rare diseases that requires use of plasma therapy or plasma derivative is expected to drive the growth of the Europe plasma fractionation market IN THE FORECAST PERIOD of 2021 To 2028

FIGURE 12 immunoglobulins segment is expected to account for the largest share of the Europe plasma fractionation market in 2021 & 2028

FIGURE 13 DRIVERS, RESTRAINTS, OPPORTUNITIES, AND CHALLENGES OF EUROPE PLASMA FRACTIONATION MARKET

FIGURE 14 Europe Plasma fractionation Market: BY Product Type, 2020

FIGURE 15 Europe Plasma fractionation Market: BY Product Type, 2020-2028 (USD Million)

FIGURE 16 Europe Plasma fractionation Market: BY Product Type, CAGR (2020-2028)

FIGURE 17 Europe Plasma fractionation Market: BY Product Type, LIFELINE CURVE

FIGURE 18 Europe Plasma fractionation Market: BY application, 2020

FIGURE 19 Europe Plasma fractionation Market: BY application, 2020-2028 (USD Million)

FIGURE 20 Europe Plasma fractionation Market: BY application, CAGR (2020-2028)

FIGURE 21 Europe Plasma fractionation Market: BY application, LIFELINE CURVE

FIGURE 22 Europe Plasma fractionation Market: BY Processing Technology, 2020

FIGURE 23 Europe Plasma fractionation Market: BY Processing Technology, 2020-2028 (USD Million)

FIGURE 24 Europe Plasma fractionation Market: BY Processing Technology, CAGR (2020-2028)

FIGURE 25 Europe Plasma fractionation Market: BY Processing Technology, LIFELINE CURVE

FIGURE 26 Europe Plasma fractionation Market: BY mode, 2020

FIGURE 27 Europe Plasma fractionation Market: BY mode, 2020-2028 (USD Million)

FIGURE 28 Europe Plasma fractionation Market: BY mode, CAGR (2020-2028)

FIGURE 29 Europe Plasma fractionation Market: BY mode, LIFELINE CURVE

FIGURE 30 Europe Plasma fractionation Market: BY end user, 2020

FIGURE 31 Europe Plasma fractionation Market: BY end user, 2020-2028 (USD Million)

FIGURE 32 Europe Plasma fractionation Market: BY end user, CAGR (2020-2028)

FIGURE 33 Europe Plasma fractionation Market: BY end user, LIFELINE CURVE

FIGURE 34 Europe Plasma fractionation Market: BY distribution channel, 2020

FIGURE 35 Europe Plasma fractionation Market: BY distribution channel, 2020-2028 (USD Million)

FIGURE 36 Europe Plasma fractionation Market: BY distribution channel, CAGR (2020-2028)

FIGURE 37 Europe Plasma fractionation Market: BY distribution channel, LIFELINE CURVE

FIGURE 38 Europe plasma fractionation market: SNAPSHOT (2020)

FIGURE 39 Europe plasma fractionation market: BY COUNTRY (2020)

FIGURE 40 Europe plasma fractionation market: BY COUNTRY (2021 & 2028)

FIGURE 41 Europe plasma fractionation market: BY COUNTRY (2020 & 2028)

FIGURE 42 Europe plasma fractionation market: BY PRODUCT TYPE (2021 & 2028)

FIGURE 43 Europe Plasma Fractionation Market: company share 2020 (%)

查看详细信息 Right Arrow

研究方法

Data collection and base year analysis are done using data collection modules with large sample sizes. The stage includes obtaining market information or related data through various sources and strategies. It includes examining and planning all the data acquired from the past in advance. It likewise envelops the examination of information inconsistencies seen across different information sources. The market data is analysed and estimated using market statistical and coherent models. Also, market share analysis and key trend analysis are the major success factors in the market report. To know more, please request an analyst call or drop down your inquiry.

The key research methodology used by DBMR research team is data triangulation which involves data mining, analysis of the impact of data variables on the market and primary (industry expert) validation. Data models include Vendor Positioning Grid, Market Time Line Analysis, Market Overview and Guide, Company Positioning Grid, Patent Analysis, Pricing Analysis, Company Market Share Analysis, Standards of Measurement, Global versus Regional and Vendor Share Analysis. To know more about the research methodology, drop in an inquiry to speak to our industry experts.

可定制

Data Bridge Market Research is a leader in advanced formative research. We take pride in servicing our existing and new customers with data and analysis that match and suits their goal. The report can be customized to include price trend analysis of target brands understanding the market for additional countries (ask for the list of countries), clinical trial results data, literature review, refurbished market and product base analysis. Market analysis of target competitors can be analyzed from technology-based analysis to market portfolio strategies. We can add as many competitors that you require data about in the format and data style you are looking for. Our team of analysts can also provide you data in crude raw excel files pivot tables (Fact book) or can assist you in creating presentations from the data sets available in the report.