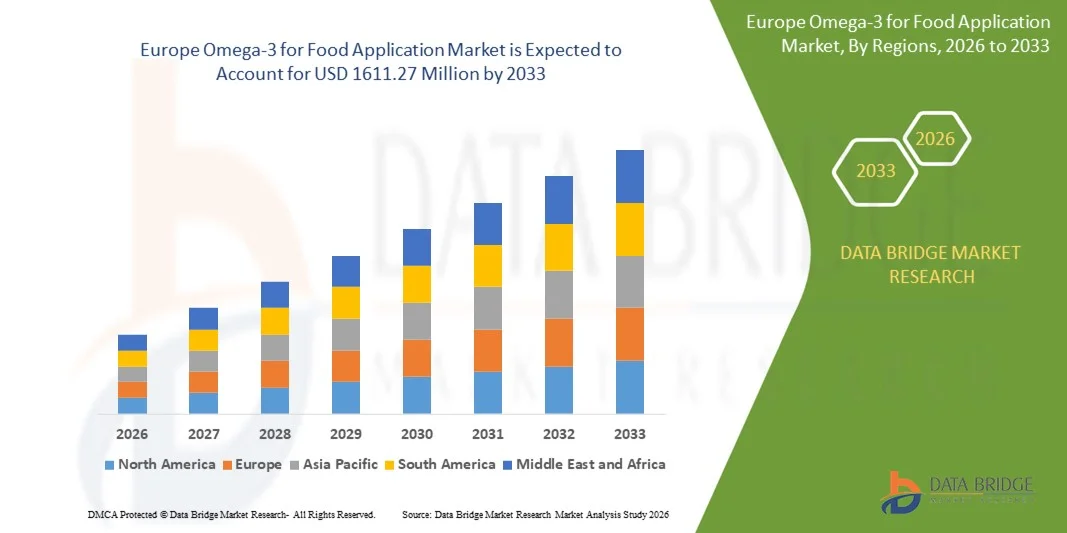
欧洲食品应用 Omega-3 市场,按类型(α-亚麻酸 (ALA)、二十碳五烯酸 (EPA)、二十二碳六烯酸 (DHA)、二十碳五烯酸 (EPA) + 和二十二碳六烯酸 (DHA))、来源(海洋基、藻类基和植物基)、形式(油和粉末)、应用(功能性食品、糖果和巧克力产品、运动营养、膳食补充剂、婴儿配方奶粉等)、功能(食品强化、骨骼和关节健康、皮肤健康、头发健康、指甲健康等)、国家(德国、英国、意大利、法国、西班牙、瑞士、荷兰、比利时、俄罗斯、丹麦、瑞典、波兰、土耳其、欧洲其他地区)行业趋势和预测到 2028 年。
市场分析和洞察:欧洲 Omega-3 食品应用市场
预计在 2020 年至 2028 年的预测期内,食品应用 Omega-3 市场将实现市场增长。Data Bridge Market Research 分析,在 2020 年至 2028 年的预测期内,该市场将以 10.2% 的复合年增长率增长,预计到 2028 年将达到 991,430.59 万美元。预计 Omega-3 生产原材料的丰富供应将推动食品应用 Omega-3 市场的增长。
Omega-3 是多不饱和脂肪酸,其碳氢链的最后一个双键位于分子羧基对面第三和第四个碳原子之间。Omega-3 脂肪酸是人体无法自行产生的必需脂肪酸家族。Omega -3在维持身体功能方面发挥着重要作用,并为眼睛、心血管健康等带来多种健康益处。
欧米伽-3 脂肪酸在维持健康方面发挥着重要作用,预计将推动食品用欧米伽-3 市场的增长。鱼类是欧米伽-3 最有效的来源,而欧米伽-3 脂肪酸的增长预计将限制食品用欧米伽-3 市场的增长。技术的各种进步将提高原材料的生产能力,这可能是食品用欧米伽-3 市场中欧米伽-3 制造商的机遇。欧米伽-3 的复杂加工可能对食品用欧米伽-3 市场构成挑战。
这份食品应用 omega-3 市场报告提供了市场份额、新发展和产品线分析、国内和本地市场参与者的影响的详细信息,分析了新兴收入来源、市场法规变化、产品审批、战略决策、产品发布、地域扩张和市场技术创新方面的机会。要了解分析和市场情况,请联系我们获取分析师简报,我们的团队将帮助您创建收入影响解决方案,以实现您的预期目标。
欧洲 Omega-3 食品应用市场范围和市场规模
食品应用市场中的 omega-3 被划分为五个显著的细分市场,这些细分市场基于类型、来源、形式、应用和功能。细分市场之间的增长有助于您分析利基增长领域和进入市场的策略,并确定您的核心应用领域和目标市场的差异。
- 根据类型,食品应用市场中的 omega-3 细分为 α-亚麻酸 (ALA)、二十碳五烯酸 (EPA)、二十二碳六烯酸 (DHA)、二十碳五烯酸 (EPA)+ 和二十二碳六烯酸 (DHA)。2021 年,二十碳五烯酸 (EPA)+二十二碳六烯酸 (DHA) 细分市场拥有最大的市场份额,这是由于 EPA 和 DHA 消费带来的大量健康益处等因素,因此许多制造商都在使用 EPA 和 DHA 的组合。
- 根据来源,食品应用市场中的 omega-3 分为海洋源、藻类源和植物源。2021 年,海洋源细分市场占有最大的市场份额,这是由于鱼类和鱼油生产 omega-3 的效率高等因素。
- 根据形式,食品应用市场中的 omega-3 分为油和粉末。2021 年,油类占据最大的市场份额,这是因为油在食品和膳食补充剂产品(例如软胶囊)中的应用非常广泛。
- 根据应用,食品用 Omega-3 市场细分为功能性食品、糖果和巧克力产品、运动营养、膳食补充剂、婴儿配方奶粉等。2021 年,膳食补充剂领域拥有最大的市场份额,原因是全球消费者的健康意识不断增强,消费者 Omega-3 缺乏率不断上升。
- 根据功能,食品应用市场中的 omega-3 细分为食品强化、骨骼和关节健康、皮肤健康、头发健康、指甲健康等。2021 年,骨骼和关节健康领域拥有最大的市场份额,这是由于 omega-3 在骨骼和关节健康中的应用范围很广,而且各年龄段的骨质疏松症发病率都在增加。
Omega-3 食品应用市场国家级分析
对食品应用市场中的 omega-3 进行了分析,并按上述国家、类型、来源、形式、应用和功能提供了市场规模信息。
欧洲食品应用 omega-3 市场涵盖的国家包括德国、英国、意大利、法国、西班牙、瑞士、荷兰、比利时、俄罗斯、丹麦、瑞典、波兰、土耳其和欧洲其他国家。
由于德国主要工业家不断开发以 omega-3 作为食品应用成分的新产品,预计德国将在 2021 年至 2028 年的预测期内占据市场主导地位并以最高增长率增长。由于越来越多的健康意识强的消费者选择含有 omega-3 成分的食品,法国在市场上占据主导地位。在英国,由于消费者意识到 Omega-3 的健康益处,市场占据主导地位。
报告的国家部分还提供了影响市场当前和未来趋势的各个市场影响因素和国内市场监管变化。新销售、替代销售、国家人口统计、监管法案和进出口关税等数据点是用于预测各个国家市场情景的一些主要指标。此外,全球品牌的存在和可用性以及由于来自本地和国内品牌的激烈或稀缺竞争而面临的挑战会影响销售渠道,同时提供国家数据的预测分析。
食品对 Omega-3 的需求不断增长
食品用 omega-3 市场还为您提供每个国家/地区行业增长的详细市场分析,包括销售额、零部件销售额、食品用 omega-3 技术发展的影响以及监管环境的变化及其对食品用 omega-3 市场的支持。数据涵盖 2010 年至 2019 年的历史时期。
竞争格局和 Omega-3 食品应用市场份额分析
食品应用 omega-3 市场竞争格局按竞争对手提供详细信息。详细信息包括公司概况、公司财务状况、收入、市场潜力、研发投资、新市场计划、全球影响力、生产基地和设施、公司优势和劣势、产品发布、产品试验渠道、产品批准、专利、产品宽度和广度、应用优势、技术生命线曲线。以上提供的数据点仅与公司对欧洲食品应用 omega-3 市场的关注有关。
欧洲食品应用 omega-3 市场报告涵盖的主要参与者包括 Solutex、Algaecytes、DSM、BASF SE、Croda International Plc、AlaskOmega、Aker BioMarine、Sanmark LLC、ADM、Polaris、Pharma Marine AS、GC Rieber VivoMega AS 和 Biosearch life 等国内参与者。DBMR 分析师了解竞争优势,并为每个竞争对手分别提供竞争分析。
全球各地的公司也发起了许多产品开发,这也加速了 omega-3 在食品应用市场的增长。
例如,
- 2017 年 3 月,帝斯曼推出了 MEG-3 ultra,这是帝斯曼营养脂质产品组合中的一种 omega-3 脂肪酸。这是 EPA 和 DHA 的组合,其中含有高达 85% 的 omega-3,来自纯净野生海洋鱼油。这有助于该公司扩大其在市场上的产品组合。
合作、合资和其他战略提高了公司的市场份额,扩大了覆盖范围和存在感。通过扩大规模范围,它还有利于组织改善其用于食品应用的 omega-3 产品。
SKU-
Get online access to the report on the World's First Market Intelligence Cloud
- Interactive Data Analysis Dashboard
- Company Analysis Dashboard for high growth potential opportunities
- Research Analyst Access for customization & queries
- Competitor Analysis with Interactive dashboard
- Latest News, Updates & Trend analysis
- Harness the Power of Benchmark Analysis for Comprehensive Competitor Tracking
目录
- introduction
- OBJECTIVES OF THE STUDY
- MARKET DEFINITION
- OVERVIEW of Europe omega-3 for food application market
- LIMITATIONs
- MARKETS COVERED
- MARKET SEGMENTATION
- MARKETS COVERED
- geographical scope
- years considered for the study
- currency and pricing
- DBMR TRIPOD DATA VALIDATION MODEL
- MULTIVARIATE MODELLING
- Type LIFELINE CURVE
- primary interviews with key opinion leaders
- DBMR MARKET POSITION GRID
- vendor share analysis
- MARKET APPLICATIONS COVERAGE GRID
- secondary sourcEs
- assumptions
- EXECUTIVE SUMMARY
- premium insights
- production & CONSUMPTION
- EUROPE OMEGA-3 FOR FOOD APPLICATION MARKET: PRODUCT PRICING ANALYSIS
- EUROPE OMEGA-3 FOR FOOD APPLICATION MARKET: RAW MATERIAL PRICING ANALYSIS
- EUROPE OMEGA-3 FOR FOOD Application MARKET: REGULATORY FRAMEWORK
- LAW OF NUTRITIONAL & SUPPLEMENTAL FOOD PRODUCTS IN INDIA
- SUPPLY CHAIN OF EUROPE OMEGA-3 FOR FOOD APPLICATION MARKET
- RAW MATERIAL PRODUCTION & PROCUREMENT
- MARINE SOURCE
- PLANTS
- ALGAE
- MANUFACTURING, MARKETING AND DISTRIBUTION
- END USERS
- market overview
- drivers
- abundant availability of raw materials such as algae, fish oil and plant-based sources
- Health benefits associated with the omega-3 consumption
- Changing lifestyle of people around the globe
- advancements in food technology and high demand for fortified food products
- RESTRAINTS
- High chances of contamination of heavy metals from fish sources
- Lack of clarity among consumers about the daily recommended intake
- Highly Unstable Prices of raw materials
- opportunities
- Technological advancements in the production of omega-3 from different sources
- increasing Research AND development in the field of omega-3 sources
- challenges
- Complex purification process of omega-3 from raw materials
- stringent government regulations
- COVID-19 IMPACT ON EUROPE OMEGA-3 FOR FOOD APPLICATION MARKET IN FOOD & BEVERAGE INDUSTRY
- CONSUMERS WITH HIGH CHOLESTEROL AT HIGH RISK OF COVID-19
- INCREASED DEMAND FOR OMEGA-3 FOOD APPLICATION
- IMPACT OF COVID-19 IN OIL INDUSTRY
- DISRUPTION IN THE SUPPLY CHAIN
- OMEGA-3 MANUFACTURERS: PERSPECTIVE & INITIATIVES
- CONCLUSION
- Europe Omega-3 for Food Application Market, by type
- overview
- Eicosapentaenoic Acid (EPA) + Docosahexaenoic Acid (DHA)
- Docosahexaenoic Acid (DHA)
- Eicosapentaenoic Acid (EPA)
- Alpha-Linolenic Acid (ALA)
- Europe Omega-3 for Food Application Market, by Source
- overview
- MARINE Based
- Mackerel Oil
- Salmon oil
- Sardine oil
- Cod liver oil
- Tuna oil
- menhaden oil
- krill oil
- hoki oil
- Pollock oil
- Mussel oil
- Calanus oil
- Others
- Plant -based
- Flax seed
- walnut
- Soybean
- Canola
- pumpkin seeds
- chia seeds
- hemp seeds
- OTHERS
- Algae- based
- Macro algae
- Micro algae
- Europe Omega-3 for Food Application Market, by form
- overview
- oil
- powder
- Europe Omega-3 for Food Application Market, by Application
- overview
- Dietary Supplements
- Soft Gel
- Capsule
- Tablet
- Powder
- Gummies
- Others
- Eicosapentaenoic Acid (EPA) + Docosahexaenoic Acid (DHA)
- Docosahexaenoic Acid (DHA)
- Eicosapentaenoic Acid (EPA)
- Alpha-Linolenic Acid (ALA)
- Infant Formula
- Standard Formula
- Growing Up Formula
- Follow-On Formula
- Specialty Formula
- Docosahexaenoic Acid (DHA)
- Alpha-Linolenic Acid (ALA)
- Eicosapentaenoic Acid (EPA) + Docosahexaenoic Acid (DHA)
- Eicosapentaenoic Acid (EPA)
- Sports Nutrition
- Eicosapentaenoic Acid (EPA) + Docosahexaenoic Acid (DHA)
- Docosahexaenoic Acid (DHA)
- Eicosapentaenoic Acid (EPA)
- Alpha-Linolenic Acid (ALA)
- Functional Food
- Bakery Products
- Nutritional Bars
- PROTEIN BARS
- ENERGY BARS
- YOGA BARS
- PRE WORK OUT BARS
- OTHERS
- Dairy Products
- Snacks
- Eicosapentaenoic Acid (EPA) + Docosahexaenoic Acid (DHA)
- Docosahexaenoic Acid (DHA)
- Eicosapentaenoic Acid (EPA)
- Alpha-Linolenic Acid (ALA)
- Confectionery And Chocolate Products
- Eicosapentaenoic Acid (EPA) + Docosahexaenoic Acid (DHA)
- Docosahexaenoic Acid (DHA)
- Eicosapentaenoic Acid (EPA)
- Alpha-Linolenic Acid (ALA)
- Europe Omega-3 for Food Application Market, BY Function
- overview
- Bone and Joint Health
- Skin Health
- FOOD FORTIFICATION
- Hair Health
- Nails Health
- others
- Europe Omega-3 for Food Application Market, BY region
- Overview
- Europe
- Germany
- France
- U.K.
- Spain
- Italy
- Netherlands
- russia
- switzerland
- Poland
- belgium
- sweden
- Denmark
- turkey
- rest of europe
- Europe OMEGA-3 FOR FOOD APPLICATION Market: COMPANY landscape
- company share analysis: Europe
- SWOT
- Company profile
- DSM
- COMPANY SNAPSHOT
- REVENUE ANALYSIS
- company share analysis
- Product PORTFOLIO
- RECENT DEVELOPMENT
- adm
- COMPANY SNAPSHOT
- revenue analysis
- company share analysis
- product portfolio
- recent development
- Croda International Plc
- COMPANY SNAPSHOT
- RECENT FINANCIALS
- company share analysis
- PRODUCT PORTFOLIO
- RECENT DEVELOPMENT
- BASF SE
- COMPANY SNAPSHOT
- RECENT FINANCIALS
- company share analysis
- PRODUCT PORTFOLIO
- RECENT DEVELOPMENT
- AKER BIOMARINE
- COMPANY SNAPSHOT
- revenue analysis
- company share analysis
- product Portfolio
- RECENT DEVELOPMENT
- AlaskOmega
- COMPANY SNAPSHOT
- PRODUCT PORTFOLIO
- RECENT DEVELOPMENTS
- Algaecytes
- COMPANY SNAPSHOT
- PRODUCT PORTFOLIO
- RECENT DEVELOPMENT
- Biosearch life
- COMPANY SNAPSHOT
- PRODUCT PORTFOLIO
- RECENT DEVELOPMENTS
- GC Rieber VivoMega AS
- COMPANY SNAPSHOT
- product PORTFOLIO
- RECENT DEVELOPMENTS
- Pharma Marine AS
- COMPANY SNAPSHOT
- PRODUCT PORTFOLIO
- RECENT DEVELOPMENT
- Polaris
- COMPANY SNAPSHOT
- product Portfolio
- RECENT DEVELOPMENT
- Sanmark LLC
- COMPANY SNAPSHOT
- PRODUCT PORTFOLIO
- RECENT DEVELOPMENT
- Solutex
- COMPANY SNAPSHOT
- PRODUCT PORTFOLIO
- RECENT DEVELOPMENTS
- questionnaire
- related reports
表格列表
TABLE 1 OMEGA-3 CONTENT OF THE DIFFERENT FISHES
TABLE 2 AVAILABILITY OF OMEGA-3 IN THE DIFFERENT PLANT SOURCES
TABLE 3 As per the USDA, the adequate intake of omega-3 (ALA) is:
TABLE 4 Europe Omega-3 for Food Application Market, By Type, 2019-2028 (USD Thousands)
TABLE 5 Europe omega-3 for food application Market, By Source, 2019-2028 (USD Thousands)
TABLE 6 Europe Marine Based in Omega-3 for Food Application Market, By Source, 2019-2028 (USD Thousands)
TABLE 7 Fatty acid composition (%) of plant oils
TABLE 8 Europe Plant-Based in Omega-3 for Food Application Market, By Source, 2019-2028 (USD Thousands)
TABLE 9 Algae based segment is further divided into further sub segments and they are macroalgae and microalgae.
TABLE 10 Europe omega-3 for food application Market, By form, 2019-2028 (USD Thousands)
TABLE 11 Europe omega-3 for food application Market, By APPLICATION, 2019-2028 (USD Thousands)
TABLE 12 Europe Dietary Supplements in Omega-3 for Food Application Market, By Product Type, 2019-2028 (USD Thousands)
TABLE 13 Europe Dietary Supplements in Omega-3 for Food Application Market, By Product Type, 2019-2028 (USD Thousands)
TABLE 14 Europe Infant Formula in omega-3 for food application Market, By product type, 2019-2028 (USD Thousands)
TABLE 15 Europe Infant Formula in omega-3 for food application Market, By type, 2019-2028 (USD Thousands)
TABLE 16 Europe Sports Nutrition in omega-3 for food application Market, By type, 2019-2028 (USD Thousands)
TABLE 17 Europe Functional Food in omega-3 for food application Market, By type, 2019-2028 (USD Thousands)
TABLE 18 Europe Functional Food in omega-3 for food application Market, By type, 2019-2028 (USD Thousands)
TABLE 19 Europe Functional Food in omega-3 for food application Market, By type, 2019-2028 (USD Thousands)
TABLE 20 Europe Confectionery And Chocolate Products in omega-3 for food application Market, By type, 2019-2028 (USD Thousands)
TABLE 21 Europe Omega-3 for Food Application Market, By Function, 2019-2028 (USD Thousands)
TABLE 22 Europe Omega-3 for food application Market, By Country, 2019-2028 (USD Thousands)
TABLE 23 Europe Omega-3 for Food Application Market, By Type, 2019-2028 (USD Thousands)
TABLE 24 Europe Omega-3 for Food Application Market, By Source, 2019-2028 (USD Thousands)
TABLE 25 Europe Marine Based in Omega-3 for Food Application Market, By Source, 2019-2028 (USD Thousands)
TABLE 26 Europe Algae -Based in Omega-3 for Food Application Market, By Source, 2019-2028 (USD Thousands)
TABLE 27 Europe Plant-Based in Omega-3 for Food Application Market, By Source, 2019-2028 (USD Thousands)
TABLE 28 Europe Omega-3 for Food Application Market, By Form, 2019-2028 (USD Thousands)
TABLE 29 Europe Omega-3 for Food Application Market, By Application, 2019-2028 (USD Thousands)
TABLE 30 Europe Functional Food in Omega-3 for Food Application Market, By Product Type, 2019-2028 (USD Thousands)
TABLE 31 Europe Nutritional Bars in Omega-3 for Food Application Market, By Product Type, 2019-2028 (USD Thousands)
TABLE 32 Europe Functional Food in Omega-3 for Food Application Market, By Type, 2019-2028 (USD Thousands)
TABLE 33 Europe Confectionery And Chocolate Products in Omega-3 for Food Application Market, By Type, 2019-2028 (USD Thousands)
TABLE 34 Europe Sports Nutrition in Omega-3 for Food Application Market, By Type, 2019-2028 (USD Thousands)
TABLE 35 Europe Dietary Supplements in Omega-3 for Food Application Market, By Product Type, 2019-2028 (USD Thousands)
TABLE 36 Europe Dietary Supplements in Omega-3 for Food Application Market, By Type, 2019-2028 (USD Thousands)
TABLE 37 Europe Infant Formula in Omega-3 for Food Application Market, By Product Type, 2019-2028 (USD Thousands)
TABLE 38 Europe Infant Formula in Omega-3 for Food Application Market, By Type, 2019-2028 (USD Thousands)
TABLE 39 Europe Omega-3 for Food Application Market, By Function, 2019-2028 (USD Thousands)
TABLE 40 Germany Omega-3 for Food Application Market, By Type, 2019-2028 (USD Thousands)
TABLE 41 Germany Omega-3 for Food Application Market, By Source, 2019-2028 (USD Thousands)
TABLE 42 Germany Marine Based in Omega-3 for Food Application Market, By Source, 2019-2028 (USD Thousands)
TABLE 43 Germany Algae -Based in Omega-3 for Food Application Market, By Source, 2019-2028 (USD Thousands)
TABLE 44 Germany Plant-Based in Omega-3 for Food Application Market, By Source, 2019-2028 (USD Thousands)
TABLE 45 Germany Omega-3 for Food Application Market, By Form, 2019-2028 (USD Thousands)
TABLE 46 Germany Omega-3 for Food Application Market, By Application, 2019-2028 (USD Thousands)
TABLE 47 Germany Functional Food in Omega-3 for Food Application Market, By Product Type, 2019-2028 (USD Thousands)
TABLE 48 Germany Nutritional Bars in Omega-3 for Food Application Market, By Product Type, 2019-2028 (USD Thousands)
TABLE 49 Germany Functional Food in Omega-3 for Food Application Market, By Type, 2019-2028 (USD Thousands)
TABLE 50 Germany Confectionery And Chocolate Products in Omega-3 for Food Application Market, By Type, 2019-2028 (USD Thousands)
TABLE 51 Germany Sports Nutrition in Omega-3 for Food Application Market, By Type, 2019-2028 (USD Thousands)
TABLE 52 Germany Dietary Supplements in Omega-3 for Food Application Market, By Product Type, 2019-2028 (USD Thousands)
TABLE 53 Germany Dietary Supplements in Omega-3 for Food Application Market, By Type, 2019-2028 (USD Thousands)
TABLE 54 Germany Infant Formula in Omega-3 for Food Application Market, By Product Type, 2019-2028 (USD Thousands)
TABLE 55 Germany Infant Formula in Omega-3 for Food Application Market, By Type, 2019-2028 (USD Thousands)
TABLE 56 Germany Omega-3 for Food Application Market, By Function, 2019-2028 (USD Thousands)
TABLE 57 France Omega-3 for Food Application Market, By Type, 2019-2028 (USD Thousands)
TABLE 58 France Omega-3 for Food Application Market, By Source, 2019-2028 (USD Thousands)
TABLE 59 France Marine Based in Omega-3 for Food Application Market, By Source, 2019-2028 (USD Thousands)
TABLE 60 France Algae -Based in Omega-3 for Food Application Market, By Source, 2019-2028 (USD Thousands)
TABLE 61 France Plant-Based in Omega-3 for Food Application Market, By Source, 2019-2028 (USD Thousands)
TABLE 62 France Omega-3 for Food Application Market, By Form, 2019-2028 (USD Thousands)
TABLE 63 France Omega-3 for Food Application Market, By Application, 2019-2028 (USD Thousands)
TABLE 64 France Functional Food in Omega-3 for Food Application Market, By Product Type, 2019-2028 (USD Thousands)
TABLE 65 France Nutritional Bars in Omega-3 for Food Application Market, By Product Type, 2019-2028 (USD Thousands)
TABLE 66 France Functional Food in Omega-3 for Food Application Market, By Type, 2019-2028 (USD Thousands)
TABLE 67 France Confectionery And Chocolate Products in Omega-3 for Food Application Market, By Type, 2019-2028 (USD Thousands)
TABLE 68 France Sports Nutrition in Omega-3 for Food Application Market, By Type, 2019-2028 (USD Thousands)
TABLE 69 France Dietary Supplements in Omega-3 for Food Application Market, By Product Type, 2019-2028 (USD Thousands)
TABLE 70 France Dietary Supplements in Omega-3 for Food Application Market, By Type, 2019-2028 (USD Thousands)
TABLE 71 France Infant Formula in Omega-3 for Food Application Market, By Product Type, 2019-2028 (USD Thousands)
TABLE 72 France Infant Formula in Omega-3 for Food Application Market, By Type, 2019-2028 (USD Thousands)
TABLE 73 France Omega-3 for Food Application Market, By Function, 2019-2028 (USD Thousands)
TABLE 74 U.K. Omega-3 for Food Application Market, By Type, 2019-2028 (USD Thousands)
TABLE 75 U.K. Omega-3 for Food Application Market, By Source, 2019-2028 (USD Thousands)
TABLE 76 U.K. Marine Based in Omega-3 for Food Application Market, By Source, 2019-2028 (USD Thousands)
TABLE 77 U.K. Algae -Based in Omega-3 for Food Application Market, By Source, 2019-2028 (USD Thousands)
TABLE 78 U.K. Plant-Based in Omega-3 for Food Application Market, By Source, 2019-2028 (USD Thousands)
TABLE 79 U.K. Omega-3 for Food Application Market, By Form, 2019-2028 (USD Thousands)
TABLE 80 U.K. Omega-3 for Food Application Market, By Application, 2019-2028 (USD Thousands)
TABLE 81 U.K. Functional Food in Omega-3 for Food Application Market, By Product Type, 2019-2028 (USD Thousands)
TABLE 82 U.K. Nutritional Bars in Omega-3 for Food Application Market, By Product Type, 2019-2028 (USD Thousands)
TABLE 83 U.K. Functional Food in Omega-3 for Food Application Market, By Type, 2019-2028 (USD Thousands)
TABLE 84 U.K. Confectionery And Chocolate Products in Omega-3 for Food Application Market, By Type, 2019-2028 (USD Thousands)
TABLE 85 U.K. Sports Nutrition in Omega-3 for Food Application Market, By Type, 2019-2028 (USD Thousands)
TABLE 86 U.K. Dietary Supplements in Omega-3 for Food Application Market, By Product Type, 2019-2028 (USD Thousands)
TABLE 87 U.K. Dietary Supplements in Omega-3 for Food Application Market, By Type, 2019-2028 (USD Thousands)
TABLE 88 U.K. Infant Formula in Omega-3 for Food Application Market, By Product Type, 2019-2028 (USD Thousands)
TABLE 89 U.K. Infant Formula in Omega-3 for Food Application Market, By Type, 2019-2028 (USD Thousands)
TABLE 90 U.K. Omega-3 for Food Application Market, By Function, 2019-2028 (USD Thousands)
TABLE 91 spain Omega-3 for Food Application Market, By Type, 2019-2028 (USD Thousands)
TABLE 92 Spain Omega-3 for Food Application Market, By Source, 2019-2028 (USD Thousands)
TABLE 93 Spain Marine Based in Omega-3 for Food Application Market, By Source, 2019-2028 (USD Thousands)
TABLE 94 Spain Algae -Based in Omega-3 for Food Application Market, By Source, 2019-2028 (USD Thousands)
TABLE 95 Spain Plant-Based in Omega-3 for Food Application Market, By Source, 2019-2028 (USD Thousands)
TABLE 96 Spain Omega-3 for Food Application Market, By Form, 2019-2028 (USD Thousands)
TABLE 97 Spain Omega-3 for Food Application Market, By Application, 2019-2028 (USD Thousands)
TABLE 98 Spain Functional Food in Omega-3 for Food Application Market, By Product Type, 2019-2028 (USD Thousands)
TABLE 99 Spain Nutritional Bars in Omega-3 for Food Application Market, By Product Type, 2019-2028 (USD Thousands)
TABLE 100 Spain Functional Food in Omega-3 for Food Application Market, By Type, 2019-2028 (USD Thousands)
TABLE 101 Spain Confectionery And Chocolate Products in Omega-3 for Food Application Market, By Type, 2019-2028 (USD Thousands)
TABLE 102 Spain Sports Nutrition in Omega-3 for Food Application Market, By Type, 2019-2028 (USD Thousands)
TABLE 103 Spain Dietary Supplements in Omega-3 for Food Application Market, By Product Type, 2019-2028 (USD Thousands)
TABLE 104 Spain Dietary Supplements in Omega-3 for Food Application Market, By Type, 2019-2028 (USD Thousands)
TABLE 105 Spain Infant Formula in Omega-3 for Food Application Market, By Product Type, 2019-2028 (USD Thousands)
TABLE 106 Spain Infant Formula in Omega-3 for Food Application Market, By Type, 2019-2028 (USD Thousands)
TABLE 107 Spain Omega-3 for Food Application Market, By Function, 2019-2028 (USD Thousands)
TABLE 108 Italy Omega-3 for Food Application Market, By Type, 2019-2028 (USD Thousands)
TABLE 109 Italy Omega-3 for Food Application Market, By Source, 2019-2028 (USD Thousands)
TABLE 110 Italy Marine Based in Omega-3 for Food Application Market, By Source, 2019-2028 (USD Thousands)
TABLE 111 Italy Algae -Based in Omega-3 for Food Application Market, By Source, 2019-2028 (USD Thousands)
TABLE 112 Italy Plant-Based in Omega-3 for Food Application Market, By Source, 2019-2028 (USD Thousands)
TABLE 113 Italy Omega-3 for Food Application Market, By Form, 2019-2028 (USD Thousands)
TABLE 114 Italy Omega-3 for Food Application Market, By Application, 2019-2028 (USD Thousands)
TABLE 115 Italy Functional Food in Omega-3 for Food Application Market, By Product Type, 2019-2028 (USD Thousands)
TABLE 116 Italy Nutritional Bars in Omega-3 for Food Application Market, By Product Type, 2019-2028 (USD Thousands)
TABLE 117 Italy Functional Food in Omega-3 for Food Application Market, By Type, 2019-2028 (USD Thousands)
TABLE 118 Italy Confectionery And Chocolate Products in Omega-3 for Food Application Market, By Type, 2019-2028 (USD Thousands)
TABLE 119 Italy Sports Nutrition in Omega-3 for Food Application Market, By Type, 2019-2028 (USD Thousands)
TABLE 120 Italy Dietary Supplements in Omega-3 for Food Application Market, By Product Type, 2019-2028 (USD Thousands)
TABLE 121 Italy Dietary Supplements in Omega-3 for Food Application Market, By Type, 2019-2028 (USD Thousands)
TABLE 122 Italy Infant Formula in Omega-3 for Food Application Market, By Product Type, 2019-2028 (USD Thousands)
TABLE 123 Italy Infant Formula in Omega-3 for Food Application Market, By Type, 2019-2028 (USD Thousands)
TABLE 124 Italy Omega-3 for Food Application Market, By Function, 2019-2028 (USD Thousands)
TABLE 125 Netherlands Omega-3 for Food Application Market, By Type, 2019-2028 (USD Thousands)
TABLE 126 Netherlands Omega-3 for Food Application Market, By Source, 2019-2028 (USD Thousands)
TABLE 127 Netherlands Marine Based in Omega-3 for Food Application Market, By Source, 2019-2028 (USD Thousands)
TABLE 128 Netherlands Algae -Based in Omega-3 for Food Application Market, By Source, 2019-2028 (USD Thousands)
TABLE 129 Netherlands Plant-Based in Omega-3 for Food Application Market, By Source, 2019-2028 (USD Thousands)
TABLE 130 Netherlands Omega-3 for Food Application Market, By Form, 2019-2028 (USD Thousands)
TABLE 131 Netherlands Omega-3 for Food Application Market, By Application, 2019-2028 (USD Thousands)
TABLE 132 Netherlands Functional Food in Omega-3 for Food Application Market, By Product Type, 2019-2028 (USD Thousands)
TABLE 133 Netherlands Nutritional Bars in Omega-3 for Food Application Market, By Product Type, 2019-2028 (USD Thousands)
TABLE 134 Netherlands Functional Food in Omega-3 for Food Application Market, By Type, 2019-2028 (USD Thousands)
TABLE 135 Netherlands Confectionery And Chocolate Products in Omega-3 for Food Application Market, By Type, 2019-2028 (USD Thousands)
TABLE 136 Netherlands Sports Nutrition in Omega-3 for Food Application Market, By Type, 2019-2028 (USD Thousands)
TABLE 137 Netherlands Dietary Supplements in Omega-3 for Food Application Market, By Product Type, 2019-2028 (USD Thousands)
TABLE 138 Netherlands Dietary Supplements in Omega-3 for Food Application Market, By Type, 2019-2028 (USD Thousands)
TABLE 139 Netherlands Infant Formula in Omega-3 for Food Application Market, By Product Type, 2019-2028 (USD Thousands)
TABLE 140 Netherlands Infant Formula in Omega-3 for Food Application Market, By Type, 2019-2028 (USD Thousands)
TABLE 141 Netherlands Omega-3 for Food Application Market, By Function, 2019-2028 (USD Thousands)
TABLE 142 Russia Omega-3 for Food Application Market, By Type, 2019-2028 (USD Thousands)
TABLE 143 Russia Omega-3 for Food Application Market, By Source, 2019-2028 (USD Thousands)
TABLE 144 Russia Marine Based in Omega-3 for Food Application Market, By Source, 2019-2028 (USD Thousands)
TABLE 145 Russia Algae -Based in Omega-3 for Food Application Market, By Source, 2019-2028 (USD Thousands)
TABLE 146 Russia Plant-Based in Omega-3 for Food Application Market, By Source, 2019-2028 (USD Thousands)
TABLE 147 Russia Omega-3 for Food Application Market, By Form, 2019-2028 (USD Thousands)
TABLE 148 Russia Omega-3 for Food Application Market, By Application, 2019-2028 (USD Thousands)
TABLE 149 Russia Functional Food in Omega-3 for Food Application Market, By Product Type, 2019-2028 (USD Thousands)
TABLE 150 Russia Nutritional Bars in Omega-3 for Food Application Market, By Product Type, 2019-2028 (USD Thousands)
TABLE 151 Russia Functional Food in Omega-3 for Food Application Market, By Type, 2019-2028 (USD Thousands)
TABLE 152 Russia Confectionery And Chocolate Products in Omega-3 for Food Application Market, By Type, 2019-2028 (USD Thousands)
TABLE 153 Russia Sports Nutrition in Omega-3 for Food Application Market, By Type, 2019-2028 (USD Thousands)
TABLE 154 Russia Dietary Supplements in Omega-3 for Food Application Market, By Product Type, 2019-2028 (USD Thousands)
TABLE 155 Russia Dietary Supplements in Omega-3 for Food Application Market, By Type, 2019-2028 (USD Thousands)
TABLE 156 Russia Infant Formula in Omega-3 for Food Application Market, By Product Type, 2019-2028 (USD Thousands)
TABLE 157 Russia Infant Formula in Omega-3 for Food Application Market, By Type, 2019-2028 (USD Thousands)
TABLE 158 Russia Omega-3 for Food Application Market, By Function, 2019-2028 (USD Thousands)
TABLE 159 Switzerland Omega-3 for Food Application Market, By Type, 2019-2028 (USD Thousands)
TABLE 160 Switzerland Omega-3 for Food Application Market, By Source, 2019-2028 (USD Thousands)
TABLE 161 Switzerland Marine Based in Omega-3 for Food Application Market, By Source, 2019-2028 (USD Thousands)
TABLE 162 Switzerland Algae -Based in Omega-3 for Food Application Market, By Source, 2019-2028 (USD Thousands)
TABLE 163 Switzerland Plant-Based in Omega-3 for Food Application Market, By Source, 2019-2028 (USD Thousands)
TABLE 164 Switzerland Omega-3 for Food Application Market, By Form, 2019-2028 (USD Thousands)
TABLE 165 Switzerland Omega-3 for Food Application Market, By Application, 2019-2028 (USD Thousands)
TABLE 166 Switzerland Functional Food in Omega-3 for Food Application Market, By Product Type, 2019-2028 (USD Thousands)
TABLE 167 Switzerland Nutritional Bars in Omega-3 for Food Application Market, By Product Type, 2019-2028 (USD Thousands)
TABLE 168 Switzerland Functional Food in Omega-3 for Food Application Market, By Type, 2019-2028 (USD Thousands)
TABLE 169 Switzerland Confectionery And Chocolate Products in Omega-3 for Food Application Market, By Type, 2019-2028 (USD Thousands)
TABLE 170 Switzerland Sports Nutrition in Omega-3 for Food Application Market, By Type, 2019-2028 (USD Thousands)
TABLE 171 Switzerland Dietary Supplements in Omega-3 for Food Application Market, By Product Type, 2019-2028 (USD Thousands)
TABLE 172 Switzerland Dietary Supplements in Omega-3 for Food Application Market, By Type, 2019-2028 (USD Thousands)
TABLE 173 Switzerland Infant Formula in Omega-3 for Food Application Market, By Product Type, 2019-2028 (USD Thousands)
TABLE 174 Switzerland Infant Formula in Omega-3 for Food Application Market, By Type, 2019-2028 (USD Thousands)
TABLE 175 Switzerland Omega-3 for Food Application Market, By Function, 2019-2028 (USD Thousands)
TABLE 176 poland Omega-3 for Food Application Market, By Type, 2019-2028 (USD Thousands)
TABLE 177 poland Omega-3 for Food Application Market, By Source, 2019-2028 (USD Thousands)
TABLE 178 poland Marine Based in Omega-3 for Food Application Market, By Source, 2019-2028 (USD Thousands)
TABLE 179 poland Algae -Based in Omega-3 for Food Application Market, By Source, 2019-2028 (USD Thousands)
TABLE 180 poland Plant-Based in Omega-3 for Food Application Market, By Source, 2019-2028 (USD Thousands)
TABLE 181 poland Omega-3 for Food Application Market, By Form, 2019-2028 (USD Thousands)
TABLE 182 poland Omega-3 for Food Application Market, By Application, 2019-2028 (USD Thousands)
TABLE 183 poland Functional Food in Omega-3 for Food Application Market, By Product Type, 2019-2028 (USD Thousands)
TABLE 184 poland Nutritional Bars in Omega-3 for Food Application Market, By Product Type, 2019-2028 (USD Thousands)
TABLE 185 poland Functional Food in Omega-3 for Food Application Market, By Type, 2019-2028 (USD Thousands)
TABLE 186 poland Confectionery And Chocolate Products in Omega-3 for Food Application Market, By Type, 2019-2028 (USD Thousands)
TABLE 187 poland Sports Nutrition in Omega-3 for Food Application Market, By Type, 2019-2028 (USD Thousands)
TABLE 188 poland Dietary Supplements in Omega-3 for Food Application Market, By Product Type, 2019-2028 (USD Thousands)
TABLE 189 poland Dietary Supplements in Omega-3 for Food Application Market, By Type, 2019-2028 (USD Thousands)
TABLE 190 poland Infant Formula in Omega-3 for Food Application Market, By Product Type, 2019-2028 (USD Thousands)
TABLE 191 poland Infant Formula in Omega-3 for Food Application Market, By Type, 2019-2028 (USD Thousands)
TABLE 192 poland Omega-3 for Food Application Market, By Function, 2019-2028 (USD Thousands)
TABLE 193 Belgium Omega-3 for Food Application Market, By Type, 2019-2028 (USD Thousands)
TABLE 194 Belgium Omega-3 for Food Application Market, By Source, 2019-2028 (USD Thousands)
TABLE 195 Belgium Marine Based in Omega-3 for Food Application Market, By Source, 2019-2028 (USD Thousands)
TABLE 196 Belgium Algae -Based in Omega-3 for Food Application Market, By Source, 2019-2028 (USD Thousands)
TABLE 197 Belgium Plant-Based in Omega-3 for Food Application Market, By Source, 2019-2028 (USD Thousands)
TABLE 198 Belgium Omega-3 for Food Application Market, By Form, 2019-2028 (USD Thousands)
TABLE 199 Belgium Omega-3 for Food Application Market, By Application, 2019-2028 (USD Thousands)
TABLE 200 Belgium Functional Food in Omega-3 for Food Application Market, By Product Type, 2019-2028 (USD Thousands)
TABLE 201 Belgium Nutritional Bars in Omega-3 for Food Application Market, By Product Type, 2019-2028 (USD Thousands)
TABLE 202 Belgium Functional Food in Omega-3 for Food Application Market, By Type, 2019-2028 (USD Thousands)
TABLE 203 Belgium Confectionery And Chocolate Products in Omega-3 for Food Application Market, By Type, 2019-2028 (USD Thousands)
TABLE 204 Belgium Sports Nutrition in Omega-3 for Food Application Market, By Type, 2019-2028 (USD Thousands)
TABLE 205 Belgium Dietary Supplements in Omega-3 for Food Application Market, By Product Type, 2019-2028 (USD Thousands)
TABLE 206 Belgium Dietary Supplements in Omega-3 for Food Application Market, By Type, 2019-2028 (USD Thousands)
TABLE 207 Belgium Infant Formula in Omega-3 for Food Application Market, By Product Type, 2019-2028 (USD Thousands)
TABLE 208 Belgium Infant Formula in Omega-3 for Food Application Market, By Type, 2019-2028 (USD Thousands)
TABLE 209 Belgium Omega-3 for Food Application Market, By Function, 2019-2028 (USD Thousands)
TABLE 210 sweden Omega-3 for Food Application Market, By Type, 2019-2028 (USD Thousands)
TABLE 211 sweden Omega-3 for Food Application Market, By Source, 2019-2028 (USD Thousands)
TABLE 212 sweden Marine Based in Omega-3 for Food Application Market, By Source, 2019-2028 (USD Thousands)
TABLE 213 sweden Algae -Based in Omega-3 for Food Application Market, By Source, 2019-2028 (USD Thousands)
TABLE 214 sweden Plant-Based in Omega-3 for Food Application Market, By Source, 2019-2028 (USD Thousands)
TABLE 215 sweden Omega-3 for Food Application Market, By Form, 2019-2028 (USD Thousands)
TABLE 216 sweden Omega-3 for Food Application Market, By Application, 2019-2028 (USD Thousands)
TABLE 217 sweden Functional Food in Omega-3 for Food Application Market, By Product Type, 2019-2028 (USD Thousands)
TABLE 218 sweden Nutritional Bars in Omega-3 for Food Application Market, By Product Type, 2019-2028 (USD Thousands)
TABLE 219 sweden Functional Food in Omega-3 for Food Application Market, By Type, 2019-2028 (USD Thousands)
TABLE 220 sweden Confectionery And Chocolate Products in Omega-3 for Food Application Market, By Type, 2019-2028 (USD Thousands)
TABLE 221 sweden Sports Nutrition in Omega-3 for Food Application Market, By Type, 2019-2028 (USD Thousands)
TABLE 222 sweden Dietary Supplements in Omega-3 for Food Application Market, By Product Type, 2019-2028 (USD Thousands)
TABLE 223 sweden Dietary Supplements in Omega-3 for Food Application Market, By Type, 2019-2028 (USD Thousands)
TABLE 224 sweden Infant Formula in Omega-3 for Food Application Market, By Product Type, 2019-2028 (USD Thousands)
TABLE 225 sweden Infant Formula in Omega-3 for Food Application Market, By Type, 2019-2028 (USD Thousands)
TABLE 226 sweden Omega-3 for Food Application Market, By Function, 2019-2028 (USD Thousands)
TABLE 227 denmark Omega-3 for Food Application Market, By Type, 2019-2028 (USD Thousands)
TABLE 228 denmark Omega-3 for Food Application Market, By Source, 2019-2028 (USD Thousands)
TABLE 229 denmark Marine Based in Omega-3 for Food Application Market, By Source, 2019-2028 (USD Thousands)
TABLE 230 denmark Algae -Based in Omega-3 for Food Application Market, By Source, 2019-2028 (USD Thousands)
TABLE 231 denmark Plant-Based in Omega-3 for Food Application Market, By Source, 2019-2028 (USD Thousands)
TABLE 232 denmark Omega-3 for Food Application Market, By Form, 2019-2028 (USD Thousands)
TABLE 233 denmark Omega-3 for Food Application Market, By Application, 2019-2028 (USD Thousands)
TABLE 234 denmark Functional Food in Omega-3 for Food Application Market, By Product Type, 2019-2028 (USD Thousands)
TABLE 235 denmark Nutritional Bars in Omega-3 for Food Application Market, By Product Type, 2019-2028 (USD Thousands)
TABLE 236 denmark Functional Food in Omega-3 for Food Application Market, By Type, 2019-2028 (USD Thousands)
TABLE 237 denmark Confectionery And Chocolate Products in Omega-3 for Food Application Market, By Type, 2019-2028 (USD Thousands)
TABLE 238 denmark Sports Nutrition in Omega-3 for Food Application Market, By Type, 2019-2028 (USD Thousands)
TABLE 239 denmark Dietary Supplements in Omega-3 for Food Application Market, By Product Type, 2019-2028 (USD Thousands)
TABLE 240 denmark Dietary Supplements in Omega-3 for Food Application Market, By Type, 2019-2028 (USD Thousands)
TABLE 241 denmark Infant Formula in Omega-3 for Food Application Market, By Product Type, 2019-2028 (USD Thousands)
TABLE 242 denmark Infant Formula in Omega-3 for Food Application Market, By Type, 2019-2028 (USD Thousands)
TABLE 243 denmark Omega-3 for Food Application Market, By Function, 2019-2028 (USD Thousands)
TABLE 244 turkey Omega-3 for Food Application Market, By Type, 2019-2028 (USD Thousands)
TABLE 245 turkey Omega-3 for Food Application Market, By Source, 2019-2028 (USD Thousands)
TABLE 246 turkey Marine Based in Omega-3 for Food Application Market, By Source, 2019-2028 (USD Thousands)
TABLE 247 turkey Algae -Based in Omega-3 for Food Application Market, By Source, 2019-2028 (USD Thousands)
TABLE 248 turkey Plant-Based in Omega-3 for Food Application Market, By Source, 2019-2028 (USD Thousands)
TABLE 249 turkey Omega-3 for Food Application Market, By Form, 2019-2028 (USD Thousands)
TABLE 250 turkey Omega-3 for Food Application Market, By Application, 2019-2028 (USD Thousands)
TABLE 251 turkey Functional Food in Omega-3 for Food Application Market, By Product Type, 2019-2028 (USD Thousands)
TABLE 252 turkey Nutritional Bars in Omega-3 for Food Application Market, By Product Type, 2019-2028 (USD Thousands)
TABLE 253 turkey Functional Food in Omega-3 for Food Application Market, By Type, 2019-2028 (USD Thousands)
TABLE 254 turkey Confectionery And Chocolate Products in Omega-3 for Food Application Market, By Type, 2019-2028 (USD Thousands)
TABLE 255 turkey Sports Nutrition in Omega-3 for Food Application Market, By Type, 2019-2028 (USD Thousands)
TABLE 256 turkey Dietary Supplements in Omega-3 for Food Application Market, By Product Type, 2019-2028 (USD Thousands)
TABLE 257 turkey Dietary Supplements in Omega-3 for Food Application Market, By Type, 2019-2028 (USD Thousands)
TABLE 258 turkey Infant Formula in Omega-3 for Food Application Market, By Product Type, 2019-2028 (USD Thousands)
TABLE 259 turkey Infant Formula in Omega-3 for Food Application Market, By Type, 2019-2028 (USD Thousands)
TABLE 260 turkey Omega-3 for Food Application Market, By Function, 2019-2028 (USD Thousands)
TABLE 261 Rest of europe Omega-3 for Food Application Market, By Type, 2019-2028 (USD Thousands)
图片列表
FIGURE 1 Europe omega-3 for food application MARKET: segmentation
FIGURE 2 EUROPE OMEGA-3 FOR FOOD APPLICATION MARKET : data triangulation
FIGURE 3 Europe omega-3 for food application MARKET: DROC ANALYSIS
FIGURE 4 Europe omega-3 for food application MARKET: EUROPE VS REGIONAL MARKET ANALYSIS
FIGURE 5 EUROPE OMEGA-3 FOR FOOD APPLICATION MARKET: COMPANY RESEARCH ANALYSIS
FIGURE 6 EUROPE OMEGA-3 FOR FOOD APPLICATION MARKET: INTERVIEW DEMOGRAPHICS
FIGURE 7 Europe omega-3 for food application MARKET: DBMR MARKET POSITION GRID
FIGURE 8 EUROPE OMEGA-3 FOR FOOD APPLICATION MARKET: vendor share analysis
FIGURE 9 Europe omega-3 for food application market: MARKET APPLICATIONS COVERAGE GRID
FIGURE 10 Europe omega-3 for food application MARKET: SEGMENTATION
FIGURE 11 Abundant availability of raw material and Health benefits associated with the omega-3 consumption are leading the growth of the Europe omega-3 for food application market IN THE FORECAST PERIOD of 2021 To 2028
FIGURE 12 EICOSAPENTAENOIC ACID (EPA)+ DOCOSAHEXAENOIC ACID (DHA) SEGMENT IS EXPECTED TO ACCOUNT FOR THE LARGEST SHARE OF EUROPE OMEGA-3 FOR FOOD APPLICATION MARKETIN 2021 & 2028
FIGURE 13 Fish Oil Production in Thousand Tonnes (2017-2020)
FIGURE 14 Europe Seaweed Production in Million Tonnes (2011-2015)
FIGURE 15 CONSUMPTION OF FISH OIL IN THOUSAND TONNES (2016-2020)
FIGURE 16 Supply chain of Europe omega-3 for food APPLICATION market
FIGURE 17 DRIVERS, RESTRAINTS, OPPORTUNITIES AND CHALLENGES OF EUROPE omega-3 for food application market
FIGURE 18 World prices of fish oil from 2017-2026 in USD / Tonnes
FIGURE 19 PREVALENCE OF HYPERTENSION AMONG ADULTS AGED 18 AND OVER, BY SEX AND AGE IN THE U.S. (2017–2018)
FIGURE 20 Europe Omega-3 for Food Application Market, By Type
FIGURE 21 Europe omega-3 for food application, By form, 2019-2028 (USD Thousands)
FIGURE 22 Europe omega-3 for food application, By form
FIGURE 23 Europe omega-3 for food application, By APPLICATION, 2019-2028 (USD Thousands)
FIGURE 24 Europe Omega-3 for Food Application Market, BY Function
FIGURE 25 Europe Omega-3 for food application market: SNAPSHOT (2020)
FIGURE 26 Europe Omega-3 for food application market: BY COUNTRY (2020)
FIGURE 27 Europe Omega-3 for food application market: BY COUNTRY (2021 & 2028)
FIGURE 28 Europe Omega-3 for food application market: BY COUNTRY (2020 & 2028)
FIGURE 29 Europe Omega-3 for food application market: BY TYPE (2021-2028)
FIGURE 30 Europe omega-3 for food application market: company share 2020 (%)
研究方法
Data collection and base year analysis are done using data collection modules with large sample sizes. The stage includes obtaining market information or related data through various sources and strategies. It includes examining and planning all the data acquired from the past in advance. It likewise envelops the examination of information inconsistencies seen across different information sources. The market data is analysed and estimated using market statistical and coherent models. Also, market share analysis and key trend analysis are the major success factors in the market report. To know more, please request an analyst call or drop down your inquiry.
The key research methodology used by DBMR research team is data triangulation which involves data mining, analysis of the impact of data variables on the market and primary (industry expert) validation. Data models include Vendor Positioning Grid, Market Time Line Analysis, Market Overview and Guide, Company Positioning Grid, Patent Analysis, Pricing Analysis, Company Market Share Analysis, Standards of Measurement, Global versus Regional and Vendor Share Analysis. To know more about the research methodology, drop in an inquiry to speak to our industry experts.
可定制
Data Bridge Market Research is a leader in advanced formative research. We take pride in servicing our existing and new customers with data and analysis that match and suits their goal. The report can be customized to include price trend analysis of target brands understanding the market for additional countries (ask for the list of countries), clinical trial results data, literature review, refurbished market and product base analysis. Market analysis of target competitors can be analyzed from technology-based analysis to market portfolio strategies. We can add as many competitors that you require data about in the format and data style you are looking for. Our team of analysts can also provide you data in crude raw excel files pivot tables (Fact book) or can assist you in creating presentations from the data sets available in the report.