
Europe Computed Tomography Devices Market
市场规模(十亿美元)
CAGR :
% 
 USD
2.37 Billion
USD
9.29 Billion
2023
2031
USD
2.37 Billion
USD
9.29 Billion
2023
2031
| 2024 –2031 | |
| USD 2.37 Billion | |
| USD 9.29 Billion | |
| % | |
|
Europe Computed Tomography Devices Market Segmentation, By Architecture (O-Arm CT Scanner, and C-Arm CT Scanner), Technology (High-Slice CT, Mid-Slice CT, Low-Slice, and Cone Beam CT), Type (Digital and Conventional), Slice (Multi Slice CT Devices and Single Slice CT Devices), Modality (Stationary System, Portable/Mobile System, and Point-of-Care System), Application (Human Application, Research Application, Veterinary Application, Oncology, Neurology, Cardiovascular, Musculoskeletal, and Others), End User (Hospitals, Diagnostic Centres,Ambulatory Surgical Centres, Academic and Research Institutes, Specialty Clinics, Veterinary Clinics and Hospital, Cardiac Centres, and Others), Distribution Channel (Direct Tender and Third Party Distribution) - Industry Trends and Forecast to 2032
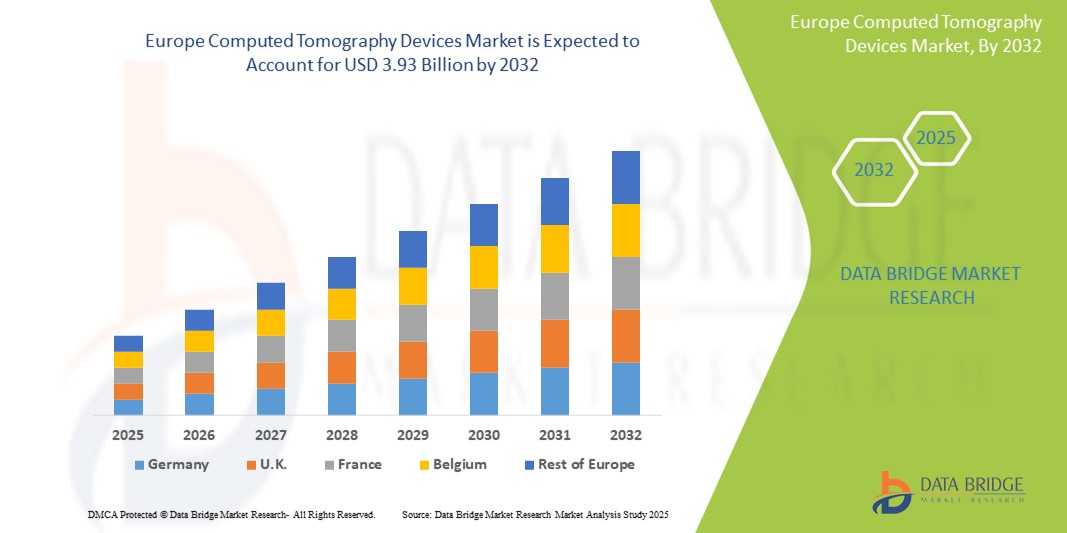
Europe Computed Tomography Devices Market Size
- The Europe computed tomography devices market size was valued atUSD 2.50 billion in 2024and is expected to reachUSD 3.93 billion by 2032, at aCAGR of 5.80%during the forecast period
- This growth is driven by factors such as the increasing prevalence of chronic diseases, rising demand for advanced diagnostic imaging, technological advancements in CT systems, and the growing geriatric population across Europe
Europe Computed Tomography Devices Market Analysis
- The Europe computed tomography devices market currently reflects a strong focus on product innovation, with companies investing in advanced imaging technologies that enhance scan accuracy and reduce patient exposure time
- Increasing adoption of artificial intelligence integration in computed tomography systems is shaping purchasing decisions, as healthcare providers seek smarter diagnostics with faster image reconstruction
- Germany is expected to dominate the market with 6.75% market share due to well-established healthcare infrastructure and a high demand for advanced diagnostic
- France is expected to be the fastest growing region in the market during the forecast period with 6.48% market share due to increased healthcare investments and an aging population that requires advanced diagnostic solutions
- The High-Slice CT segment is expected to dominate the market with the largest share of 35.05% in 2025 due to its ability to provide faster and more detailed imaging. High-Slice CT scanners can capture multiple slices in a single rotation, significantly reducing scan time while maintaining high image resolution. This feature is particularly beneficial in emergency and critical care settings where rapid diagnosis is essential. The demand for high-slice systems is also driven by advancements in multi-slice technology, which offers improved visualization of soft tissues, bones, and blood vessels
Report Scope and Europe Computed Tomography Devices Market Segmentation
|
Attributes |
Europe Computed Tomography Devices Key Market Insights |
|
Segments Covered |
|
|
Countries Covered |
Europe
|
|
Key Market Players |
|
|
Market Opportunities |
|
|
Value Added Data Infosets |
In addition to the insights on market scenarios such as market value, growth rate, segmentation, geographical coverage, and major players, the market reports curated by the Data Bridge Market Research also include in-depth expert analysis, patient epidemiology, pipeline analysis, pricing analysis, and regulatory framework. |
Europe Computed Tomography Devices Market Trends
“Advancements in Imaging Software”
- The computed tomography devices market is currently witnessing a clear trend toward the integration of advanced imaging software to support real-time diagnostics and enhanced image clarity
- Manufacturers are prioritizing software upgrades that allow for faster image processing and seamless data sharing across multiple healthcare platforms
- There is a growing demand for computed tomography systems with customizable scanning protocols that can be tailored to specific clinical needs and patient profiles
- Healthcare facilities are increasingly selecting systems that offer high-resolution imaging with minimal scanning time to optimize workflow and improve patient throughput
- Investment in research and development is driving continuous improvements in post-processing tools that assist radiologists in interpreting complex scans more efficiently
- For instance, some computed tomography devices now come with built-in analytics tools that help in detecting subtle abnormalities, improving diagnostic confidence among clinicians
- In conclusion, the market is steadily evolving with a strong focus on advanced imaging software that enhances diagnostic precision and clinical workflow.
Europe Computed Tomography Devices Market Dynamics
Driver
“Rising Burden of Chronic Diseases”
- The increasing prevalence of chronic diseases such as cancer and cardiovascular disorders is driving higher demand for computed tomography devices across European healthcare facilities
- With a growing aging population, hospitals are prioritizing faster and more accurate diagnostics to manage long-term health conditions and reduce time to treatment
- For instance, computed tomography is commonly used in Germany’s oncology units to monitor tumor progression and guide treatment decisions
- Investments from public health bodies like the UK's National Health Service have enabled the replacement of outdated scanners with advanced computed tomography systems in multiple hospitals
- For instance, Spain's Ministry of Health funded upgrades in regional hospitals to include multi-slice scanners for improved cardiovascular diagnostics
- In conclusion, the rise in chronic disease cases combined with infrastructure improvements is strengthening the role of computed tomography in early diagnosis and long-term care across Europe
Opportunity
“Rise in Artificial Intelligence Integration in Imaging”
- The integration of artificial intelligence into computed tomography devices is creating new possibilities for faster, more accurate image interpretation across European hospitals
- For instance, tools like Aidoc’s AI software are already helping radiologists in the Netherlands flag urgent brain hemorrhages within minutes of a scan
- Artificial intelligence enhances workflow by automating case prioritization and providing real-time insights, which is crucial in emergency and critical care settings
- Automated scan planning and dose control enabled by artificial intelligence improve patient safety while ensuring high diagnostic accuracy
- Collaborations between tech companies and healthcare providers, such as Siemens Healthineers and University College London Hospitals, are accelerating the adoption of intelligent imaging solutions
- In conclusion, the increasing acceptance of artificial intelligence-based diagnostics is opening a valuable opportunity to modernize computed tomography applications and improve clinical outcomes across Europe
Restraint/Challenge
“High Installation and Maintenance Costs”
- The high initial investment required for computed tomography devices including installation, infrastructure, and staff training makes it difficult for small and mid-sized hospitals to adopt new systems
- For instance, several rural clinics in Eastern Europe have delayed equipment upgrades due to limited budget allocations and lack of long-term financial support
- Ongoing maintenance expenses such as software updates, technical servicing, and skilled personnel add to the financial burden over time
- Older devices still in use due to funding gaps often lack advanced safety features like dose optimization, increasing radiation risk to patients
- Facilities are often dependent on expensive service contracts to prevent downtime, which can disrupt patient care and delay critical diagnoses
- In conclusion, the substantial cost of ownership continues to challenge equitable adoption of computed tomography technology across both urban and underserved healthcare settings in Europe
Europe Computed Tomography Devices Market Scope
The market is segmented on the basis of architecture, technology, type, slice, modality, application, end user, and distribution channel.
|
Segmentation |
Sub-Segmentation |
|
By Architecture |
|
|
By Technology |
|
|
By Type |
|
|
By Slice
|
|
|
By Modality |
|
|
By Application
|
|
|
By End User |
|
|
By Distribution Channel |
|
In 2025, the High-Slice CT segment is projected to dominate the market with a largest share in technology segment
The High-Slice CT segment is expected to dominate the market with the largest share of 35.05% in 2025 due to its ability to provide faster and more detailed imaging. High-Slice CT scanners can capture multiple slices in a single rotation, significantly reducing scan time while maintaining high image resolution. This feature is particularly beneficial in emergency and critical care settings where rapid diagnosis is essential. The demand for high-slice systems is also driven by advancements in multi-slice technology, which offers improved visualization of soft tissues, bones, and blood vessels
The oncology segment is expected to account for the largest share during the forecast period in application segment
In 2025, the oncology segment is expected to dominate the market with the largest market share of 27.29% due to the increasing prevalence of cancer and the critical role of computed tomography in early detection, staging, and monitoring of tumors. CT imaging provides high-resolution images that are essential for identifying and assessing cancerous growths, helping oncologists plan precise treatment strategies.
Europe Computed Tomography Devices Market Regional Analysis
“Germany Holds the Largest Share in the Europe Computed Tomography Devices Market”
- Germany is the largest market for computed tomography devices in Europe with a market share of 6.75%, driven by a well-established healthcare infrastructure and a high demand for advanced diagnostic technologies
- The country's healthcare system focuses heavily on early detection and effective treatment planning, increasing the reliance on high-quality imaging tools like computed tomography
- Major companies such as Siemens Healthineers and Philips have a strong presence in Germany, contributing to the continuous adoption of state-of-the-art imaging systems
- Germany’s healthcare policies support significant investments in diagnostic technologies, making it a key player in the European computed tomography market
- The consistent innovation and development of new technologies in Germany ensure that the country remains a dominant force in the computed tomography market across Europe
“France is Projected to Register the Highest CAGR in the Europe Computed Tomography Devices Market”
- France is experiencing rapid growth in the computed tomography market, with 6.48% market share driven by increased healthcare investments and an aging population that requires advanced diagnostic solutions
- The French healthcare system is modernizing its infrastructure, leading to an accelerated adoption of high-performance computed tomography systems to meet rising demand for accurate diagnostics
- Artificial intelligence integration into computed tomography machines in France is improving diagnostic efficiency, supporting the country’s rapid growth in this market
- As chronic diseases become more prevalent, healthcare providers in France are increasingly utilizing computed tomography for early detection and treatment planning
- France's commitment to healthcare modernization and technological innovation is positioning it as the fastest-growing country in the European computed tomography market
Europe Computed Tomography Devices Market Share
The market competitive landscape provides details by competitor. Details included are company overview, company financials, revenue generated, market potential, investment in research and development, new market initiatives, presence, production sites and facilities, production capacities, company strengths and weaknesses, product launch, product width and breadth, application dominance. The above data points provided are only related to the companies' focus related to market.
The Major Market Leaders Operating in the Market Are:
- CANON MEDICAL SYSTEMS CORPORATION (U.S.)
- Medtronic (Ireland)
- FUJIFILM Holdings Corporation (Japan)
- SternMed GmbH (Germany)
- Esaote SPA (Italy)
- MinFound Medical Systems Co., Ltd. (China)
- Neusoft Corporation (China)
- Brainlab AG (Germany)
- Hologic, Inc. (U.S.)
- SAMSUNG (South Korea)
- PLANMED OY (Finland)
- Shimadzu Corporation (Japan)
- SCANCO Medical AG (Switzerland)
- Shenzhen Anke High-tech Co., Ltd. (China)
- Accuray Incorporated (U.S.)
- AB-CT – Advanced Breast-CT GmbH (Germany)
- Koning Health (U.S.)
Latest Developments in Europe Computed Tomography Devices Market
- In June 2022, Trivitron Healthcare launched plans to introduce domestically manufactured CT-Scan and MRI systems in fiscal year 2022-23, catering to both Indian and markets. The initiative aims to enhance diagnostic capabilities in remote areas, leveraging smart features, cost-effectiveness, and portability for improved healthcare access
- In April 2022, Wipro GE Healthcare launched the Revolution Aspire CT scanner, a next-generation imaging solution entirely designed and produced in India. Aligned with the "Atmanirbhar Bharat" initiative, it signifies a significant step towards self-reliance in medical device manufacturing, contributing to technological advancements in the healthcare sector
- In April 2022, Siemens inaugurated a new production line in Bengaluru, India, dedicated to manufacturing CT scanners. This strategic move underscores Siemens' commitment to local production, supporting healthcare infrastructure growth and accessibility to advanced medical imaging technologies
- In November 2021, Siemens Healthineers launched the Naeotom Alpha, a photon-counting CT scanner cleared for clinical use in the U.S. and Europe. This cutting-edge system signifies advancements in diagnostic imaging technology, offering precision and reliability for medical professionals
- In May 2021, Royal Philips launched the Spectral Computed Tomography (CT) 7500, featuring a spectral detector for precision diagnostics. This innovation enhances imaging capabilities, reinforcing Philips' commitment to delivering state-of-the-art solutions for improved patient care and diagnostic accuracy
SKU-
Get online access to the report on the World's First Market Intelligence Cloud

- Interactive Data Analysis Dashboard
- Company Analysis Dashboard for high growth potential opportunities
- Research Analyst Access for customization & queries
- Competitor Analysis with Interactive dashboard
- Latest News, Updates & Trend analysis
- Harness the Power of Benchmark Analysis for Comprehensive Competitor Tracking
研究方法
数据收集和基准年分析是使用具有大样本量的数据收集模块完成的。该阶段包括通过各种来源和策略获取市场信息或相关数据。它包括提前检查和规划从过去获得的所有数据。它同样包括检查不同信息源中出现的信息不一致。使用市场统计和连贯模型分析和估计市场数据。此外,市场份额分析和关键趋势分析是市场报告中的主要成功因素。要了解更多信息,请请求分析师致电或下拉您的询问。
DBMR 研究团队使用的关键研究方法是数据三角测量,其中包括数据挖掘、数据变量对市场影响的分析和主要(行业专家)验证。数据模型包括供应商定位网格、市场时间线分析、市场概览和指南、公司定位网格、专利分析、定价分析、公司市场份额分析、测量标准、全球与区域和供应商份额分析。要了解有关研究方法的更多信息,请向我们的行业专家咨询。
可定制
Data Bridge Market Research 是高级形成性研究领域的领导者。我们为向现有和新客户提供符合其目标的数据和分析而感到自豪。报告可定制,包括目标品牌的价格趋势分析、了解其他国家的市场(索取国家列表)、临床试验结果数据、文献综述、翻新市场和产品基础分析。目标竞争对手的市场分析可以从基于技术的分析到市场组合策略进行分析。我们可以按照您所需的格式和数据样式添加您需要的任意数量的竞争对手数据。我们的分析师团队还可以为您提供原始 Excel 文件数据透视表(事实手册)中的数据,或者可以帮助您根据报告中的数据集创建演示文稿。

