
Europe Biostimulants Market
市场规模(十亿美元)
CAGR :
% 
 USD
2,105.07 Million
USD
5,423.09 Million
2025
2033
USD
2,105.07 Million
USD
5,423.09 Million
2025
2033
| 2026 –2033 | |
| USD 2,105.07 Million | |
| USD 5,423.09 Million | |
| % | |
|
歐洲生物刺激劑市場細分,依來源(合成生物刺激劑、天然生物刺激劑)、形態(液體、固體)、活性成分(B群維生素、殼聚醣、幾丁質、微生物改良劑、蛋白質水解物、萃取物、酸基、其他)、應用方法(種子處理、土壤處理、葉面處理)、作物(藥劑、植物、油籽、其他植物)
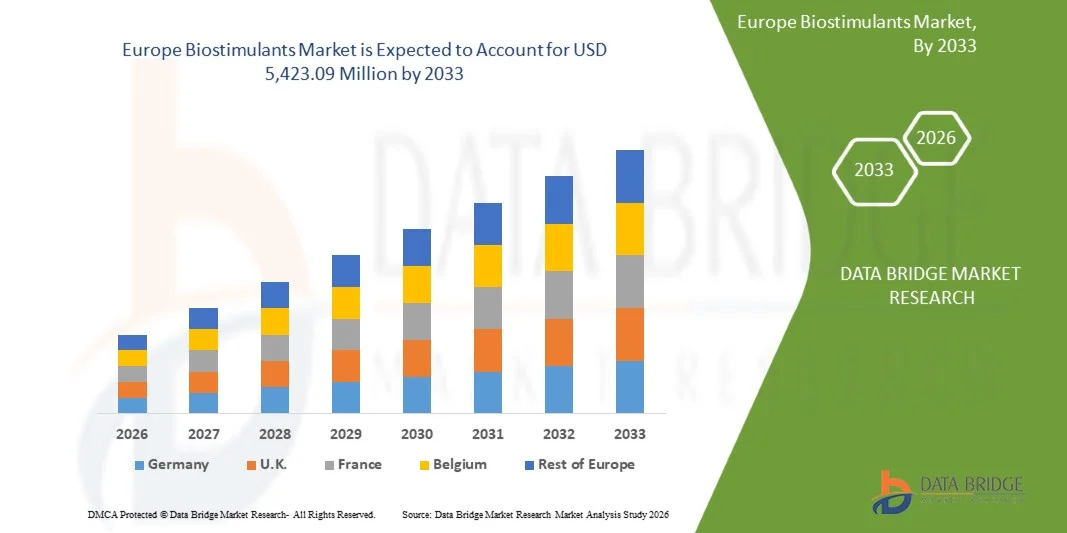
歐洲生物刺激劑市場規模
- 2025年歐洲生物刺激劑市場規模為21.0507億美元 ,預計 2033年將達到54.2309億美元,預測期內 複合年增長率為12.3%。
- 市場成長的主要驅動力是食品飲料、皮革、製藥和動物飼料等關鍵產業對天然和永續添加劑的需求不斷增長。萃取和加工技術的進步提高了生物刺激劑的生產效率和質量,同時也促進了產業的數位轉型和創新。
- 消費者對植物基和環保產品的偏好日益增強,這鞏固了生物刺激劑作為合成化學品的理想替代品的地位。這些因素共同加速了生物刺激劑解決方案的普及,並大大促進了歐洲生物刺激劑市場的擴張。
歐洲生物刺激劑市場分析
- 生物刺激劑是存在於各種植物中的天然多酚化合物,由於其具有收斂性、抗氧化活性、抗菌作用和環保性等多功能特性,在包括食品和飲料、皮革加工、製藥、動物飼料和水處理在內的多個行業中變得越來越重要。
- 生物刺激劑需求不斷增長的主要原因是歐洲轉向天然、永續和生物基產品,環保意識不斷提高,以及監管壓力不斷加大,以減少工業和消費品中合成添加劑和化學品的使用。
- 西班牙是歐洲生物刺激劑市場的主導力量,預計到2025年將佔據該地區19.78%的市場份額,並預計在2026年至2033年間以14.8%的強勁複合年增長率增長。這一增長主要得益於精準農業和數位化農業工具的高普及率、有機和再生農業面積的持續擴大,以及領先的生物刺激劑生產商和研究機構的強大影響力。此外,對高品質農作物(尤其是水果、蔬菜、玉米、大豆和特種作物)日益增長的需求也持續推動市場的發展。
- 由於天然生物刺激劑在製藥、動物飼料和水淨化等領域的廣泛應用,以及針對其藥用、抗氧化和功能特性的研發投入不斷增加,預計到 2026 年,天然生物刺激劑細分市場將佔據 71.41% 的市場份額。
報告範圍及歐洲生物刺激劑市場細分
|
屬性 |
歐洲生物刺激劑市場關鍵洞察 |
|
涵蓋的領域 |
|
|
覆蓋國家/地區 |
歐洲
|
|
主要市場參與者 |
|
|
市場機遇 |
|
|
加值資料資訊集 |
除了對市場狀況(如市場價值、成長率、細分、地理覆蓋範圍和主要參與者)的洞察之外,Data Bridge Market Research 精心編制的市場報告還包括進出口分析、產能概覽、生產消費分析、價格趨勢分析、氣候變遷情境、供應鏈分析、價值鏈分析、原材料/消耗標準概覽、供應商選擇、PESTLE 分析、五力分析和監管框架。 |
歐洲生物刺激劑市場趨勢
“微生物和奈米生物刺激劑的整合以提高作物產量”
- 歐洲生物刺激劑市場一個顯著且快速成長的趨勢是,微生物和奈米生物刺激劑技術的日益普及,旨在提高作物產量、養分利用效率以及對非生物脅迫的抵抗力。這一趨勢的驅動力來自農業生物技術的快速發展,以及歐洲對高效、低投入和永續農業解決方案的積極推動。
- UPL、Valagro 和 Novozymes 等領先企業正大力投資微生物群落和奈米製劑,以提供針對性益處,例如提高固氮能力、增強根系定殖、加快養分吸收以及增強作物在乾旱、高溫和鹽鹼等逆境下的耐受性。這些創新正在幫助農民提高產量,同時減少對合成肥料的依賴。
- 微生物生物刺激劑——尤其是植物促進根際細菌(PGPR)、菌根真菌和芽孢桿菌類溶液——因其能夠增強根系結構、改善土壤肥力並刺激植物的天然防禦機製而日益受到關注。各公司也正在開發新一代菌株,以增強其在不同土壤和氣候條件下的存活率和適應性。
- 奈米生物刺激劑,包括奈米矽、奈米氨基酸和奈米螯合微量元素,正逐漸成為傳統製劑的高效替代品。它們的奈米級結構提高了滲透性、流動性和養分生物利用度,從而加快了植物的反應速度並降低了施用劑量。
- 在精準農業中,這些先進的生物刺激劑正與土壤微生物組測繪、遙感和人工智慧驅動的作物監測等數位工具相結合,以實現量身定制的應用策略並優化田間表現。
- 這種向下一代微生物和奈米生物刺激劑的轉變正在重新定義行業標準,將市場從基本的有機投入物過渡到科學設計的高性能生物解決方案。
歐洲生物刺激劑市場動態
司機
“乾旱、洪水和熱浪等與氣候相關的作物脅迫事件日益頻繁,促使農民採用生物刺激劑來維持作物產量和品質。”
- 乾旱、洪水和熱浪等氣候相關壓力的頻繁發生已成為歐洲農業面臨的重大問題,直接影響作物產量和糧食安全。
- 這些極端條件會擾亂植物新陳代謝,損害養分吸收,並降低整體產量潛力。因此,農民越來越多地轉向生物刺激劑——能夠增強植物生理過程的天然物質——以提高作物抵禦環境壓力的能力。
- 生物刺激劑的採用使生產者能夠在不可預測的氣候條件下保持產量和質量,同時支持土壤和生態系統的長期健康。
- 例如,如MDPI在2025年7月發表的一篇研究文章中所述,在水分虧缺條件下,向大豆作物施用海藻萃取物可提高光合效率和生物量積累,這表明生物刺激劑在提高抗旱性方面發揮作用。
- 正如巴斯夫和Elicit Plant在2024年10月聯合發布的新聞稿中所述,向日葵田間試驗表明,海藻來源的生物刺激劑能夠提高向日葵的抗旱性,並在缺水條件下維持產量,從而增強了人們對生物脅迫緩解產品的信心。
- 極端氣候事件日益頻繁的持續擾亂歐洲農業生產力,迫使農民尋求能夠增強作物抗逆性的永續解決方案。生物刺激劑已成為緩解乾旱、洪澇和熱浪影響的關鍵組成部分,它能夠提高植物的抗逆性和恢復能力。
- 隨著田間驗證和產品創新的不斷增加,在氣候不確定性加劇的情況下,種植者更加重視產量穩定性和產品質量,預計這些產品的普及速度將進一步加快。
克制/挑戰
“與傳統肥料相比,生物刺激劑產品成本高昂,限制了小農戶和資源匱乏的農民採用這些產品。”
- 與傳統化學肥料相比,生物刺激劑產品的成本相對較高,這嚴重限制了市場成長,尤其是在小規模和資源有限的農民中。
- 生物刺激劑雖然在土壤健康、產量穩定性和永續性方面具有長期益處,但其前期成本高且價格競爭力有限,往往阻礙了成本敏感型農業地區的推廣應用。這種價格差異,加上人們對長期經濟效益認識不足,持續阻礙生物刺激劑在發展中和低收入農業社區的廣泛應用。
- 例如,根據 KNN India 於 2025 年 9 月報道,化肥行業強調,將生物刺激劑納入正規化肥控制的新法規提高了合規和生產成本,威脅到許多小型中小企業製造商,並間接增加了農民的最終產品成本。
- 2025年,Khoulati等人在《利用生物刺激劑促進永續農業》一文中指出,主要挑戰之一是“經濟限制”,包括相對於傳統投入品而言較高的產品成本,這限制了資源匱乏地區對生物刺激劑的採用。
- 與傳統肥料相比,生物刺激劑產品的成本相對較高,這仍然是其廣泛應用的主要障礙,尤其是在小規模和資源有限的農民中。
- 儘管生物刺激劑已被證實對土壤健康、作物抗逆性和長期可持續性有益,但其較高的前期投入、有限的政府補貼以及缺乏價格合理的配方,使得價格敏感型種植戶難以負擔。除非透過政策支援、技術創新和在地化生產來解決成本障礙,否則生物刺激劑在許多發展中地區改變永續農業的潛力仍將無法充分發揮。
機會
“隨著農業現代化程度的提高和人們對永續農業實踐意識的增強,向新興市場擴張蘊藏著巨大的成長潛力。”
- 生物刺激劑在新興市場的應用拓展帶來了巨大的成長機遇,這主要得益於農業現代化進程的加速和人們對永續農業實踐認識的不斷提高。隨著亞太、拉丁美洲和非洲各國越來越多地採用先進的作物管理技術來提高生產力和資源利用效率,生物刺激劑作為改善土壤健康和增強作物抗逆性的環保解決方案,正日益受到關注。政府的支持性舉措、不斷增長的農業研發投入以及農民教育計畫的開展,進一步促進了市場滲透,使新興經濟體在未來幾年成為全球生物刺激劑行業的關鍵成長中心。
- 例如,2025 年 8 月,《今日 GK》的一篇文章報道稱,印度向可持續和氣候適應型農業的轉變以及對作物健康的日益關注,正在推動該國生物刺激劑的使用。
- 例如,2025 年 7 月,Agrithority 發表文章稱,在拉丁美洲,人們越來越認識到生物刺激劑和生物投入物是熱帶農業系統中可持續的替代品,這正在加速巴西、阿根廷和秘魯的投資和採用。
- 儘管生物刺激劑領域透過增強植物抗逆性、改善土壤健康和減少對傳統農業化學品的依賴,為向永續農業轉型提供了廣闊前景,但其發展之路並非一帆風順。關鍵問題包括:監管環境仍在不斷完善以確保產品功效和品質;農民教育和實地保障方面存在普遍不足;以及市場上充斥著未經驗證的配方。除非透過標準化測試、提高透明度和以農民為中心的推廣服務來解決這些障礙,否則生物刺激劑的全部潛力將受到限制。
歐洲生物刺激劑市場範圍
歐洲生物刺激劑市場根據來源、形式、活性成分、應用方法、作物、最終用戶等因素分為六個主要部分。
- 按起源
根據來源,全球歐洲生物刺激劑市場可分為合成生物刺激劑和天然生物刺激劑。乾粉劑再細分為水分散型、乾粉顆粒和可濕性粉劑,而外包加工產品又細分為懸浮濃縮物、乳化濃縮物和可溶性液體濃縮物。天然生物刺激劑還可根據劑型進一步細分為乾粉劑和外包加工產品。乾粉劑又細分為水分散型、乾粉顆粒和可濕性粉劑。預計到2026年,天然生物刺激劑將佔據主導地位,市佔率將達到71.94%。
由於越來越多的農民尋求可持續和環境友善的作物管理解決方案,天然生物刺激劑細分市場預計也將實現最高的複合年增長率,達到12.6%。天然生物刺激劑源自海藻萃取物、蛋白質水解物和有益微生物等有機來源,能夠促進植物生長、提高養分吸收和抗逆性,不會像合成化學物質那樣對環境造成影響。
- 按表格
根據劑型,全球歐洲生物刺激劑市場可分為液體和固體劑型。固體劑型可細分為水分散型、乾粉型及可濕性粉劑。液體劑型則進一步細分為懸浮液、乳油和可溶性液體濃縮物。預計2026年,液體劑型將佔據市場主導地位,市佔率達65.45%。
由於液體製劑施用方便、吸收迅速,且與現代灌溉和噴灑系統相容,預計其複合年增長率將達到12.5%,成為該細分市場成長最快的領域。液體生物刺激劑能均勻分佈活性成分,確保高效吸收養分,促進植物生長,特別適用於大規模農業生產。
- 活性成分
根據活性成分,全球歐洲生物刺激劑市場可細分為B群維生素、殼聚醣、幾丁質、微生物改良劑、蛋白質水解物、萃取物類、酸類及其他。萃取物類市場又可細分為真菌萃取物、植物萃取物和海藻萃取物。酸類市場則進一步細分為腐植酸、富裡酸和胺基酸。預計到2026年,酸類產品將佔據市場主導地位,市佔率高達53.32%。
由於胺基酸、腐植酸和富裡酸在提高作物產量和抗逆性方面的應用日益廣泛,預計酸性生物刺激劑細分市場也將實現12.7%的最高複合年增長率。這些酸性生物刺激劑能夠改善養分吸收,促進根系發育,並增強植物對乾旱、鹽鹼和極端溫度等非生物壓力的抵抗力。它們對多種作物均有效,加之農民對永續和環保農業實踐的認識不斷提高,推動了其日益普及。
- 透過申請
根據應用方法,全球歐洲生物刺激劑市場可分為種子處理、土壤處理和葉面處理。預計到2026年,葉面處理將佔據市場主導地位,市佔率高達74.39%。
由於葉面噴施能夠直接有效地將營養物質和活性成分輸送至作物,預計該細分市場也將實現最高的複合年增長率(CAGR),達到12.4%。與土壤施用相比,葉面噴施能夠使作物快速吸收養分,從而更快地促進生長、提高抗逆性和增產效果。精準農業技術的日益普及、對勞動效率要求的不斷提高以及葉面噴施在多種作物上的廣泛適用性,都將進一步推動市場成長。
- 按作物
根據作物類型,全球歐洲生物刺激劑市場可細分為草坪觀賞植物、油籽和豆類、穀物、水果和蔬菜以及其他。油籽和豆類市場進一步細分為大豆、向日葵、油菜籽/菜籽、花生、芝麻以及其他。穀物市場進一步細分為小麥、大米、玉米、大麥、燕麥、高粱以及其他。預計到2026年,水果和蔬菜細分市場將佔據主導地位,市佔率達58.87%。
由於消費者對優質、營養豐富且外觀誘人的農產品需求不斷增長,預計水果和蔬菜產業也將實現12.6%的最高複合年增長率。生物刺激劑能夠提高作物產量,改善果實大小、色澤、口感和保質期,並增強作物對乾旱、高溫和鹽鹼等非生物脅迫的抵抗力,因此在水果和蔬菜種植中備受重視。消費者對新鮮和有機農產品的偏好日益增強,加上對化學肥料和農藥監管的日益嚴格,正促使農民採用生物刺激劑。
- 最終用戶
根據最終用戶劃分,全球歐洲生物刺激劑市場可分為研究機構和農民兩大類。預計到2026年,農民群體將佔據市場主導地位,市佔率高達85.34%。
由於人們越來越認識到生物刺激劑是實現永續高產農業的關鍵工具,預計農民群體也將達到12.6%的最高複合年增長率。農民越來越多地採用這些產品來改善作物生長、提高養分利用率並增強作物對乾旱、鹽鹼和極端溫度等環境壓力的抵抗力。對有機和高品質農產品的需求不斷增長,加上對合成肥料和化學投入品的監管日益嚴格,正促使農民將生物刺激劑納入作物管理實踐中。
歐洲生物刺激劑市場區域分析
受永續農業投入品、精準農業技術日益普及以及有機和無殘留食品生產趨勢的推動,歐洲生物刺激劑市場正經歷穩定強勁的成長。該地區持續增加對生物作物增效解決方案的投資,以提高養分利用率、抗逆性和整體植物產量。
西班牙歐洲生物刺激劑市場洞察
西班牙是歐洲生物刺激劑市場的主導力量。這一增長得益於精準農業和數位化農業工具的高普及率、有機和再生農業面積的持續擴大,以及領先的生物刺激劑生產商和研究機構的強大影響力。此外,對高品質農作物(尤其是水果、蔬菜、玉米、大豆和特種作物)日益增長的需求也持續推動市場的發展。
英國生物刺激劑市場洞察
預計到2026年,英國將佔據歐洲生物刺激劑市場的重要份額。這一增長主要得益於有機農業和低化學投入農業的快速發展、消費者對清潔標籤和生物基食品日益增長的需求,以及政府對環保農業實踐的大力支持。生物刺激劑在包括穀物、油籽、草坪和園藝作物在內的主要作物類別中的應用不斷擴大,進一步加速了市場普及。此外,英國對土壤健康改善計畫的持續投入,也強化了向生物作物增產解決方案的轉變,從而支撐了市場的長期持續成長。
歐洲生物刺激劑市場份額
歐洲生物刺激劑產業主要由一些成熟企業主導,其中包括:
- 味之素株式會社(日本)
- 先正達生物製品(瑞士)
- 科羅曼德國際有限公司(印度)
- 巴斯夫(德國)
- 拜耳股份公司(德國)
- UPL(印度)
- Biostadt India Limited(印度)
- 諾維信(丹麥)
- 美國農業部
- FMC公司(美國)
- T. Stanes & Company Limited (TSTANES)(印度)
- REKA(Koppert)(荷蘭)
- Atlántica Agrícola(西班牙)
- 海法內蓋夫技術有限公司(以色列)
- ILSA SpA(義大利)
- AG Biotech公司(美國)
歐洲生物刺激劑市場最新動態
- 2023年2月,ILSA推出了基於再生植物資源(大豆和藻類)的新型生物刺激劑。大豆基產品含有胺基酸、甜菜鹼和三十烷醇,而藻類基生物刺激劑則採用可持續的非侵入性方法萃取。兩種產品均能促進植物生長,增強植物抗逆性,並提高果實品質。
- 2025年2月,Horticoop投資了REKA Group BV,該公司是Koppert的衍生企業,專注於土壤再生改良。這項投資旨在支持REKA的使命,即開發和推廣生物刺激劑、營養物質和接種劑,以增強土壤健康、養分利用效率和植物抗逆性。此次合作旨在加強歐洲的永續農業和園藝發展。
- 2024 年 10 月,T.Stanes 公司推出並推廣了維生素生物刺激劑 Fytovita,強調其在促進植物生長、減輕非生物脅迫以及提高作物產量和品質方面的作用。
- 2025 年 3 月,味之素株式會社宣布將作為合作夥伴參與日本-巴西綠色夥伴關係倡議下的巴西「退化牧場恢復驗證研究」項目,提供其氨基酸生物刺激劑產品(例如 AJIFOL 和 AMINO 精氨酸)用於農田,以驗證退化牧場的恢復情況。
- 2025 年 11 月,巴斯夫宣布將繼續致力於為 2026 年種植季的種植者提供低利率融資,為購買參與活動的作物保護、種子處理和種子品牌提供 0% 年利率融資,以支持農民對永續農業的投資。
SKU-
Get online access to the report on the World's First Market Intelligence Cloud

- Interactive Data Analysis Dashboard
- Company Analysis Dashboard for high growth potential opportunities
- Research Analyst Access for customization & queries
- Competitor Analysis with Interactive dashboard
- Latest News, Updates & Trend analysis
- Harness the Power of Benchmark Analysis for Comprehensive Competitor Tracking
目录
1 INTRODUCTION
1.1 OBJECTIVES OF THE STUDY
1.2 MARKET DEFINITION
1.3 OVERVIEW OF EUROPE BIOSTIMULANTS MARKET
1.4 CURRENCY AND PRICING
1.5 LIMITATIONS
1.6 MARKETS COVERED
2 MARKET SEGMENTATION
2.1 MARKETS COVERED
2.2 GEOGRAPHICAL SCOPE
2.3 YEARS CONSIDERED FOR THE STUDY
2.4 DBMR TRIPOD DATA VALIDATION MODEL
2.5 PRIMARY INTERVIEWS WITH KEY OPINION LEADERS
2.6 DBMR MARKET POSITION GRID
2.7 VENDOR SHARE ANALYSIS
2.8 MULTIVARIATE MODELING
2.9 ORIGIN TIMELINE CURVE
2.1 MARKET END-USER COVERAGE GRID
2.11 SECONDARY SOURCES
2.12 ASSUMPTIONS
3 EXECUTIVE SUMMARY
4 PREMIUM INSIGHTS
4.1 PORTER’S FIVE FORCES ANALYSIS
4.1.1 THREAT OF NEW ENTRANTS
4.1.2 BARGAINING POWER OF SUPPLIERS
4.1.3 BARGAINING POWER OF BUYERS
4.1.4 THREAT OF SUBSTITUTE PRODUCTS
4.1.5 INDUSTRY RIVALRY
4.2 PRICING ANALYSIS
4.3 COMPANY PRODUCTION CAPACITY OUTLOOK
4.3.1 OVERVIEW
4.3.2 CONCLUSION
4.4 INDUSTRY ECO-SYSTEM ANALYSIS
4.4.1 OVERVIEW
4.4.2 PROMINENT COMPANIES
4.4.2.1 EUROPE SCALE AND STRATEGIC ADVANTAGES
4.4.2.2 KEY FUNCTIONS AND VALUE‑CHAIN ROLES
4.4.3 SMALL & MEDIUM‑SIZED COMPANIES
4.4.3.1 INNOVATION‑DRIVEN SMES
4.4.3.2 BUSINESS MODELS AND COMPETITIVE ROLES
4.4.4 END USERS
4.4.4.1 SEGMENTATION OF END USERS
4.4.4.2 ADOPTION DRIVERS, BARRIERS AND VALUE CREATION
4.4.4.3 END‑USER TABLE BY CROP SEGMENT
4.4.5 CONCLUSION
4.5 PATENT ANALYSIS– EUROPE BIOSTIMULANTS MARKET
4.5.1 PATENT QUALITY AND STRENGTH
4.5.2 PATENT FAMILIES
4.5.3 LICENSING AND COLLABORATIONS
4.5.4 REGION PATENT LANDSCAPE
4.5.5 IP STRATEGY AND MANAGEMENT
4.6 RAW MATERIAL SOURCING
4.6.1 SEAWEED EXTRACTS
4.6.2 HUMIC AND FULVIC SUBSTANCES
4.6.3 AMINO ACIDS AND PROTEIN HYDROLYSATES
4.6.4 MICROBIAL STRAINS (BACTERIA, FUNGI, AND YEAST)
4.6.5 ORGANIC ACIDS AND POLYSACCHARIDES
4.6.6 INORGANIC NUTRIENTS AND CHELATING AGENTS
4.6.7 CARRIERS AND FORMULATION ADDITIVES
4.7 FACTORS AFFECTING BUYING DECISIONS IN THE EUROPE BIOSTIMULANTS MARKET
4.7.1 INTRODUCTION:
4.7.2 PROVEN TECHNICAL EFFICACY AND DEMONSTRATED PERFORMANCE
4.7.3 CROP, SOIL, AND ENVIRONMENTAL FIT
4.7.4 ECONOMIC VIABILITY AND RETURN ON INVESTMENT (ROI)
4.7.5 TRUST, TRANSPARENCY, AND BRAND REPUTATION
4.7.6 REGULATORY COMPLIANCE AND SUSTAINABILITY CREDENTIALS
4.7.7 KNOWLEDGE, AWARENESS, AND RISK PERCEPTION
4.7.8 CONCLUSION
4.8 PRODUCTION CONSUMPTION ANALYSIS
4.8.1 PRODUCTION DATASET
4.8.2 CONSUMPTION DATASET
4.9 IMPORT EXPORT SCENARIO
4.9.1 IMPORT DATASET
4.9.2 EXPORT DATASET
4.1 INNOVATION TRACKER AND STRATEGIC ANALYSIS
4.10.1 MAJOR DEALS AND STRATEGIC ALLIANCES ANALYSIS
4.10.1.1 JOINT VENTURES
4.10.1.2 MERGERS & ACQUISITIONS
4.10.1.3 LICENSING & PARTNERSHIP AGREEMENTS
4.10.1.4 TECHNOLOGY COLLABORATIONS
4.10.1.5 STRATEGIC DIVESTMENTS / PORTFOLIO RESTRUCTURING
4.10.2 NUMBER OF PRODUCTS IN DEVELOPMENT
4.10.3 STAGE OF DEVELOPMENT
4.10.4 TIMELINES AND MILESTONES
4.10.5 INNOVATION STRATEGIES AND METHODOLOGIES
4.10.6 RISK ASSESSMENT AND MITIGATION
4.11 PRODUCT ADOPTION SCENARIO IN THE EUROPE BIOSTIMULANTS MARKET
4.11.1 INTRODUCTION
4.11.2 CURRENT STAGE OF ADOPTION
4.11.3 REGIONAL AND CROP-SPECIFIC ADOPTION PATTERNS
4.11.4 DRIVERS OF ADOPTION
4.11.5 BARRIERS TO ADOPTION
4.11.6 ADOPTION CURVE AND OUTLOOK
4.11.7 FARMER-CENTRIC PERSPECTIVE
4.11.8 IMPLICATIONS FOR STAKEHOLDERS
4.11.9 CONCLUSION
4.12 COMPANY EVALUATION QUADRANT
4.13 COST ANALYSIS BREAKDOWN
4.13.1 OVERVIEW
4.13.2 CAPITAL INVESTMENT AND PRODUCTION SCALE
4.13.2.1 PLANT SCALE, INFRASTRUCTURE AND AUTOMATION
4.13.2.2 EQUIPMENT AND PROCESS COMPLEXITY
4.13.3 RAW MATERIAL, FORMULATION AND OPERATING COSTS
4.13.3.1 RAW MATERIAL SOURCING AND VARIABILITY
4.13.3.2 PROCESSING INTENSITY AND FORMULATION COMPLEXITY
4.13.3.3 VARIABILITY AND RISK PREMIUMS
4.13.4 REGULATORY, COMPLIANCE AND REGISTRATION COSTS
4.13.4.1 REGULATORY LANDSCAPE AND ASSOCIATED COSTS
4.13.4.2 IMPLICATIONS FOR MANUFACTURING COST BASE
4.13.5 LOGISTICS, DISTRIBUTION AND APPLICATION COSTS
4.13.5.1 PACKAGING, STORAGE AND TRANSPORTATION
4.13.5.2 CHANNEL STRUCTURE AND END‑USER APPLICATION
4.13.6 COST‑BENEFIT CONSIDERATIONS AND MARGIN IMPLICATIONS
4.13.6.1 RETURN‑ON‑INVESTMENT FOR GROWERS
4.13.6.2 MANUFACTURER AND DISTRIBUTOR MARGINS
4.13.7 COST‑REDUCTION OPPORTUNITIES AND INDUSTRY TRENDS
4.13.7.1 USE OF AGRO‑WASTE FEEDSTOCKS AND CIRCULAR ECONOMY
4.13.7.2 SCALE‑UPS, PROCESS EFFICIENCY AND STANDARDISATION
4.13.7.3 REGULATORY HARMONISATION AND EUROPE MARKET ACCESS
4.13.8 CONCLUSION
4.14 PROFIT MARGINS SCENARIO
4.14.1 OVERVIEW
4.14.2 VALUE‑CHAIN MARGIN STRUCTURE
4.14.2.1 MANUFACTURER GROSS MARGIN
4.14.2.2 DISTRIBUTOR / DEALER MARGIN
4.14.2.3 FARMER VALUE‑CAPTURE AND MARGIN REALISATION
4.14.3 MARGIN DRIVERS AND CONSTRAINTS
4.14.3.1 NOVEL ACTIVES AND PREMIUM PRICING
4.14.3.2 COST BASED PRESSURES
4.14.3.3 SCALE AND ADOPTION RATE
4.14.3.4 COMPETITIVE PRESSURE AND SUBSTITUTION
4.14.3.5 FARMER ROI AND WILLINGNESS TO PAY
4.14.4 ESTIMATED PROFIT MARGIN RANGES
4.14.5 MARGIN IMPROVEMENT STRATEGIES
4.14.5.1 VALUE‑BASED PRICING
4.14.5.2 COST BASE OPTIMISATION
4.14.5.3 PREMIUM SEGMENT FOCUS
4.14.5.4 SCALE EXPANSION
4.14.5.5 FARMER ENGAGEMENT AND DEMONSTRATION
4.14.6 REGIONAL AND CROP‑SEGMENT CONSIDERATIONS
4.14.7 CONCLUSION
4.15 IMPACT OF ECONOMIC SLOWDOWN ON MARKET
4.15.1 IMPACT ON PRICE
4.15.2 IMPACT ON SUPPLY CHAIN
4.15.3 IMPACT ON SHIPMENT
4.15.4 IMPACT ON COMPANY’S STRATEGIC DECISIONS
4.15.5 IMPACT ON DEMAND
4.15.6 IMPACT ON STRATEGIC DECISIONS
4.16 SUPPLY CHAIN ANALYSIS
4.16.1 OVERVIEW
4.16.2 LOGISTICS COST SCENARIO
4.16.3 IMPORTANCE OF LOGISTICS SERVICE PROVIDERS
5 TARIFFS & IMPACT ON THE MARKET
5.1 CURRENT TARIFF RATE
5.1.1 OUTLOOK: LOCAL PRODUCTION VS IMPORT RELIANCE
5.2 VENDOR SELECTION CRITERIA DYNAMICS
5.3 IMPACT ON SUPPLY CHAIN
5.3.1 RAW MATERIAL PROCUREMENT
5.3.2 MANUFACTURING AND PRODUCTION
5.3.3 LOGISTICS AND DISTRIBUTION
5.3.4 PRICE PITCHING AND POSITION OF MARKET
5.4 INDUSTRY PARTICIPANTS: PROACTIVE MOVES
5.4.1 SUPPLY CHAIN OPTIMIZATION
5.4.2 JOINT VENTURE ESTABLISHMENTS
5.5 IMPACT ON PRICES
5.6 REGULATORY INCLINATION
5.6.1 GEOPOLITICAL SITUATION
5.6.2 TRADE PARTNERSHIPS BETWEEN THE COUNTRIES
5.6.2.1 FREE TRADE AGREEMENTS
5.6.2.2 ALLIANCES ESTABLISHMENTS
5.6.3 STATUS ACCREDITATION (INCLUDING MFN)
5.6.4 DOMESTIC COURSE OF CORRECTION
5.6.4.1 INCENTIVE SCHEMES TO BOOST PRODUCTION OUTPUTS
5.6.4.2 ESTABLISHMENT OF SPECIAL ECONOMIC ZONES / INDUSTRIAL PARKS
6 REGULATION COVERAGE IN THE EUROPE BIOSTIMULANTS MARKET
6.1 OVERVIEW
6.2 REGULATORY DEFINITIONS AND CLASSIFICATION
6.3 COMPLIANCE AND REGISTRATION REQUIREMENTS
6.4 REGIONAL REGULATORY HIGHLIGHTS
6.5 IMPLICATIONS FOR STAKEHOLDERS
6.6 CHALLENGES IN REGULATORY COVERAGE
6.7 OUTLOOK
7 MARKET OVERVIEW
7.1 DRIVERS
7.1.1 INCREASING FREQUENCY OF CLIMATE-RELATED CROP STRESS SUCH AS DROUGHTS, FLOODS, AND HEAT WAVES IS DRIVING FARMERS TO ADOPT BIOSTIMULANTS TO MAINTAIN CROP YIELD AND QUALITY.
7.1.2 RISING EUROPE DEMAND FOR ORGANIC AND SUSTAINABLY PRODUCED FOOD IS ENCOURAGING THE USE OF BIOSTIMULANTS AS A NATURAL ALTERNATIVE TO CHEMICAL FERTILIZERS.
7.1.3 DECLINING SOIL FERTILITY DUE TO OVERUSE OF SYNTHETIC FERTILIZERS AND INTENSIVE FARMING PRACTICES IS PROMPTING FARMERS TO USE BIOSTIMULANTS TO ENHANCE NUTRIENT ABSORPTION AND SOIL MICROBIAL ACTIVITY.
7.1.4 GROWING AWARENESS AMONG FARMERS ABOUT LONG-TERM SOIL HEALTH AND SUSTAINABLE AGRICULTURE IS INCREASING THE ADOPTION OF BIOSTIMULANTS TO IMPROVE PLANT RESILIENCE AND PRODUCTIVITY.
7.2 RESTRAINTS
7.2.1 HIGH COST OF BIOSTIMULANT PRODUCTS COMPARED TO CONVENTIONAL FERTILIZERS LIMITS ADOPTION AMONG SMALL-SCALE AND RESOURCE-CONSTRAINED FARMERS
7.2.2 INCONSISTENT PERFORMANCE ACROSS DIFFERENT CROPS, SOILS, AND CLIMATES CREATES UNCERTAINTY FOR FARMERS, SLOWING WIDESPREAD ADOPTION.
7.3 OPPORTUNITY
7.3.1 EXPANSION INTO EMERGING MARKETS WITH INCREASING AGRICULTURAL MODERNIZATION AND AWARENESS OF SUSTAINABLE PRACTICES PRESENTS SIGNIFICANT GROWTH POTENTIAL
7.3.2 DEVELOPMENT OF NEXT-GENERATION BIOSTIMULANTS (MICROBIAL, SEAWEED, OR AMINO ACID-BASED) TAILORED TO SPECIFIC CROPS AND STRESS CONDITIONS OFFERS OPPORTUNITIES FOR PRODUCT DIFFERENTIATION.
7.3.3 INTEGRATION OF BIOSTIMULANTS WITH PRECISION AGRICULTURE TECHNIQUES (LIKE SENSOR-BASED NUTRIENT MANAGEMENT AND TARGETED APPLICATION) CAN OPTIMIZE EFFICACY AND REDUCE INPUT COSTS
7.4 CHALLENGES
7.4.1 LACK OF STANDARDIZED QUALITY BENCHMARKS AND REGULATIONS GLOBALLY MAKES IT DIFFICULT TO ENSURE CONSISTENT PRODUCT EFFECTIVENESS, IMPACTING FARMER TRUST.
7.4.2 FRAGMENTED DISTRIBUTION NETWORKS AND LIMITED AVAILABILITY IN REMOTE AGRICULTURAL REGIONS RESTRICT MARKET PENETRATION AND CONSISTENT USAGE
8 EUROPE BIOSTIMULANTS MARKET, BY ORIGIN
8.1 OVERVIEW
8.2 NATURAL BIOSTIMULANTS
8.2.1 LIQUID
8.2.2 DRY
8.3 SYNTHETIC BIOSTIMULANTS
8.3.1 LIQUID
8.3.2 DRY
9 EUROPE BIOSTIMULANTS MARKET, BY FORM
9.1 OVERVIEW
9.2 LIQUID
9.3 DRY
10 EUROPE BIOSTIMULANTS MARKET, BY ACTIVE INGREDIENTS
10.1 OVERVIEW
10.2 ACID BASED
10.3 EXTRACT BASED
10.4 PROTEIN HYDROLYSATES
10.5 MICROBIAL AMENDMENTS
10.6 CHITIN
10.7 CHITOSAN
10.8 B- VITAMINS
10.9 OTHERS
11 EUROPE BIOSTIMULANTS MARKET, BY CROP
11.1 OVERVIEW
11.2 FRUITS & VEGETABLES
11.3 CEREALS & GRAINS
11.4 OILSEEDS & PULSES
11.5 TURF & ORNAMENTALS
11.6 OTHER CROPS
12 EUROPE BIOSTIMULANTS MARKET, BY APPLICATION METHOD
12.1 OVERVIEW
12.2 FOLIAR TREATMENT
12.3 SOIL TREATMENT
12.4 SEED TREATMENT
13 EUROPE BIOSTIMULANTS MARKET, BY END USER
13.1 OVERVIEW
13.2 FARMERS
13.3 RESEARCH INSTITUTES
14 EUROPE BIOSTIMULANTS MARKET, BY REGION
14.1 EUROPE
14.1.1 SPAIN
14.1.2 ITALY
14.1.3 U.K.
14.1.4 FRANCE
14.1.5 GERMANY
14.1.6 NETHERLANDS
14.1.7 SWITZERLAND
14.1.8 RUSSIA
14.1.9 BELGIUM
14.1.10 TURKEY
14.1.11 POLAND
14.1.12 DENMARK
14.1.13 SWEDEN
14.1.14 NORWAY
14.1.15 REST OF EUROPE
15 GLOBAL BIOSTIMULANTS MARKET: COMPANY LANDSCAPE
15.1 MANUFACTURER COMPANY SHARE ANALYSIS: BILLION
16 SWOT ANALYSIS
17 COMPANY PROFILE
17.1 NOVOZYMES A/S
17.1.1 COMPANY SNAPSHOT
17.1.2 REVENUE ANALYSIS
17.1.3 COMPANY SHARE ANALYSIS
17.1.4 PRODUCT PORTFOLIO
17.1.5 RECENT DEVELOPMENT
17.2 AJINOMOTO CO., INC.
17.2.1 COMPANY SNAPSHOT
17.2.2 REVENUE ANALYSIS
17.2.3 COMPANY SHARE ANALYSIS
17.2.4 PRODUCT PORTFOLIO
17.2.5 RECENT DEVELOPMENT
17.3 UPL
17.3.1 COMPANY SNAPSHOT
17.3.2 REVENUE ANALYSIS
17.3.3 COMPANY SHARE ANALYSIS
17.3.4 PRODUCT PORTFOLIO
17.3.5 RECENT DEVELOPMENT
17.4 SYNGENTA
17.4.1 COMPANY SNAPSHOT
17.4.2 COMPANY SHARE ANALYSIS
17.4.3 PRODUCT PORTFOLIO
17.4.4 RECENT DEVELOPMENT
17.5 BASF
17.5.1 COMPANY SNAPSHOT
17.5.2 REVENUE ANALYSIS
17.5.3 COMPANY SHARE ANALYSIS
17.5.4 PRODUCT PORTFOLIO
17.5.5 RECENT DEVELOPMENT
17.6 AG BIOTECH, INC.
17.6.1 COMPANY SNAPSHOT
17.6.2 PRODUCT PORTFOLIO
17.6.3 RECENT DEVELOPMENT
17.7 AGRICEN
17.7.1 COMPANY SNAPSHOT
17.7.2 PRODUCT PORTFOLIO
17.7.3 RECENT DEVELOPMENT
17.8 ATLÁNTICA AGRÍCOLA
17.8.1 COMPANY SNAPSHOT
17.8.2 PRODUCT PORTFOLIO
17.8.3 RECENT DEVELOPMENT
17.9 BAYER AG
17.9.1 COMPANY SNAPSHOT
17.9.2 REVENUE ANALYSIS
17.9.3 PRODUCT PORTFOLIO
17.9.4 RECENT DEVELOPMENT
17.1 BIOSTADT.
17.10.1 COMPANY SNAPSHOT
17.10.2 PRODUCT PORTFOLIO
17.10.3 RECENT DEVELOPMENT
17.11 COROMANDEL INTERNATIONAL LTD.
17.11.1 COMPANY SNAPSHOT
17.11.2 REVENUE ANALYSIS
17.11.3 PRODUCT PORTFOLIO
17.11.4 RECENT DEVELOPMENT
17.12 FMC CORPORATION
17.12.1 COMPANY SNAPSHOT
17.12.2 REVENUE ANALYSIS
17.12.3 PRODUCT PORTFOLIO
17.12.4 RECENT DEVELOPMENT
17.13 HAIFA NEGEV TECHNOLOGIES LTD.
17.13.1 COMPANY SNAPSHOT
17.13.2 PRODUCT PORTFOLIO
17.13.3 RECENT DEVELOPMENT
17.14 ILSA S.P.A.
17.14.1 COMPANY SNAPSHOT
17.14.2 PRODUCT PORTFOLIO
17.14.3 RECENT DEVELOPMENT
17.15 REKA
17.15.1 COMPANY SNAPSHOT
17.15.2 PRODUCT PORTFOLIO
17.15.3 RECENT DEVELOPMENT
17.16 TSTANES.
17.16.1 COMPANY SNAPSHOT
17.16.2 REVENUE ANALYSIS
17.16.3 PRODUCT PORTFOLIO
17.16.4 RECENT DEVELOPMENT
18 QUESTIONNAIRE
表格列表
TABLE 1 COMPANY PRODUCTION CAPACITY
TABLE 2 EUROPE BIOSTIMULANTS MARKET, BY ORIGIN, 2018-2033 (USD THOUSAND)
TABLE 3 EUROPE BIOSTIMULANTS MARKET, BY ORIGIN, 2018-2033 (TONS)
TABLE 4 EUROPE NATURAL BIOSTIMULANTS IN BIOSTIMULANTS MARKET, BY REGION, 2018-2033 (USD THOUSAND)
TABLE 5 EUROPE NATURAL BIOSTIMULANTS IN BIOSTIMULANTS MARKET, BY FORM, 2018-2033 (USD THOUSAND)
TABLE 6 EUROPE LIQUID IN BIOSTIMULANTS MARKET, BY TYPE, 2018-2033 (USD THOUSAND)
TABLE 7 EUROPE DRY IN BIOSTIMULANTS MARKET, BY TYPE, 2018-2033 (USD THOUSAND)
TABLE 8 EUROPE SYNTHETIC BIOSTIMULANTS IN BIOSTIMULANTS MARKET, BY REGION, 2018-2033 (USD THOUSAND)
TABLE 9 EUROPE SYNTHETIC BIOSTIMULANTS IN BIOSTIMULANTS MARKET, BY FORM, 2018-2033 (USD THOUSAND)
TABLE 10 EUROPE LIQUID IN BIOSTIMULANTS MARKET, BY TYPE, 2018-2033 (USD THOUSAND)
TABLE 11 EUROPE DRY IN BIOSTIMULANTS MARKET, BY TYPE, 2018-2033 (USD THOUSAND)
TABLE 12 EUROPE BIOSTIMULANTS MARKET, BY FORM, 2018-2033 (USD THOUSAND)
TABLE 13 EUROPE LIQUID IN BIOSTIMULANTS MARKET, BY REGION, 2018-2033 (USD THOUSAND)
TABLE 14 EUROPE LIQUID IN BIOSTIMULANTS MARKET, BY TYPE, 2018-2033 (USD THOUSAND)
TABLE 15 EUROPE DRY IN BIOSTIMULANTS MARKET, BY REGION, 2018-2033 (USD THOUSAND)
TABLE 16 EUROPE DRY IN BIOSTIMULANTS MARKET, BY TYPE, 2018-2033 (USD THOUSAND)
TABLE 17 EUROPE BIOSTIMULANTS MARKET, BY ORIGIN, 2018-2033 (USD THOUSAND)
TABLE 18 EUROPE ACID BASED IN BIOSTIMULANTS MARKET, BY REGION, 2018-2033 (USD THOUSAND)
TABLE 19 EUROPE ACID BASED IN BIOSTIMULANTS MARKET, BY TYPE, 2018-2033 (USD THOUSAND)
TABLE 20 EUROPE EXTRACT BASED IN BIOSTIMULANTS MARKET, BY REGION, 2018-2033 (USD THOUSAND)
TABLE 21 EUROPE EXTRACT BASED IN BIOSTIMULANTS MARKET, BY TYPE, 2018-2033 (USD THOUSAND)
TABLE 22 EUROPE PROTEIN HYDROLYSATES IN BIOSTIMULANTS MARKET, BY REGION, 2018-2033 (USD THOUSAND)
TABLE 23 EUROPE MICROBIAL AMENDMENTS IN BIOSTIMULANTS MARKET, BY REGION, 2018-2033 (USD THOUSAND)
TABLE 24 EUROPE CHITIN IN BIOSTIMULANTS MARKET, BY REGION, 2018-2033 (USD THOUSAND)
TABLE 25 EUROPE CHITOSAN IN BIOSTIMULANTS MARKET, BY REGION, 2018-2033 (USD THOUSAND)
TABLE 26 EUROPE B-VITAMINS IN BIOSTIMULANTS MARKET, BY REGION, 2018-2033 (USD THOUSAND)
TABLE 27 EUROPE OTHERS IN BIOSTIMULANTS MARKET, BY REGION, 2018-2033 (USD THOUSAND)
TABLE 28 EUROPE BIOSTIMULANTS MARKET, BY CROP, 2018-2033 (USD THOUSAND)
TABLE 29 EUROPE FRUITS & VEGETABLES IN BIOSTIMULANTS MARKET, BY REGION, 2018-2033 (USD THOUSAND)
TABLE 30 EUROPE FRUITS & VEGETABLES IN BIOSTIMULANTS MARKET, BY FRUITS, 2018-2033 (USD THOUSAND)
TABLE 31 EUROPE FRUITS & VEGETABLES IN BIOSTIMULANTS MARKET, BY VEGETABLE, 2018-2033 (USD THOUSAND)
TABLE 32 EUROPE CEREALS & GRAINS IN BIOSTIMULANTS MARKET, BY REGION, 2018-2033 (USD THOUSAND)
TABLE 33 EUROPE CEREALS & GRAINS IN BIOSTIMULANTS MARKET, BY TYPE, 2018-2033 (USD THOUSAND)
TABLE 34 EUROPE OILSEEDS & PULSES IN BIOSTIMULANTS MARKET, BY REGION, 2018-2033 (USD THOUSAND)
TABLE 35 EUROPE OILSEEDS & PULSES IN BIOSTIMULANTS MARKET, BY TYPE, 2018-2033 (USD THOUSAND)
TABLE 36 EUROPE TURF & ORNAMENTALS IN BIOSTIMULANTS MARKET, BY REGION, 2018-2033 (USD THOUSAND)
TABLE 37 EUROPE OTHER CROPS IN BIOSTIMULANTS MARKET, BY REGION, 2018-2033 (USD THOUSAND)
TABLE 38 EUROPE BIOSTIMULANTS MARKET, BY APPLICATION METHOD, 2018-2033 (USD THOUSAND)
TABLE 39 EUROPE FOLIAR TREATMENT IN BIOSTIMULANTS MARKET, BY REGION, 2018-2033 (USD THOUSAND)
TABLE 40 EUROPE SOIL TREATMENT IN BIOSTIMULANTS MARKET, BY REGION, 2018-2033 (USD THOUSAND)
TABLE 41 EUROPE SEED TREATMENT IN BIOSTIMULANTS MARKET, BY REGION, 2018-2033 (USD THOUSAND)
TABLE 42 EUROPE BIOSTIMULANTS MARKET, BY END USER, 2018-2033 (USD THOUSAND)
TABLE 43 EUROPE FARMERS IN BIOSTIMULANTS MARKET, BY REGION, 2018-2033 (USD THOUSAND)
TABLE 44 EUROPE RESEARCH INSTITUTES IN BIOSTIMULANTS MARKET, BY REGION, 2018-2033 (USD THOUSAND)
TABLE 45 EUROPE BIOSTIMULANTS MARKET, BY COUNTRY, 2018-2033 (USD THOUSAND)
TABLE 46 EUROPE BIOSTIMULANTS MARKET, BY COUNTRY, 2018-2033 (USD THOUSAND)
TABLE 47 EUROPE BIOSTIMULANTS MARKET, BY COUNTRY, 2018-2033 (TONS)
TABLE 48 EUROPE
TABLE 49 EUROPE BIOSTIMULANTS MARKET, BY ORIGIN, 2018-2033 (USD THOUSAND)
TABLE 50 EUROPE BIOSTIMULANTS MARKET, BY ORIGIN, 2018-2033 (TONS)
TABLE 51 EUROPE NATURAL BIOSTIMULANTS IN BIOSTIMULANTS MARKET, BY FORM, 2018-2033 (USD THOUSAND)
TABLE 52 EUROPE LIQUID IN BIOSTIMULANTS MARKET, BY TYPE, 2018-2033 (USD THOUSAND)
TABLE 53 EUROPE DRY IN BIOSTIMULANTS MARKET, BY TYPE, 2018-2033 (USD THOUSAND)
TABLE 54 EUROPE SYNTHETIC BIOSTIMULANTS IN BIOSTIMULANTS MARKET, BY FORM, 2018-2033 (USD THOUSAND)
TABLE 55 EUROPE LIQUID IN BIOSTIMULANTS MARKET, BY TYPE, 2018-2033 (USD THOUSAND)
TABLE 56 EUROPE DRY IN BIOSTIMULANTS MARKET, BY TYPE, 2018-2033 (USD THOUSAND)
TABLE 57 EUROPE BIOSTIMULANTS MARKET, BY FORM, 2018-2033 (USD THOUSAND)
TABLE 58 EUROPE LIQUID IN BIOSTIMULANTS MARKET, BY TYPE, 2018-2033 (USD THOUSAND)
TABLE 59 EUROPE DRY IN BIOSTIMULANTS MARKET, BY TYPE, 2018-2033 (USD THOUSAND)
TABLE 60 EUROPE BIOSTIMULANTS MARKET, BY ACTIVE INGREDIENTS, 2018-2033 (USD THOUSAND)
TABLE 61 EUROPE ACID BASED IN BIOSTIMULANTS MARKET, BY TYPE, 2018-2033 (USD THOUSAND)
TABLE 62 EUROPE EXTRACT BASED IN BIOSTIMULANTS MARKET, BY TYPE, 2018-2033 (USD THOUSAND)
TABLE 63 EUROPE BIOSTIMULANTS MARKET, BY APPLICATION METHOD, 2018-2032 (USD THOUSAND)
TABLE 64 EUROPE BIOSTIMULANTS MARKET, BY CROP, 2018-2033 (USD THOUSAND)
TABLE 65 EUROPE FRUITS & VEGETABLES IN BIOSTIMULANTS MARKET, BY FRUITS, 2018-2033 (USD THOUSAND)
TABLE 66 EUROPE FRUITS & VEGETABLES IN BIOSTIMULANTS MARKET, BY VEGETABLE, 2018-2033 (USD THOUSAND)
TABLE 67 EUROPE CEREALS & GRAINS IN BIOSTIMULANTS MARKET, BY TYPE, 2018-2033 (USD THOUSAND)
TABLE 68 EUROPE OILSEEDS & PULSES IN BIOSTIMULANTS MARKET, BY TYPE, 2018-2033 (USD THOUSAND)
TABLE 69 EUROPE BIOSTIMULANTS MARKET, BY END USER, 2018-2033 (USD THOUSAND)
TABLE 70 SPAIN BIOSTIMULANTS MARKET, BY ORIGIN, 2018-2033 (USD THOUSAND)
TABLE 71 SPAIN BIOSTIMULANTS MARKET, BY ORIGIN, 2018-2033 (TONS)
TABLE 72 SPAIN NATURAL BIOSTIMULANTS IN BIOSTIMULANTS MARKET, BY FORM, 2018-2033 (USD THOUSAND)
TABLE 73 SPAIN LIQUID IN BIOSTIMULANTS MARKET, BY TYPE, 2018-2033 (USD THOUSAND)
TABLE 74 SPAIN DRY IN BIOSTIMULANTS MARKET, BY TYPE, 2018-2033 (USD THOUSAND)
TABLE 75 SPAIN SYNTHETIC BIOSTIMULANTS IN BIOSTIMULANTS MARKET, BY FORM, 2018-2033 (USD THOUSAND)
TABLE 76 SPAIN LIQUID IN BIOSTIMULANTS MARKET, BY TYPE, 2018-2033 (USD THOUSAND)
TABLE 77 SPAIN DRY IN BIOSTIMULANTS MARKET, BY TYPE, 2018-2033 (USD THOUSAND)
TABLE 78 SPAIN BIOSTIMULANTS MARKET, BY FORM, 2018-2033 (USD THOUSAND)
TABLE 79 SPAIN LIQUID IN BIOSTIMULANTS MARKET, BY TYPE, 2018-2033 (USD THOUSAND)
TABLE 80 SPAIN DRY IN BIOSTIMULANTS MARKET, BY TYPE, 2018-2033 (USD THOUSAND)
TABLE 81 SPAIN BIOSTIMULANTS MARKET, BY ACTIVE INGREDIENTS, 2018-2033 (USD THOUSAND)
TABLE 82 SPAIN ACID BASED IN BIOSTIMULANTS MARKET, BY TYPE, 2018-2033 (USD THOUSAND)
TABLE 83 SPAIN EXTRACT BASED IN BIOSTIMULANTS MARKET, BY TYPE, 2018-2033 (USD THOUSAND)
TABLE 84 SPAIN BIOSTIMULANTS MARKET, BY APPLICATION METHOD, 2018-2032 (USD THOUSAND)
TABLE 85 SPAIN BIOSTIMULANTS MARKET, BY CROP, 2018-2033 (USD THOUSAND)
TABLE 86 SPAIN FRUITS & VEGETABLES IN BIOSTIMULANTS MARKET, BY FRUITS, 2018-2033 (USD THOUSAND)
TABLE 87 SPAIN FRUITS & VEGETABLES IN BIOSTIMULANTS MARKET, BY VEGETABLE, 2018-2033 (USD THOUSAND)
TABLE 88 SPAIN CEREALS & GRAINS IN BIOSTIMULANTS MARKET, BY TYPE, 2018-2033 (USD THOUSAND)
TABLE 89 SPAIN OILSEEDS & PULSES IN BIOSTIMULANTS MARKET, BY TYPE, 2018-2033 (USD THOUSAND)
TABLE 90 SPAIN BIOSTIMULANTS MARKET, BY END USER, 2018-2033 (USD THOUSAND)
TABLE 91 ITALY BIOSTIMULANTS MARKET, BY ORIGIN, 2018-2033 (USD THOUSAND)
TABLE 92 ITALY BIOSTIMULANTS MARKET, BY ORIGIN, 2018-2033 (TONS)
TABLE 93 ITALY NATURAL BIOSTIMULANTS IN BIOSTIMULANTS MARKET, BY FORM, 2018-2033 (USD THOUSAND)
TABLE 94 ITALY LIQUID IN BIOSTIMULANTS MARKET, BY TYPE, 2018-2033 (USD THOUSAND)
TABLE 95 ITALY DRY IN BIOSTIMULANTS MARKET, BY TYPE, 2018-2033 (USD THOUSAND)
TABLE 96 ITALY SYNTHETIC BIOSTIMULANTS IN BIOSTIMULANTS MARKET, BY FORM, 2018-2033 (USD THOUSAND)
TABLE 97 ITALY LIQUID IN BIOSTIMULANTS MARKET, BY TYPE, 2018-2033 (USD THOUSAND)
TABLE 98 ITALY DRY IN BIOSTIMULANTS MARKET, BY TYPE, 2018-2033 (USD THOUSAND)
TABLE 99 ITALY BIOSTIMULANTS MARKET, BY FORM, 2018-2033 (USD THOUSAND)
TABLE 100 ITALY LIQUID IN BIOSTIMULANTS MARKET, BY TYPE, 2018-2033 (USD THOUSAND)
TABLE 101 ITALY DRY IN BIOSTIMULANTS MARKET, BY TYPE, 2018-2033 (USD THOUSAND)
TABLE 102 ITALY BIOSTIMULANTS MARKET, BY ACTIVE INGREDIENTS, 2018-2033 (USD THOUSAND)
TABLE 103 ITALY ACID BASED IN BIOSTIMULANTS MARKET, BY TYPE, 2018-2033 (USD THOUSAND)
TABLE 104 ITALY EXTRACT BASED IN BIOSTIMULANTS MARKET, BY TYPE, 2018-2033 (USD THOUSAND)
TABLE 105 ITALY BIOSTIMULANTS MARKET, BY APPLICATION METHOD, 2018-2032 (USD THOUSAND)
TABLE 106 ITALY BIOSTIMULANTS MARKET, BY CROP, 2018-2033 (USD THOUSAND)
TABLE 107 ITALY FRUITS & VEGETABLES IN BIOSTIMULANTS MARKET, BY FRUITS, 2018-2033 (USD THOUSAND)
TABLE 108 ITALY FRUITS & VEGETABLES IN BIOSTIMULANTS MARKET, BY VEGETABLE, 2018-2033 (USD THOUSAND)
TABLE 109 ITALY CEREALS & GRAINS IN BIOSTIMULANTS MARKET, BY TYPE, 2018-2033 (USD THOUSAND)
TABLE 110 ITALY OILSEEDS & PULSES IN BIOSTIMULANTS MARKET, BY TYPE, 2018-2033 (USD THOUSAND)
TABLE 111 ITALY BIOSTIMULANTS MARKET, BY END USER, 2018-2033 (USD THOUSAND)
TABLE 112 U.K. BIOSTIMULANTS MARKET, BY ORIGIN, 2018-2033 (USD THOUSAND)
TABLE 113 U.K. BIOSTIMULANTS MARKET, BY ORIGIN, 2018-2033 (TONS)
TABLE 114 U.K. NATURAL BIOSTIMULANTS IN BIOSTIMULANTS MARKET, BY FORM, 2018-2033 (USD THOUSAND)
TABLE 115 U.K. LIQUID IN BIOSTIMULANTS MARKET, BY TYPE, 2018-2033 (USD THOUSAND)
TABLE 116 U.K. DRY IN BIOSTIMULANTS MARKET, BY TYPE, 2018-2033 (USD THOUSAND)
TABLE 117 U.K. SYNTHETIC BIOSTIMULANTS IN BIOSTIMULANTS MARKET, BY FORM, 2018-2033 (USD THOUSAND)
TABLE 118 U.K. LIQUID IN BIOSTIMULANTS MARKET, BY TYPE, 2018-2033 (USD THOUSAND)
TABLE 119 U.K. DRY IN BIOSTIMULANTS MARKET, BY TYPE, 2018-2033 (USD THOUSAND)
TABLE 120 U.K. BIOSTIMULANTS MARKET, BY FORM, 2018-2033 (USD THOUSAND)
TABLE 121 U.K. LIQUID IN BIOSTIMULANTS MARKET, BY TYPE, 2018-2033 (USD THOUSAND)
TABLE 122 U.K. DRY IN BIOSTIMULANTS MARKET, BY TYPE, 2018-2033 (USD THOUSAND)
TABLE 123 U.K. BIOSTIMULANTS MARKET, BY ACTIVE INGREDIENTS, 2018-2033 (USD THOUSAND)
TABLE 124 U.K. ACID BASED IN BIOSTIMULANTS MARKET, BY TYPE, 2018-2033 (USD THOUSAND)
TABLE 125 U.K. EXTRACT BASED IN BIOSTIMULANTS MARKET, BY TYPE, 2018-2033 (USD THOUSAND)
TABLE 126 U.K. BIOSTIMULANTS MARKET, BY APPLICATION METHOD, 2018-2032 (USD THOUSAND)
TABLE 127 U.K. BIOSTIMULANTS MARKET, BY CROP, 2018-2033 (USD THOUSAND)
TABLE 128 U.K. FRUITS & VEGETABLES IN BIOSTIMULANTS MARKET, BY FRUITS, 2018-2033 (USD THOUSAND)
TABLE 129 U.K. FRUITS & VEGETABLES IN BIOSTIMULANTS MARKET, BY VEGETABLE, 2018-2033 (USD THOUSAND)
TABLE 130 U.K. CEREALS & GRAINS IN BIOSTIMULANTS MARKET, BY TYPE, 2018-2033 (USD THOUSAND)
TABLE 131 U.K. OILSEEDS & PULSES IN BIOSTIMULANTS MARKET, BY TYPE, 2018-2033 (USD THOUSAND)
TABLE 132 U.K. BIOSTIMULANTS MARKET, BY END USER, 2018-2033 (USD THOUSAND)
TABLE 133 FRANCE BIOSTIMULANTS MARKET, BY ORIGIN, 2018-2033 (USD THOUSAND)
TABLE 134 FRANCE BIOSTIMULANTS MARKET, BY ORIGIN, 2018-2033 (TONS)
TABLE 135 FRANCE NATURAL BIOSTIMULANTS IN BIOSTIMULANTS MARKET, BY FORM, 2018-2033 (USD THOUSAND)
TABLE 136 FRANCE LIQUID IN BIOSTIMULANTS MARKET, BY TYPE, 2018-2033 (USD THOUSAND)
TABLE 137 FRANCE DRY IN BIOSTIMULANTS MARKET, BY TYPE, 2018-2033 (USD THOUSAND)
TABLE 138 FRANCE SYNTHETIC BIOSTIMULANTS IN BIOSTIMULANTS MARKET, BY FORM, 2018-2033 (USD THOUSAND)
TABLE 139 FRANCE LIQUID IN BIOSTIMULANTS MARKET, BY TYPE, 2018-2033 (USD THOUSAND)
TABLE 140 FRANCE DRY IN BIOSTIMULANTS MARKET, BY TYPE, 2018-2033 (USD THOUSAND)
TABLE 141 FRANCE BIOSTIMULANTS MARKET, BY FORM, 2018-2033 (USD THOUSAND)
TABLE 142 FRANCE LIQUID IN BIOSTIMULANTS MARKET, BY TYPE, 2018-2033 (USD THOUSAND)
TABLE 143 FRANCE DRY IN BIOSTIMULANTS MARKET, BY TYPE, 2018-2033 (USD THOUSAND)
TABLE 144 FRANCE BIOSTIMULANTS MARKET, BY ACTIVE INGREDIENTS, 2018-2033 (USD THOUSAND)
TABLE 145 FRANCE ACID BASED IN BIOSTIMULANTS MARKET, BY TYPE, 2018-2033 (USD THOUSAND)
TABLE 146 FRANCE EXTRACT BASED IN BIOSTIMULANTS MARKET, BY TYPE, 2018-2033 (USD THOUSAND)
TABLE 147 FRANCE BIOSTIMULANTS MARKET, BY APPLICATION METHOD, 2018-2032 (USD THOUSAND)
TABLE 148 FRANCE BIOSTIMULANTS MARKET, BY CROP, 2018-2033 (USD THOUSAND)
TABLE 149 FRANCE FRUITS & VEGETABLES IN BIOSTIMULANTS MARKET, BY FRUITS, 2018-2033 (USD THOUSAND)
TABLE 150 FRANCE FRUITS & VEGETABLES IN BIOSTIMULANTS MARKET, BY VEGETABLE, 2018-2033 (USD THOUSAND)
TABLE 151 FRANCE CEREALS & GRAINS IN BIOSTIMULANTS MARKET, BY TYPE, 2018-2033 (USD THOUSAND)
TABLE 152 FRANCE OILSEEDS & PULSES IN BIOSTIMULANTS MARKET, BY TYPE, 2018-2033 (USD THOUSAND)
TABLE 153 FRANCE BIOSTIMULANTS MARKET, BY END USER, 2018-2033 (USD THOUSAND)
TABLE 154 GERMANY BIOSTIMULANTS MARKET, BY ORIGIN, 2018-2033 (USD THOUSAND)
TABLE 155 GERMANY BIOSTIMULANTS MARKET, BY ORIGIN, 2018-2033 (TONS)
TABLE 156 GERMANY NATURAL BIOSTIMULANTS IN BIOSTIMULANTS MARKET, BY FORM, 2018-2033 (USD THOUSAND)
TABLE 157 GERMANY LIQUID IN BIOSTIMULANTS MARKET, BY TYPE, 2018-2033 (USD THOUSAND)
TABLE 158 GERMANY DRY IN BIOSTIMULANTS MARKET, BY TYPE, 2018-2033 (USD THOUSAND)
TABLE 159 GERMANY SYNTHETIC BIOSTIMULANTS IN BIOSTIMULANTS MARKET, BY FORM, 2018-2033 (USD THOUSAND)
TABLE 160 GERMANY LIQUID IN BIOSTIMULANTS MARKET, BY TYPE, 2018-2033 (USD THOUSAND)
TABLE 161 GERMANY DRY IN BIOSTIMULANTS MARKET, BY TYPE, 2018-2033 (USD THOUSAND)
TABLE 162 GERMANY BIOSTIMULANTS MARKET, BY FORM, 2018-2033 (USD THOUSAND)
TABLE 163 GERMANY LIQUID IN BIOSTIMULANTS MARKET, BY TYPE, 2018-2033 (USD THOUSAND)
TABLE 164 GERMANY DRY IN BIOSTIMULANTS MARKET, BY TYPE, 2018-2033 (USD THOUSAND)
TABLE 165 GERMANY BIOSTIMULANTS MARKET, BY ACTIVE INGREDIENTS, 2018-2033 (USD THOUSAND)
TABLE 166 GERMANY ACID BASED IN BIOSTIMULANTS MARKET, BY TYPE, 2018-2033 (USD THOUSAND)
TABLE 167 GERMANY EXTRACT BASED IN BIOSTIMULANTS MARKET, BY TYPE, 2018-2033 (USD THOUSAND)
TABLE 168 GERMANY BIOSTIMULANTS MARKET, BY APPLICATION METHOD, 2018-2032 (USD THOUSAND)
TABLE 169 GERMANY BIOSTIMULANTS MARKET, BY CROP, 2018-2033 (USD THOUSAND)
TABLE 170 GERMANY FRUITS & VEGETABLES IN BIOSTIMULANTS MARKET, BY FRUITS, 2018-2033 (USD THOUSAND)
TABLE 171 GERMANY FRUITS & VEGETABLES IN BIOSTIMULANTS MARKET, BY VEGETABLE, 2018-2033 (USD THOUSAND)
TABLE 172 GERMANY CEREALS & GRAINS IN BIOSTIMULANTS MARKET, BY TYPE, 2018-2033 (USD THOUSAND)
TABLE 173 GERMANY OILSEEDS & PULSES IN BIOSTIMULANTS MARKET, BY TYPE, 2018-2033 (USD THOUSAND)
TABLE 174 GERMANY BIOSTIMULANTS MARKET, BY END USER, 2018-2033 (USD THOUSAND)
TABLE 175 NETHERLANDS BIOSTIMULANTS MARKET, BY ORIGIN, 2018-2033 (USD THOUSAND)
TABLE 176 NETHERLANDS BIOSTIMULANTS MARKET, BY ORIGIN, 2018-2033 (TONS)
TABLE 177 NETHERLANDS NATURAL BIOSTIMULANTS IN BIOSTIMULANTS MARKET, BY FORM, 2018-2033 (USD THOUSAND)
TABLE 178 NETHERLANDS LIQUID IN BIOSTIMULANTS MARKET, BY TYPE, 2018-2033 (USD THOUSAND)
TABLE 179 NETHERLANDS DRY IN BIOSTIMULANTS MARKET, BY TYPE, 2018-2033 (USD THOUSAND)
TABLE 180 NETHERLANDS SYNTHETIC BIOSTIMULANTS IN BIOSTIMULANTS MARKET, BY FORM, 2018-2033 (USD THOUSAND)
TABLE 181 NETHERLANDS LIQUID IN BIOSTIMULANTS MARKET, BY TYPE, 2018-2033 (USD THOUSAND)
TABLE 182 NETHERLANDS DRY IN BIOSTIMULANTS MARKET, BY TYPE, 2018-2033 (USD THOUSAND)
TABLE 183 NETHERLANDS BIOSTIMULANTS MARKET, BY FORM, 2018-2033 (USD THOUSAND)
TABLE 184 NETHERLANDS LIQUID IN BIOSTIMULANTS MARKET, BY TYPE, 2018-2033 (USD THOUSAND)
TABLE 185 NETHERLANDS DRY IN BIOSTIMULANTS MARKET, BY TYPE, 2018-2033 (USD THOUSAND)
TABLE 186 NETHERLANDS BIOSTIMULANTS MARKET, BY ACTIVE INGREDIENTS, 2018-2033 (USD THOUSAND)
TABLE 187 NETHERLANDS ACID BASED IN BIOSTIMULANTS MARKET, BY TYPE, 2018-2033 (USD THOUSAND)
TABLE 188 NETHERLANDS EXTRACT BASED IN BIOSTIMULANTS MARKET, BY TYPE, 2018-2033 (USD THOUSAND)
TABLE 189 NETHERLANDS BIOSTIMULANTS MARKET, BY APPLICATION METHOD, 2018-2032 (USD THOUSAND)
TABLE 190 NETHERLANDS BIOSTIMULANTS MARKET, BY CROP, 2018-2033 (USD THOUSAND)
TABLE 191 NETHERLANDS FRUITS & VEGETABLES IN BIOSTIMULANTS MARKET, BY FRUITS, 2018-2033 (USD THOUSAND)
TABLE 192 NETHERLANDS FRUITS & VEGETABLES IN BIOSTIMULANTS MARKET, BY VEGETABLE, 2018-2033 (USD THOUSAND)
TABLE 193 NETHERLANDS CEREALS & GRAINS IN BIOSTIMULANTS MARKET, BY TYPE, 2018-2033 (USD THOUSAND)
TABLE 194 NETHERLANDS OILSEEDS & PULSES IN BIOSTIMULANTS MARKET, BY TYPE, 2018-2033 (USD THOUSAND)
TABLE 195 NETHERLANDS BIOSTIMULANTS MARKET, BY END USER, 2018-2033 (USD THOUSAND)
TABLE 196 SWITZERLAND BIOSTIMULANTS MARKET, BY ORIGIN, 2018-2033 (USD THOUSAND)
TABLE 197 SWITZERLAND BIOSTIMULANTS MARKET, BY ORIGIN, 2018-2033 (TONS)
TABLE 198 SWITZERLAND NATURAL BIOSTIMULANTS IN BIOSTIMULANTS MARKET, BY FORM, 2018-2033 (USD THOUSAND)
TABLE 199 SWITZERLAND LIQUID IN BIOSTIMULANTS MARKET, BY TYPE, 2018-2033 (USD THOUSAND)
TABLE 200 SWITZERLAND DRY IN BIOSTIMULANTS MARKET, BY TYPE, 2018-2033 (USD THOUSAND)
TABLE 201 SWITZERLAND SYNTHETIC BIOSTIMULANTS IN BIOSTIMULANTS MARKET, BY FORM, 2018-2033 (USD THOUSAND)
TABLE 202 SWITZERLAND LIQUID IN BIOSTIMULANTS MARKET, BY TYPE, 2018-2033 (USD THOUSAND)
TABLE 203 SWITZERLAND DRY IN BIOSTIMULANTS MARKET, BY TYPE, 2018-2033 (USD THOUSAND)
TABLE 204 SWITZERLAND BIOSTIMULANTS MARKET, BY FORM, 2018-2033 (USD THOUSAND)
TABLE 205 SWITZERLAND LIQUID IN BIOSTIMULANTS MARKET, BY TYPE, 2018-2033 (USD THOUSAND)
TABLE 206 SWITZERLAND DRY IN BIOSTIMULANTS MARKET, BY TYPE, 2018-2033 (USD THOUSAND)
TABLE 207 SWITZERLAND BIOSTIMULANTS MARKET, BY ACTIVE INGREDIENTS, 2018-2033 (USD THOUSAND)
TABLE 208 SWITZERLAND ACID BASED IN BIOSTIMULANTS MARKET, BY TYPE, 2018-2033 (USD THOUSAND)
TABLE 209 SWITZERLAND EXTRACT BASED IN BIOSTIMULANTS MARKET, BY TYPE, 2018-2033 (USD THOUSAND)
TABLE 210 SWITZERLAND BIOSTIMULANTS MARKET, BY APPLICATION METHOD, 2018-2032 (USD THOUSAND)
TABLE 211 SWITZERLAND BIOSTIMULANTS MARKET, BY CROP, 2018-2033 (USD THOUSAND)
TABLE 212 SWITZERLAND FRUITS & VEGETABLES IN BIOSTIMULANTS MARKET, BY FRUITS, 2018-2033 (USD THOUSAND)
TABLE 213 SWITZERLAND FRUITS & VEGETABLES IN BIOSTIMULANTS MARKET, BY VEGETABLE, 2018-2033 (USD THOUSAND)
TABLE 214 SWITZERLAND CEREALS & GRAINS IN BIOSTIMULANTS MARKET, BY TYPE, 2018-2033 (USD THOUSAND)
TABLE 215 SWITZERLAND OILSEEDS & PULSES IN BIOSTIMULANTS MARKET, BY TYPE, 2018-2033 (USD THOUSAND)
TABLE 216 SWITZERLAND BIOSTIMULANTS MARKET, BY END USER, 2018-2033 (USD THOUSAND)
TABLE 217 RUSSIA BIOSTIMULANTS MARKET, BY ORIGIN, 2018-2033 (USD THOUSAND)
TABLE 218 RUSSIA BIOSTIMULANTS MARKET, BY ORIGIN, 2018-2033 (TONS)
TABLE 219 RUSSIA NATURAL BIOSTIMULANTS IN BIOSTIMULANTS MARKET, BY FORM, 2018-2033 (USD THOUSAND)
TABLE 220 RUSSIA LIQUID IN BIOSTIMULANTS MARKET, BY TYPE, 2018-2033 (USD THOUSAND)
TABLE 221 RUSSIA DRY IN BIOSTIMULANTS MARKET, BY TYPE, 2018-2033 (USD THOUSAND)
TABLE 222 RUSSIA SYNTHETIC BIOSTIMULANTS IN BIOSTIMULANTS MARKET, BY FORM, 2018-2033 (USD THOUSAND)
TABLE 223 RUSSIA LIQUID IN BIOSTIMULANTS MARKET, BY TYPE, 2018-2033 (USD THOUSAND)
TABLE 224 RUSSIA DRY IN BIOSTIMULANTS MARKET, BY TYPE, 2018-2033 (USD THOUSAND)
TABLE 225 RUSSIA BIOSTIMULANTS MARKET, BY FORM, 2018-2033 (USD THOUSAND)
TABLE 226 RUSSIA LIQUID IN BIOSTIMULANTS MARKET, BY TYPE, 2018-2033 (USD THOUSAND)
TABLE 227 RUSSIA DRY IN BIOSTIMULANTS MARKET, BY TYPE, 2018-2033 (USD THOUSAND)
TABLE 228 RUSSIA BIOSTIMULANTS MARKET, BY ACTIVE INGREDIENTS, 2018-2033 (USD THOUSAND)
TABLE 229 RUSSIA ACID BASED IN BIOSTIMULANTS MARKET, BY TYPE, 2018-2033 (USD THOUSAND)
TABLE 230 RUSSIA EXTRACT BASED IN BIOSTIMULANTS MARKET, BY TYPE, 2018-2033 (USD THOUSAND)
TABLE 231 RUSSIA BIOSTIMULANTS MARKET, BY APPLICATION METHOD, 2018-2032 (USD THOUSAND)
TABLE 232 RUSSIA BIOSTIMULANTS MARKET, BY CROP, 2018-2033 (USD THOUSAND)
TABLE 233 RUSSIA FRUITS & VEGETABLES IN BIOSTIMULANTS MARKET, BY FRUITS, 2018-2033 (USD THOUSAND)
TABLE 234 RUSSIA FRUITS & VEGETABLES IN BIOSTIMULANTS MARKET, BY VEGETABLE, 2018-2033 (USD THOUSAND)
TABLE 235 RUSSIA CEREALS & GRAINS IN BIOSTIMULANTS MARKET, BY TYPE, 2018-2033 (USD THOUSAND)
TABLE 236 RUSSIA OILSEEDS & PULSES IN BIOSTIMULANTS MARKET, BY TYPE, 2018-2033 (USD THOUSAND)
TABLE 237 RUSSIA BIOSTIMULANTS MARKET, BY END USER, 2018-2033 (USD THOUSAND)
TABLE 238 BELGIUM BIOSTIMULANTS MARKET, BY ORIGIN, 2018-2033 (USD THOUSAND)
TABLE 239 BELGIUM BIOSTIMULANTS MARKET, BY ORIGIN, 2018-2033 (TONS)
TABLE 240 BELGIUM NATURAL BIOSTIMULANTS IN BIOSTIMULANTS MARKET, BY FORM, 2018-2033 (USD THOUSAND)
TABLE 241 BELGIUM LIQUID IN BIOSTIMULANTS MARKET, BY TYPE, 2018-2033 (USD THOUSAND)
TABLE 242 BELGIUM DRY IN BIOSTIMULANTS MARKET, BY TYPE, 2018-2033 (USD THOUSAND)
TABLE 243 BELGIUM SYNTHETIC BIOSTIMULANTS IN BIOSTIMULANTS MARKET, BY FORM, 2018-2033 (USD THOUSAND)
TABLE 244 BELGIUM LIQUID IN BIOSTIMULANTS MARKET, BY TYPE, 2018-2033 (USD THOUSAND)
TABLE 245 BELGIUM DRY IN BIOSTIMULANTS MARKET, BY TYPE, 2018-2033 (USD THOUSAND)
TABLE 246 BELGIUM BIOSTIMULANTS MARKET, BY FORM, 2018-2033 (USD THOUSAND)
TABLE 247 BELGIUM LIQUID IN BIOSTIMULANTS MARKET, BY TYPE, 2018-2033 (USD THOUSAND)
TABLE 248 BELGIUM DRY IN BIOSTIMULANTS MARKET, BY TYPE, 2018-2033 (USD THOUSAND)
TABLE 249 BELGIUM BIOSTIMULANTS MARKET, BY ACTIVE INGREDIENTS, 2018-2033 (USD THOUSAND)
TABLE 250 BELGIUM ACID BASED IN BIOSTIMULANTS MARKET, BY TYPE, 2018-2033 (USD THOUSAND)
TABLE 251 BELGIUM EXTRACT BASED IN BIOSTIMULANTS MARKET, BY TYPE, 2018-2033 (USD THOUSAND)
TABLE 252 BELGIUM BIOSTIMULANTS MARKET, BY APPLICATION METHOD, 2018-2032 (USD THOUSAND)
TABLE 253 BELGIUM BIOSTIMULANTS MARKET, BY CROP, 2018-2033 (USD THOUSAND)
TABLE 254 BELGIUM FRUITS & VEGETABLES IN BIOSTIMULANTS MARKET, BY FRUITS, 2018-2033 (USD THOUSAND)
TABLE 255 BELGIUM FRUITS & VEGETABLES IN BIOSTIMULANTS MARKET, BY VEGETABLE, 2018-2033 (USD THOUSAND)
TABLE 256 BELGIUM CEREALS & GRAINS IN BIOSTIMULANTS MARKET, BY TYPE, 2018-2033 (USD THOUSAND)
TABLE 257 BELGIUM OILSEEDS & PULSES IN BIOSTIMULANTS MARKET, BY TYPE, 2018-2033 (USD THOUSAND)
TABLE 258 BELGIUM BIOSTIMULANTS MARKET, BY END USER, 2018-2033 (USD THOUSAND)
TABLE 259 TURKEY BIOSTIMULANTS MARKET, BY ORIGIN, 2018-2033 (USD THOUSAND)
TABLE 260 TURKEY BIOSTIMULANTS MARKET, BY ORIGIN, 2018-2033 (TONS)
TABLE 261 TURKEY NATURAL BIOSTIMULANTS IN BIOSTIMULANTS MARKET, BY FORM, 2018-2033 (USD THOUSAND)
TABLE 262 TURKEY LIQUID IN BIOSTIMULANTS MARKET, BY TYPE, 2018-2033 (USD THOUSAND)
TABLE 263 TURKEY DRY IN BIOSTIMULANTS MARKET, BY TYPE, 2018-2033 (USD THOUSAND)
TABLE 264 TURKEY SYNTHETIC BIOSTIMULANTS IN BIOSTIMULANTS MARKET, BY FORM, 2018-2033 (USD THOUSAND)
TABLE 265 TURKEY LIQUID IN BIOSTIMULANTS MARKET, BY TYPE, 2018-2033 (USD THOUSAND)
TABLE 266 TURKEY DRY IN BIOSTIMULANTS MARKET, BY TYPE, 2018-2033 (USD THOUSAND)
TABLE 267 TURKEY BIOSTIMULANTS MARKET, BY FORM, 2018-2033 (USD THOUSAND)
TABLE 268 TURKEY LIQUID IN BIOSTIMULANTS MARKET, BY TYPE, 2018-2033 (USD THOUSAND)
TABLE 269 TURKEY DRY IN BIOSTIMULANTS MARKET, BY TYPE, 2018-2033 (USD THOUSAND)
TABLE 270 TURKEY BIOSTIMULANTS MARKET, BY ACTIVE INGREDIENTS, 2018-2033 (USD THOUSAND)
TABLE 271 TURKEY ACID BASED IN BIOSTIMULANTS MARKET, BY TYPE, 2018-2033 (USD THOUSAND)
TABLE 272 TURKEY EXTRACT BASED IN BIOSTIMULANTS MARKET, BY TYPE, 2018-2033 (USD THOUSAND)
TABLE 273 TURKEY BIOSTIMULANTS MARKET, BY APPLICATION METHOD, 2018-2032 (USD THOUSAND)
TABLE 274 TURKEY BIOSTIMULANTS MARKET, BY CROP, 2018-2033 (USD THOUSAND)
TABLE 275 TURKEY FRUITS & VEGETABLES IN BIOSTIMULANTS MARKET, BY FRUITS, 2018-2033 (USD THOUSAND)
TABLE 276 TURKEY FRUITS & VEGETABLES IN BIOSTIMULANTS MARKET, BY VEGETABLE, 2018-2033 (USD THOUSAND)
TABLE 277 TURKEY CEREALS & GRAINS IN BIOSTIMULANTS MARKET, BY TYPE, 2018-2033 (USD THOUSAND)
TABLE 278 TURKEY OILSEEDS & PULSES IN BIOSTIMULANTS MARKET, BY TYPE, 2018-2033 (USD THOUSAND)
TABLE 279 TURKEY BIOSTIMULANTS MARKET, BY END USER, 2018-2033 (USD THOUSAND)
TABLE 280 POLAND BIOSTIMULANTS MARKET, BY ORIGIN, 2018-2033 (USD THOUSAND)
TABLE 281 POLAND BIOSTIMULANTS MARKET, BY ORIGIN, 2018-2033 (TONS)
TABLE 282 POLAND NATURAL BIOSTIMULANTS IN BIOSTIMULANTS MARKET, BY FORM, 2018-2033 (USD THOUSAND)
TABLE 283 POLAND LIQUID IN BIOSTIMULANTS MARKET, BY TYPE, 2018-2033 (USD THOUSAND)
TABLE 284 POLAND DRY IN BIOSTIMULANTS MARKET, BY TYPE, 2018-2033 (USD THOUSAND)
TABLE 285 POLAND SYNTHETIC BIOSTIMULANTS IN BIOSTIMULANTS MARKET, BY FORM, 2018-2033 (USD THOUSAND)
TABLE 286 POLAND LIQUID IN BIOSTIMULANTS MARKET, BY TYPE, 2018-2033 (USD THOUSAND)
TABLE 287 POLAND DRY IN BIOSTIMULANTS MARKET, BY TYPE, 2018-2033 (USD THOUSAND)
TABLE 288 POLAND BIOSTIMULANTS MARKET, BY FORM, 2018-2033 (USD THOUSAND)
TABLE 289 POLAND LIQUID IN BIOSTIMULANTS MARKET, BY TYPE, 2018-2033 (USD THOUSAND)
TABLE 290 POLAND DRY IN BIOSTIMULANTS MARKET, BY TYPE, 2018-2033 (USD THOUSAND)
TABLE 291 POLAND BIOSTIMULANTS MARKET, BY ACTIVE INGREDIENTS, 2018-2033 (USD THOUSAND)
TABLE 292 POLAND ACID BASED IN BIOSTIMULANTS MARKET, BY TYPE, 2018-2033 (USD THOUSAND)
TABLE 293 POLAND EXTRACT BASED IN BIOSTIMULANTS MARKET, BY TYPE, 2018-2033 (USD THOUSAND)
TABLE 294 POLAND BIOSTIMULANTS MARKET, BY APPLICATION METHOD, 2018-2032 (USD THOUSAND)
TABLE 295 POLAND BIOSTIMULANTS MARKET, BY CROP, 2018-2033 (USD THOUSAND)
TABLE 296 POLAND FRUITS & VEGETABLES IN BIOSTIMULANTS MARKET, BY FRUITS, 2018-2033 (USD THOUSAND)
TABLE 297 POLAND FRUITS & VEGETABLES IN BIOSTIMULANTS MARKET, BY VEGETABLE, 2018-2033 (USD THOUSAND)
TABLE 298 POLAND CEREALS & GRAINS IN BIOSTIMULANTS MARKET, BY TYPE, 2018-2033 (USD THOUSAND)
TABLE 299 POLAND OILSEEDS & PULSES IN BIOSTIMULANTS MARKET, BY TYPE, 2018-2033 (USD THOUSAND)
TABLE 300 POLAND BIOSTIMULANTS MARKET, BY END USER, 2018-2033 (USD THOUSAND)
TABLE 301 DENMARK BIOSTIMULANTS MARKET, BY ORIGIN, 2018-2033 (USD THOUSAND)
TABLE 302 DENMARK BIOSTIMULANTS MARKET, BY ORIGIN, 2018-2033 (TONS)
TABLE 303 DENMARK NATURAL BIOSTIMULANTS IN BIOSTIMULANTS MARKET, BY FORM, 2018-2033 (USD THOUSAND)
TABLE 304 DENMARK LIQUID IN BIOSTIMULANTS MARKET, BY TYPE, 2018-2033 (USD THOUSAND)
TABLE 305 DENMARK DRY IN BIOSTIMULANTS MARKET, BY TYPE, 2018-2033 (USD THOUSAND)
TABLE 306 DENMARK SYNTHETIC BIOSTIMULANTS IN BIOSTIMULANTS MARKET, BY FORM, 2018-2033 (USD THOUSAND)
TABLE 307 DENMARK LIQUID IN BIOSTIMULANTS MARKET, BY TYPE, 2018-2033 (USD THOUSAND)
TABLE 308 DENMARK DRY IN BIOSTIMULANTS MARKET, BY TYPE, 2018-2033 (USD THOUSAND)
TABLE 309 DENMARK BIOSTIMULANTS MARKET, BY FORM, 2018-2033 (USD THOUSAND)
TABLE 310 DENMARK LIQUID IN BIOSTIMULANTS MARKET, BY TYPE, 2018-2033 (USD THOUSAND)
TABLE 311 DENMARK DRY IN BIOSTIMULANTS MARKET, BY TYPE, 2018-2033 (USD THOUSAND)
TABLE 312 DENMARK BIOSTIMULANTS MARKET, BY ACTIVE INGREDIENTS, 2018-2033 (USD THOUSAND)
TABLE 313 DENMARK ACID BASED IN BIOSTIMULANTS MARKET, BY TYPE, 2018-2033 (USD THOUSAND)
TABLE 314 DENMARK EXTRACT BASED IN BIOSTIMULANTS MARKET, BY TYPE, 2018-2033 (USD THOUSAND)
TABLE 315 DENMARK BIOSTIMULANTS MARKET, BY APPLICATION METHOD, 2018-2032 (USD THOUSAND)
TABLE 316 DENMARK BIOSTIMULANTS MARKET, BY CROP, 2018-2033 (USD THOUSAND)
TABLE 317 DENMARK FRUITS & VEGETABLES IN BIOSTIMULANTS MARKET, BY FRUITS, 2018-2033 (USD THOUSAND)
TABLE 318 DENMARK FRUITS & VEGETABLES IN BIOSTIMULANTS MARKET, BY VEGETABLE, 2018-2033 (USD THOUSAND)
TABLE 319 DENMARK CEREALS & GRAINS IN BIOSTIMULANTS MARKET, BY TYPE, 2018-2033 (USD THOUSAND)
TABLE 320 DENMARK OILSEEDS & PULSES IN BIOSTIMULANTS MARKET, BY TYPE, 2018-2033 (USD THOUSAND)
TABLE 321 DENMARK BIOSTIMULANTS MARKET, BY END USER, 2018-2033 (USD THOUSAND)
TABLE 322 SWEDEN BIOSTIMULANTS MARKET, BY ORIGIN, 2018-2033 (USD THOUSAND)
TABLE 323 SWEDEN BIOSTIMULANTS MARKET, BY ORIGIN, 2018-2033 (TONS)
TABLE 324 SWEDEN NATURAL BIOSTIMULANTS IN BIOSTIMULANTS MARKET, BY FORM, 2018-2033 (USD THOUSAND)
TABLE 325 SWEDEN LIQUID IN BIOSTIMULANTS MARKET, BY TYPE, 2018-2033 (USD THOUSAND)
TABLE 326 SWEDEN DRY IN BIOSTIMULANTS MARKET, BY TYPE, 2018-2033 (USD THOUSAND)
TABLE 327 SWEDEN SYNTHETIC BIOSTIMULANTS IN BIOSTIMULANTS MARKET, BY FORM, 2018-2033 (USD THOUSAND)
TABLE 328 SWEDEN LIQUID IN BIOSTIMULANTS MARKET, BY TYPE, 2018-2033 (USD THOUSAND)
TABLE 329 SWEDEN DRY IN BIOSTIMULANTS MARKET, BY TYPE, 2018-2033 (USD THOUSAND)
TABLE 330 SWEDEN BIOSTIMULANTS MARKET, BY FORM, 2018-2033 (USD THOUSAND)
TABLE 331 SWEDEN LIQUID IN BIOSTIMULANTS MARKET, BY TYPE, 2018-2033 (USD THOUSAND)
TABLE 332 SWEDEN DRY IN BIOSTIMULANTS MARKET, BY TYPE, 2018-2033 (USD THOUSAND)
TABLE 333 SWEDEN BIOSTIMULANTS MARKET, BY ACTIVE INGREDIENTS, 2018-2033 (USD THOUSAND)
TABLE 334 SWEDEN ACID BASED IN BIOSTIMULANTS MARKET, BY TYPE, 2018-2033 (USD THOUSAND)
TABLE 335 SWEDEN EXTRACT BASED IN BIOSTIMULANTS MARKET, BY TYPE, 2018-2033 (USD THOUSAND)
TABLE 336 SWEDEN BIOSTIMULANTS MARKET, BY APPLICATION METHOD, 2018-2032 (USD THOUSAND)
TABLE 337 SWEDEN BIOSTIMULANTS MARKET, BY CROP, 2018-2033 (USD THOUSAND)
TABLE 338 SWEDEN FRUITS & VEGETABLES IN BIOSTIMULANTS MARKET, BY FRUITS, 2018-2033 (USD THOUSAND)
TABLE 339 SWEDEN FRUITS & VEGETABLES IN BIOSTIMULANTS MARKET, BY VEGETABLE, 2018-2033 (USD THOUSAND)
TABLE 340 SWEDEN CEREALS & GRAINS IN BIOSTIMULANTS MARKET, BY TYPE, 2018-2033 (USD THOUSAND)
TABLE 341 SWEDEN OILSEEDS & PULSES IN BIOSTIMULANTS MARKET, BY TYPE, 2018-2033 (USD THOUSAND)
TABLE 342 SWEDEN BIOSTIMULANTS MARKET, BY END USER, 2018-2033 (USD THOUSAND)
TABLE 343 NORWAY BIOSTIMULANTS MARKET, BY ORIGIN, 2018-2033 (USD THOUSAND)
TABLE 344 NORWAY BIOSTIMULANTS MARKET, BY ORIGIN, 2018-2033 (TONS)
TABLE 345 NORWAY NATURAL BIOSTIMULANTS IN BIOSTIMULANTS MARKET, BY FORM, 2018-2033 (USD THOUSAND)
TABLE 346 NORWAY LIQUID IN BIOSTIMULANTS MARKET, BY TYPE, 2018-2033 (USD THOUSAND)
TABLE 347 NORWAY DRY IN BIOSTIMULANTS MARKET, BY TYPE, 2018-2033 (USD THOUSAND)
TABLE 348 NORWAY SYNTHETIC BIOSTIMULANTS IN BIOSTIMULANTS MARKET, BY FORM, 2018-2033 (USD THOUSAND)
TABLE 349 NORWAY LIQUID IN BIOSTIMULANTS MARKET, BY TYPE, 2018-2033 (USD THOUSAND)
TABLE 350 NORWAY DRY IN BIOSTIMULANTS MARKET, BY TYPE, 2018-2033 (USD THOUSAND)
TABLE 351 NORWAY BIOSTIMULANTS MARKET, BY FORM, 2018-2033 (USD THOUSAND)
TABLE 352 NORWAY LIQUID IN BIOSTIMULANTS MARKET, BY TYPE, 2018-2033 (USD THOUSAND)
TABLE 353 NORWAY DRY IN BIOSTIMULANTS MARKET, BY TYPE, 2018-2033 (USD THOUSAND)
TABLE 354 NORWAY BIOSTIMULANTS MARKET, BY ACTIVE INGREDIENTS, 2018-2033 (USD THOUSAND)
TABLE 355 NORWAY ACID BASED IN BIOSTIMULANTS MARKET, BY TYPE, 2018-2033 (USD THOUSAND)
TABLE 356 NORWAY EXTRACT BASED IN BIOSTIMULANTS MARKET, BY TYPE, 2018-2033 (USD THOUSAND)
TABLE 357 NORWAY BIOSTIMULANTS MARKET, BY APPLICATION METHOD, 2018-2032 (USD THOUSAND)
TABLE 358 NORWAY BIOSTIMULANTS MARKET, BY CROP, 2018-2033 (USD THOUSAND)
TABLE 359 NORWAY FRUITS & VEGETABLES IN BIOSTIMULANTS MARKET, BY FRUITS, 2018-2033 (USD THOUSAND)
TABLE 360 NORWAY FRUITS & VEGETABLES IN BIOSTIMULANTS MARKET, BY VEGETABLE, 2018-2033 (USD THOUSAND)
TABLE 361 NORWAY CEREALS & GRAINS IN BIOSTIMULANTS MARKET, BY TYPE, 2018-2033 (USD THOUSAND)
TABLE 362 NORWAY OILSEEDS & PULSES IN BIOSTIMULANTS MARKET, BY TYPE, 2018-2033 (USD THOUSAND)
TABLE 363 NORWAY BIOSTIMULANTS MARKET, BY END USER, 2018-2033 (USD THOUSAND)
TABLE 364 REST OF EUROPE BIOSTIMULANTS MARKET, BY ORIGIN, 2018-2033 (USD THOUSAND)
TABLE 365 REST OF EUROPE BIOSTIMULANTS MARKET, BY ORIGIN, 2018-2033 (TONS)
TABLE 366 REST OF EUROPE NATURAL BIOSTIMULANTS IN BIOSTIMULANTS MARKET, BY FORM, 2018-2033 (USD THOUSAND)
TABLE 367 REST OF EUROPE LIQUID IN BIOSTIMULANTS MARKET, BY TYPE, 2018-2033 (USD THOUSAND)
TABLE 368 REST OF EUROPE DRY IN BIOSTIMULANTS MARKET, BY TYPE, 2018-2033 (USD THOUSAND)
TABLE 369 REST OF EUROPE SYNTHETIC BIOSTIMULANTS IN BIOSTIMULANTS MARKET, BY FORM, 2018-2033 (USD THOUSAND)
TABLE 370 REST OF EUROPE LIQUID IN BIOSTIMULANTS MARKET, BY TYPE, 2018-2033 (USD THOUSAND)
TABLE 371 REST OF EUROPE DRY IN BIOSTIMULANTS MARKET, BY TYPE, 2018-2033 (USD THOUSAND)
TABLE 372 REST OF EUROPE BIOSTIMULANTS MARKET, BY FORM, 2018-2033 (USD THOUSAND)
TABLE 373 REST OF EUROPE LIQUID IN BIOSTIMULANTS MARKET, BY TYPE, 2018-2033 (USD THOUSAND)
TABLE 374 REST OF EUROPE DRY IN BIOSTIMULANTS MARKET, BY TYPE, 2018-2033 (USD THOUSAND)
TABLE 375 REST OF EUROPE BIOSTIMULANTS MARKET, BY ACTIVE INGREDIENTS, 2018-2033 (USD THOUSAND)
TABLE 376 REST OF EUROPE ACID BASED IN BIOSTIMULANTS MARKET, BY TYPE, 2018-2033 (USD THOUSAND)
TABLE 377 REST OF EUROPE EXTRACT BASED IN BIOSTIMULANTS MARKET, BY TYPE, 2018-2033 (USD THOUSAND)
TABLE 378 REST OF EUROPE BIOSTIMULANTS MARKET, BY APPLICATION METHOD, 2018-2032 (USD THOUSAND)
TABLE 379 REST OF EUROPE BIOSTIMULANTS MARKET, BY CROP, 2018-2033 (USD THOUSAND)
TABLE 380 REST OF EUROPE FRUITS & VEGETABLES IN BIOSTIMULANTS MARKET, BY FRUITS, 2018-2033 (USD THOUSAND)
TABLE 381 REST OF EUROPE FRUITS & VEGETABLES IN BIOSTIMULANTS MARKET, BY VEGETABLE, 2018-2033 (USD THOUSAND)
TABLE 382 REST OF EUROPE CEREALS & GRAINS IN BIOSTIMULANTS MARKET, BY TYPE, 2018-2033 (USD THOUSAND)
TABLE 383 REST OF EUROPE OILSEEDS & PULSES IN BIOSTIMULANTS MARKET, BY TYPE, 2018-2033 (USD THOUSAND)
TABLE 384 REST OF EUROPE BIOSTIMULANTS MARKET, BY END USER, 2018-2033 (USD THOUSAND)
图片列表
FIGURE 1 EUROPE BIOSTIMULANTS MARKET: SEGMENTATION
FIGURE 2 EUROPE BIOSTIMULANTS MARKET: DATA TRIANGULATION
FIGURE 3 EUROPE BIOSTIMULANTS MARKET: DROC ANALYSIS
FIGURE 4 EUROPE BIOSTIMULANTS MARKET: EUROPE VS REGIONAL MARKET ANALYSIS
FIGURE 5 EUROPE BIOSTIMULANTS MARKET: COMPANY RESEARCH ANALYSIS
FIGURE 6 EUROPE BIOSTIMULANTS MARKET: INTERVIEW DEMOGRAPHICS
FIGURE 7 EUROPE BIOSTIMULANTS MARKET: DBMR MARKET POSITION GRID
FIGURE 8 EUROPE BIOSTIMULANTS MARKET: VENDOR SHARE ANALYSIS
FIGURE 9 EUROPE BIOSTIMULANTS MARKET: MULTIVARIATE MODELING
FIGURE 10 EUROPE BIOSTIMULANTS MARKET: TYPE TIMELINE CURVE
FIGURE 11 EUROPE BIOSTIMULANTS MARKET: END-USER COVERAGE GRID
FIGURE 12 EUROPE BIOSTIMULANTS MARKET: SEGMENTATION
FIGURE 13 TWO SEGMENTS COMPRISE THE EUROPE BIOSTIMULANTS MARKET, BY ORIGIN (2025)
FIGURE 14 EUROPE BIOSTIMULANTS MARKET: EXECUTIVE SUMMARY
FIGURE 15 STRATEGIC DECISIONS
FIGURE 16 INCREASING FREQUENCY OF CLIMATE-RELATED CROP STRESS SUCH AS DROUGHTS, FLOODS, AND HEAT WAVES IS DRIVING FARMERS TO ADOPT BIOSTIMULANTS TO MAINTAIN CROP YIELD AND QUALITY IS EXPECTED TO DRIVE THE EUROPE BIOSTIMULANTS MARKET DURING THE FORECAST PERIOD OF 2026 TO 2033
FIGURE 17 ORIGIN SEGMENT IS EXPECTED TO ACCOUNT FOR THE LARGEST SHARE OF THE EUROPE BIOSTIMULANTS MARKET IN 2026 & 2033
FIGURE 18 PORTER’S FIVE FORCES ANALYSIS
FIGURE 19 PRICING ANALYSIS (2018-2033)
FIGURE 20 PATENT ANALYSIS BY APPLICANTS
FIGURE 21 PATENT ANALYSIS BY COUNTRY
FIGURE 22 PATENT ANALYSIS BY YEAR
FIGURE 23 COMPANY EVALUATION QUADRANT
FIGURE 24 DRIVERS, RESTRAINTS, OPPORTUNITIES AND CHALLENGES OF EUROPE BIOSTIMULANTS MARKET
FIGURE 25 EUROPE BIOSTIMULANTS MARKET: BY ORIGIN, 2025
FIGURE 26 EUROPE BIOSTIMULANTS MARKET: BY FORM, 2025
FIGURE 27 EUROPE BIOSTIMULANTS MARKET: BY ACTIVE INGREDIENTS, 2025
FIGURE 28 EUROPE BIOSTIMULANTS MARKET: BY CROP, 2025
FIGURE 29 EUROPE BIOSTIMULANTS MARKET: BY APPLICATION METHOD, 2024
FIGURE 30 EUROPE BIOSTIMULANTS MARKET: BY END USER, 2025
FIGURE 31 EUROPE BIOSTIMULANTS MARKET: SNAPSHOT
FIGURE 32 EUROPE BIOSTIMULANTS MARKET: COMPANY SHARE 2025 (%)
研究方法
数据收集和基准年分析是使用具有大样本量的数据收集模块完成的。该阶段包括通过各种来源和策略获取市场信息或相关数据。它包括提前检查和规划从过去获得的所有数据。它同样包括检查不同信息源中出现的信息不一致。使用市场统计和连贯模型分析和估计市场数据。此外,市场份额分析和关键趋势分析是市场报告中的主要成功因素。要了解更多信息,请请求分析师致电或下拉您的询问。
DBMR 研究团队使用的关键研究方法是数据三角测量,其中包括数据挖掘、数据变量对市场影响的分析和主要(行业专家)验证。数据模型包括供应商定位网格、市场时间线分析、市场概览和指南、公司定位网格、专利分析、定价分析、公司市场份额分析、测量标准、全球与区域和供应商份额分析。要了解有关研究方法的更多信息,请向我们的行业专家咨询。
可定制
Data Bridge Market Research 是高级形成性研究领域的领导者。我们为向现有和新客户提供符合其目标的数据和分析而感到自豪。报告可定制,包括目标品牌的价格趋势分析、了解其他国家的市场(索取国家列表)、临床试验结果数据、文献综述、翻新市场和产品基础分析。目标竞争对手的市场分析可以从基于技术的分析到市场组合策略进行分析。我们可以按照您所需的格式和数据样式添加您需要的任意数量的竞争对手数据。我们的分析师团队还可以为您提供原始 Excel 文件数据透视表(事实手册)中的数据,或者可以帮助您根据报告中的数据集创建演示文稿。

