欧洲生物农药市场 – 行业趋势及 2028 年预测

请求目录 请求目录 与分析师交谈 与分析师交谈 立即购买 立即购买 购买前请咨询 提前咨询 免费样本报告 免费样本报告

欧洲生物农药市场 – 行业趋势及 2028 年预测

  • Agriculture And Animal Feed
  • Published Report
  • Jul 2021
  • Europe
  • 350 页面
  • 桌子數: 323
  • 图号: 25

欧洲生物农药市场,按类型(生物杀虫剂、生物杀菌剂、生物杀线虫剂、生物除草剂等)、来源(微生物、生物化学、昆虫)、形式(干性、液体)、应用(叶面施肥、种子处理、土壤处理、水肥一体化、其他)、类别(农业、园艺)、作物(水果和蔬菜、谷物和谷类、油籽和豆类、草坪和观赏植物、其他作物)、国家(德国、法国、西班牙、土耳其、英国、荷兰、俄罗斯、瑞士、比利时、卢森堡、意大利和欧洲其他地区)划分,行业趋势和预测到 2028 年。

欧洲生物农药市场

市场分析与洞察:欧洲生物农药市场

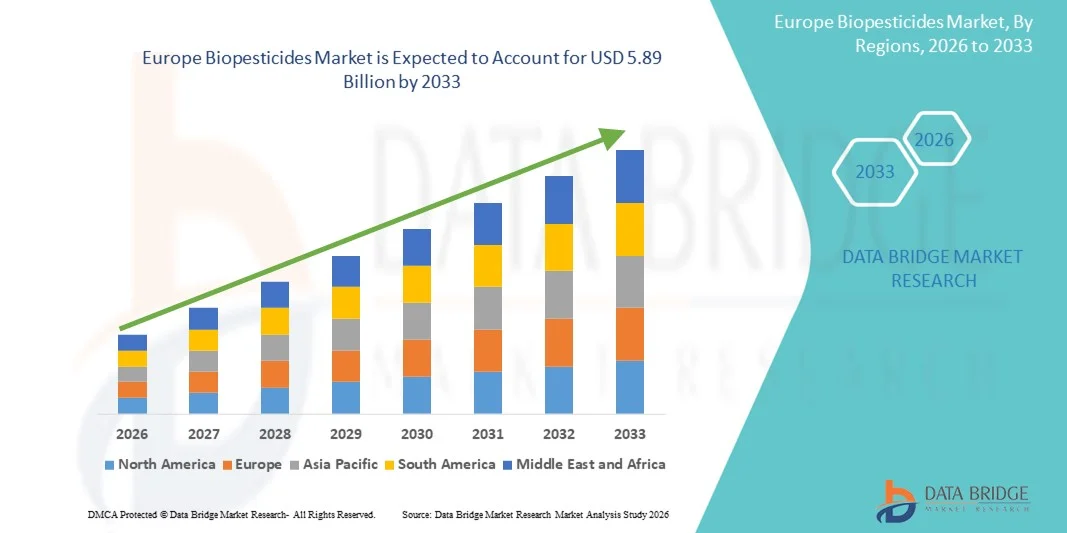
预计欧洲生物农药 市场将在 2021 年至 2028 年的预测期内实现市场增长。Data Bridge Market Research 分析称,在 2021 年至 2028 年的预测期内,该市场的复合年增长率为 13.5%,预计到 2028 年将达到 31.3564 亿美元。生物农药有机生产的创新方式和无残留食品意识的提高正在推动该市场的增长。

生物农药是一类从天然材料(如植物、动物、细菌和某些矿物质)中提取的农药。例如,菜籽油和小苏打具有杀虫作用,它们被视为生物农药。

生物农药主要有三大类,即生物化学农药、微生物农药和植物内含保护剂 (PIP)。这些生物农药通常比化学农药毒性小,只影响目标害虫和密切相关的生物。与传统农药相比,它们在活性方面更有效、更准确。使用生物农药有各种好处,例如它们对环境和人类的毒性较小。此外,它们不会留下有害残留物,只影响目标害虫。

农民对减少环境损害和易于分解的农产品的需求不断增长,这将推动全球生物农药市场的增长。此外,人们对具有高特异性杀虫效果的环保型生物杀虫剂的认识不断提高,也将促进市场的增长。农民对天然环保型生物杀虫剂的需求不断增长,这鼓励制造商在全球市场推出新产品。

然而,生物农药的严格监管和高价格是制约欧洲生物农药市场增长的因素。

这份欧洲生物农药市场报告提供了市场份额、新发展和产品线分析、国内和本地市场参与者的影响的详细信息,分析了新兴收入来源、市场法规变化、产品审批、战略决策、产品发布、地域扩张和市场技术创新方面的机会。要了解分析和市场情况,请联系我们获取分析师简报,我们的团队将帮助您创建收入影响解决方案,以实现您的预​​期目标。

欧洲生物农药市场

欧洲生物农药市场范围和市场规模

欧洲生物农药市场根据类型、来源、形式、应用、类别和作物分为六个显著的细分市场。细分市场之间的增长有助于您分析利基增长领域和进入市场的策略,并确定您的核心应用领域和目标市场的差异。

  • 根据类型,生物农药市场分为生物杀虫剂、生物杀菌剂、生物杀线虫剂、生物除草剂等。2021 年,由于对天然和环保农药的需求不断增加,且这些农药还具有广泛的致病作用,生物杀虫剂预计将在市场上占据主导地位。
  • 根据来源,生物农药市场分为微生物、生物化学和昆虫。微生物部分进一步分为细菌、真菌和病毒。2021 年,由于农民对人类健康和环境的关注度不断提高,以及对生物基农药的需求不断增加以减少污染,预计微生物部分将在市场中占据主导地位。
  • 根据形态,生物农药市场分为干农药和液体农药。2021 年,液体农药预计将在市场中占据主导地位,因为生物农药可用于保护农作物免受各种栽培环境(如田地、苗圃和保护性栽培系统)中各种植物病原体的侵害。
  • 根据应用,生物农药市场分为叶面施用、灌溉施肥、土壤处理、种子处理和其他。2021 年,叶面施用领域预计将在市场中占据主导地位,因为它需要较少的土壤相互作用。此外,叶面施用是首选的施用方法,因为它避免了潜在的养分束缚。
  • 根据类别,生物农药市场分为农业和园艺。2021 年,农业领域预计将在市场中占据主导地位,因为农民正在将重点转向有机农业,避免在农业实践中使用合成化学品。
  • 根据作物类型,生物农药市场分为水果和蔬菜、谷物和谷类、油籽和豆类、草皮和观赏植物以及其他作物。2021 年,由于注重健康的消费者对这些产品的需求不断增加,水果和蔬菜市场预计将在市场上占据主导地位。此外,由于纯素食消费者的增加,市场预计还会进一步增长。

欧洲生物农药市场

欧洲生物农药市场国家级分析

对欧洲生物农药市场进行了分析,并按国家、类型、来源、形式、应用、类别和作物提供了市场规模信息。

欧洲生物农药市场报告涵盖的国家包括德国、法国、英国、意大利、西班牙、俄罗斯、土耳其、比利时、荷兰、瑞士、卢森堡和欧洲其他国家。

  • 在欧洲,由于害虫抗药性不断增强以及农作物复苏势头增强,德国有望在生物农药市场占据主导地位,从而推动该地区采用生物农药等可持续解决方案。
  • 在德国,由于环境损害减少,源头部分占主导地位。而在法国,由于需要采取有针对性的行动来降低种植者的风险,源头部分占主导地位。在英国,由于人们对生物农药有效分解的认识不断提高,源头部分占主导地位。

报告的国家部分还提供了影响单个市场因素和国内市场监管变化,这些因素和变化会影响市场的当前和未来趋势。新销售、替代销售、国家人口统计、监管法案和进出口关税等数据点是用于预测单个国家市场情景的一些主要指标。此外,在提供国家数据的预测分析时,还考虑了北美品牌的存在和可用性以及由于来自本地和国内品牌的激烈或稀少的竞争而面临的挑战、销售渠道的影响。

农业对生物农药的需求不断增长

欧洲生物农药市场还为您提供每个国家行业增长的详细市场分析,包括销售额、成分销售额、生物农药技术发展的影响以及监管环境的变化及其对生物农药市场的支持。数据涵盖 2010 年至 2019 年的历史时期。

竞争格局和欧洲生物农药市场份额分析

欧洲生物农药市场竞争格局按竞争对手提供详细信息。详细信息包括公司概况、公司财务状况、收入、市场潜力、研发投资、新市场计划、印度业务、生产基地和设施、公司优势和劣势、产品发布、产品试验渠道、产品批准、专利、产品宽度和广度、应用优势、技术生命线曲线。以上提供的数据点仅与公司对欧洲生物农药市场的关注有关。

生物农药市场的一些主要参与者包括先正达作物保护公司、Bionema、Vegalab SA、STK bio-ag technologies、Andermatt Biocontrol AG、Koppert Biological Systems、Corteva、拜耳公司、Biobest Group NV、Certis USA LLC、Valent BioSciences LLC、Novozymes、BASF SE、IPL Biologicals Limited、Terramera Inc.、Khandelwal Bio Fertilizer、Isagro、Gowan Company、Parry America, Inc.、Barrix Agro Sciences Pvt Ltd、BioWorks Inc.、Marrone Bio Innovations、FMC Corporation、UPL、Nufarm、Bioline AgriSciences ltd、Biofa GmbH、BioConsortia, Inc.、McLaughlin Gormley King Company 和 W. Neudorff GmbH KG 等。

许多公司也发起了扩张计划,这也加速了欧洲生物农药市场的增长。

例如,

  • 2021年3月,据Meister Media Worldwide报道,Boatnical Solution Inc.和先正达在墨西哥推出了一款名为BotriStop的生物杀菌剂产品,有助于控制灰葡萄孢菌。
  • 2019年3月,据重庆史丹利信息技术有限公司报道,先正达在葡萄牙推出了一种基于苏云金芽孢杆菌的生物杀虫剂,名为Costar。

合作伙伴关系、新产品开发和其他战略提高了公司的市场份额,扩大了覆盖范围和存在感。这也有利于组织改善其生物农药产品。


SKU-

Get online access to the report on the World's First Market Intelligence Cloud

  • Interactive Data Analysis Dashboard
  • Company Analysis Dashboard for high growth potential opportunities
  • Research Analyst Access for customization & queries
  • Competitor Analysis with Interactive dashboard
  • Latest News, Updates & Trend analysis
  • Harness the Power of Benchmark Analysis for Comprehensive Competitor Tracking
Request for Demo

目录

  1. introduction
    1. OBJECTIVES OF THE STUDY
    2. MARKET DEFINITION
    3. OVERVIEW of Europe biopesticides market
    4. LIMITATIONs
    5. MARKETS COVERED
  2. MARKET SEGMENTATION
    1. MARKETS COVERED
    2. geographical scope
    3. years considered for the study
    4. currency and pricing
    5. DBMR TRIPOD DATA VALIDATION MODEL
    6. MULTIVARIATE MODELLING
    7. Type LIFELINE CURVE
    8. primary interviews with key opinion leaders
    9. DBMR MARKET POSITION GRID
    10. vendor share analysis
    11. secondary sourcEs
    12. assumptions
  3. EXECUTIVE SUMMARY
  4. premium insights
  5. market overvieW
    1. DRIVERS
      1. INCREASE IN NUMBER OF APPROVALS FOR BIOPESTICIDES BY GOVERNMENTAL BODIES
      2. RISE IN FUNDING FOR BIOPESTICIDE PRODUCTS
      3. INCREASE IN LAUNCHES OF BIOLOGICAL PRODUCTS FOR AGRICULTURE
      4. INCREASE IN DEMAND FOR SUSTAINABLE AGRICULTURE
      5. GROWING ADOPTION OF ORGANIC FARMING BOOSTS THE DEMAND FOR BIOPESTICIDES
    2. RESTRAINTS:
      1. STRINGENT REGULATIONS ON BIOPESTICIDES:
      2. LACK OF AWARENESS AMONG THE CONSUMERS
    3. OPPORTUNITIES
      1. RISE IN ENVIRONMENTAL POLLUTION CAUSED BY CHEMICAL PESTICIDES
      2. INCREASE IN INITIATIVES TAKEN BY GOVERNMENTAL BODIES TO FOSTER THE ADOPTION OF BIOPESTICIDES
    4. CHALLENGES:
      1. HIGH PRICES OF BIOPESTICIDES
      2. INCREASED USAGE OF CHEMICAL OR SYNTHETIC PESTICIDES
  6. IMPACT OF COVID-19 ON THE EUROPE BIO-PESTICIDES MARKET
    1. AFTERMATH OF COVID-19
    2. LIMITED SUPPLY AND AVAILABILITY OF BIO-PESTICIDES
    3. THE RISE IN ORGANIC FARMING AND USE OF BIOPESTICIDES
    4. CONCLUSION
  7. Europe Biopesticides market, by type
    1. overview
    2. bioinsecticides
      1. bacillus Thuringiensis
      2. beauveria Bassiana
      3. verticillium Lecanii
      4. metarhizium Anisoplia
      5. baculovirus
      6. others
    3. biofungicides
      1. trichoderma viride
      2. bacillus
      3. pseudomonas
      4. streptomyces
      5. trichoderma Harzianum
      6. others
    4. bionematicides
      1. bacillus firmus
      2. Purpureocillium lilacinus
      3. others
    5. bioherbicides
    6. others
  8. Europe Biopesticides market, by Source
    1. overview
    2. microbial
      1. Bacteria
      2. fungi
      3. virus
    3. biochemical
      1. plant extracts
      2. pheromones
      3. others
    4. insects
      1. phytoseiulus macropilis
      2. neoseiulus californicus
      3. others
  9. Europe Biopesticides market, by form
    1. overview
    2. liquid
      1. Suspension Concentrate
      2. Emulsifiable concentrate
      3. Soluble liquid Concentrate
    3. dry
      1. WETTABLE POWDER
      2. DRY GRANULES
      3. WATER DISP
  10. Europe Biopesticides market, by application
    1. overview
    2. Foliar application
    3. Soil treatment
    4. Seed treatment
    5. fertigation
    6. OtherS
  11. Europe Biopesticides market, by cropS
    1. overview
    2. Fruits & vegetables
      1. Potatoes
      2. tomatoes
      3. Apples
      4. oranges
      5. CABBAGES
      6. Strawberries
      7. Grape fruit
      8. broccoli
      9. Others
    3. cereals & Grains
      1. Maize
      2. wheat
      3. rice
      4. barley
      5. sorghum
      6. oats
      7. others
    4. oilseed & pulses
      1. soybean
      2. sunflower
      3. lentils
      4. peas
      5. graM
      6. sesame seed
      7. others
    5. Turf & ornamental
    6. Other
  12. Europe Biopesticides market, by category
    1. overview
    2. agriculture
    3. horticulture
  13. EUROPE BIOPESTICIDES MARKET, BY REGION
    1. overview
    2. EUROPE
      1. Germany
      2. France
      3. u.k.
      4. Italy
      5. Spain
      6. Russia
      7. Turkey
      8. Belgium
      9. Netherlands
      10. Switzerland
      11. Luxemburg
      12. Rest of Europe
  14. Europe Biopesticides Market company landscape
    1. company share analysis: Europe
  15. swot analysis
  16. company profile
    1. BAYER AG
      1. COMPANY SNAPSHOT
      2. Revenue Analysis
      3. company share analysis
      4. PRODUCT PORTFOLIO
      5. RECENT DEVELOPMENTs
      6. Swot analysis
    2. CORTEVA
      1. COMPANY SNAPSHOT
      2. REVENUE ANALYSIS
      3. company share analysis
      4. PRODUCT POrTFOLIO
      5. RECENT DEVELOPMENTS
      6. Swot analysis
    3. FMC Corporation
      1. COMPANY SNAPSHOT
      2. revenue analysis
      3. company share analysis
      4. PRODUCT PORTFOLIO
      5. RECENT DEVELOPMENTS
      6. Swot analysis
    4. Bioline AgroSciences Ltd
      1. COMPANY SNAPSHOT
      2. company share analysis
      3. PRODUCT PORTFOLIO
      4. RECENT DEVELOPMENTS
      5. Swot analysis
    5. Nufarm
      1. COMPANY SNAPSHOT
      2. revenue analysis
      3. company share analysis
      4. PRODUCT PORTFOLIO
      5. RECENT DEVELOPMENTS
      6. recent development
      7. Swot analysis
    6. ANDERMATT BIOCONTROL AG
      1. COMPANY SNAPSHOT
      2. PRODUCT PORTFOLIO
      3. RECENT DEVELOPMENTs
      4. SWOT analysis
    7. BASF SE
      1. COMPANY SNAPSHOT
      2. Revenue Analysis
      3. PRODUCT PORTFOLIO
      4. RECENT DEVELOPMENT
      5. Swot Analysis
    8. biobest GROUP NV
      1. COMPANY SNAPSHOT
      2. PRODUCT POrTFOLIO
      3. RECENT DEVELOPMENTS
      4. Swot analysis
    9. BIOFA GMBH
      1. COMPANY SNAPSHOT
      2. PRODUCT PORTFOLIO
      3. RECENT DEVELOPMENT
      4. Swot analysis
    10. BIONEMA
      1. COMPANY snapshot
      2. PRODUCT PORTFOLIO
      3. RECENT Developments
      4. SWOT analysis
    11. gowan company
      1. COMPANY snapshot
      2. PRODUCT PORTFOLIO
      3. RECENT development
      4. SWOT ANALYSIS
    12. ipl biologicals limited
      1. COMPANY SNAPSHOT
      2. PRODUCT PORTFOLIO
      3. RECENT DEVELOPMENT
      4. Swot Analysis
    13. isagro
      1. COMPANY snapshot
      2. Revenue analysis
      3. PRODUCT PORTFOLIO
      4. RECENT Development
      5. SWOT ANALYSIS
    14. KOPPERT BIOLOGICAL SYSTEMS
      1. COMPANY SNAPSHOT
      2. PRODUCT POrTFOLIO
      3. RECENT DEVELOPMENTS
      4. SWOT analysis
    15. Novozymes
      1. COMPANY SNAPSHOT
      2. REVENUE ANALYSIS
      3. PRODUCT POrTFOLIO
      4. RECENT DEVELOPMENTS
      5. Swot analysis
    16. STK BIO- AG TECHNOLOGIES
      1. COMPANY snapshot
      2. PRODUCT PORTFOLIO
      3. RECENT development
      4. SWOT analysis
    17. Syngenta Crop Protection AG
      1. COMPANY SNAPSHOT
      2. REVENUE ANALYSIS
      3. PRODUCT PORTFOLIO
      4. RECENT DEVELOPMENTs
      5. SWOT analysis
    18. UPL
      1. COMPANY SNAPSHOT
      2. revenue analysis
      3. PRODUCT PORTFOLIO
      4. RECENT DEVELOPMENTS
      5. Swot analysis
    19. valent biosciences llc
      1. COMPANY SNAPSHOT
      2. PRODUCT POrTFOLIO
      3. RECENT DEVELOPMENT
      4. Swot analysis
    20. VEGALAB SA
      1. COMPANY snapshot
      2. PRODUCT PORTFOLIO
      3. RECENT development
      4. SWOT analysis
    21. W. Neudorff GmbH KG
      1. COMPANY SNAPSHOT
      2. PRODUCT PORTFOLIO
      3. RECENT DEVELOPMENT
      4. swot analysis
  17. questionnaire
  18. related reports

表格列表

TABLE 1 PRICES OF BIOPESTICIDES

TABLE 2 Europe biopesticides Market, type, 2019-2028 (USD million)

TABLE 3 Europe biopesticides Market, type, 2019-2028 (TONS)

TABLE 4 Europe Bioinsecticides in biopesticides Market, BY type, 2019-2028 (USD million)

TABLE 5 Europe Bioinsecticides in biopesticides Market, BY type, 2019-2028 (Tons)

TABLE 6 Europe biofungicideS in biopesticides Market, BY type, 2019-2028 (USD million)

TABLE 7 Europe BIOFUNGICIDES in biopesticides Market, BY type, 2019-2028 (tons)

TABLE 8 Europe bionematicides in biopesticides Market, BY type, 2019-2028 (USD million)

TABLE 9 Europe bionematicides in biopesticides Market, BY type, 2019-2028 (tonS)

TABLE 10 Europe biopesticides Market, BY source, 2019-2028 (USD million)

TABLE 11 Europe biopesticides Market, BY source, 2019-2028 (tons)

TABLE 12 Europe microbial in biopesticides MARKET, BY SOURCE, 2019-2028 (usd million)

TABLE 13 Europe microbial in biopesticides Market, BY source, 2019-2028 (tons)

TABLE 14 Europe biochemical in biopesticides market, BY source, 2019-2028 (usd million)

TABLE 15 Europe biochemical in biopesticides market, BY source, 2019-2028 (tons)

TABLE 16 Europe insect in biopesticides market, BY source, 2019-2028 (usd million)

TABLE 17 Europe insect in biopesticides market, BY source, 2019-2028 (tons)

TABLE 18 Europe Biopesticides Market, By form, 2019-2028 (USD Million)

TABLE 19 Europe Biopesticides Market, By FORM, 2019-2028 (tons)

TABLE 20 Europe LIQUID IN Biopesticides Market, By form, 2019-2028 (USD Million)

TABLE 21 Europe LIQUID IN Biopesticides Market, By form, 2019-2028 (TONS)

TABLE 22 Europe DRY IN Biopesticides Market, By form, 2019-2028 (USD MILLION)

TABLE 23 Europe DRY IN Biopesticides Market, By form, 2019-2028 (TONS)

TABLE 24 Europe biopesticides MARKET, By application, 2019-2028 (USD Million)

TABLE 25 Europe biopesticides MARKET, By application, 2019-2028 (TONS)

TABLE 26 Instances of Biopesticides used through foliar applications

TABLE 27 Several biopesticides are used to control plant pathogens by using soil treatment are as follow-

TABLE 28 Europe biopesticides market, By crop, 2019-2028 (USD Million)

TABLE 29 Europe biopesticides market, By crop, 2019-2028 (TONS)

TABLE 30 Europe Fruits & vegetables in biopesticides market, By crop, 2019-2028 (USD Million)

TABLE 31 Europe Fruits & vegetables in biopesticides market, By crop, 2019-2028 (TONS)

TABLE 32 Europe CEREAL & GRAINS in biopesticides market, By CROP, 2019-2028 (USD Million)

TABLE 33 Europe CEREAL & GRAINS in biopesticides market, By CROP, 2019-2028 (tons)

TABLE 34 Europe Oilseed & Pulses in biopesticides market, By CROP, 2019-2028 (USD Million)

TABLE 35 Europe Oilseed & Pulses in biopesticides market, By CROP 2019-2028 (TONS)

TABLE 36 Europe biopesticides Market, Category, 2019-2028 (USD million)

TABLE 37 Europe biopesticides Market, Category, 2019-2028 (TONS)

TABLE 38 The following are some of the key players offering biopesticides for horticulture to the consumers

TABLE 39 Europe Biopesticides Market, By Country, 2019-2028 (USD Million)

TABLE 40 Europe Biopesticides Market, By Country, 2019-2028 (TONs)

TABLE 41 Europe Biopesticides Market, By TYPE, 2019-2028 (USD Million)

TABLE 42 Europe Biopesticides Market, By TYPE, 2019-2028 (TONs)

TABLE 43 Europe Bioinsecticides in Biopesticides Market, By TYPE, 2019-2028 (USD Million)

TABLE 44 Europe Bioinsecticides in Biopesticides Market, By TYPE, 2019-2028 (TON)

TABLE 45 Europe Biofungicides in Biopesticides Market, By TYPE, 2019-2028 (USD Million)

TABLE 46 Europe Biofungicides in Biopesticides Market, By TYPE, 2019-2028 (TON)

TABLE 47 Europe Bionematicides in Biopesticides Market, By TYPE, 2019-2028 (USD Million)

TABLE 48 Europe Bionematicides in Biopesticides Market, By TYPE, 2019-2028 (TONs)

TABLE 49 Europe Biopesticides Market, By Source, 2019-2028 (USD Million)

TABLE 50 Europe Biopesticides Market, By Source, 2019-2028 (TONs)

TABLE 51 Europe Microbial in Biopesticides Market, By Source, 2019-2028 (USD Million)

TABLE 52 Europe Microbial in Biopesticides Market, By Source, 2019-2028 (TONs)

TABLE 53 Europe Biochemical in Biopesticides Market, By Source, 2019-2028 (USD Million)

TABLE 54 Europe Biochemical in Biopesticides Market, By Source, 2019-2028 (TON)

TABLE 55 Europe Insect in Biopesticides Market, By Source, 2019-2028 (USD Million)

TABLE 56 Europe Insect in Biopesticides Market, By Source, 2019-2028 (TONs)

TABLE 57 Europe Biopesticides Market, By FORM, 2019-2028 (USD Million)

TABLE 58 Europe Biopesticides Market, By FORM, 2019-2028 (TONs)

TABLE 59 Europe Liquid in Biopesticides Market, By FORM, 2019-2028 (USD Million)

TABLE 60 Europe Liquid in Biopesticides Market, By FORM, 2019-2028 (USD Million)

TABLE 61 Europe Dry in Biopesticides Market, By FORM, 2019-2028 (USD Million)

TABLE 62 Europe Dry in Biopesticides Market, By FORM, 2019-2028 (TONs)

TABLE 63 Europe Biopesticides Market, By Application, 2019-2028 (USD Million)

TABLE 64 Europe Biopesticides Market, By Application, 2019-2028 (TON)

TABLE 65 Europe Biopesticides Market, By Category, 2019-2028 (USD Million)

TABLE 66 Europe Biopesticides Market, By Category, 2019-2028 (TONs)

TABLE 67 Europe Biopesticides Market, By Crops, 2019-2028 (USD Million)

TABLE 68 Europe Biopesticides Market, By Crops, 2019-2028 (TONs)

TABLE 69 Europe Fruits & Vegetables in Biopesticides Market, By Crops, 2019-2028 (USD Million)

TABLE 70 Europe Fruits & Vegetables in Biopesticides Market, By Crops, 2019-2028 (TONs)

TABLE 71 Europe Cereal & Grains in Biopesticides Market, By Crops, 2019-2028 (USD Million)

TABLE 72 Europe Cereal & Grains in Biopesticides Market, By Crops, 2019-2028 (TONs)

TABLE 73 Europe Oilseed & Pulses in Biopesticides Market, By Crops, 2019-2028 (USD Million)

TABLE 74 Europe Oilseed & Pulses in Biopesticides Market, By Crops, 2019-2028 (TONs)

TABLE 75 Germany Biopesticides Market, By TYPE, 2019-2028 (USD Million)

TABLE 76 Germany Biopesticides Market, By TYPE, 2019-2028 (ton)

TABLE 77 Germany Bioinsecticides in Biopesticides Market, By TYPE, 2019-2028 (USD Million)

TABLE 78 Germany Bioinsecticides in Biopesticides Market, By TYPE, 2019-2028 (tons)

TABLE 79 Germany Biofungicides in Biopesticides Market, By TYPE, 2019-2028 (USD Million)

TABLE 80 Germany Biofungicides in Biopesticides Market, By TYPE, 2019-2028 (tons)

TABLE 81 Germany Bionematicides in Biopesticides Market, By TYPE, 2019-2028 (USD Million)

TABLE 82 Germany Bionematicides in Biopesticides Market, By TYPE, 2019-2028 (ton)

TABLE 83 Germany Biopesticides Market, By Source, 2019-2028 (USD Million)

TABLE 84 Germany Microbial in Biopesticides Market, By Source, 2019-2028 (USD Million)

TABLE 85 Germany Biochemical in Biopesticides Market, By Source, 2019-2028 (USD Million)

TABLE 86 Germany Insect in Biopesticides Market, By Source, 2019-2028 (USD Million)

TABLE 87 Germany Biopesticides Market, By FORM, 2019-2028 (USD Million)

TABLE 88 Germany Liquid in Biopesticides Market, By FORM, 2019-2028 (USD Million)

TABLE 89 Germany Dry in Biopesticides Market, By FORM, 2019-2028 (USD Million)

TABLE 90 Germany Biopesticides Market, By Application, 2019-2028 (USD Million)

TABLE 91 Germany Biopesticides Market, By Category, 2019-2028 (USD Million)

TABLE 92 Germany Biopesticides Market, By Crops, 2019-2028 (USD Million)

TABLE 93 Germany Fruits & Vegetables in Biopesticides Market, By Crops, 2019-2028 (USD Million)

TABLE 94 Germany Cereal & Grains in Biopesticides Market, By Crops, 2019-2028 (USD Million)

TABLE 95 Germany Oilseed & Pulses in Biopesticides Market, By Crops, 2019-2028 (USD Million)

TABLE 96 France Biopesticides Market, By TYPE, 2019-2028 (USD Million)

TABLE 97 France Biopesticides Market, By TYPE, 2019-2028 (tons)

TABLE 98 France Bioinsecticides in Biopesticides Market, By TYPE, 2019-2028 (USD Million)

TABLE 99 France Bioinsecticides in Biopesticides Market, By TYPE, 2019-2028 (tons)

TABLE 100 France Biofungicides in Biopesticides Market, By TYPE, 2019-2028 (USD Million)

TABLE 101 France Biofungicides in Biopesticides Market, By TYPE, 2019-2028 (tons)

TABLE 102 france bionematicides in biopesticides market, By type, 2019-2028 (USD million)

TABLE 103 france bionematicides in biopesticides market, By type, 2019-2028 (tons)

TABLE 104 France Biopesticides Market, By Source, 2019-2028 (USD Million)

TABLE 105 France Microbial in Biopesticides Market, By Source, 2019-2028 (USD Million)

TABLE 106 France Biochemical in Biopesticides Market, By Source, 2019-2028 (USD Million)

TABLE 107 France Insect in Biopesticides Market, By Source, 2019-2028 (USD Million)

TABLE 108 France Biopesticides Market, By FORM, 2019-2028 (USD Million)

TABLE 109 France Liquid in Biopesticides Market, By FORM, 2019-2028 (USD Million)

TABLE 110 France Dry in Biopesticides Market, By FORM, 2019-2028 (USD Million)

TABLE 111 France Biopesticides Market, By Application, 2019-2028 (USD Million)

TABLE 112 France Biopesticides Market, By Category, 2019-2028 (USD Million)

TABLE 113 France Biopesticides Market, By Crops, 2019-2028 (USD Million)

TABLE 114 France Fruits & Vegetables in Biopesticides Market, By Crops, 2019-2028 (USD Million)

TABLE 115 France Cereal & Grains in Biopesticides Market, By Crops, 2019-2028 (USD Million)

TABLE 116 France Oilseed & Pulses in Biopesticides Market, By Crops, 2019-2028 (USD Million)

TABLE 117 U.K. Biopesticides Market, By TYPE, 2019-2028 (USD Million)

TABLE 118 U.K. Biopesticides Market, By TYPE, 2019-2028 (tons)

TABLE 119 U.K. Bioinsecticides in Biopesticides Market, By TYPE, 2019-2028 (USD Million)

TABLE 120 U.K. Bioinsecticides in Biopesticides Market, By TYPE, 2019-2028 (tons)

TABLE 121 U.K. Biofungicides in Biopesticides Market, By TYPE, 2019-2028 (USD Million)

TABLE 122 U.K. Biofungicides in Biopesticides Market, By TYPE, 2019-2028 (ton)

TABLE 123 U.K. Bionematicides in Biopesticides Market, By TYPE, 2019-2028 (USD Million)

TABLE 124 U.K. Bionematicides in Biopesticides Market, By TYPE, 2019-2028 (tons)

TABLE 125 U.K. Biopesticides Market, By Source, 2019-2028 (USD Million)

TABLE 126 U.K. Microbial in Biopesticides Market, By Source, 2019-2028 (USD Million)

TABLE 127 U.K. Biochemical in Biopesticides Market, By Source, 2019-2028 (USD Million)

TABLE 128 U.K. Insect in Biopesticides Market, By Source, 2019-2028 (USD Million)

TABLE 129 U.K. Biopesticides Market, By FORM, 2019-2028 (USD Million)

TABLE 130 U.K. Liquid in Biopesticides Market, By FORM, 2019-2028 (USD Million)

TABLE 131 U.K. Dry in Biopesticides Market, By FORM, 2019-2028 (USD Million)

TABLE 132 U.K. Biopesticides Market, By Application, 2019-2028 (USD Million)

TABLE 133 U.K. Biopesticides Market, By Category, 2019-2028 (USD Million)

TABLE 134 U.K. Biopesticides Market, By Crops, 2019-2028 (USD Million)

TABLE 135 U.K. Fruits & Vegetables in Biopesticides Market, By Crops, 2019-2028 (USD Million)

TABLE 136 U.K. Cereal & Grains in Biopesticides Market, By Crops, 2019-2028 (USD Million)

TABLE 137 U.K. Oilseed & Pulses in Biopesticides Market, By Crops, 2019-2028 (USD Million)

TABLE 138 Italy Biopesticides Market, By TYPE, 2019-2028 (USD Million)

TABLE 139 Italy Biopesticides Market, By TYPE, 2019-2028 (tons)

TABLE 140 Italy Bioinsecticides in Biopesticides Market, By TYPE, 2019-2028 (USD Million)

TABLE 141 Italy Bioinsecticides in Biopesticides Market, By TYPE, 2019-2028 (tons)

TABLE 142 Italy Biofungicides in Biopesticides Market, By TYPE, 2019-2028 (USD Million)

TABLE 143 Italy Biofungicides in Biopesticides Market, By TYPE, 2019-2028 (tons)

TABLE 144 Italy Bionematicides in Biopesticides Market, By TYPE, 2019-2028 (USD Million)

TABLE 145 Italy Bionematicides in Biopesticides Market, By TYPE, 2019-2028 (tons)

TABLE 146 Italy Biopesticides Market, By Source, 2019-2028 (USD Million)

TABLE 147 Italy Microbial in Biopesticides Market, By Source, 2019-2028 (USD Million)

TABLE 148 Italy Biochemical in Biopesticides Market, By Source, 2019-2028 (USD Million)

TABLE 149 Italy Insect in Biopesticides Market, By Source, 2019-2028 (USD Million)

TABLE 150 Italy Biopesticides Market, By FORM, 2019-2028 (USD Million)

TABLE 151 Italy Liquid in Biopesticides Market, By FORM, 2019-2028 (USD Million)

TABLE 152 Italy Dry in Biopesticides Market, By FORM, 2019-2028 (USD Million)

TABLE 153 Italy Biopesticides Market, By Application, 2019-2028 (USD Million)

TABLE 154 Italy Biopesticides Market, By Category, 2019-2028 (USD Million)

TABLE 155 Italy Biopesticides Market, By Crops, 2019-2028 (USD Million)

TABLE 156 Italy Fruits & Vegetables in Biopesticides Market, By Crops, 2019-2028 (USD Million)

TABLE 157 Italy Cereal & Grains in Biopesticides Market, By Crops, 2019-2028 (USD Million)

TABLE 158 Italy Oilseed & Pulses in Biopesticides Market, By Crops, 2019-2028 (USD Million)

TABLE 159 Spain Biopesticides Market, By TYPE, 2019-2028 (USD Million)

TABLE 160 Spain Biopesticides Market, By TYPE, 2019-2028 (tons)

TABLE 161 Spain Bioinsecticides in Biopesticides Market, By TYPE, 2019-2028 (USD Million)

TABLE 162 Spain Bioinsecticides in Biopesticides Market, By TYPE, 2019-2028 (tons)

TABLE 163 Spain Biofungicides in Biopesticides Market, By TYPE, 2019-2028 (USD Million)

TABLE 164 Spain Biofungicides in Biopesticides Market, By TYPE, 2019-2028 (tons)

TABLE 165 Spain Bionematicides in Biopesticides Market, By TYPE, 2019-2028 (USD Million)

TABLE 166 Spain Bionematicides in Biopesticides Market, By TYPE, 2019-2028 (Tons)

TABLE 167 Spain Biopesticides Market, By Source, 2019-2028 (USD Million)

TABLE 168 Spain Microbial in Biopesticides Market, By Source, 2019-2028 (USD Million)

TABLE 169 Spain Biochemical in Biopesticides Market, By Source, 2019-2028 (USD Million)

TABLE 170 Spain Insect in Biopesticides Market, By Source, 2019-2028 (USD Million)

TABLE 171 Spain Biopesticides Market, By FORM, 2019-2028 (USD Million)

TABLE 172 Spain Liquid in Biopesticides Market, By FORM, 2019-2028 (USD Million)

TABLE 173 Spain Dry in Biopesticides Market, By FORM, 2019-2028 (USD Million)

TABLE 174 Spain Biopesticides Market, By Application, 2019-2028 (USD Million)

TABLE 175 Spain Biopesticides Market, By Category, 2019-2028 (USD Million)

TABLE 176 Spain Biopesticides Market, By Crops, 2019-2028 (USD Million)

TABLE 177 Spain Fruits & Vegetables in Biopesticides Market, By Crops, 2019-2028 (USD Million)

TABLE 178 Spain Cereal & Grains in Biopesticides Market, By Crops, 2019-2028 (USD Million)

TABLE 179 Spain Oilseed & Pulses in Biopesticides Market, By Crops, 2019-2028 (USD Million)

TABLE 180 Russia Biopesticides Market, By TYPE, 2019-2028 (USD Million)

TABLE 181 Russia Biopesticides Market, By TYPE, 2019-2028 (tons)

TABLE 182 Russia Bioinsecticides in Biopesticides Market, By TYPE, 2019-2028 (USD Million)

TABLE 183 Russia Bioinsecticides in Biopesticides Market, By TYPE, 2019-2028 (tons)

TABLE 184 Russia Biofungicides in Biopesticides Market, By TYPE, 2019-2028 (USD Million)

TABLE 185 Russia Biofungicides in Biopesticides Market, By TYPE, 2019-2028 (tons)

TABLE 186 Russia Bionematicides in Biopesticides Market, By TYPE, 2019-2028 (USD Million)

TABLE 187 Russia Bionematicides in Biopesticides Market, By TYPE, 2019-2028 (tons)

TABLE 188 Russia Biopesticides Market, By Source, 2019-2028 (USD Million)

TABLE 189 Russia Microbial in Biopesticides Market, By Source, 2019-2028 (USD Million)

TABLE 190 Russia Biochemical in Biopesticides Market, By Source, 2019-2028 (USD Million)

TABLE 191 Russia Insect in Biopesticides Market, By Source, 2019-2028 (USD Million)

TABLE 192 Russia Biopesticides Market, By FORM, 2019-2028 (USD Million)

TABLE 193 Russia Liquid in Biopesticides Market, By FORM, 2019-2028 (USD Million)

TABLE 194 Russia Dry in Biopesticides Market, By FORM, 2019-2028 (USD Million)

TABLE 195 Russia Biopesticides Market, By Application, 2019-2028 (USD Million)

TABLE 196 Russia Biopesticides Market, By Category, 2019-2028 (USD Million)

TABLE 197 Russia Biopesticides Market, By Crops, 2019-2028 (USD Million)

TABLE 198 Russia Fruits & Vegetables in Biopesticides Market, By Crops, 2019-2028 (USD Million)

TABLE 199 Russia Cereal & Grains in Biopesticides Market, By Crops, 2019-2028 (USD Million)

TABLE 200 Russia Oilseed & Pulses in Biopesticides Market, By Crops, 2019-2028 (USD Million)

TABLE 201 Turkey Biopesticides Market, By TYPE, 2019-2028 (USD Million)

TABLE 202 Turkey Biopesticides Market, By TYPE, 2019-2028 (tons)

TABLE 203 Turkey Bioinsecticides in Biopesticides Market, By TYPE, 2019-2028 (USD Million)

TABLE 204 Turkey Bioinsecticides in Biopesticides Market, By TYPE, 2019-2028 (tons)

TABLE 205 Turkey Biofungicides in Biopesticides Market, By TYPE, 2019-2028 (USD Million)

TABLE 206 Turkey Biofungicides in Biopesticides Market, By TYPE, 2019-2028 (tons)

TABLE 207 Turkey Bionematicides in Biopesticides Market, By TYPE, 2019-2028 (USD Million)

TABLE 208 Turkey Bionematicides in Biopesticides Market, By TYPE, 2019-2028 (tons)

TABLE 209 Turkey Biopesticides Market, By Source, 2019-2028 (USD Million)

TABLE 210 Turkey Microbial in Biopesticides Market, By Source, 2019-2028 (USD Million)

TABLE 211 TurkEy Biochemical in Biopesticides Market, By Source, 2019-2028 (USD Million)

TABLE 212 Turkey Insect in Biopesticides Market, By Source, 2019-2028 (USD Million)

TABLE 213 Turkey Biopesticides Market, By FORM, 2019-2028 (USD Million)

TABLE 214 Turkey Liquid in Biopesticides Market, By FORM, 2019-2028 (USD Million)

TABLE 215 Turkey Dry in Biopesticides Market, By FORM, 2019-2028 (USD Million)

TABLE 216 Turkey Biopesticides Market, By Application, 2019-2028 (USD Million)

TABLE 217 Turkey Biopesticides Market, By Category, 2019-2028 (USD Million)

TABLE 218 Turkey Biopesticides Market, By Crops, 2019-2028 (USD Million)

TABLE 219 Turkey Fruits & Vegetables in Biopesticides Market, By Crops, 2019-2028 (USD Million)

TABLE 220 Turkey Cereal & Grains in Biopesticides Market, By Crops, 2019-2028 (USD Million)

TABLE 221 Turkey Oilseed & Pulses in Biopesticides Market, By Crops, 2019-2028 (USD Million)

TABLE 222 Belgium Biopesticides Market, By TYPE, 2019-2028 (USD Million)

TABLE 223 Belgium Biopesticides Market, By TYPE, 2019-2028 (tons)

TABLE 224 Belgium Bioinsecticides in Biopesticides Market, By TYPE, 2019-2028 (USD Million)

TABLE 225 Belgium Bioinsecticides in Biopesticides Market, By TYPE, 2019-2028 (tons)

TABLE 226 Belgium Biofungicides in Biopesticides Market, By TYPE, 2019-2028 (USD Million)

TABLE 227 Belgium Biofungicides in Biopesticides Market, By TYPE, 2019-2028 (tons)

TABLE 228 Belgium Bionematicides in Biopesticides Market, By TYPE, 2019-2028 (USD Million)

TABLE 229 Belgium Bionematicides in Biopesticides Market, By TYPE, 2019-2028 (tons)

TABLE 230 Belgium Biopesticides Market, By Source, 2019-2028 (USD Million)

TABLE 231 Belgium Microbial in Biopesticides Market, By Source, 2019-2028 (USD Million)

TABLE 232 Belgium Biochemical in Biopesticides Market, By Source, 2019-2028 (USD Million)

TABLE 233 Belgium Insect in Biopesticides Market, By Source, 2019-2028 (USD Million)

TABLE 234 Belgium Biopesticides Market, By FORM, 2019-2028 (USD Million)

TABLE 235 Belgium Liquid in Biopesticides Market, By FORM, 2019-2028 (USD Million)

TABLE 236 Belgium Dry in Biopesticides Market, By FORM, 2019-2028 (USD Million)

TABLE 237 Belgium Biopesticides Market, By Application, 2019-2028 (USD Million)

TABLE 238 Belgium Biopesticides Market, By Category, 2019-2028 (USD Million)

TABLE 239 Belgium Biopesticides Market, By Crops, 2019-2028 (USD Million)

TABLE 240 Belgium Fruits & Vegetables in Biopesticides Market, By Crops, 2019-2028 (USD Million)

TABLE 241 Belgium Cereal & Grains in Biopesticides Market, By Crops, 2019-2028 (USD Million)

TABLE 242 Belgium Oilseed & Pulses in Biopesticides Market, By Crops, 2019-2028 (USD Million)

TABLE 243 Netherlands Biopesticides Market, By TYPE, 2019-2028 (USD Million)

TABLE 244 Netherlands Biopesticides Market, By TYPE, 2019-2028 (tons)

TABLE 245 Netherlands Bioinsecticides in Biopesticides Market, By TYPE, 2019-2028 (USD Million)

TABLE 246 Netherlands Bioinsecticides in Biopesticides Market, By TYPE, 2019-2028 (tons)

TABLE 247 Netherlands Biofungicides in Biopesticides Market, By TYPE, 2019-2028 (USD Million)

TABLE 248 Netherlands Biofungicides in Biopesticides Market, By TYPE, 2019-2028 (tons)

TABLE 249 Netherland Bionematicides in Biopesticides Market, By TYPE, 2019-2028 (USD Million)

TABLE 250 Netherland Bionematicides in Biopesticides Market, By TYPE, 2019-2028 (tons)

TABLE 251 Netherlands Biopesticides Market, By Source, 2019-2028 (USD Million)

TABLE 252 Netherlands Microbial in Biopesticides Market, By Source, 2019-2028 (USD Million)

TABLE 253 Netherlands Biochemical in Biopesticides Market, By Source, 2019-2028 (USD Million)

TABLE 254 Netherlands Insect in Biopesticides Market, By Source, 2019-2028 (USD Million)

TABLE 255 Netherlands Biopesticides Market, By FORM, 2019-2028 (USD Million)

TABLE 256 Netherlands Liquid in Biopesticides Market, By FORM, 2019-2028 (USD Million)

TABLE 257 Netherlands Dry in Biopesticides Market, By FORM, 2019-2028 (USD Million)

TABLE 258 Netherlands Biopesticides Market, By Application, 2019-2028 (USD Million)

TABLE 259 Netherlands Biopesticides Market, By Category, 2019-2028 (USD Million)

TABLE 260 Netherlands Biopesticides Market, By Crops, 2019-2028 (USD Million)

TABLE 261 Netherlands Fruits & Vegetables in Biopesticides Market, By Crops, 2019-2028 (USD Million)

TABLE 262 Netherlands Cereal & Grains in Biopesticides Market, By Crops, 2019-2028 (USD Million)

TABLE 263 Netherlands Oilseed & Pulses in Biopesticides Market, By Crops, 2019-2028 (USD Million)

TABLE 264 Switzerland Biopesticides Market, By TYPE, 2019-2028 (USD Million)

TABLE 265 Switzerland Biopesticides Market, By TYPE, 2019-2028 (tons)

TABLE 266 Switzerland Bioinsecticides in Biopesticides Market, By TYPE, 2019-2028 (USD Million)

TABLE 267 Switzerland Bioinsecticides in Biopesticides Market, By TYPE, 2019-2028 (tons)

TABLE 268 Switzerland Biofungicides in Biopesticides Market, By TYPE, 2019-2028 (USD Million)

TABLE 269 Switzerland Biofungicides in Biopesticides Market, By TYPE, 2019-2028 (tons)

TABLE 270 Switzerland Bionematicides in Biopesticides Market, By TYPE, 2019-2028 (USD Million)

TABLE 271 Switzerland Bionematicides in Biopesticides Market, By TYPE, 2019-2028 (tons)

TABLE 272 Switzerland Biopesticides Market, By Source, 2019-2028 (USD Million)

TABLE 273 Switzerland Microbial in Biopesticides Market, By Source, 2019-2028 (USD Million)

TABLE 274 Switzerland Biochemical in Biopesticides Market, By Source, 2019-2028 (USD Million)

TABLE 275 Switzerland Insect in Biopesticides Market, By Source, 2019-2028 (USD Million)

TABLE 276 Switzerland Biopesticides Market, By FORM, 2019-2028 (USD Million)

TABLE 277 Switzerland Liquid in Biopesticides Market, By FORM, 2019-2028 (USD Million)

TABLE 278 Switzerland Dry in Biopesticides Market, By FORM, 2019-2028 (USD Million)

TABLE 279 Switzerland Biopesticides Market, By Application, 2019-2028 (USD Million)

TABLE 280 Switzerland Biopesticides Market, By Category, 2019-2028 (USD Million)

TABLE 281 Switzerland Biopesticides Market, By Crops, 2019-2028 (USD Million)

TABLE 282 Switzerland Fruits & Vegetables in Biopesticides Market, By Crops, 2019-2028 (USD Million)

TABLE 283 Switzerland Cereal & Grains in Biopesticides Market, By Crops, 2019-2028 (USD Million)

TABLE 284 Switzerland Oilseed & Pulses in Biopesticides Market, By Crops, 2019-2028 (USD Million)

TABLE 285 Luxemburg Biopesticides Market, By TYPE, 2019-2028 (USD Million)

TABLE 286 Luxemburg Biopesticides Market, By TYPE, 2019-2028 (tons)

TABLE 287 Luxemburg Bioinsecticides in Biopesticides Market, By TYPE, 2019-2028 (USD Million)

TABLE 288 Luxemburg Bioinsecticides in Biopesticides Market, By TYPE, 2019-2028 (tons)

TABLE 289 Luxemburg Biofungicides in Biopesticides Market, By TYPE, 2019-2028 (USD Million)

TABLE 290 Luxemburg Biofungicides in Biopesticides Market, By TYPE, 2019-2028 (tons)

TABLE 291 Luxemburg Bionematicides in Biopesticides Market, By TYPE, 2019-2028 (USD Million)

TABLE 292 Luxemburg Bionematicides in Biopesticides Market, By TYPE, 2019-2028 (tons)

TABLE 293 Luxemburg Biopesticides Market, By Source, 2019-2028 (USD Million)

TABLE 294 Luxemburg Microbial in Biopesticides Market, By Source, 2019-2028 (USD Million)

TABLE 295 Luxemburg Biochemical in Biopesticides Market, By Source, 2019-2028 (USD Million)

TABLE 296 Luxemburg Insect in Biopesticides Market, By Source, 2019-2028 (USD Million)

TABLE 297 Luxemburg Biopesticides Market, By FORM, 2019-2028 (USD Million)

TABLE 298 Luxemburg Liquid in Biopesticides Market, By FORM, 2019-2028 (USD Million)

TABLE 299 Luxemburg Biopesticides Market, By Application, 2019-2028 (USD Million)

TABLE 300 Luxemburg Biopesticides Market, By Category, 2019-2028 (USD Million)

TABLE 301 Luxemburg Biopesticides Market, By Category, 2019-2028 (USD Million)

TABLE 302 Luxemburg Biopesticides Market, By Crops, 2019-2028 (USD Million)

TABLE 303 Luxemburg Fruits & Vegetables in Biopesticides Market, By Crops, 2019-2028 (USD Million)

TABLE 304 Luxemburg Cereal & Grains in Biopesticides Market, By Crops, 2019-2028 (USD Million)

TABLE 305 Luxemburg Oilseed & Pulses in Biopesticides Market, By Crops, 2019-2028 (USD Million)

TABLE 306 Rest of Europe Biopesticides Market, By TYPE, 2019-2028 (USD Million)

TABLE 307 Rest of Europe Biopesticides Market, By TYPE, 2019-2028 (tons)

TABLE 308 rest of europe Bioinsecticides in Biopesticides Market, By TYPE, 2019-2028 (USD Million)

TABLE 309 rest of europe Biofungicides in Biopesticides Market, By TYPE, 2019-2028 (USD Million)

TABLE 310 rest of europe Bionematicides in Biopesticides Market, By TYPE, 2019-2028 (tons)

TABLE 311 rest of europe Biopesticides Market, By Source, 2019-2028 (USD Million)

TABLE 312 rest of europe Microbial in Biopesticides Market, By Source, 2019-2028 (USD Million)

TABLE 313 rest of europe Biochemical in Biopesticides Market, By Source, 2019-2028 (USD Million)

TABLE 314 rest of europe Insect in Biopesticides Market, By Source, 2019-2028 (USD Million)

TABLE 315 rest of europe Biopesticides Market, By FORM, 2019-2028 (USD Million)

TABLE 316 rest of europe Liquid in Biopesticides Market, By FORM, 2019-2028 (USD Million)

TABLE 317 rest of europe dry in Biopesticides Market, By FORM, 2019-2028 (USD Million)

TABLE 318 Luxemburg Biopesticides Market, By Application, 2019-2028 (USD Million)

TABLE 319 rest of europe Biopesticides Market, By Category, 2019-2028 (USD Million)

TABLE 320 rest of europe Biopesticides Market, By Crops, 2019-2028 (USD Million)

TABLE 321 rest of europe Fruits & Vegetables in Biopesticides Market, By Crops, 2019-2028 (USD Million)

TABLE 322 rest of europe Cereal & Grains in Biopesticides Market, By Crops, 2019-2028 (USD Million)

TABLE 323 rest of europe Oilseed & Pulses in Biopesticides Market, By Crops, 2019-2028 (USD Million)

图片列表

FIGURE 1 Europe biopesticides MARKET: segmentation

FIGURE 2 EUROPE BIOPESTICIDES MARKET: data triangulation

FIGURE 3 Europe biopesticides MARKET: DROC ANALYSIS

FIGURE 4 Europe biopesticides MARKET: EUROPE VS REGIONAL MARKET ANALYSIS

FIGURE 5 EUROPE BIOPESTICIDES MARKET: COMPANY RESEARCH ANALYSIS

FIGURE 6 EUROPE BIOPESTICIDES MARKET: INTERVIEW DEMOGRAPHICS

FIGURE 7 Europe biopesticides MARKET: DBMR MARKET POSITION GRID

FIGURE 8 EUROPE BIOPESTICIDES MARKET: vendor share analysis

FIGURE 9 Europe biopesticides MARKET: SEGMENTATION

FIGURE 10 RISE IN FUNDING FOR BIOPESTICIDEs PRODUCTS is expected to drive the growth of the Europe biopesticides market IN THE FORECAST PERIOD of 2021 To 2028

FIGURE 11 bioinsecticides segment is expected to account for the largest share of the Europe biopesticides market in 2021 & 2028

FIGURE 12 DRIVERS, RESTRAINTS, OPPORTUNITIES AND CHALLENGES OF Europe Biopesticides Market

FIGURE 13 Europe biopesticides Market, By type, 2020

FIGURE 14 Europe biopesticides Market, By source, 2020

FIGURE 15 Europe Biopesticides Market, By FORM, 2020

FIGURE 16 Europe biopesticides market, By Application, 2020

FIGURE 17 The procedure for seed treatment is as follows-

FIGURE 18 Europe biopesticides market, By crop, 2020

FIGURE 19 Europe biopesticides Market, By Category, 2020

FIGURE 20 europe biopesticides market: SNAPSHOT (2020)

FIGURE 21 europe biopesticides market: BY COUNTRY (2020)

FIGURE 22 europe biopesticides market: BY COUNTRY (2021 & 2028)

FIGURE 23 europe biopesticides market: BY COUNTRY (2020 & 2028)

FIGURE 24 europe biopesticides market: BY TYPE, 2019-2028 (2021 & 2028)

FIGURE 25 Europe Biopesticides Market: company share 2020 (%)

查看详细信息 Right Arrow

研究方法

Data collection and base year analysis are done using data collection modules with large sample sizes. The stage includes obtaining market information or related data through various sources and strategies. It includes examining and planning all the data acquired from the past in advance. It likewise envelops the examination of information inconsistencies seen across different information sources. The market data is analysed and estimated using market statistical and coherent models. Also, market share analysis and key trend analysis are the major success factors in the market report. To know more, please request an analyst call or drop down your inquiry.

The key research methodology used by DBMR research team is data triangulation which involves data mining, analysis of the impact of data variables on the market and primary (industry expert) validation. Data models include Vendor Positioning Grid, Market Time Line Analysis, Market Overview and Guide, Company Positioning Grid, Patent Analysis, Pricing Analysis, Company Market Share Analysis, Standards of Measurement, Global versus Regional and Vendor Share Analysis. To know more about the research methodology, drop in an inquiry to speak to our industry experts.

可定制

Data Bridge Market Research is a leader in advanced formative research. We take pride in servicing our existing and new customers with data and analysis that match and suits their goal. The report can be customized to include price trend analysis of target brands understanding the market for additional countries (ask for the list of countries), clinical trial results data, literature review, refurbished market and product base analysis. Market analysis of target competitors can be analyzed from technology-based analysis to market portfolio strategies. We can add as many competitors that you require data about in the format and data style you are looking for. Our team of analysts can also provide you data in crude raw excel files pivot tables (Fact book) or can assist you in creating presentations from the data sets available in the report.

Frequently Asked Questions

Europe Biopesticides Market to grow at a rate of CAGR of 13.5% by forecast 2028
Europe Biopesticides Market expected value of USD 3,135.64 million by forecast 2028
The major players operating in the biopesticides market are Syngenta Crop Protection AG, Bionema, Vegalab SA, STK bio-ag technologies, Andermatt Biocontrol AG, Koppert Biological Systems, Corteva, Bayer AG, Biobest Group NV, Certis USA L.L.C., Valent BioSciences LLC, Novozymes, BASF SE, IPL Biologicals Limited, Terramera Inc., Khandelwal Bio Fertilizer, Isagro, Gowan Company, Parry America, Inc., Barrix Agro Sciences Pvt Ltd, BioWorks Inc., Marrone Bio Innovations, FMC Corporation, UPL, Nufarm, Bioline AgriSciences ltd, Biofa GmbH, BioConsortia, Inc., McLaughlin Gormley King Company, and W. Neudorff GmbH KG among others.
Europe Biopesticides Market segmented By Application such as Foliar Application, Seed Treatment, Soil Treatment, Fertigation, Others.