
Asia Pacific Third Party Logistics Market
市场规模(十亿美元)
CAGR :
% 
 USD
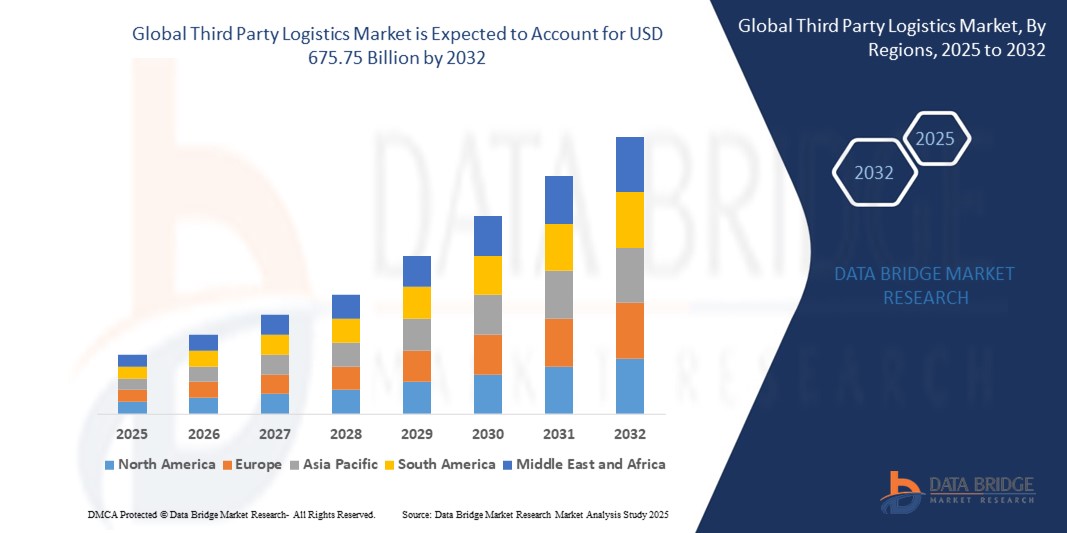
450.46 Billion
USD
675.75 Billion
2024
2032
USD
450.46 Billion
USD
675.75 Billion
2024
2032
| 2025 –2032 | |
| USD 450.46 Billion | |
| USD 675.75 Billion | |
| % | |
|
亞太地區第三方物流市場細分,按服務(國際運輸管理(ITM)、國內運輸管理(DTM)、倉儲、履行和配送(W&D)、專用合約運輸(DCC)/貨運代理和增值服務(VALS))、產品(空運、海運、陸運和合約物流)、供應商(整合和提供分包、快遞公司、小型和 B2B)、功能(供應鏈管理、客戶管理、店內營運、策略和規劃以及商品推銷)、垂直(零售和電子商務、製造、消費電子、醫療保健、汽車、半導體/太陽能、航空航天和國防等) - 行業趨勢和預測到 2032 年
第三方物流市場規模
- 2024 年亞太地區第三方物流市場規模為4,504.6 億美元,預估到 2032 年將達到 6,757.5 億美元,預測期內 複合年增長率為 5.20%。
- 市場成長主要受到貿易全球化程度不斷提高、供應鏈日益複雜以及對外包物流服務的日益依賴,以便高效管理不同地區的運輸、倉儲和配送功能
- 此外,採用運輸管理系統 (TMS)、倉庫自動化和即時追蹤平台等先進數位工具,可提高可見度、速度和成本效益,加速各行業採用第三方物流解決方案
第三方物流市場分析
- 第三方物流 (3PL) 供應商提供外包物流服務,包括運輸、倉儲、庫存管理、訂單履行和貨運代理,使公司能夠專注於核心競爭力,同時提高供應鏈效率和可擴展性
- 受電子商務擴張、製造業全球化以及消費者對快速交付日益增長的期望推動,對靈活、整合物流運營的需求不斷增長,推動了零售、汽車、醫療保健和消費品等垂直行業大力採用第三方物流服務
- 中國憑藉其全球製造業中心的地位以及強大的貨運和倉儲基礎設施,在 2024 年佔據第三方物流市場的主導地位,市場份額達 62%
- 由於對增值物流服務的需求不斷增長以及分銷網絡自動化程度不斷提高,預計日本將成為預測期內第三方物流市場成長最快的國家
- 由於跨境貿易激增、供應鏈全球化發展以及對高效貨運代理和報關服務的需求不斷增長,國際運輸管理 (ITM) 領域在 2024 年佔據了 36.4% 的市場份額,佔據主導地位。企業越來越依賴 ITM 供應商來應對複雜的國際法規、優化多式聯運路線並確保在全球市場上的及時交付。 ITM 解決方案能夠為國際貨運提供端到端的可視性、成本控制和即時跟踪,這進一步增強了其在不同地區運營的企業中的應用。
報告範圍和第三方物流市場細分
|
屬性 |
第三方物流關鍵市場洞察 |
|
涵蓋的領域 |
|
|
覆蓋國家 |
亞太
|
|
主要市場參與者 |
|
|
市場機會 |
|
|
加值資料資訊集 |
除了市場價值、成長率、市場區隔、地理覆蓋範圍、市場參與者和市場情景等市場洞察之外,Data Bridge 市場研究團隊策劃的市場報告還包括深入的專家分析、進出口分析、定價分析、生產消費分析和 pestle 分析。 |
第三方物流市場趨勢
“對綜合物流解決方案的需求不斷增加”
- 第三方物流市場正在經歷向綜合物流解決方案的重大轉變,該解決方案將運輸、倉儲、庫存管理和供應鏈分析整合到一個技術驅動的平台中,以滿足現代商業的複雜需求
- 例如,DHL供應鏈和DB Schenker等主要參與者正在擴大其服務組合,以提供完全整合的端到端物流解決方案——利用先進的軟體進行即時追蹤、自動化倉儲和無縫多式聯運
- 第三方物流供應商採用自動化、人工智慧、物聯網 (IoT) 和高級數據分析技術,增強了供應鏈可視性,改善了路線優化,並實現了預測性決策,從而最大限度地降低了成本和延誤
- 電子商務和全通路零售業的不斷擴張,擴大了對逆向物流、最後一哩配送和訂單客製化的需求,使得整合解決方案對零售商和製造商的吸引力越來越大
- 近岸外包和區域化趨勢,部分受地緣政治緊張局勢和對更具彈性的供應鏈的需求推動,促使企業尋求具有強大國內和跨境能力的第三方物流供應商
- 永續性和法規遵循的要求不斷提高,第三方物流公司投資環保車隊、綠色倉儲和報告工具,以滿足客戶和立法期望
第三方物流市場動態
司機
“智慧玻璃在汽車中的應用日益廣泛”
- 隨著製造商競相提高車輛舒適度、能源效率和豪華吸引力,智慧玻璃技術在汽車領域的應用正在迅速擴大,尤其是在 SUV 和高端車型中
- 例如,梅賽德斯-奔馳、寶馬和奧迪等領先汽車製造商正在將先進的智慧玻璃功能(如電致變色天窗和 SPD(懸浮顆粒裝置)智慧玻璃)整合到其旗艦車型中,從而提供動態燈光控制、顯著降低車廂溫度、改進能源管理和獨特造型等優勢
- 電動車和自動駕駛汽車越來越受歡迎,這些汽車通常具有大面積玻璃表面,包括全景天窗和 AR 擋風玻璃,這進一步推動了對具有增強的熱性能、光學性能和安全性能的創新智慧玻璃解決方案的需求
- 智慧玻璃的技術進步——包括更快的切換時間、人工智慧色調控制以及與車載感測器網路的整合——使這些功能更加用戶友好,並能適應不同的駕駛條件和用戶偏好
- 永續發展的要求和降低汽車排放的追求正在鼓勵製造商使用智慧玻璃來更好地控制氣候,從而減少對空調的依賴,降低燃料消耗,並延長電動車的行駛里程
克制/挑戰
“玻璃原料成本高”
- 儘管技術不斷進步,但製造汽車智慧玻璃所需的原材料成本高昂仍然是其廣泛應用的顯著障礙,尤其是在價格敏感的汽車領域
- 例如,優質材料和先進塗層——例如用於 PDLC(聚合物分散液晶)玻璃或懸浮顆粒裝置的高級聚合物——與傳統汽車玻璃相比增加了生產成本,這使得主流汽車製造商很難將這些技術整合到豪華車型之外
- 對專業製造流程、嚴格品質標準以及與汽車電子設備客製化整合的需求導致整個供應鏈的總體成本增加
- 全球主要原料供應的波動性,以及物流和遵守不斷變化的環境法規,進一步增加了智慧玻璃組件生產的複雜性和成本
- 因此,汽車智慧玻璃市場目前在高階和電動車領域最為強勁,而更廣泛的市場滲透將取決於未來材料和生產成本的降低
第三方物流市場範圍
市場根據服務、產品、提供者、應用、業務類型、功能和垂直進行細分。
- 按服務
根據服務類型,第三方物流市場細分為國際運輸管理 (ITM)、國內運輸管理 (DTM)、倉儲、履行和配送 (W&D)、專用合約運輸 (DCC)/貨運代理以及增值服務 (VALS)。受跨境貿易激增、供應鏈全球化程度不斷提高以及對高效貨運代理和報關服務需求不斷增長的推動,國際運輸管理 (ITM) 領域在 2024 年佔據了 36.4% 的最大市場收入份額。企業越來越依賴 ITM 供應商來應對複雜的國際法規、優化多式聯運路線並確保在全球市場及時交付。 ITM 解決方案能夠提供端到端的國際貨運可視性、成本控制和即時跟踪,這進一步增強了其在不同地區運營的企業中的應用。
預計加值服務 (VALS) 領域將在 2025 年至 2032 年間實現最快成長,這得益於對配套、組裝、包裝和產品客製化等專業物流能力日益增長的需求。隨著企業努力實現產品差異化並提升客戶滿意度,第三方物流供應商正從基礎的運輸服務商發展成為提供客製化端到端解決方案的策略合作夥伴。
- 按產品
根據產品類型,市場細分為空運、海運、陸運和合約物流。陸運板塊在2024年佔據了最大的市場收入份額,這得益於其在國內供應鏈中的核心地位以及在中短途配送中的成本效益。區域貿易協定的興起以及主要經濟體完善的道路基礎設施,進一步鞏固了陸運在確保準時交付和靈活路線方面的作用。
預計2025年至2032年期間,空運將迎來最快成長,這得益於對快速運輸的需求不斷增長,尤其是高價值、時效性強和易腐爛貨物的需求。跨境電子商務的蓬勃發展以及對快速交付的期望不斷提高,擴大了對空運服務的需求,尤其是在醫療保健、消費性電子產品和奢侈品等行業。
- 按提供者
根據供應商類型,市場細分為整合及提供分包物流的公司、快遞公司、小型貨運代理公司和運輸服務公司。整合及提供分包物流的公司在2024年佔據了最大的市場收入份額,這得益於其能夠提供端到端的可視性、規模經濟以及跨運輸、倉儲和配送功能的增值集成。這些公司越來越受到尋求簡化營運並利用即時追蹤、自動化和預測分析等先進物流技術的大型企業的青睞。
由於線上零售推動的B2C包裹遞送量激增,預計快遞公司將在預測期內創下最快成長率。快遞公司在最後一哩物流、靈活的配送時間和先進的追蹤系統方面的優勢,使其成為電子商務繁榮的關鍵推動者。
- 按應用
根據應用,市場細分為運輸、接收、退貨和包裝。受跨境貨物運輸量增加和分銷網絡日益複雜化的推動,運輸領域在2024年佔據了市場主導地位。越來越多的企業將運輸業務外包給第三方物流公司,以管理不斷上漲的運費、優化運輸時間並確保遵守國際貿易法規。
預計2025年至2032年期間,退貨市場的複合年增長率將達到最高,這得益於在線購物的快速增長以及消費者對便捷逆向物流日益增長的期望。高效管理產品退貨已成為零售商的策略重點,這促使零售商對能夠提供精簡、經濟高效的退貨解決方案的第三方物流合作夥伴的需求強勁。
- 依業務類型
根據業務類型,市場細分為B2C和B2B。 B2B領域在2024年佔據了最大的收入份額,反映了其在工業供應鏈和企業級物流外包中的關鍵作用。 B2B物流涉及大宗運輸、長期合約以及更複雜的路線和調度,因此嚴重依賴可靠的第三方物流供應商。
預計到2032年,B2C領域將以最快的速度成長,這得益於直銷品牌的激增以及線上零售滲透率的不斷提高。消費市場對靈活、可擴展且即時配送解決方案的需求持續加速了針對B2C營運的第三方物流服務的採用。
- 按功能
根據功能,市場細分為供應鏈管理、客戶管理、店內營運、策略與規劃以及商品銷售。供應鏈管理在2024年成為最大的細分市場,因為企業致力於在全球動盪的環境下提高營運效率和韌性。第三方物流 (3PL) 利用先進技術和整合平台來管理庫存、運輸和倉儲,在供應鏈優化中發揮關鍵作用。
預計客戶管理將在2025年至2032年間實現最快的成長,這得益於對提升終端客戶體驗的日益重視。企業依賴第三方物流提供個人化服務、精準的交付時間表和回應式支持,從而提升客戶滿意度和品牌忠誠度。
- 按垂直
按垂直產業細分,市場可分為零售和電商、製造業、消費性電子、醫療保健、汽車、半導體/太陽能、航空航太和國防等領域。零售和電商領域在2024年佔據了最大的市場收入份額,這得益於線上購物的爆炸式增長以及對敏捷、全通路物流解決方案的需求。零售商越來越依賴第三方物流(3PL)來管理配送中心、協調配送,並在需求高峰期擴大營運規模。
預計醫療保健領域將在預測期內實現最快成長,這得益於對溫度敏感且符合法規要求的物流服務需求的不斷增長。藥品、醫療器材和疫苗的全球分銷日益增長,使得擁有冷鏈物流和安全運輸能力的第三方物流供應商的重要性日益凸顯。
第三方物流市場區域分析
- 中國佔據第三方物流市場的主導地位,2024 年的收入份額最高,為 62%,這得益於其全球製造業中心的地位以及強大的貨運和倉儲基礎設施
- 出口量大、電子商務快速成長以及政府對「一帶一路」物流走廊的戰略投資鞏固了中國在跨境和國內第三方物流運營中的領導地位
- 主要第三方物流供應商、強大的數位物流平台和綜合運輸網路的存在進一步提升了中國的物流效率和服務能力
日本第三方物流市場洞察
預計在2025年至2032年的預測期內,日本第三方物流市場將實現亞太地區最快的複合年增長率,這得益於增值物流服務需求的不斷增長以及分銷網絡自動化程度的不斷提高。日本重視準時配送、精準物流和節能運營,這使得第三方物流合作在汽車、電子和零售等產業中變得至關重要。此外,日本人口老化和勞動力短缺正在加速採用外包物流和技術驅動的解決方案,以確保供應鏈的彈性和可擴展性。
印度第三方物流市場洞察
印度第三方物流市場預計將在2025年至2032年期間穩定成長。快速的城市化、蓬勃發展的電子商務以及物流管理的數位轉型推動了這一成長。諸如國家物流政策和Gati Shakti(印度政府)下屬的基礎設施建設等政府措施正在增強多式聯運的連通性和倉儲能力。國內第三方物流企業日益壯大,二、三線城市的需求不斷增長,以及企業對供應鏈優化日益增長的重視,正在推動市場擴張。
第三方物流市場佔有率
第三方物流行業主要由知名公司主導,包括:
- DHL國際有限公司(德國)
- 聯邦快遞(美國)
- XPO Logistics, Inc.(美國)
- Kuehne+Nagel(瑞士)
- Schenker AG(德國)
- DSV(丹麥)
- 華盛頓 Expeditors International 公司(美國)
- CH Robinson Worldwide, Inc.(美國)
- 法國國家鐵路公司(SNCF)
- 日本通運株式會社(日本)
- Toll Holdings Limited(澳洲)
- CJ物流株式會社(韓國)
- Kintetsu World Express, Inc.(日本)
- 薩穆德拉航運有限公司(新加坡)
- PT。 Cipta Mapan Logistic(印尼)
- 嘉里物流網絡有限公司(香港)
- 中國外運股份有限公司(中國)
- 日立運輸系統有限公司(日本)
- 日本郵船株式會社(日本)
亞太地區第三方物流市場最新動態
- 2023年5月,BDP International, Inc. 和PSA Cargo Solutions 推出聯合品牌PSA BDP,標誌著雙方旨在增強全球第三方物流能力的策略整合。透過將PSA以港口為中心的物流專長與BDP在供應鏈管理領域的強大實力相結合,此次合作將提供涵蓋多式聯運、倉儲和端到端供應鏈可視性等更廣泛的服務。此次品牌重塑增強了雙方在綜合物流解決方案方面的競爭力,特別助力化工、生命科學和工業製造領域的客戶。
- 2023年3月,Americold Logistics LLC宣布投資總部位於杜拜的冷藏公司RSA Cold Chain,以建立一個涵蓋中東和印度的可擴展物流平台。此次擴張支持了Americold的全球成長策略,使其能夠滿足食品、製藥和零售等對溫度敏感產業日益增長的需求。此舉也增強了Americold在新興市場的業務能力,這些市場人口成長和電子商務活動正在推動對先進冷鏈基礎設施的需求。
- 2022年12月,康寧公司與LG電子合作,採用冷成型技術共同開發用於汽車內裝的曲面顯示模組。與傳統的玻璃成型方法相比,這項製造創新可減少25%的碳排放,符合汽車原始設備製造商的永續發展目標。此次合作順應了日益增長的沉浸式和高科技車載用戶體驗趨勢,並使康寧成為不斷發展的汽車顯示生態系統中的關鍵供應商。
- 2022年4月,福耀集團透過其美國子公司福耀玻璃美國公司,擴大了在南卡羅來納州格林維爾縣的業務,投資3,450萬美元,創造了121個新工作。此次擴張強化了福耀致力於服務北美汽車市場在地化、減少對進口的依賴以及提升供應鏈應變能力的承諾。這項投資增強了福耀在美國的製造佈局,在汽車產量增加和主機廠本地化進程推進的背景下,滿足了對高性能汽車玻璃解決方案日益增長的需求。
SKU-
Get online access to the report on the World's First Market Intelligence Cloud

- Interactive Data Analysis Dashboard
- Company Analysis Dashboard for high growth potential opportunities
- Research Analyst Access for customization & queries
- Competitor Analysis with Interactive dashboard
- Latest News, Updates & Trend analysis
- Harness the Power of Benchmark Analysis for Comprehensive Competitor Tracking
研究方法
数据收集和基准年分析是使用具有大样本量的数据收集模块完成的。该阶段包括通过各种来源和策略获取市场信息或相关数据。它包括提前检查和规划从过去获得的所有数据。它同样包括检查不同信息源中出现的信息不一致。使用市场统计和连贯模型分析和估计市场数据。此外,市场份额分析和关键趋势分析是市场报告中的主要成功因素。要了解更多信息,请请求分析师致电或下拉您的询问。
DBMR 研究团队使用的关键研究方法是数据三角测量,其中包括数据挖掘、数据变量对市场影响的分析和主要(行业专家)验证。数据模型包括供应商定位网格、市场时间线分析、市场概览和指南、公司定位网格、专利分析、定价分析、公司市场份额分析、测量标准、全球与区域和供应商份额分析。要了解有关研究方法的更多信息,请向我们的行业专家咨询。
可定制
Data Bridge Market Research 是高级形成性研究领域的领导者。我们为向现有和新客户提供符合其目标的数据和分析而感到自豪。报告可定制,包括目标品牌的价格趋势分析、了解其他国家的市场(索取国家列表)、临床试验结果数据、文献综述、翻新市场和产品基础分析。目标竞争对手的市场分析可以从基于技术的分析到市场组合策略进行分析。我们可以按照您所需的格式和数据样式添加您需要的任意数量的竞争对手数据。我们的分析师团队还可以为您提供原始 Excel 文件数据透视表(事实手册)中的数据,或者可以帮助您根据报告中的数据集创建演示文稿。

