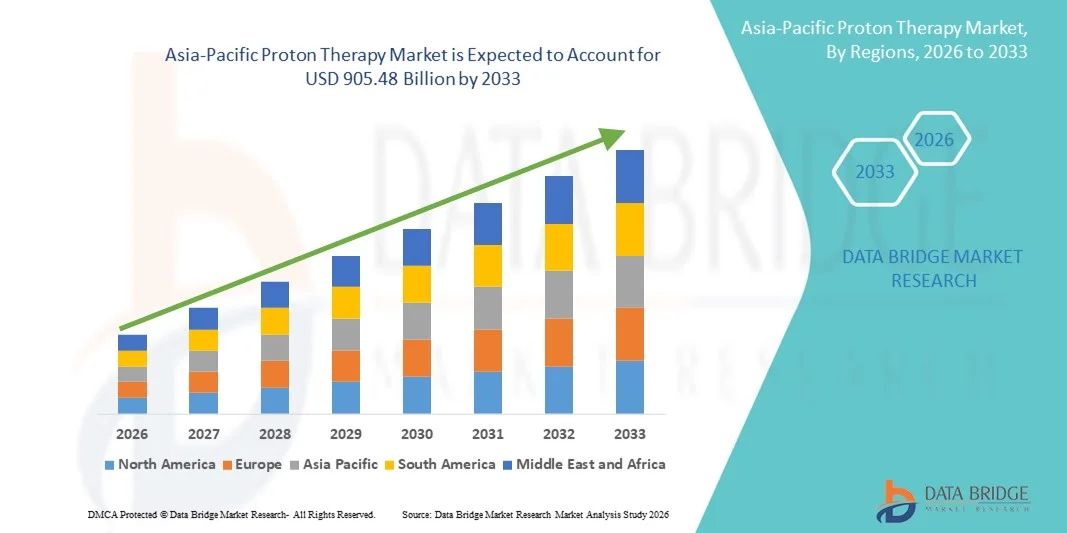
亚太质子治疗市场 – 行业趋势及 2028 年预测

请求目录 请求目录 与分析师交谈 与分析师交谈 立即购买 立即购买 购买前请咨询 提前咨询 免费样本报告 免费样本报告

亚太质子治疗市场 – 行业趋势及 2028 年预测

  • Healthcare
  • Published Report
  • Mar 2021
  • Asia-Pacific
  • 350 页面
  • 桌子數: 181
  • 图号: 44

>亚太质子治疗市场,按产品类型(系统、软件、服务)、组件(质子加速器、光束传输系统、光束传输系统、喷嘴、图像查看器、患者定位系统 (PPS))、类型(旋转质子治疗系统、非旋转质子治疗系统)、设置系统(多房间系统、紧凑/单房间系统)、应用类型(治疗应用、研究应用)、最终用户(医院、门诊手术中心、癌症研究机构)、国家(中国、韩国、日本、印度、澳大利亚、新加坡、马来西亚、印度尼西亚、泰国、菲律宾和亚太其他地区)划分,行业趋势和预测至 2028 年

亚太质子治疗市场市场分析与洞察:亚太质子治疗市场

质子治疗市场预计将在 2021 年至 2028 年的预测期内实现市场增长。Data Bridge Market Research 分析,在 2021 年至 2028 年的预测期内,该市场将以 7.0% 的复合年增长率增长,预计到 2028 年将达到 1.1755 亿美元。质子治疗中心数量的增加预计将推动质子治疗市场的增长。

质子治疗是最精确和准确的放射治疗,它利用质子粒子的能量杀死癌细胞或特定位置的目标细胞。质子治疗克服了光子治疗或其他粒子治疗的主要局限性。技术的进步增加了质子治疗在世界各地治疗各种癌症的应用。

致癌病毒和缺陷基因的存在加重了人们患癌症的负担。因此,癌症患病率的上升成为质子治疗市场增长的驱动力。质子治疗的高成本导致治疗费用高昂,制约了质子治疗市场的增长。由于该领域的研究和开发不断涌现,越来越多的临床数据展示了质子治疗的好处,因此人们的认识不断提高。因此,对质子治疗的日益认可为质子治疗市场的增长提供了机会。与其他技术相比,治疗费用昂贵,制约了其在质子治疗市场的增长。

质子治疗市场提供了市场份额、新发展和产品线分析、国内和本地市场参与者的影响的详细信息,分析了新兴收入领域、市场法规变化、产品审批、战略决策、产品发布、地域扩张和市场技术创新方面的机会。要了解分析和质子治疗市场情况,请联系我们获取分析师简报,我们的团队将帮助您创建收入影响解决方案,以实现您的预​​期目标。

亚太质子治疗市场质子治疗市场范围和市场规模

质子治疗市场根据产品类型、组件、类型、设置系统、应用类型和最终用户分为六个显著的细分市场。细分市场之间的增长有助于您分析利基增长领域和进入市场的策略,并确定您的核心应用领域和目标市场的差异。

  • 根据产品类型,质子治疗市场分为系统、软件和服务。2021 年,系统部分预计将主导质子治疗市场,因为随着全球医疗保健基础设施的增加,质子治疗系统的采用率不断提高。
  • 根据组件,质子治疗市场细分为质子加速器、光束传输系统、光束传输系统、喷嘴、图像查看器和患者定位系统 (PPS)。由于技术进步导致各种新型质子加速器的开发,预计到 2021 年,质子加速器部分将主导质子治疗市场。
  • 根据类型,质子治疗市场分为旋转质子治疗系统和非旋转质子治疗系统。2021 年,旋转质子治疗系统预计将主导质子治疗市场,因为它能够从各个角度为患者提供精确的治疗。
  • 根据设置系统,质子治疗市场分为多室系统和紧凑/单室系统。2021 年,多室系统将主导质子治疗市场,因为与紧凑系统相比,它是更经济的选择。
  • 根据应用类型,质子治疗市场分为治疗应用和研究应用。2021 年,治疗应用领域将主导质子治疗市场,因为随着全球癌症患病率的上升,质子治疗系统的采用率将不断提高。
  • 根据最终用户,质子治疗市场分为医院、门诊手术中心和癌症研究机构。2021 年,医院将主导质子治疗市场,因为它是患者诊断和治疗癌症或急诊等任何慢性疾病的主要场所。

亚太质子治疗市场国家级分析

对亚太质子治疗市场进行了分析,并按国家、产品类型、组件、类型、设置系统、应用类型和最终用户提供了市场规模信息。

亚太质子治疗市场报告涵盖的国家包括中国、韩国、日本、印度、澳大利亚、新加坡、马来西亚、印度尼西亚、泰国、菲律宾和亚太其他地区。

由于人口老龄化程度较高且公众意识增强,中国在亚太质子治疗市场占据主导地位,预计将推动质子治疗市场的增长。

报告的国家部分还提供了影响单个市场因素和国内市场法规变化,这些变化影响了市场的当前和未来趋势。新销售、替代销售、国家人口统计、监管法案和进出口关税等数据点是用于预测单个国家市场情景的一些主要指标。此外,在提供国家数据的预测分析时,还考虑了亚太品牌的存在和可用性以及它们因来自本地和国内品牌的激烈或稀少竞争而面临的挑战、销售渠道的影响。

制造商推出的新产品为质子治疗市场参与者创造了新的机会

质子治疗市场还为您提供每个国家美容行业增长的详细市场分析,包括质子治疗市场销售、质子治疗市场发展的影响以及监管环境的变化及其对质子治疗市场的支持。数据涵盖 2011 年至 2019 年的历史时期。

竞争格局和质子治疗市场份额分析

质子治疗市场竞争格局按竞争对手提供详细信息。详细信息包括公司概况、公司财务状况、产生的收入、市场潜力、研发投资、新市场计划、生产基地和设施、公司优势和劣势、产品发布、产品试验渠道、产品批准、专利、产品宽度和广度、应用主导地位、技术生命线曲线。以上提供的数据点仅与公司对亚太质子治疗市场的关注有关。

亚太质子治疗市场报告涵盖的主要参与者包括 Varian Medical Systems, Inc.、Mevion Medical Systems、日立有限公司、住友重工业有限公司、荷兰皇家飞利浦公司、IBA Worldwide、Elekta AB、通用电气公司、RaySearch Laboratories 以及其他国内参与者。DBMR 分析师了解竞争优势,并为每个竞争对手分别提供竞争分析。

全球各地的公司也推出了许多产品并签署了多项协议,这也加速了质子治疗市场的发展。

例如,

  • 2021 年 12 月,IBA Worldwide 将于 2021 年 12 月 1 日至 12 月 3 日参加在维也纳(奥地利)举行的 FRPT 大会 2021。这将成为公司展示 IBA 质子治疗和 IBA 剂量测定产品的平台。

市场参与者的合作、合资和其他策略正在增强质子治疗市场中的公司市场,这也为组织改善其对质子治疗市场的供应提供了好处。


SKU-

Get online access to the report on the World's First Market Intelligence Cloud

  • Interactive Data Analysis Dashboard
  • Company Analysis Dashboard for high growth potential opportunities
  • Research Analyst Access for customization & queries
  • Competitor Analysis with Interactive dashboard
  • Latest News, Updates & Trend analysis
  • Harness the Power of Benchmark Analysis for Comprehensive Competitor Tracking
Request for Demo

目录

  1. introduction
    1. OBJECTIVES OF THE STUDY
    2. MARKET DEFINITION
    3. OVERVIEW of ASIA-PACIFIC PROTON THERAPY MARKET
    4. Currency and pricing
    5. LIMITATIONs
    6. MARKETS COVERED
  2. MARKET SEGMENTATION
    1. MARKETS COVERED
    2. geographical scope
    3. years considered for the study
    4. DBMR TRIPOD DATA VALIDATION MODEL
    5. primary interviews with key opinion leaders
    6. MULTIVARIATE MODELLING
    7. product TYPE LIFELINE CURVE
    8. DBMR MARKET POSITION GRID
    9. VENDOR SHARE ANALYSIS
    10. MARKET application type COVERAGE GRID
    11. secondary sourcEs
    12. assumptions
  3. EXECUTIVE SUMMARY
  4. premium insight
  5. Asia-Pacific proton therapy market: regulations
  6. Market Overview
    1. drivers
      1. Rising number of proton therapy centers
      2. Increasing prevalence of cancer
      3. Advantages offered by the proton therapy treatment in cancer
      4. Increasing funding for cancer research
      5. Higher Aging Population
    2. Restraints
      1. High cost of installation of instrument
      2. lack of reimbursement
    3. OPPORTUNITIES
      1. Growing recognition of proton therapy
      2. Increasing healthcare expenditure
      3. strategic initiatives by key market players
      4. Introduction of proton therapy in emerging economies
    4. CHALLENGEs
      1. Expensive treatment as compared to other technologies
      2. Requirement of large space
  7. COVID-19 IMPACT ON ASIA-PACIFIC PROTON THERAPY MARKET
    1. PRICE IMPACT
    2. IMPACT ON SUPPLY CHAIN
    3. IMPACT ON DEMAND
    4. STRATEGIC DECISIONS FOR MANUFACTURERS
    5. CONCLUSION
  8. Asia-Pacific proton therapy market, By product type
    1. overview
    2. Systems
      1. Accelerators
        1. CYCLOTRONS
        2. SYNCHROTRONS
      2. Beam Delivery
        1. PENCIL BEAM SCANNING
        2. PASSIVE SCATTERING
        3. UNIFORM SCANNING
      3. Modulators
      4. Others
    3. Software
    4. Services
  9. Asia-Pacific proton therapy market, By component
    1. overview
    2. Proton Accelerator
      1. Cyclotrons
      2. Synchrotrons
      3. Synchrocyclotrons
      4. Linacs
      5. H-Minus Synchrotrons
      6. Separated Sector Cyclotrons
      7. Super-Conducting Cyclotrons
      8. Fast Cycling Synchrotron
    3. Beam Transport System
    4. Beam Delivery System
      1. The Passive Scattering Technique
      2. Beam Scanning
    5. Nozzle
      1. Pencil Scanning Nozzle
      2. Single Scattering
      3. Double Scattering
      4. Uniform Scanning Nozzle
    6. Image Viewers
    7. Patient Positioning System (PPS)
  10. Asia-Pacific proton therapy market, By type
    1. overview
    2. Rotating Proton Therapy Systems
    3. Non Rotating Proton Therapy Systems
  11. Asia-Pacific proton therapy market, By set-up systems
    1. overview
    2. MULTI-ROOM SYSTEMS
    3. Compact/ Single-Room Systems
  12. Asia-Pacific proton therapy market, By application type
    1. overview
    2. Treatment Applications
      1. Pediatric Cancer
      2. Tumors in the Base of the Skull
      3. Prostate Cancer
      4. Head & Neck Cancer
      5. breast Cancer
      6. Lung Cancer
      7. Tumors Affecting Spine
      8. Eye Melanoma
      9. Lymphoma
      10. Pituitary Gland Tumors
      11. Others
    3. Research Applications
  13. Asia-Pacific proton therapy market, By end user
    1. overview
    2. Hospitals
    3. Ambulatory Surgical Centers
    4. Cancer Research Institutes
  14. Asia-Pacific proton therapy market, BY GEOGRAPHY
    1. OVERVIEW
      1. JAPAN
      2. CHINA
      3. SOUTH KOREA
      4. INDIA
      5. AUSTRALIA
      6. SINGAPORE
      7. THAILAND
      8. MALAYSIA
      9. INDONESIA
      10. PHILIPPINES
      11. REST OF ASIA-PACIFIC
  15. Asia-Pacific proton therapy market: COMPANY landscape
    1. company share analysis: Asia-Pacific
  16. swot
  17. company profile
    1. Iba worldwide
      1. COMPANY SNAPSHOT
      2. REVENUE ANALYSIS
      3. PRODUCT PORTFOLIO
      4. RECENT DEVELOPMENTS
    2. Hitachi, Ltd.
      1. COMPANY SNAPSHOT
      2. REVENUE ANALYSIS
      3. PRODUCT PORTFOLIO
      4. RECENT DEVELOPMENT
    3. ELEKTA Ab
      1. COMPANY SNAPSHOT
      2. REVENUE ANALYSIS
      3. PRODUCT PORTFOLIO
      4. RECENT DEVELOPMENT
    4. varian medical systems, inc.
      1. COMPANY SNAPSHOT
      2. REVENUE ANALYSIS
      3. PRODUCT PORTFOLIO
      4. RECENT DEVELOPMENTS
    5. Sumitomo heavy industries, ltd.
      1. COMPANY SNAPSHOT
      2. revenue analysis
      3. PRODUCT PORTFOLIO
      4. RECENT DEVELOPMENTS
    6. GENERAL ELECTRIC COMPANY
      1. COMPANY SNAPSHOT
      2. REVENUE ANALYSIS
      3. PRODUCT PORTFOLIO
      4. RECENT DEVELOPMENTS
    7. koninklijke philips n.v.
      1. COMPANY SNAPSHOT
      2. REVENUE ANALYSIS
      3. PRODUCT PORTFOLIO
      4. RECENT DEVELOPMENTs
    8. mevion medical systems
      1. COMPANY SNAPSHOT
      2. PRODUCT PORTFOLIO
      3. RECENT DEVELOPMENTS
    9. RaySearch Laboratories
      1. COMPANY SNAPSHOT
      2. REVENUE ANALYSIS
      3. PRODUCT PORTFOLIO
      4. RECENT DEVELOPMENTS
  18. questionnaire
  19. related reports

表格列表

TABLE 1 list of some proton therapy facilities under construction

TABLE 2 list of Funding by cancer Research Areas (2013-2018)

TABLE 3 General and Medical Inflation Rates for Selected Countries

TABLE 4 list of some operational proton therapy facilities in emerging economies

TABLE 5 list of some proton therapy facilities under construction in emerging economies

TABLE 6 Asia-Pacific proton therapy market, By product type, 2019-2028 (USD million)

TABLE 7 asia-pacific systems in Proton Therapy Market, By Product type 2019-2028 (USD Million)

TABLE 8 asia-pacific accelerators in Proton Therapy Market, By Product type 2019-2028 (USD Million)

TABLE 9 asia-pacific Beam Delivery in Proton Therapy Market, By Product Type 2019-2028 (USD Million)

TABLE 10 Asia-Pacific proton therapy market, By component, 2019-2028 (USD million)

TABLE 11 asia-pacific Proton Accelerator Proton in Therapy Market, By Component 2019-2028 (USD Million)

TABLE 12 asia-pacific Beam Delivery System in Proton Accelerator Proton in Therapy Market, By Component 2019-2028 (USD Million)

TABLE 13 asia-pacific nozzle in Proton Accelerator Proton in Therapy Market, By Component 2019-2028 (USD Million)

TABLE 14 Asia-Pacific proton therapy market, By type, 2019-2028 (USD million)

TABLE 15 Asia-Pacific proton therapy market, By set-up systems, 2019-2028 (USD million)

TABLE 16 Asia-Pacific proton therapy market, By application type, 2019-2028 (USD million)

TABLE 17 asia-pacific treatment applications in Proton Therapy Market, 2019-2028 (USD Million)

TABLE 18 Asia-Pacific proton therapy market, By end user, 2019-2028 (USD million)

TABLE 19 ASIA-PACIFIC PROTON THERAPY MARKET, BY COUNTRY, 2019-2028 (USD MILLION)

TABLE 20 Asia-Pacific proton therapy market, By Product, 2019-2028 (USD Million)

TABLE 21 ASIA-PACIFIC Systems in Proton Therapy Market, By Product Type 2019-2028 (USD Million)

TABLE 22 ASIA-PACIFIC Accelerators in Proton Therapy Market, By Product Type 2019-2028 (USD Million)

TABLE 23 ASIA-PACIFIC Beam Delivery in Proton Therapy Market, By Product Type 2019-2028 (USD Million)

TABLE 24 Asia-Pacific proton therapy market, By Component 2019-2028 (USD Million)

TABLE 25 ASIA-PACIFIC ACCELERATOR IN PROTON THERAPY MARKET, By Component 2019-2028 (USD Million)

TABLE 26 ASIA-PACIFIC BEAM DELIVERY SYSTEM IN PROTON THERAPY MARKET, By Component 2019-2028 (USD Million)

TABLE 27 ASIA-PACIFIC NOZZLE IN PROTON THERAPY MARKET, By Component 2019-2028 (USD Million)

TABLE 28 Asia-Pacific proton therapy market, By Type, 2019-2028 (USD Million)

TABLE 29 Asia-Pacific proton therapy market, By Set-Up Systems, 2019-2028 (USD Million)

TABLE 30 Asia-Pacific proton therapy market, By Application Type, 2019-2028 (USD Million)

TABLE 31 ASIA-PACIFIC TREATMENT APPLICATIONS IN PROTON THERAPY MARKET, By Application, 2019-2028 (USD Million)

TABLE 32 Asia-Pacific proton therapy market, By End User, 2019-2028 (USD Million)

TABLE 33 JAPAN proton therapy MARKET, By Product, 2019-2028 (USD Million)

TABLE 34 JAPAN Systems in Proton Therapy Market, By Product Type 2019-2028 (USD Million)

TABLE 35 JAPAN Accelerators in Proton Therapy Market, By Product Type 2019-2028 (USD Million)

TABLE 36 JAPAN Beam Delivery in Proton Therapy Market, By Product Type 2019-2028 (USD Million)

TABLE 37 JAPAN Proton Therapy Market, By Component 2019-2028 (USD Million)

TABLE 38 JAPAN ACCELERATOR IN PROTON THERAPY MARKET, By Component 2019-2028 (USD Million)

TABLE 39 JAPAN BEAM DELIVERY SYSTEM IN PROTON THERAPY MARKET, By Component 2019-2028 (USD Million)

TABLE 40 JAPAN NOZZLE IN PROTON THERAPY MARKET, By Component 2019-2028 (USD Million)

TABLE 41 JAPAN Proton Therapy Market, By Type, 2019-2028 (USD Million)

TABLE 42 JAPAN Proton Therapy Market, By Set-Up Systems, 2019-2028 (USD Million)

TABLE 43 JAPAN Proton Therapy Market, By Application Type, 2019-2028 (USD Million)

TABLE 44 JAPAN TREATMENT APPLICATIONS IN PROTON THERAPY MARKET, By Application, 2019-2028 (USD Million)

TABLE 45 JAPAN Proton Therapy Market, By End User, 2019-2028 (USD Million)

TABLE 46 CHINA proton therapy MARKET, By Product, 2019-2028 (USD Million)

TABLE 47 CHINA Systems in Proton Therapy Market, By Product Type 2019-2028 (USD Million)

TABLE 48 CHINA Accelerators in Proton Therapy Market, By Product Type 2019-2028 (USD Million)

TABLE 49 CHINA Beam Delivery in Proton Therapy Market, By Product Type 2019-2028 (USD Million)

TABLE 50 CHINA Proton Therapy Market, By Component 2019-2028 (USD Million)

TABLE 51 CHINA ACCELERATOR IN PROTON THERAPY MARKET, By Component 2019-2028 (USD Million)

TABLE 52 CHINA BEAM DELIVERY SYSTEM IN PROTON THERAPY MARKET, By Component 2019-2028 (USD Million)

TABLE 53 CHINA NOZZLE IN PROTON THERAPY MARKET, By Component 2019-2028 (USD Million)

TABLE 54 CHINA Proton Therapy Market, By Type, 2019-2028 (USD Million)

TABLE 55 CHINA Proton Therapy Market, By Set-Up Systems, 2019-2028 (USD Million)

TABLE 56 CHINA Proton Therapy Market, By Application Type, 2019-2028 (USD Million)

TABLE 57 CHINA TREATMENT APPLICATIONS IN PROTON THERAPY MARKET, By Application, 2019-2028 (USD Million)

TABLE 58 CHINA Proton Therapy Market, By End User, 2019-2028 (USD Million)

TABLE 59 SOUTH KOREA proton therapy MARKET, By Product, 2019-2028 (USD Million)

TABLE 60 SOUTH KOREA Systems in Proton Therapy Market, By Product Type 2019-2028 (USD Million)

TABLE 61 SOUTH KOREA Accelerators in Proton Therapy Market, By Product Type 2019-2028 (USD Million)

TABLE 62 SOUTH KOREA Beam Delivery in Proton Therapy Market, By Product Type 2019-2028 (USD Million)

TABLE 63 SOUTH KOREA Proton Therapy Market, By Component 2019-2028 (USD Million)

TABLE 64 SOUTH KOREA ACCELERATOR IN PROTON THERAPY MARKET, By Component 2019-2028 (USD Million)

TABLE 65 SOUTH KOREA BEAM DELIVERY SYSTEM IN PROTON THERAPY MARKET, By Component 2019-2028 (USD Million)

TABLE 66 SOUTH KOREA NOZZLE IN PROTON THERAPY MARKET, By Component 2019-2028 (USD Million)

TABLE 67 SOUTH KOREA Proton Therapy Market, By Type, 2019-2028 (USD Million)

TABLE 68 SOUTH KOREA Proton Therapy Market, By Set-Up Systems, 2019-2028 (USD Million)

TABLE 69 SOUTH KOREA Proton Therapy Market, By Application Type, 2019-2028 (USD Million)

TABLE 70 SOUTH KOREA TREATMENT APPLICATIONS IN PROTON THERAPY MARKET, By Application, 2019-2028 (USD Million)

TABLE 71 SOUTH KOREA Proton Therapy Market, By End User, 2019-2028 (USD Million)

TABLE 72 INDIA proton therapy MARKET, By Product, 2019-2028 (USD Million)

TABLE 73 INDIA Systems in Proton Therapy Market, By Product Type 2019-2028 (USD Million)

TABLE 74 INDIA Accelerators in Proton Therapy Market, By Product Type 2019-2028 (USD Million)

TABLE 75 INDIA Beam Delivery in Proton Therapy Market, By Product Type 2019-2028 (USD Million)

TABLE 76 INDIA Proton Therapy Market, By Component 2019-2028 (USD Million)

TABLE 77 INDIA ACCELERATOR IN PROTON THERAPY MARKET, By Component 2019-2028 (USD Million)

TABLE 78 INDIA BEAM DELIVERY SYSTEM IN PROTON THERAPY MARKET, By Component 2019-2028 (USD Million)

TABLE 79 INDIA NOZZLE IN PROTON THERAPY MARKET, By Component 2019-2028 (USD Million)

TABLE 80 INDIA Proton Therapy Market, By Type, 2019-2028 (USD Million)

TABLE 81 INDIA Proton Therapy Market, By Set-Up Systems, 2019-2028 (USD Million)

TABLE 82 INDIA Proton Therapy Market, By Application Type, 2019-2028 (USD Million)

TABLE 83 INDIA TREATMENT APPLICATIONS IN PROTON THERAPY MARKET, By Application, 2019-2028 (USD Million)

TABLE 84 INDIA Proton Therapy Market, By End User, 2019-2028 (USD Million)

TABLE 85 AUSTRALIA proton therapy MARKET, By Product, 2019-2028 (USD Million)

TABLE 86 AUSTRALIA Systems in Proton Therapy Market, By Product Type 2019-2028 (USD Million)

TABLE 87 AUSTRALIA Accelerators in Proton Therapy Market, By Product Type 2019-2028 (USD Million)

TABLE 88 AUSTRALIA Beam Delivery in Proton Therapy Market, By Product Type 2019-2028 (USD Million)

TABLE 89 AUSTRALIA Proton Therapy Market, By Component 2019-2028 (USD Million)

TABLE 90 AUSTRALIA ACCELERATOR IN PROTON THERAPY MARKET, By Component 2019-2028 (USD Million)

TABLE 91 AUSTRALIA BEAM DELIVERY SYSTEM IN PROTON THERAPY MARKET, By Component 2019-2028 (USD Million)

TABLE 92 aUSTRALIA NOZZLE IN PROTON THERAPY MARKET, By Component 2019-2028 (USD Million)

TABLE 93 AUSTRALIA Proton Therapy Market, By Type, 2019-2028 (USD Million)

TABLE 94 AUSTRALIA Proton Therapy Market, By Set-Up Systems, 2019-2028 (USD Million)

TABLE 95 AUSTRALIA Proton Therapy Market, By Application Type, 2019-2028 (USD Million)

TABLE 96 AUSTRALIA TREATMENT APPLICATIONS IN PROTON THERAPY MARKET, By Application, 2019-2028 (USD Million)

TABLE 97 AUSTRALIA Proton Therapy Market, By End User, 2019-2028 (USD Million)

TABLE 98 SINGAPORE proton therapy MARKET, By Product, 2019-2028 (USD Million)

TABLE 99 SINGAPORE Systems in Proton Therapy Market, By Product Type 2019-2028 (USD Million)

TABLE 100 SINGAPORE Accelerators in Proton Therapy Market, By Product Type 2019-2028 (USD Million)

TABLE 101 SINGAPORE Beam Delivery in Proton Therapy Market, By Product Type 2019-2028 (USD Million)

TABLE 102 SINGAPORE Proton Therapy Market, By Component 2019-2028 (USD Million)

TABLE 103 SINGAPORE ACCELERATOR IN PROTON THERAPY MARKET, By Component 2019-2028 (USD Million)

TABLE 104 SINGAPORE BEAM DELIVERY SYSTEM IN PROTON THERAPY MARKET, By Component 2019-2028 (USD Million)

TABLE 105 SINGAPORE NOZZLE IN PROTON THERAPY MARKET, By Component 2019-2028 (USD Million)

TABLE 106 SINGAPORE Proton Therapy Market, By Type, 2019-2028 (USD Million)

TABLE 107 SINGAPORE Proton Therapy Market, By Set-Up Systems, 2019-2028 (USD Million)

TABLE 108 SINGAPORE Proton Therapy Market, By Application Type, 2019-2028 (USD Million)

TABLE 109 SINGAPORE TREATMENT APPLICATIONS IN PROTON THERAPY MARKET, By Application, 2019-2028 (USD Million)

TABLE 110 SINGAPORE Proton Therapy Market, By End User, 2019-2028 (USD Million)

TABLE 111 THAILAND proton therapy MARKET, By Product, 2019-2028 (USD Million)

TABLE 112 THAILAND Systems in Proton Therapy Market, By Product Type 2019-2028 (USD Million)

TABLE 113 THAILAND Accelerators in Proton Therapy Market, By Product Type 2019-2028 (USD Million)

TABLE 114 THAILAND Beam Delivery in Proton Therapy Market, By Product Type 2019-2028 (USD Million)

TABLE 115 THAILAND Proton Therapy Market, By Component 2019-2028 (USD Million)

TABLE 116 THAILAND ACCELERATOR IN PROTON THERAPY MARKET, By Component 2019-2028 (USD Million)

TABLE 117 THAILAND BEAM DELIVERY SYSTEM IN PROTON THERAPY MARKET, By Component 2019-2028 (USD Million)

TABLE 118 THAILAND NOZZLE IN PROTON THERAPY MARKET, By Component 2019-2028 (USD Million)

TABLE 119 THAILAND Proton Therapy Market, By Type, 2019-2028 (USD Million)

TABLE 120 THAILAND Proton Therapy Market, By Set-Up Systems, 2019-2028 (USD Million)

TABLE 121 THAILAND Proton Therapy Market, By Application Type, 2019-2028 (USD Million)

TABLE 122 THAILAND TREATMENT APPLICATIONS IN PROTON THERAPY MARKET, By Application, 2019-2028 (USD Million)

TABLE 123 THAILAND Proton Therapy Market, By End User, 2019-2028 (USD Million)

TABLE 124 MALAYSIA proton therapy MARKET, By Product, 2019-2028 (USD Million)

TABLE 125 MALAYSIA Systems in Proton Therapy Market, By Product Type 2019-2028 (USD Million)

TABLE 126 MALAYSIA Accelerators in Proton Therapy Market, By Product Type 2019-2028 (USD Million)

TABLE 127 MALAYSIA Beam Delivery in Proton Therapy Market, By Product Type 2019-2028 (USD Million)

TABLE 128 MALAYSIA Proton Therapy Market, By Component 2019-2028 (USD Million)

TABLE 129 MALAYSIA ACCELERATOR IN PROTON THERAPY MARKET, By Component 2019-2028 (USD Million)

TABLE 130 MALAYSIA BEAM DELIVERY SYSTEM IN PROTON THERAPY MARKET, By Component 2019-2028 (USD Million)

TABLE 131 MALAYSIA NOZZLE IN PROTON THERAPY MARKET, By Component 2019-2028 (USD Million)

TABLE 132 MALAYSIA Proton Therapy Market, By Type, 2019-2028 (USD Million)

TABLE 133 MALAYSIA Proton Therapy Market, By Set-Up Systems, 2019-2028 (USD Million)

TABLE 134 MALAYSIA Proton Therapy Market, By Application Type, 2019-2028 (USD Million)

TABLE 135 MALAYSIA TREATMENT APPLICATIONS IN PROTON THERAPY MARKET, By Application, 2019-2028 (USD Million)

TABLE 136 MALAYSIA Proton Therapy Market, By End User, 2019-2028 (USD Million)

TABLE 137 INDONESIA proton therapy MARKET, By Product, 2019-2028 (USD Million)

TABLE 138 INDONESIA Systems in Proton Therapy Market, By Product Type 2019-2028 (USD Million)

TABLE 139 INDONESIA Accelerators in Proton Therapy Market, By Product Type 2019-2028 (USD Million)

TABLE 140 INDONESIA Beam Delivery in Proton Therapy Market, By Product Type 2019-2028 (USD Million)

TABLE 141 INDONESIA Proton Therapy Market, By Component 2019-2028 (USD Million)

TABLE 142 INDONESIA ACCELERATOR IN PROTON THERAPY MARKET, By Component 2019-2028 (USD Million)

TABLE 143 INDONESIA BEAM DELIVERY SYSTEM IN PROTON THERAPY MARKET, By Component 2019-2028 (USD Million)

TABLE 144 INDONESIA NOZZLE IN PROTON THERAPY MARKET, By Component 2019-2028 (USD Million)

TABLE 145 INDONESIA Proton Therapy Market, By Type, 2019-2028 (USD Million)

TABLE 146 INDONESIA Proton Therapy Market, By Set-Up Systems, 2019-2028 (USD Million)

TABLE 147 INDONESIA Proton Therapy Market, By Application Type, 2019-2028 (USD Million)

TABLE 148 INDONESIA TREATMENT APPLICATIONS IN PROTON THERAPY MARKET, By Application, 2019-2028 (USD Million)

TABLE 149 INDONESIA Proton Therapy Market, By End User, 2019-2028 (USD Million)

TABLE 150 PHILIPPINES proton therapy MARKET, By Product, 2019-2028 (USD Million)

TABLE 151 PHILIPPINES Systems in Proton Therapy Market, By Product Type 2019-2028 (USD Million)

TABLE 152 PHILIPPINES Accelerators in Proton Therapy Market, By Product Type 2019-2028 (USD Million)

TABLE 153 PHILIPPINES Beam Delivery in Proton Therapy Market, By Product Type 2019-2028 (USD Million)

TABLE 154 PHILIPPINES Proton Therapy Market, By Component 2019-2028 (USD Million)

TABLE 155 PHILIPPINES ACCELERATOR IN PROTON THERAPY MARKET, By Component 2019-2028 (USD Million)

TABLE 156 PHILIPPINES BEAM DELIVERY SYSTEM IN PROTON THERAPY MARKET, By Component 2019-2028 (USD Million)

TABLE 157 PHILIPPINES NOZZLE IN PROTON THERAPY MARKET, By Component 2019-2028 (USD Million)

TABLE 158 PHILIPPINES Proton Therapy Market, By Type, 2019-2028 (USD Million)

TABLE 159 PHILIPPINES Proton Therapy Market, By Set-Up Systems, 2019-2028 (USD Million)

TABLE 160 PHILIPPINES Proton Therapy Market, By Application Type, 2019-2028 (USD Million)

TABLE 161 PHILIPPINES TREATMENT APPLICATIONS IN PROTON THERAPY MARKET, By Application, 2019-2028 (USD Million)

TABLE 162 PHILIPPINES Proton Therapy Market, By End User, 2019-2028 (USD Million)

TABLE 163 REST OF Asia-Pacific proton therapy market, By Product, 2019-2028 (USD Million)

图片列表

FIGURE 1 ASIA-PACIFIC PROTON THERAPY MARKET: segmentation

FIGURE 2 ASIA-PACIFIC PROTON THERAPY MARKET: data triangulation

FIGURE 3 ASIA-PACIFIC PROTON THERAPY MARKET: DROC ANALYSIS

FIGURE 4 ASIA-PACIFIC PROTON THERAPY MARKET: REGIONAL vs Country MARKET ANALYSIS

FIGURE 5 ASIA-PACIFIC PROTON THERAPY MARKET: COMPANY RESEARCH ANALYSIS

FIGURE 6 ASIA-PACIFIC PROTON THERAPY MARKET: DBMR MARKET POSITION GRID

FIGURE 7 Asia-Pacific proton therapy market: vendor share analysis

FIGURE 8 ASIA-PACIFIC PROTON THERAPY MARKET: MARKET application type COVERAGE GRID

FIGURE 9 ASIA-PACIFIC PROTON THERAPY MARKET: SEGMENTATION

FIGURE 10 Rising number of proton therapy centers is expected to drive the ASIA-PACIFIC PROTON THERAPY MARKET in the forecast period of 2021 to 2028

FIGURE 11 systems segment is expected to account for the largest share of the ASIA-PACIFIC PROTON THERAPY MARKET in 2021 & 2028

FIGURE 12 DRIVERS, RESTRAINTS, OPPORTUNITIES AND CHALLENGEs OF Asia-Pacific proton therapy market

FIGURE 13 most common cancer across globe, in 2018

FIGURE 14 Asia-Pacific proton therapy market: By product type, 2020

FIGURE 15 Asia-Pacific proton therapy market: By product type, 2021-2028 (USD Million)

FIGURE 16 Asia-Pacific proton therapy market: By product type, CAGR (2021-2028)

FIGURE 17 Asia-Pacific proton therapy market: By product type, LIFELINE CURVE

FIGURE 18 Asia-Pacific proton therapy market: By component, 2020

FIGURE 19 Asia-Pacific proton therapy market: By component, 2020-2028 (USD Million)

FIGURE 20 Asia-Pacific proton therapy market: By component, CAGR (2020-2028)

FIGURE 21 Asia-Pacific proton therapy market: By component, LIFELINE CURVE

FIGURE 22 Asia-Pacific proton therapy market: By type, 2020

FIGURE 23 Asia-Pacific proton therapy market: By type, 2020-2028 (USD Million)

FIGURE 24 Asia-Pacific proton therapy market: By type, CAGR (2020-2028)

FIGURE 25 Asia-Pacific proton therapy market: By type, LIFELINE CURVE

FIGURE 26 Asia-Pacific proton therapy market: By set-up systems, 2020

FIGURE 27 Asia-Pacific proton therapy market: By set-up systems, 2020-2028 (USD Million)

FIGURE 28 Asia-Pacific proton therapy market: By set-up systems, CAGR (2020-2028)

FIGURE 29 Asia-Pacific proton therapy market: By set-up systems, LIFELINE CURVE

FIGURE 30 Asia-Pacific proton therapy market: By application type, 2020

FIGURE 31 Asia-Pacific proton therapy market: By application type, 2020-2028 (USD Million)

FIGURE 32 Asia-Pacific proton therapy market: By application type, CAGR (2020-2028)

FIGURE 33 Asia-Pacific proton therapy market: By application type, LIFELINE CURVE

FIGURE 34 Asia-Pacific proton therapy market: By end user, 2020

FIGURE 35 Asia-Pacific proton therapy market: By end user, 2020-2028 (USD Million)

FIGURE 36 Asia-Pacific proton therapy market: By end user, CAGR (2020-2028)

FIGURE 37 Asia-Pacific proton therapy market: By end user, LIFELINE CURVE

FIGURE 38 Asia-Pacific proton therapy market : SNAPSHOT (2020)

FIGURE 39 Asia-Pacific proton therapy market : BY COUNTRY (2020)

FIGURE 40 Asia-Pacific proton therapy market : BY COUNTRY (2021 & 2028)

FIGURE 41 Asia-Pacific proton therapy market : BY COUNTRY (2020 & 2028)

FIGURE 42 Asia-Pacific proton therapy market : BY Product (2021-2028)

FIGURE 43 Asia-Pacific proton therapy market: company share 2020 (%)

查看详细信息 Right Arrow

研究方法

Data collection and base year analysis are done using data collection modules with large sample sizes. The stage includes obtaining market information or related data through various sources and strategies. It includes examining and planning all the data acquired from the past in advance. It likewise envelops the examination of information inconsistencies seen across different information sources. The market data is analysed and estimated using market statistical and coherent models. Also, market share analysis and key trend analysis are the major success factors in the market report. To know more, please request an analyst call or drop down your inquiry.

The key research methodology used by DBMR research team is data triangulation which involves data mining, analysis of the impact of data variables on the market and primary (industry expert) validation. Data models include Vendor Positioning Grid, Market Time Line Analysis, Market Overview and Guide, Company Positioning Grid, Patent Analysis, Pricing Analysis, Company Market Share Analysis, Standards of Measurement, Global versus Regional and Vendor Share Analysis. To know more about the research methodology, drop in an inquiry to speak to our industry experts.

可定制

Data Bridge Market Research is a leader in advanced formative research. We take pride in servicing our existing and new customers with data and analysis that match and suits their goal. The report can be customized to include price trend analysis of target brands understanding the market for additional countries (ask for the list of countries), clinical trial results data, literature review, refurbished market and product base analysis. Market analysis of target competitors can be analyzed from technology-based analysis to market portfolio strategies. We can add as many competitors that you require data about in the format and data style you are looking for. Our team of analysts can also provide you data in crude raw excel files pivot tables (Fact book) or can assist you in creating presentations from the data sets available in the report.