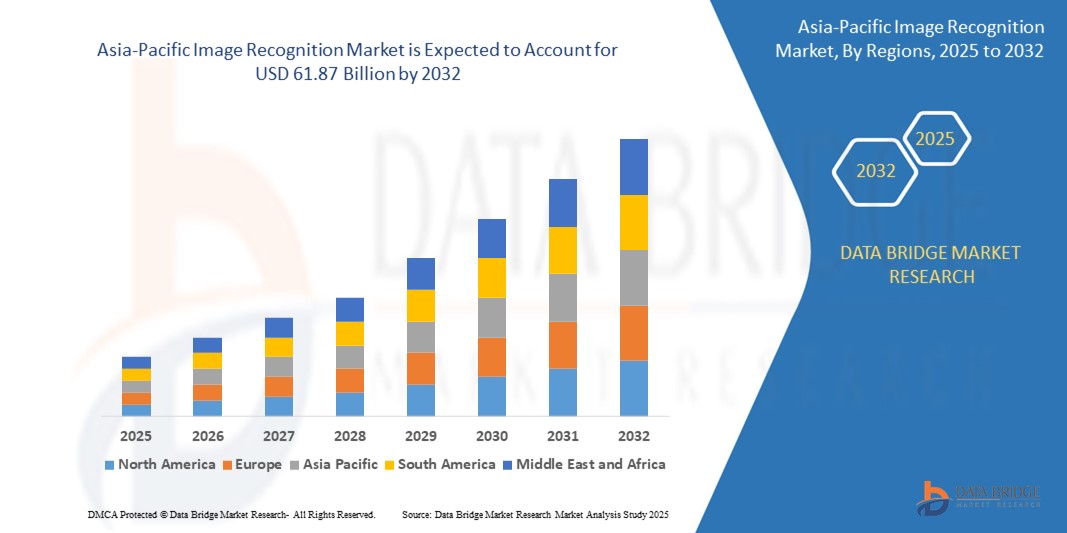
Asia Pacific Image Recognition Market
市场规模(十亿美元)
CAGR : %
Forecast Period |
2024 –2031 |
Market Size (Base Year) |
USD 12,458.67 Million |
Market Size (Forecast Year) |
USD 51,810.14 Million |
CAGR |
|
Major Markets Players |
>亚太图像识别市场,按产品(硬件、软件、服务)、技术(二维码/条形码识别、对象识别、面部识别、模式识别、光学字符识别)、部署(云、本地)、应用(增强现实、扫描和成像、安全和监控、营销和广告、图像搜索)、最终用途(汽车和交通、BFSI、政府、医疗保健、IT 和电信、媒体和娱乐、零售和电子商务、其他)划分 - 行业趋势和预测到 2031 年。
亚太图像识别市场分析及规模
图像识别,也称为计算机视觉或图像分类,是指识别和分类数字图像或视频中的对象或图案的过程。它是人工智能的一个子领域,涉及开发算法和模型,使机器能够理解和解释视觉数据。它通常涉及使用大量带标签的图像数据集来训练机器学习模型。
Data Bridge Market Research 分析,亚太地区图像识别市场预计将从 2023 年的 124.5867 亿美元增至 2031 年的 518.1014 亿美元,预计在 2024 年至 2031 年的预测期内复合年增长率为 19.5%。由于市场不断增长的需求,“硬件”在市场组件领域占据主导地位。除了对市场价值、增长率、细分、地理覆盖范围和主要参与者等市场情景的洞察外,Data Bridge Market Research 策划的市场报告还包括深入的专家分析、按地理位置代表的公司生产和产能、分销商和合作伙伴的网络布局、详细和更新的价格趋势分析以及供应链和需求的缺口分析。
报告范围和市场细分
报告指标 |
细节 |
预测期 |
2024 至 2031 年 |
基准年 |
2023 |
历史岁月 |
2022 (可定制为 2016-2021) |
定量单位 |
收入(百万美元)、销量(单位)、定价(美元) |
涵盖的领域 |
产品(硬件、软件、服务)、技术(二维码/条形码识别、对象识别、面部识别、模式识别、光学字符识别)、部署(云、本地)、应用(增强现实、扫描和成像、安全和监控、营销和广告、图像搜索)、最终用途(汽车和运输、BFSI、政府、医疗保健、IT 和电信、媒体和娱乐、零售和电子商务、其他) |
覆盖国家 |
日本、中国、印度、韩国、澳大利亚、新加坡、马来西亚、泰国、印度尼西亚、菲律宾、亚太地区其他地区 |
涵盖的市场参与者 |
IBM Corporation (U.S.), Microsoft (U.S.), Clarifai, Inc. (U.S.), Huawei Technologies Co., Ltd. (China), TRAX IMAGE RECOGNITION (Singapore), Vispera Information Technologies (Turkey), Partium.io (Germany), LTU Tech (U.S.), Blippar (U.K.), Wikitude GmbH (Austria), Trigo (Israel), Ricoh (Japan), Honeywell International Inc. (U.S.), Google (U.S.), TOSHIBA ELECTRONIC DEVICES & STORAGE CORPORATION (Japan), Qualcomm Technologies, Inc. (U.S.), Hitachi Information & Telecommunication Engineering, Ltd. (Japan), Amazon Web Services, Inc. (U.S.) |
Market Opportunities |
|
Market Definition
Image recognition is a method used to acquire, process, and scrutinize images. The technique is used to gather high-dimensional data for the purpose of generating numerical or symbolic information. Image recognition incorporates disentangling of representational information from the data gathered from the image by using replicas created with the help of geometry, physics, statistics, and learning theory.
Asia-Pacific Image Recognition Market Dynamics
Driver
- Efficient and profitable retail execution processes with adherence to compliance standards
Image recognition solutions are revolutionizing the way companies manage customer interactions, market products online and offline, and manage store inventory. Image recognition technology is increasingly being used to search for products online for purchase. The use of image recognition for shelf recognition, product placement, and maintaining compliance with merchandising standards is quickly gaining momentum. Image recognition technology is assisting manufacturers, retailers, and marketers to understand their market and react dynamically.
Opportunity
- Accelerating demand for cloud-powered image recognition solutions
Major cloud companies such as AWS, Microsoft, and Google are heavily investing in enhancing their image recognition market offerings to optimize in-store and online retail execution. Organic and inorganic strategies supported by underlying cloud infrastructure promotes the future growth of the image recognition market.
Restraints/Challenges
- High installation cost
Most of the enabling technologies, such as face recognition, deep learning, computer vision, Al, ML, and gesture recognition, have huge development costs. Thus, companies that lack financial resources do not opt for image recognition offerings even if they are interested in such solutions to increase productivity. Well-known vendor solutions in the market such as Microsoft Computer Vision API, Microsoft Emotion API, Amazon Rekognition, Google Cloud Vision API, and IBM Watson Visual Recognition are highly priced, making it difficult for small companies to deploy them. The huge cost of implementing image recognition solutions and training Al enablers to execute a specific task will act as a deterrent for small retail and e-commerce businesses; this could prove to be a restraint for image recognition solution vendors during the forecast period.
Impact and Current Market Scenario of Raw Material Shortage and Shipping Delays
Data Bridge Market Research offers a high-level analysis of the market and delivers information by keeping in account the impact and current market environment of raw material shortage and shipping delays. This translates into assessing strategic possibilities, creating effective action plans, and assisting businesses in making important decisions.
Apart from the standard report, we also offer in-depth analysis of the procurement level from forecasted shipping delays, distributor mapping by region, commodity analysis, production analysis, price mapping trends, sourcing, category performance analysis, supply chain risk management solutions, advanced benchmarking, and other services for procurement and strategic support.
Expected Impact of Economic Slowdown on the Pricing and Availability of Products
When economic activity slows, industries begin to suffer. The forecasted effects of the economic downturn on the pricing and accessibility of the products are taken into account in the market insight reports and intelligence services provided by DBMR. With this, our clients can typically keep one step ahead of their competitors, project their sales and revenue, and estimate their profit and loss expenditures.
Recent Developments
- In August 2021, Huawei Technologies Co., Ltd. launched seven new machine vision products. The key feature of this product was improved image quality evaluation standard using AI-based features. These products helped the company improve its product portfolio and offered customers unique vision products with improved image/object identification and detection capabilities
Asia-Pacific Image Recognition Market Scope
The image recognition market is segmented on the basis of offering, technology, deployment, application, and end-use. The growth amongst these segments will help you analyze meagre growth segments in the industries and provide the users with a valuable market overview and market insights to help them make strategic decisions for identifying core market applications.
Offering
- Hardware
- Software
- Services
Technology
- 二维码/条形码识别
- 物体识别
- 面部识别
- 模式识别
- 光学字符识别
部署
- 云
- 本地部署
应用
- 增强现实
- 扫描和成像
- 安全与监控
- 营销和广告
- 图片搜索
最终用途
- 汽车与交通
- 金融保险业协会
- 政府
- 卫生保健
- 信息技术和电信
- 媒体和娱乐
- 零售和电子商务
- 其他的
亚太图像识别市场区域分析/洞察
对图像识别市场进行了分析,并按国家、产品、技术、部署、应用和最终用途行业提供了市场规模洞察和趋势。
市场报告涵盖的国家包括日本、中国、印度、韩国、澳大利亚、新加坡、马来西亚、泰国、印度尼西亚、菲律宾和亚太地区其他地区。
中国有望主导市场,因为中国拥有知名研究机构、大学和科技公司,在光子学和集成电路技术领域开展前沿研究。这种强大的研发生态系统促进了创新并推动了图像识别电路的进步。
由于人口数量庞大且增长迅速,以及互联网使用量和数据消费量大幅增加,中国预计将成为市场上增长最快的国家。这推动了对高速高效通信网络的需求,而图像识别电路的使用将使通信网络受益。PIC 能够在单个芯片上集成多个光学元件,非常适合高速数据传输和通信应用。
报告的区域部分还提供了影响市场当前和未来趋势的各个市场影响因素和国内市场监管变化。下游和上游价值链分析、技术趋势和波特五力分析、案例研究等数据点是用于预测各个国家市场情景的一些指标。此外,在对区域数据进行预测分析时,还考虑了亚太品牌的存在和可用性以及由于来自本地和国内品牌的大量或稀缺竞争而面临的挑战、国内关税的影响和贸易路线。
竞争格局和亚太图像识别市场份额分析
图像识别市场竞争格局提供了竞争对手的详细信息。详细信息包括公司概况、公司财务状况、产生的收入、市场潜力、研发投资、新市场计划、亚太地区业务、生产基地和设施、生产能力、公司优势和劣势、产品发布、产品宽度和广度以及应用主导地位。以上提供的数据点仅与公司对图像识别市场的关注有关。
图像识别市场的一些主要参与者包括:
- IBM 公司(美国)
- 微软 (美国)
- Clarifai, Inc.(美国)
- 华为技术有限公司 (中国)
- TRAX 图像识别(新加坡)
- Vispera 信息技术公司(土耳其)
- Partium.io(德国)
- LTU Tech(美国)
- Blippar(英国)
- Wikitude GmbH(奥地利)
- Trigo(以色列)
- 理光 (日本)
- 霍尼韦尔国际公司(美国)
- 谷歌(美国)
- 东芝电子元件及存储株式会社(日本)
- 高通技术公司(美国)
- 日立信息通信工程有限公司(日本)
- 亚马逊网络服务公司(美国)
SKU-
Get online access to the report on the World's First Market Intelligence Cloud
- Interactive Data Analysis Dashboard
- Company Analysis Dashboard for high growth potential opportunities
- Research Analyst Access for customization & queries
- Competitor Analysis with Interactive dashboard
- Latest News, Updates & Trend analysis
- Harness the Power of Benchmark Analysis for Comprehensive Competitor Tracking
目录
- introduction
- OBJECTIVES OF THE STUDY
- MARKET DEFINITION
- OVERVIEW OF Asia-Pacific image recognition market
- Currency and Pricing
- LIMITATIONS
- MARKETS COVERED
- MARKET SEGMENTATION
- MARKETS COVERED
- geographicAL scope
- years considered for the study
- DBMR TRIPOD DATA VALIDATION MODEL
- primary interviews with key opinion leaders
- DBMR MARKET POSITION GRID
- vendor share analysis
- Multivariate Modeling
- APPLICATION timeline curve
- secondary sourcEs
- assumptions
- EXECUTIVE SUMMARY
- premium insights
- PREMIUM INSIGHTS
- TECHNOLOGY LANDSCAPE
- QR/ barcode recognition
- object recognition (OR)
- facial recognition (FR)
- pattern recognition (PR)
- optical character recognition (ocr)
- market overview
- drivers
- INCREASING CONSUMPTION OF THE SMARTPHONES
- GROWING ADOPTION FOR SECURITY APPLICATION
- RAPID ADOPTION BY VARIOUS END USERS
- Growing demand for cloud-powered image recognition solutions
- RESTRAINTS
- MISUSE OF FACIAL RECOGNITION TECHNOLOGY
- High installation cost of image recognition services
- OPPORTUNITIES
- INCREASING DEMAND FROM GOVERNMENT AND PRIVATE SECTORs FOR SERVICE IMPROVEMENT
- Technological advancement and rising investment in image recognition systems
- CHALLENGES
- Technical challenges to improve the performance of solution
- Challenges in Image Classification by IR solutions
- Impact of COVID-19 on Asia-Pacific image recognition market
- ANALYSIS ON IMPACT OF COVID-19 ON IMAGE RECOGNITION MARKET
- AFTERMATH OF COVID-19 AND GOVERNMENT INITIATIVE TO BOOST THE MARKET
- STRATEGIC DECISIONS FOR MANUFACTURERS AFTER COVID-19 TO GAIN COMPETITIVE MARKET SHARE
- IMPACT ON PRICE
- IMPACT ON DEMAND AND SUPPLY CHAIN
- CONCLUSION
- Asia-Pacific image recognition MARKET, BY OFFERING
- overview
- HARDWARE
- Software
- services
- Managed Services
- Professional Services
- TRAINING & CONSULTING
- SUPPORT & MAINTENANCE
- Asia-Pacific image recognition MARKET, BY TECHNOLOGY
- overview
- QR/ Barcode Recognition
- Object Recognition
- Facial Recognition
- Pattern Recognition
- Optical Character Recognition
- Asia-Pacific image recognition MARKET, BY deployment model
- overview
- On-Premise
- Cloud
- Private
- Public
- Hybrid
- Asia-Pacific image recognition MARKET, BY application
- overview
- Security and Surveillance
- Scanning & Imaging
- Image Search
- Marketing & Advertisement
- Augmented Reality
- Asia-Pacific image recognition MARKET, BY end use
- overview
- Automotive & Transportation
- Hardware
- Software
- Services
- BFSI
- Hardware
- Software
- Services
- Government
- Hardware
- Software
- Services
- Healthcare
- Hardware
- Software
- Services
- IT & Telecom
- Hardware
- Software
- Services
- Media & Entertainment
- Hardware
- Software
- Services
- Retail & E-Commerce
- Hardware
- Software
- Services
- Others
- Hardware
- Software
- Services
- Asia-Pacific image recognition market, BY COUNTRY
- Australia
- Indonesia
- Taiwan
- Thailand
- Singapore
- Vietnam
- rest of Asia-Pacific
- Asia-Pacific Image Recognition Market: COMPANY landscape
- swot analysis
- company profile
- Huawei Technologies Co., Ltd.
- COMPANY snapshot
- PRODUCT PORTFOLIO
- recent DEVELOPMENTs
- Hitachi Information & Telecommunication Engineering, Ltd.
- COMPANY snapshot
- REVENUE ANALYSIS
- Product PORTFOLIO
- recent DEVELOPMENT
- Honeywell International Inc.
- COMPANY snapshot
- REVENUE ANALYSIS
- Product PORTFOLIO
- recent DEVELOPMENT
- TOSHIBA ELECTRONIC DEVICES & STORAGE CORPORATION
- COMPANY snapshot
- REVENUE ANALYSIS
- Product PORTFOLIO
- recent DEVELOPMENT
- Qualcomm Technologies, Inc.
- COMPANY snapshot
- REVENUE ANALYSIS
- Product PORTFOLIO
- recent DEVELOPMENTS
- COMPANY snapshot
- REVENUE ANALYSIS
- Product PORTFOLIO
- recent DEVELOPMENTS
- TRAX IMAGE RECOGNITION
- COMPANY snapshot
- Technology PORTFOLIO
- recent DEVELOPMENTs
- IBM Corporation
- COMPANY snapshot
- REVENUE ANALYSIS
- Solution PORTFOLIO
- recent DEVELOPMENT
- Amazon Web Services, Inc.
- COMPANY snapshot
- REVENUE ANALYSIS
- Product PORTFOLIO
- recent DEVELOPMENT
- ricoh
- COMPANY snapshot
- REVENUE ANALYSIS
- Solution PORTFOLIO
- recent DEVELOPMENT
- Microsoft
- COMPANY snapshot
- REVENUE ANALYSIS
- service PORTFOLIO
- recent DEVELOPMENTS
- Blippar
- COMPANY snapshot
- product PORTFOLIO
- recent DEVELOPMENTs
- Clarifai, Inc
- COMPANY snapshot
- product & solution PORTFOLIO
- recent DEVELOPMENTs
- LTU Tech
- COMPANY snapshot
- Solution PORTFOLIO
- recent DEVELOPMENTs
- Partium.io (A brand of Humai Technologies GmbH)
- COMPANY snapshot
- Product PORTFOLIO
- recent DEVELOPMENT
- trigo
- COMPANY snapshot
- Product PORTFOLIO
- recent DEVELOPMENT
- Vispera Information Technologies
- COMPANY snapshot
- Product PORTFOLIO
- recent DEVELOPMENTs
- Wikitude GmbH
- COMPANY snapshot
- Solution PORTFOLIO
- recent DEVELOPMENTs
- questionnaire
- related reports
表格列表
TABLE 1 Asia-Pacific image recognition market, By offering, 2019-2028 (USD MILLION)
TABLE 2 Asia-Pacific Services in Image recognition Market, By Type, 2019-2028 (USD Million)
TABLE 3 Asia-Pacific Professional Services in Image Recognition Market, By Type, 2019-2028 (USD Million)
TABLE 4 Asia-Pacific image recognition market, BY Technology, 2019-2028 (USD MILLION)
TABLE 5 Asia-Pacific image recognition market, By Deployment model, 2019-2028 (USD MILLION)
TABLE 6 Asia-Pacific Cloud in Image recognition Market, By Type, 2019-2028 (USD Million)
TABLE 7 Asia-Pacific image recognition market, BY Application, 2019-2028 (USD MILLION)
TABLE 8 Asia-Pacific image recognition market, By End Use, 2019-2028 (USD MILLION)
TABLE 9 Asia-Pacific Automotive & Transportation in Image recognition Market, By Offering, 2019-2028 (USD Million)
TABLE 10 Asia-Pacific BFSI in Image recognition Market, By Offering, 2019-2028 (USD Million)
TABLE 11 Asia-Pacific Government in Image recognition Market, By Offering, 2019-2028 (USD Million)
TABLE 12 Asia-Pacific Healthcare in Image recognition Market, By Offering, 2019-2028 (USD Million)
TABLE 13 Asia-Pacific IT & Telecom in Image recognition Market, By Offering, 2019-2028 (USD Million)
TABLE 14 Asia-Pacific Media & Entertainment in Image recognition Market, By Offering, 2019-2028 (USD Million)
TABLE 15 Asia-Pacific Retail & E-commerce in Image recognition Market, By Offering, 2019-2028 (USD Million)
TABLE 16 Asia-Pacific Others in Image recognition Market, By Offering, 2019-2028 (USD Million)
TABLE 17 Asia-Pacific Image Recognition Market, By Country, 2019-2028 (USD Million)
TABLE 18 Asia-Pacific image recognition market, By Offering, 2019-2028 (USD Million)
TABLE 19 ASIA-PACIFIC services in image recognition Market, By Type, 2019-2028 (USD Million)
TABLE 20 ASIA-PACIFIC professional services in IMAGE RECOGNITION Market, By Type, 2019-2028 (USD Million)
TABLE 21 ASIA-PACIFIC IMAGE RECOGNITION Market, By Deployment Model, 2019-2028 (USD Million)
TABLE 22 ASIA-PACIFIC cloud in image recognition market, By type, 2019-2028 (USD Million)
TABLE 23 ASIA-PACIFIc image recognition market, By Technology, 2019-2028 (USD Million)
TABLE 24 Asia-Pacific image recognition market, By Application, 2019-2028 (USD Million)
TABLE 25 Asia-Pacific image recognition market, By End Use, 2019-2028 (USD Million)
TABLE 26 Asia-Pacific retail & e-commerce in image recognition market, By Offering, 2019-2028 (USD Million)
TABLE 27 Asia-Pacific bfsi in image recognition market, By Offering, 2019-2028 (USD Million)
TABLE 28 Asia-Pacific automotive & transportation in image recognition market, By Offering, 2019-2028 (USD Million)
TABLE 29 Asia-Pacific government in image recognition market, By Offering, 2019-2028 (USD Million)
TABLE 30 Asia-Pacific media & entertainment in image recognition market, By Offering, 2019-2028 (USD Million)
TABLE 31 Asia-Pacific it & telecom in image recognition market, By Offering, 2019-2028 (USD Million)
TABLE 32 Asia-Pacific healthcare in image recognition market, By Offering, 2019-2028 (USD Million)
TABLE 33 Asia-Pacific others in image recognition market, By Offering, 2019-2028 (USD Million)
TABLE 34 Australia image recognition market, By Offering, 2019-2028 (USD Million)
TABLE 35 AUSTRALIA services in image recognition Market, By Type, 2019-2028 (USD Million)
TABLE 36 AUSTRALIA professional services in IMAGE RECOGNITION Market, By Type, 2019-2028 (USD Million)
TABLE 37 AUSTRALIA IMAGE RECOGNITION Market, By Deployment Model, 2019-2028 (USD Million)
TABLE 38 AUSTRALIA cloud in image recognition market, By type, 2019-2028 (USD Million)
TABLE 39 Australia image recognition market, By Technology, 2019-2028 (USD Million)
TABLE 40 Australia image recognition market, By Application, 2019-2028 (USD Million)
TABLE 41 Australia image recognition market, By End Use, 2019-2028 (USD Million)
TABLE 42 Australia retail & e-commerce in image recognition market, By Offering, 2019-2028 (USD Million)
TABLE 43 Australia bfsi in image recognition market, By Offering, 2019-2028 (USD Million)
TABLE 44 Australia automotive & transportation in image recognition market, By Offering, 2019-2028 (USD Million)
TABLE 45 Australia government in image recognition market, By Offering, 2019-2028 (USD Million)
TABLE 46 Australia media & entertainment in image recognition market, By Offering, 2019-2028 (USD Million)
TABLE 47 Australia it & telecom in image recognition market, By Offering, 2019-2028 (USD Million)
TABLE 48 Australia healthcare in image recognition market, By Offering, 2019-2028 (USD Million)
TABLE 49 Australia others in image recognition market, By Offering, 2019-2028 (USD Million)
TABLE 50 Indonesia image recognition market, By Offering, 2019-2028 (USD Million)
TABLE 51 INDONESIA services in image recognition Market, By Type, 2019-2028 (USD Million)
TABLE 52 INDONESIA professional services in IMAGE RECOGNITION Market, By Type, 2019-2028 (USD Million)
TABLE 53 INDONESIA IMAGE RECOGNITION Market, By Deployment Model, 2019-2028 (USD Million)
TABLE 54 INDONESIA cloud in image recognition market, By type, 2019-2028 (USD Million)
TABLE 55 Indonesia image recognition market, By Technology, 2019-2028 (USD Million)
TABLE 56 Indonesia image recognition market, By Application, 2019-2028 (USD Million)
TABLE 57 Indonesia image recognition market, By End Use, 2019-2028 (USD Million)
TABLE 58 Indonesia retail & e-commerce in image recognition market, By Offering, 2019-2028 (USD Million)
TABLE 59 Indonesia bfsi in image recognition market, By Offering, 2019-2028 (USD Million)
TABLE 60 Indonesia automotive & transportation in image recognition market, By Offering, 2019-2028 (USD Million)
TABLE 61 Indonesia government in image recognition market, By Offering, 2019-2028 (USD Million)
TABLE 62 Indonesia media & entertainment in image recognition market, By Offering, 2019-2028 (USD Million)
TABLE 63 Indonesia it & telecom in image recognition market, By Offering, 2019-2028 (USD Million)
TABLE 64 Indonesia healthcare in image recognition market, By Offering, 2019-2028 (USD Million)
TABLE 65 Indonesia others in image recognition market, By Offering, 2019-2028 (USD Million)
TABLE 66 Taiwan image recognition market, By Offering, 2019-2028 (USD Million)
TABLE 67 TAIWAN services in image recognition Market, By Type, 2019-2028 (USD Million)
TABLE 68 TAIWAN professional services in IMAGE RECOGNITION Market, By Type, 2019-2028 (USD Million)
TABLE 69 TAIWAN IMAGE RECOGNITION Market, By Deployment Model, 2019-2028 (USD Million)
TABLE 70 TAIWAN cloud in image recognition market, By type, 2019-2028 (USD Million)
TABLE 71 Taiwan image recognition market, By Technology, 2019-2028 (USD Million)
TABLE 72 Taiwan image recognition market, By Application, 2019-2028 (USD Million)
TABLE 73 Taiwan image recognition market, By End Use, 2019-2028 (USD Million)
TABLE 74 Taiwan retail & e-commerce in image recognition market, By Offering, 2019-2028 (USD Million)
TABLE 75 Taiwan bfsi in image recognition market, By Offering, 2019-2028 (USD Million)
TABLE 76 Taiwan automotive & transportation in image recognition market, By Offering, 2019-2028 (USD Million)
TABLE 77 Taiwan government in image recognition market, By Offering, 2019-2028 (USD Million)
TABLE 78 Taiwan media & entertainment in image recognition market, By Offering, 2019-2028 (USD Million)
TABLE 79 Taiwan it & telecom in image recognition market, By Offering, 2019-2028 (USD Million)
TABLE 80 Taiwan healthcare in image recognition market, By Offering, 2019-2028 (USD Million)
TABLE 81 Taiwan others in image recognition market, By Offering, 2019-2028 (USD Million)
TABLE 82 Thailand image recognition market, By Offering, 2019-2028 (USD Million)
TABLE 83 THAILAND services in image recognition Market, By Type, 2019-2028 (USD Million)
TABLE 84 THAILAND professional services in IMAGE RECOGNITION Market, By Type, 2019-2028 (USD Million)
TABLE 85 THAILAND IMAGE RECOGNITION Market, By Deployment Model, 2019-2028 (USD Million)
TABLE 86 THAILAND cloud in image recognition market, By type, 2019-2028 (USD Million)
TABLE 87 Thailand image recognition market, By Technology, 2019-2028 (USD Million)
TABLE 88 Thailand image recognition market, By Application, 2019-2028 (USD Million)
TABLE 89 Thailand image recognition market, By End Use, 2019-2028 (USD Million)
TABLE 90 Thailand retail & e-commerce in image recognition market, By Offering, 2019-2028 (USD Million)
TABLE 91 Thailand bfsi in image recognition market, By Offering, 2019-2028 (USD Million)
TABLE 92 Thailand automotive & transportation in image recognition market, By Offering, 2019-2028 (USD Million)
TABLE 93 Thailand government in image recognition market, By Offering, 2019-2028 (USD Million)
TABLE 94 Thailand media & entertainment in image recognition market, By Offering, 2019-2028 (USD Million)
TABLE 95 Thailand it & telecom in image recognition market, By Offering, 2019-2028 (USD Million)
TABLE 96 Thailand healthcare in image recognition market, By Offering, 2019-2028 (USD Million)
TABLE 97 Thailand others in image recognition market, By Offering, 2019-2028 (USD Million)
TABLE 98 Singapore image recognition market, By Offering, 2019-2028 (USD Million)
TABLE 99 SINGAPORE services in image recognition Market, By Type, 2019-2028 (USD Million)
TABLE 100 SINGAPORE professional services in IMAGE RECOGNITION Market, By Type, 2019-2028 (USD Million)
TABLE 101 SINGAPORE IMAGE RECOGNITION Market, By Deployment Model, 2019-2028 (USD Million)
TABLE 102 SINGAPORE cloud in image recognition market, By type, 2019-2028 (USD Million)
TABLE 103 Singapore image recognition market, By Technology, 2019-2028 (USD Million)
TABLE 104 Singapore image recognition market, By Application, 2019-2028 (USD Million)
TABLE 105 Singapore image recognition market, By End Use, 2019-2028 (USD Million)
TABLE 106 Singapore retail & e-commerce in image recognition market, By Offering, 2019-2028 (USD Million)
TABLE 107 Singapore bfsi in image recognition market, By Offering, 2019-2028 (USD Million)
TABLE 108 Singapore automotive & transportation in image recognition market, By Offering, 2019-2028 (USD Million)
TABLE 109 Singapore government in image recognition market, By Offering, 2019-2028 (USD Million)
TABLE 110 Singapore media & entertainment in image recognition market, By Offering, 2019-2028 (USD Million)
TABLE 111 Singapore it & telecom in image recognition market, By Offering, 2019-2028 (USD Million)
TABLE 112 Singapore healthcare in image recognition market, By Offering, 2019-2028 (USD Million)
TABLE 113 Singapore others in image recognition market, By Offering, 2019-2028 (USD Million)
TABLE 114 Vietnam image recognition market, By Offering, 2019-2028 (USD Million)
TABLE 115 VIETNAM services in image recognition Market, By Type, 2019-2028 (USD Million)
TABLE 116 VIETNAM professional services in IMAGE RECOGNITION Market, By Type, 2019-2028 (USD Million)
TABLE 117 VIETNAM IMAGE RECOGNITION Market, By Deployment Model, 2019-2028 (USD Million)
TABLE 118 VIETNAM cloud in image recognition market, By type, 2019-2028 (USD Million)
TABLE 119 Vietnam image recognition market, By Technology, 2019-2028 (USD Million)
TABLE 120 Vietnam image recognition market, By Application, 2019-2028 (USD Million)
TABLE 121 Vietnam image recognition market, By End Use, 2019-2028 (USD Million)
TABLE 122 Vietnam retail & e-commerce in image recognition market, By Offering, 2019-2028 (USD Million)
TABLE 123 Vietnam bfsi in image recognition market, By Offering, 2019-2028 (USD Million)
TABLE 124 Vietnam automotive & transportation in image recognition market, By Offering, 2019-2028 (USD Million)
TABLE 125 Vietnam government in image recognition market, By Offering, 2019-2028 (USD Million)
TABLE 126 Vietnam media & entertainment in image recognition market, By Offering, 2019-2028 (USD Million)
TABLE 127 Vietnam it & telecom in image recognition market, By Offering, 2019-2028 (USD Million)
TABLE 128 Vietnam healthcare in image recognition market, By Offering, 2019-2028 (USD Million)
TABLE 129 Vietnam others in image recognition market, By Offering, 2019-2028 (USD Million)
TABLE 130 rest of asia-pacific image recognition market, By Offering, 2019-2028 (USD Million)
图片列表
FIGURE 1 Asia-Pacific image recognition MARKET: segmentation
FIGURE 2 Asia-Pacific image recognition market: data triangulation
FIGURE 3 Asia-Pacific image recognition market: DROC ANALYSIS
FIGURE 4 Asia-Pacific image recognition market: REGIONAL VS COUNTRY MARKET ANALYSIS
FIGURE 5 Asia-Pacific image recognition market: COMPANY RESEARCH ANALYSIS
FIGURE 6 Asia-Pacific image recognition market: INTERVIEW DEMOGRAPHICS
FIGURE 7 Asia-Pacific image recognition market: DBMR MARKET POSITION GRID
FIGURE 8 Asia-Pacific image recognition: vendor share analysis
FIGURE 9 Asia-Pacific image recognition market: SEGMENTATION
FIGURE 10 Increasing consumption of the smartphones and growing adoption for security application, is EXPECTED TO DRIVE Asia-Pacific image recognition market IN THE FORECAST PERIOD OF 2021 TO 2028
FIGURE 11 hardware SEGMENT is expected to account for the largest share of THE Asia-Pacific image recognition market in 2021 & 2028
FIGURE 12 DRIVERS, RESTRAINTS, OPPORTUNITIES AND CHALLENGES OF Asia-Pacific Images Recognition Market
FIGURE 13 INTERNET USERS: % OF POPULATION, ASIA-PACIFIC
FIGURE 14 DESKTOP VS. MOBILE VS. TABLET MARKET SHARE ASIA, JULY 2020-JULY 2021
FIGURE 15 MOST USED CLOUD STORAGE SERVICES
FIGURE 16 Asia-Pacific image recognition market: BY offering, 2020
FIGURE 17 Asia-Pacific image recognition market: BY Technology, 2020
FIGURE 18 Asia-Pacific image recognition market: BY Deployment model, 2020
FIGURE 19 Asia-Pacific image recognition market: BY Application, 2020
FIGURE 20 Asia-Pacific image recognition market: BY End Use, 2020
FIGURE 21 Asia-Pacific image recognition market: SNAPSHOT (2020)
FIGURE 22 Asia-Pacific image recognition market: by Country (2020)
FIGURE 23 Asia-Pacific image recognition market: by Country (2021 & 2028)
FIGURE 24 Asia-Pacific image recognition market: by Country (2020 & 2028)
FIGURE 25 Asia-Pacific image recognition market: by offering (2021-2028)
FIGURE 26 Asia-Pacific image recognition market: company share 2020 (%)
研究方法
Data collection and base year analysis are done using data collection modules with large sample sizes. The stage includes obtaining market information or related data through various sources and strategies. It includes examining and planning all the data acquired from the past in advance. It likewise envelops the examination of information inconsistencies seen across different information sources. The market data is analysed and estimated using market statistical and coherent models. Also, market share analysis and key trend analysis are the major success factors in the market report. To know more, please request an analyst call or drop down your inquiry.
The key research methodology used by DBMR research team is data triangulation which involves data mining, analysis of the impact of data variables on the market and primary (industry expert) validation. Data models include Vendor Positioning Grid, Market Time Line Analysis, Market Overview and Guide, Company Positioning Grid, Patent Analysis, Pricing Analysis, Company Market Share Analysis, Standards of Measurement, Global versus Regional and Vendor Share Analysis. To know more about the research methodology, drop in an inquiry to speak to our industry experts.
可定制
Data Bridge Market Research is a leader in advanced formative research. We take pride in servicing our existing and new customers with data and analysis that match and suits their goal. The report can be customized to include price trend analysis of target brands understanding the market for additional countries (ask for the list of countries), clinical trial results data, literature review, refurbished market and product base analysis. Market analysis of target competitors can be analyzed from technology-based analysis to market portfolio strategies. We can add as many competitors that you require data about in the format and data style you are looking for. Our team of analysts can also provide you data in crude raw excel files pivot tables (Fact book) or can assist you in creating presentations from the data sets available in the report.