Европейский рынок гидрофобных покрытий сегментирован по типу ингредиентов (пребиотики, пробиотики, аминокислоты, пептиды, омега-3 и структурированные липиды, фитохимические вещества и растительные экстракты, минералы, витамины, волокна и специальные углеводы, каротиноиды и антиоксиданты и другие), применению (функциональное питание, диетические добавки, жевательные добавки, питание животных, средства личной гигиены и другие) и источнику (растительное, животное и микробное), стране (Германия, Великобритания, Франция, Италия, Испания, Нидерланды, Бельгия, Россия, Турция, Швейцария, Дания, Швеция, Польша, остальные страны Европы), тенденциям отрасли и прогнозам до 2028 года.
Анализ рынка и аналитика: рынок биологически активных ингредиентов в Европе
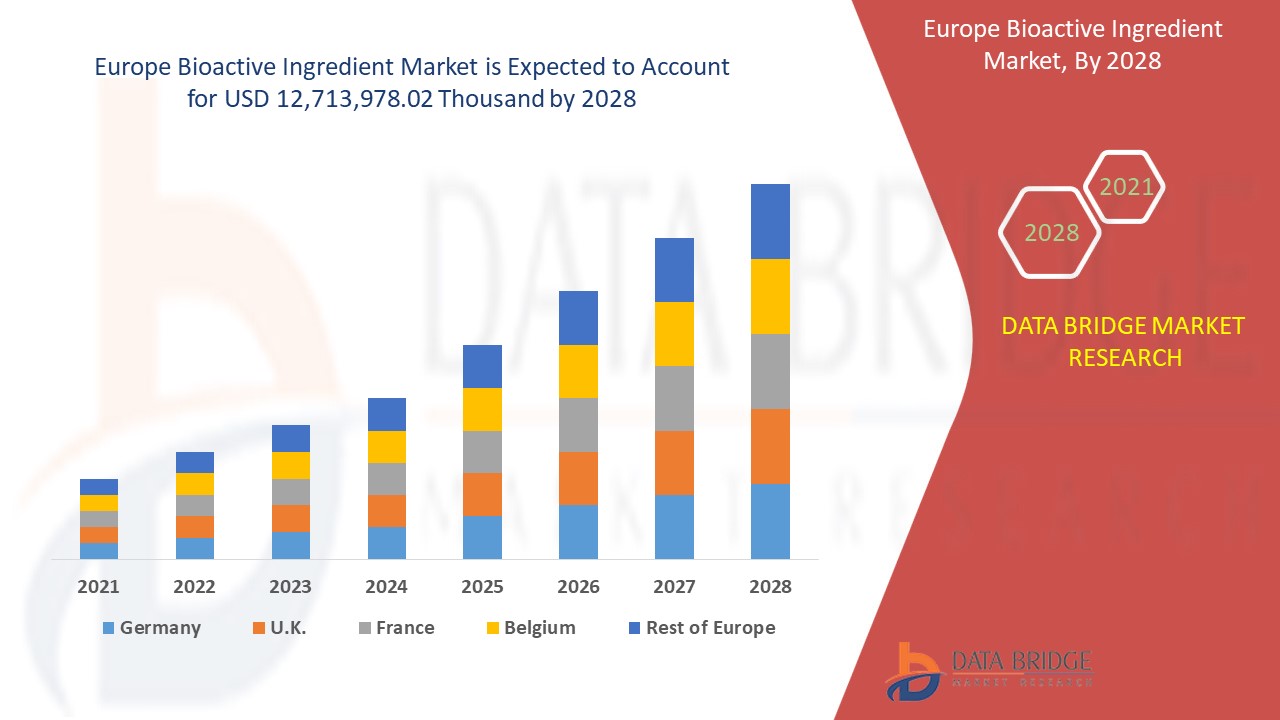
Ожидается, что рынок биоактивных ингредиентов в Европе будет расти в прогнозируемый период с 2021 по 2028 год. По данным Data Bridge Market Research, среднегодовой темп роста рынка составит 7,1% в прогнозируемый период с 2021 по 2028 год, а к 2028 году он, как ожидается, достигнет 12 713 978,02 тыс. долларов США.
Биоактивные ингредиенты — это вещества, которые оказывают биологическое воздействие на живые организмы. Компоненты поступают из различных источников, включая растения, продукты питания, животных, море и микроорганизмы. Биоактивные вещества добавляются в продукты питания и корма для улучшения физического и физиологического здоровья потребителей. Функциональные продукты питания и напитки, пищевые добавки и питание для новорожденных широко используют биоактивные вещества. Эти химические вещества могут помочь предотвратить рак, болезни сердца и другие заболевания.
Биоактивные вещества широко используются в различных секторах, включая продукты питания и напитки, лекарства и нутрицевтики, предметы личной гигиены и корма для животных. Каротиноиды, эфирные масла и антиоксиданты являются примерами биоактивных веществ, используемых в функциональных блюдах для улучшения их сенсорных и питательных качеств. Они являются своего рода биомолекулами, которые помогают в метаболическом процессе полезных молекул, добавляемых в пищу и другие виды продуктов.
Отчет о рынке биологически активных ингредиентов содержит подробную информацию о доле рынка, новых разработках и анализе продуктового портфеля, влиянии игроков внутреннего и локального рынка, анализирует возможности с точки зрения новых источников дохода, изменений в рыночных правилах, одобрений продуктов, стратегических решений, запусков продуктов, географических расширений и технологических инноваций на рынке. Чтобы понять анализ и рыночный сценарий, свяжитесь с нами для получения аналитического обзора, наша команда поможет вам создать решение по влиянию на доход для достижения желаемой цели.
Объем и размер рынка биологически активных ингредиентов в Европе
Европейский рынок биоактивных ингредиентов подразделяется на три заметных сегмента, которые основаны на типе ингредиента, применении и источнике. Рост среди сегментов помогает вам анализировать нишевые карманы роста и стратегии подхода к рынку и определять ваши основные области применения и разницу в ваших целевых рынках.
- На основе типа ингредиента глобальный рынок биоактивных ингредиентов сегментируется на пребиотики, пробиотики, аминокислоты , пептиды, омега-3 и структурированные липиды, фитохимические вещества и растительные экстракты, минералы, витамины, волокна и специальные углеводы, каротиноиды и антиоксиданты и другие. Пребиотики далее сегментируются на фруктаны, галактоолигосахариды, крахмал и олигосахариды, полученные из глюкозы, неуглеводные олигосахариды и другие. Пробиотики далее сегментируются на лактобациллы, бифидобактерии, дрожжи. Аминокислоты далее сегментируются на изолейцин, гистидин, лейцин, лизин, метионин, фенилаланин, треонин, триптофан, валин и другие. Пептиды далее сегментируются на дипептиды, трипептиды, олигопептиды и полипептиды. Минералы далее подразделяются на кальций , фосфор, магний, натрий, калий, марганец, железо, медь, йод, цинк и др. Витамины далее подразделяются на витамин А, витамин С, витамин D, витамин Е, витамин К, витамин В1, витамин В2, витамин В3, витамин В6, витамин В12 и др.
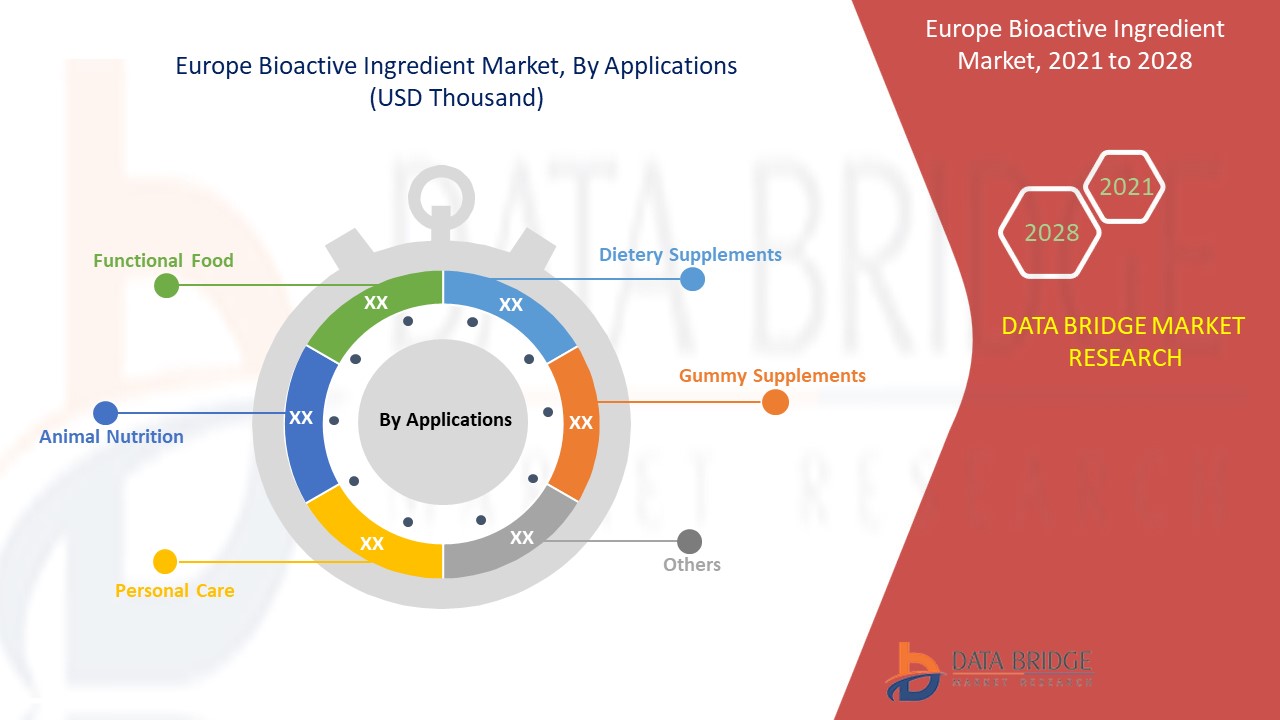
- На основе сферы применения глобальный рынок биоактивных ингредиентов сегментируется на функциональное питание, диетические добавки, жевательные добавки, питание для животных, средства личной гигиены и другие. Функциональное питание далее сегментируется на молочные продукты, молочные альтернативы, хлеб, макаронные изделия, хлопья, яичные продукты, батончики, батончики и напитки . Молочные продукты далее подразделяются на молоко, йогурт, сыр, масло и другие. Молочные альтернативы далее подразделяются на растительное молоко, растительный йогурт, биоактивные ингредиенты и другие. Батончики далее подразделяются на протеиновые батончики, батончики спортивного питания, батончики для йоги, батончики перед тренировкой, батончики после тренировки и другие. Напитки далее подразделяются на соки и смузи. Питание для животных далее сегментируется по категориям животных на говядину, птицу, морепродукты и свинину. Средства личной гигиены далее сегментируются на уход за волосами и уход за кожей.
- По источнику происхождения мировой рынок биологически активных ингредиентов сегментируется на растительные, животные и микробные.
Анализ рынка биологически активных ингредиентов на уровне страны в Европе
Проведен анализ европейского рынка биологически активных ингредиентов, а также предоставлена информация о его размере по ингредиентам, применению и источникам.
В отчете о европейском рынке биоактивных ингредиентов рассматриваются следующие страны: Германия, Великобритания, Франция, Италия, Испания, Нидерланды, Бельгия, Россия, Турция, Швейцария, Польша, Дания и остальные страны Европы.
Европейский рынок биоактивных ингредиентов доминирует из-за роста населения и заболеваемости среди значительной части общества.
Раздел отчета по странам также содержит отдельные факторы, влияющие на рынок, и изменения в регулировании на внутреннем рынке, которые влияют на текущие и будущие тенденции рынка. Такие данные, как новые продажи, заменяющие продажи, демографические данные страны, нормативные акты и импортно-экспортные тарифы, являются одними из основных указателей, используемых для прогнозирования рыночного сценария для отдельных стран. Кроме того, при предоставлении прогнозного анализа данных по стране учитываются наличие и доступность брендов и их проблемы из-за большой или малой конкуренции со стороны местных и отечественных брендов, влияние каналов продаж.
Рост в отрасли биоактивных ингредиентов
Европейский рынок биоактивных ингредиентов также предоставляет вам подробный анализ рынка для каждой страны, рост установленной базы различных видов продуктов для рынка биоактивных ингредиентов, влияние технологий с использованием кривых жизненной линии и изменения в сценариях регулирования детских смесей и их влияние на рынок биоактивных ингредиентов. Данные доступны за исторический период с 2010 по 2019 год.
Анализ конкурентной среды и доли рынка биологически активных ингредиентов
Конкурентная среда европейского рынка биоактивных ингредиентов содержит сведения по конкурентам. Включены сведения о компании, финансы компании, полученный доход, рыночный потенциал, инвестиции в исследования и разработки, новые рыночные инициативы, глобальное присутствие, производственные площадки и объекты, сильные и слабые стороны компании, запуск продукта, клинические испытания, анализ бренда, одобрение продукта, патенты, широта и дыхании продукта, доминирование приложений, кривая жизненной линии технологии. Приведенные выше данные относятся только к фокусу компании на европейском рынке биоактивных ингредиентов.
Основными игроками на мировом рынке биоактивных ингредиентов являются DSM, BASF SE, Kerry, DuPont, ADM, Global Bio-chem Technology Group Company Limited, Evonik Industries AG, Cargill,Incorporated, Arla Food Ingredients Group P/S (дочерняя компания Arla Foods amba), FMC Corporation, Sunrise Nutrachem Group, Adisseo (дочерняя компания Bluestar Adisseo Co., Ltd.), Chr.Hansen Holding A/S, Sabinsa, Ajinomoto Co., Inc, NOVUS INTERNATIONAL (дочерняя компания Mitsui & Co. (USA), Inc.), Ingredion, Roquette Frères, Probi и Advanced Animal Nutrition Pty Ltd. и другие.
Например,
- В июне 2020 года Sabinsa выпустила новый растительный экстракт «Куркумины», который помогает укрепить иммунную систему. Продукт был внедрен, чтобы вывести на рынок новое решение во время COVID-19.
SKU-
Get online access to the report on the World's First Market Intelligence Cloud
- Интерактивная панель анализа данных
- Панель анализа компании для возможностей с высоким потенциалом роста
- Доступ аналитика-исследователя для настройки и запросов
- Анализ конкурентов с помощью интерактивной панели
- Последние новости, обновления и анализ тенденций
- Используйте возможности сравнительного анализа для комплексного отслеживания конкурентов
Содержание
- introduction
- OBJECTIVES OF THE STUDY
- MARKET DEFINITION
- OVERVIEW of EUROPE BIOACTIVE INGREDIENT MARKET
- LIMITATION
- MARKETS COVERED
- MARKET SEGMENTATION
- MARKETS COVERED
- geographicAL scope
- years considered for the study
- currency and pricing
- DBMR TRIPOD DATA VALIDATION MODEL
- Ingredient LIFE LINE CURVE
- MULTIVARIATE MODELING
- primary interviews with key opinion leaders
- DBMR MARKET POSITION GRID
- MARKET application COVERAGE GRID
- DBMR MARKET CHALLENGE MATRIX
- vendor share analysis
- IMPORT-EXPORT DATA
- secondary sourcEs
- assumptions
- EXECUTIVE SUMMARY
- premium insights
- Factors Influencing Purchasing Decision:
- MAJOR BRANDS COMPETITIVE ANALYSIS:
- NEW PRODUCT BRAND LAUNCHES AND INNOVATIONS
- Investments Made by Top Manufacturers
- REGULATORY FRAMEWORK AND GUIDELINES
- supply chain analysis
- market overview
- drivers
- Progressive use of bioactive ingredients in personal care products
- Growth in the co-prescription of bioactive ingredient along with traditional drugs
- Rising demand of bioactive ingredients in functional food
- Increasing adoption of bioactive ingredients in pharmaceuticals for chronic diseases
- Surge in the incidence of lifestyle diseases and lack of nutrition
- RESTRAINTS
- Lack of regulatory framework for validating heath claims
- Therapeutic constraints allied with bioactive ingredient
- Inadequate controls on safety and quality of bioactive ingredients
- OPPORTUNITIES
- Increasing awareness among consumers with rising preference for prevention instead of cure
- ADVANCEMENT IN R&D ASSOCIATED WITH ENCAPSULATION OF BIOACTIVE INGREDIENTS
- Growing trust among the consumers towards herbal ingredients and its involvement in bioactive market
- Challenges
- EXTRACTION OF THE BIOACTIVE COMPOUNDS AND MAINTAINING GOOD RECOVERY
- Valorization of fruit and vegetable wastes as bioactive compounds
- Analysis on Impact of Covid-19 on ‘Europe Bioactive ingredient Market”
- IMPACT ON PRICE
- IMPACT ON DEMAND
- Impact on supply chain
- Conclusion
- Europe Bioactive ingredient market, BY Ingredient Type
- overview
- Peptides
- Dipeptides
- Tripeptides
- Oligopeptides
- Polypeptides
- Prebiotic
- Fructans
- Galacto-Oligosaccharides
- Starch and Glucose-Derived Oligosaccharides
- Non-Carbohydrate Oligosaccharides
- Others
- Probiotics
- Lactobacilli
- Bifidobacteria
- Yeasts
- Minerals
- Zinc
- Calcium
- Phosphorus
- Magnesium
- Sodium
- Potassium
- Manganese
- Iron
- Copper
- Iodine
- Others
- Vitamins
- Vitamin A
- Vitamin c
- Vitamin d
- Vitamin E
- Vitamin K
- Vitamin B1
- Vitamin B2
- Vitamin B3
- Vitamin B6
- Vitamin B12
- Others
- Amino Acid
- Isoleucine
- Histidine
- Leucine
- Lysine
- Methionine
- Phenylalanine
- Threonine
- Tryptophan
- Valine
- Others
- Omega 3 and Structured Lipi
- Phytochemicals & Plant Extracts
- Fibers and Specialty Carbohydrates
- Carotenoids & Antioxidants
- Others
- Europe Bioactive ingredient market, BY Applications
- overview
- Functional Food
- Dairy
- Milk
- Yogurt
- Cheese
- Butter
- Others
- Dairy Alternatives
- Plant-Based Milk
- Plant-Based Yogurt
- Bioactive Ingredients
- Others
- Bread
- Cereal
- Egg Products
- Beverages
- Juices
- Smoothies
- Bars
- Protein Bars
- Sports Nutrition Bars
- Pre Work Out Bars
- Post Work Out Bars
- Others
- Pasta
- Snack Bars
- Animal Nutrition
- ANIMAL NUTRITION, BY ANIMAL CATEGORY
- Poultry
- Seafood
- Beef
- Pork
- Personal Care
- Hair Care
- Skin Care
- Dietary Supplements
- Gummy Supplements
- Others
- Europe Bioactive ingredient market, BY Source
- overview
- Plant
- Animal
- Microbial
- EUROPE Bioactive ingredient Market, BY GEOGRAPHY
- Europe
- Germany
- U.K.
- France
- ITALY
- Spain
- Netherlands
- Belgium
- Russia
- Turkey
- SWItzerland
- Denmark
- Sweden
- Poland
- Rest of Europe
- EUROPE BIOACTIVE INGREDIENT MARKET: COMPANY landscape
- company share analysis: EUROPE
- COMPANY PROFILE
- dsm
- COMPANY SNAPSHOT
- REVENUE ANALYSIS
- COMPANY SHARE ANALYSIS
- PRODUCT PORTFOLIO
- RECENT UPDATE
- basf se
- COMPANY SNAPSHOT
- REVENUE ANALYSIS
- COMPANY SHARE ANALYSIS
- PRODUCT PORTFOLIO
- RECENT UPDATES
- KERRY
- COMPANY SNAPSHOT
- REVENUE ANALYSIS
- COMPANY SHARE ANALYSIS
- PRODUCT PORTFOLIO
- RECENT UPDATE
- dupont
- COMPANY SNAPSHOT
- REVENUE ANALYSIS
- COMPANY SHARE ANALYSIS
- PRODUCT PORTFOLIO
- RECENT UPDATES
- ADM
- COMPANY SNAPSHOT
- REVENUE ANALYSIS
- COMPANY SHARE ANALYSIS
- PRODUCT PORTFOLIO
- RECENT UPDATE
- EUROPE BIO-CHEM TECHNOLOGY GROUP COMPANY LIMITED
- COMPANY SNAPSHOT
- REVENUE ANALYSIS
- PRODUCT PORTFOLIO
- RECENT UPDATE
- EVONIK Industries AG
- COMPANY SNAPSHOT
- REVENUE ANALYSIS
- PRODUCT PORTFOLIO
- RECENT UPDATE
- CARGILL, Incorporated
- COMPANY SNAPSHOT
- REVENUE ANALYSIS
- PRODUCT PORTFOLIO
- RECENT UPDATE
- Adisseo (A subsidiary of bluestar adisseo co., ltd.)
- COMPANY SNAPSHOT
- REVENUE ANALYSIS
- PRODUCT PORTFOLIO
- RECENT UPDATE
- Advanced animal nutrition pty ltd.
- COMPANY SNAPSHOT
- PRODUCT PORTFOLIO
- RECENT UPDATE
- Ajinomoto Co., Inc.
- COMPANY SNAPSHOT
- REVENUE ANALYSIS
- PRODUCT PORTFOLIO
- RECENT UPDATES
- Arla Food Ingrediants Group P/S (a subsidiary of Arla foods amba)
- COMPANY SNAPSHOT
- REVENUE ANALYSIS
- PRODUCT PORTFOLIO
- RECENT UPDATES
- Chr. hansen holding a/s
- COMPANY SNAPSHOT
- REVENUE ANALYSIS
- PRODUCT PORTFOLIO
- RECENT UPDATES
- FMC CORPORATION
- COMPANY SNAPSHOT
- REVENUE ANALYSIS
- PRODUCT PORTFOLIO
- RECENT UPDATE
- INGREDION
- COMPANY SNAPSHOT
- REVENUE ANALYSIS
- PRODUCT PORTFOLIO
- RECENT UPDATE
- novus international (A SUBSIDIARY OF Mitsui & Co. (U.S.A.), Inc.)
- COMPANY SNAPSHOT
- REVENUE ANALYSIS
- PRODUCT PORTFOLIO
- RECENT UPDATE
- pROBI
- COMPANY SNAPSHOT
- REVENUE ANALYSIS
- SOLUTION PORTFOLIO
- RECENT UPDATE
- Roquette FrèreS
- COMPANY SNAPSHOT
- PRODUCT PORTFOLIO
- RECENT UPDATE
- SabinsA
- COMPANY SNAPSHOT
- PRODUCT PORTFOLIO
- RECENT UPDATES
- sunrise nutrachem grouP
- COMPANY SNAPSHOT
- PRODUCT PORTFOLIO
- RECENT UPDATES
- QUESTIONNAIRES
- related reports
Список таблиц
TABLE 1 IMPORT DATA of Food preparations, n.e.s.; HS Code - 210690 (USD Thousand)
TABLE 2 EXPORT DATA OF FOOD PREPARATIONS, N.E.S.; HS CODE - 210690 (USD THOUSAND)
TABLE 1 Europe bioactive ingredient market, By Ingredient Type, 2019-2028 (USD Thousand)
TABLE 2 Europe Bioactive ingredient Market, By Ingredient Type, 2019-2028 (Tons)
TABLE 3 Europe Peptides in bioactive ingredient MARKET, BY REGION, 2019-2028 (USD Thousand)
TABLE 4 Europe Peptides in bioactive ingredient MARKET, BY REGION, 2019-2028 (Tons)
TABLE 5 Europe Peptides in Bioactive Ingredient Market, By Ingredient Type, 2019-2028 (USD Thousand)
TABLE 6 Europe prebiotic in bioactive ingredient MARKET, BY REGION, 2019-2028 (USD Thousand)
TABLE 7 Europe prebiotic in bioactive ingredient MARKET, BY REGION, 2019-2028 (Tons)
TABLE 8 Europe Prebiotic in Bioactive Ingredient Market, By Ingredient Type, 2019-2028 (USD Thousand)
TABLE 9 Europe Probiotics in bioactive ingredient MARKET, BY REGION, 2019-2028 (USD Thousand)
TABLE 10 Europe Probiotics in bioactive ingredient MARKET, BY REGION, 2019-2028 (Tons)
TABLE 11 Europe Probiotic in Bioactive Ingredient Market, By Ingredient Type, 2019-2028 (USD Thousand)
TABLE 12 Europe Minerals in bioactive ingredient MARKET, BY REGION, 2019-2028 (USD Thousand)
TABLE 13 Europe Minerals in bioactive ingredient MARKET, BY REGION, 2019-2028 (Tons)
TABLE 14 Europe Minerals in Bioactive Ingredient Market, By Ingredient Type, 2019-2028 (USD Thousand)
TABLE 15 Europe Vitamins in bioactive ingredient MARKET, BY REGION, 2019-2028 (USD Thousand)
TABLE 16 Europe Vitamins in bioactive ingredient MARKET, BY REGION, 2019-2028 (Tons)
TABLE 17 Europe Vitamins in Bioactive Ingredient Market, By Ingredient Type, 2019-2028 (USD Thousand)
TABLE 18 Europe Amino Acid in bioactive ingredient MARKET, BY REGION, 2019-2028 (USD Thousand)
TABLE 19 Europe Amino Acid in bioactive ingredient MARKET, BY REGION, 2019-2028 (Tons)
TABLE 20 Europe AMINO ACID in Bioactive Ingredient Market, By Ingredient Type, 2019-2028 (USD Thousand)
TABLE 21 Europe Omega 3 and Structured Lipi in bioactive ingredient MARKET, BY REGION, 2019-2028 (USD Thousand)
TABLE 22 Europe Omega 3 and Structured Lipi in bioactive ingredient MARKET, BY REGION, 2019-2028 (Tons)
TABLE 23 Europe Phytochemicals & Plant Extracts in bioactive ingredient MARKET, BY REGION, 2019-2028 (USD Thousand)
TABLE 24 Europe Phytochemicals & Plant Extracts in bioactive ingredient MARKET, BY REGION, 2019-2028 (Tons)
TABLE 25 Europe Fibers and Specialty Carbohydrates in bioactive ingredient MARKET, BY REGION, 2019-2028 (USD Thousand)
TABLE 26 Europe Fibers and Specialty Carbohydrates in bioactive ingredient MARKET, BY REGION, 2019-2028 (Tons)
TABLE 27 Europe Carotenoids & Antioxidants in bioactive ingredient MARKET, BY REGION, 2019-2028 (USD Thousand)
TABLE 28 Europe Carotenoids & Antioxidants in bioactive ingredient MARKET, BY REGION, 2019-2028 (Tons)
TABLE 29 Europe Others in bioactive ingredient MARKET, BY REGION, 2019-2028 (USD Thousand)
TABLE 30 Europe Others in bioactive ingredient MARKET, BY REGION, 2019-2028 (Tons)
TABLE 31 Europe bioactive ingredient market, By Applications, 2019-2028 (USD Thousand)
TABLE 32 Europe Functional Food in bioactive ingredient MARKET, BY REGION, 2019-2028 (USD Thousand)
TABLE 33 Europe Functional Food in Bioactive Ingredient Market, By Applications, 2019-2028 (USD Thousand)
TABLE 34 Europe Dairy in Bioactive Ingredient Market, By Applications, 2019-2028 (USD Thousand)
TABLE 35 Europe Dairy alternatives in Bioactive Ingredient Market, By Applications, 2019-2028 (USD Thousand)
TABLE 36 Europe Beverages in Bioactive Ingredient Market, By Applications, 2019-2028 (USD Thousand)
TABLE 37 Europe Bars in Bioactive Ingredient Market, By Applications, 2019-2028 (USD Thousand)
TABLE 38 Europe Animal Nutrition in bioactive ingredient MARKET, BY REGION, 2019-2028 (USD Thousand)
TABLE 39 Europe Animal Nutrition in Bioactive Ingredient Market, By Applications, 2019-2028 (USD Thousand)
TABLE 40 Europe Personal Care in bioactive ingredient MARKET, BY REGION, 2019-2028 (USD Thousand)
TABLE 41 Europe Personal care in Bioactive Ingredient Market, By Applications, 2019-2028 (USD Thousand)
TABLE 42 Europe Dietary Supplements in bioactive ingredient MARKET, BY REGION, 2019-2028 (USD Thousand)
TABLE 43 Europe Gummy Supplements in bioactive ingredient MARKET, BY REGION, 2019-2028 (USD Thousand)
TABLE 44 Europe Others in bioactive ingredient MARKET, BY REGION, 2019-2028 (USD Thousand)
TABLE 45 Europe bioactive ingredient market, By Source, 2019-2028 (USD Thousand)
TABLE 46 Europe Plant in bioactive ingredient MARKET, BY REGION, 2019-2028 (USD Thousand)
TABLE 47 Europe Animal in bioactive ingredient MARKET, BY REGION, 2019-2028 (USD Thousand)
TABLE 48 Europe Microbial in bioactive ingredient MARKET, BY REGION, 2019-2028 (USD Thousand)
TABLE 49 Europe bioactive ingredient Market, BY COUNtry, 2019-2028 (USD Thousand)
TABLE 50 Europe bioactive ingredient Market, BY COUNtry, 2019-2028 (tons)
TABLE 51 Europe Bioactive ingredient Market, By Ingredient Type, 2019-2028 (USD Thousand)
TABLE 52 Europe Bioactive ingredient Market, By Ingredient Type, 2019-2028 (Tons)
TABLE 53 Europe Peptides in Bioactive ingredient Market, By Ingredient Type, 2019-2028 (USD Thousand)
TABLE 54 Europe Prebiotic in Bioactive ingredient Market, By Ingredient Type, 2019-2028 (USD Thousand)
TABLE 55 Europe Probiotic in Bioactive ingredient Market, By Ingredient Type, 2019-2028 (USD Thousand)
TABLE 56 Europe Minerals in Bioactive ingredient Market, By Ingredient Type, 2019-2028 (USD Thousand)
TABLE 57 Europe Vitamins in Bioactive ingredient Market, By Ingredient Type, 2019-2028 (USD Thousand)
TABLE 58 Europe Amino Acid in Bioactive ingredient Market, By Ingredient Type, 2019-2028 (USD Thousand)
TABLE 59 Europe Bioactive ingredient Market, By Applications, 2019-2028 (USD Thousand)
TABLE 60 Europe Functional Food in Bioactive ingredient Market, By Applications, 2019-2028 (USD Thousand)
TABLE 61 Europe Dairy in Bioactive ingredient Market, By Applications, 2019-2028 (USD Thousand)
TABLE 62 Europe Dairy Alternatives in Bioactive ingredient Market, By Applications, 2019-2028 (USD Thousand)
TABLE 63 Europe Beverages in Bioactive ingredient Market, By Applications, 2019-2028 (USD Thousand)
TABLE 64 Europe Bars in Bioactive ingredient Market, By Applications, 2019-2028 (USD Thousand)
TABLE 65 Europe Animal Nutrition in Bioactive ingredient Market, By Applications, 2019-2028 (USD Thousand)
TABLE 66 Europe Personal Care in Bioactive ingredient Market, By Applications, 2019-2028 (USD Thousand)
TABLE 67 Europe Bioactive ingredient Market, By Source, 2019-2028 (USD Thousand)
TABLE 68 GERMANY Bioactive ingredient Market, By Ingredient Type, 2019-2028 (USD Thousand)
TABLE 69 GERMANY Bioactive ingredient Market, By Ingredient Type, 2019-2028 (Tons)
TABLE 70 GERMANY Peptides in Bioactive ingredient Market, By Ingredient Type, 2019-2028 (USD Thousand)
TABLE 71 GERMANY Prebiotic in Bioactive ingredient Market, By Ingredient Type, 2019-2028 (USD Thousand)
TABLE 72 GERMANY Probiotic in Bioactive ingredient Market, By Ingredient Type, 2019-2028 (USD Thousand)
TABLE 73 GERMANY Minerals in Bioactive ingredient Market, By Ingredient Type, 2019-2028 (USD Thousand)
TABLE 74 GERMANY Vitamins in Bioactive ingredient Market, By Ingredient Type, 2019-2028 (USD Thousand)
TABLE 75 GERMANY Amino Acid in Bioactive ingredient Market, By Ingredient Type, 2019-2028 (USD Thousand)
TABLE 76 GERMANY Bioactive ingredient Market, By Applications, 2019-2028 (USD Thousand)
TABLE 77 GERMANY Functional Food in Bioactive ingredient Market, By Applications, 2019-2028 (USD Thousand)
TABLE 78 GERMANY Dairy in Bioactive ingredient Market, By Applications, 2019-2028 (USD Thousand)
TABLE 79 GERMANY Dairy Alternatives in Bioactive ingredient Market, By Applications, 2019-2028 (USD Thousand)
TABLE 80 GERMANY Beverages in Bioactive ingredient Market, By Applications, 2019-2028 (USD Thousand)
TABLE 81 GERMANY Bars in Bioactive ingredient Market, By Applications, 2019-2028 (USD Thousand)
TABLE 82 GERMANY Animal Nutrition in Bioactive ingredient Market, By Applications, 2019-2028 (USD Thousand)
TABLE 83 GERMANY Personal Care in Bioactive ingredient Market, By Applications, 2019-2028 (USD Thousand)
TABLE 84 GERMANY Bioactive ingredient Market, By Source, 2019-2028 (USD Thousand)
TABLE 85 U.K. Bioactive ingredient Market, By Ingredient Type, 2019-2028 (USD Thousand)
TABLE 86 U.K. Bioactive ingredient Market, By Ingredient Type, 2019-2028 (Tons)
TABLE 87 U.K. Peptides in Bioactive ingredient Market, By Ingredient Type, 2019-2028 (USD Thousand)
TABLE 88 U.K. Prebiotic in Bioactive ingredient Market, By Ingredient Type, 2019-2028 (USD Thousand)
TABLE 89 U.K. Probiotic in Bioactive ingredient Market, By Ingredient Type, 2019-2028 (USD Thousand)
TABLE 90 U.K. Minerals in Bioactive ingredient Market, By Ingredient Type, 2019-2028 (USD Thousand)
TABLE 91 U.K. Vitamins in Bioactive ingredient Market, By Ingredient Type, 2019-2028 (USD Thousand)
TABLE 92 U.K. Amino Acid in Bioactive ingredient Market, By Ingredient Type, 2019-2028 (USD Thousand)
TABLE 93 U.K. Bioactive ingredient Market, By Applications, 2019-2028 (USD Thousand)
TABLE 94 U.K. Functional Food in Bioactive ingredient Market, By Applications, 2019-2028 (USD Thousand)
TABLE 95 U.K. Dairy in Bioactive ingredient Market, By Applications, 2019-2028 (USD Thousand)
TABLE 96 U.K. Dairy Alternatives in Bioactive ingredient Market, By Applications, 2019-2028 (USD Thousand)
TABLE 97 U.K. Beverages in Bioactive ingredient Market, By Applications, 2019-2028 (USD Thousand)
TABLE 98 U.K. Bars in Bioactive ingredient Market, By Applications, 2019-2028 (USD Thousand)
TABLE 99 U.K. Animal Nutrition in Bioactive ingredient Market, By Applications, 2019-2028 (USD Thousand)
TABLE 100 U.K. Personal Care in Bioactive ingredient Market, By Applications, 2019-2028 (USD Thousand)
TABLE 101 U.K. Bioactive ingredient Market, By Source, 2019-2028 (USD Thousand)
TABLE 102 FRANCE Bioactive ingredient Market, By Ingredient Type, 2019-2028 (USD Thousand)
TABLE 103 FRANCE Bioactive ingredient Market, By Ingredient Type, 2019-2028 (Tons)
TABLE 104 FRANCE Peptides in Bioactive ingredient Market, By Ingredient Type, 2019-2028 (USD Thousand)
TABLE 105 FRANCE Prebiotic in Bioactive ingredient Market, By Ingredient Type, 2019-2028 (USD Thousand)
TABLE 106 FRANCE Probiotic in Bioactive ingredient Market, By Ingredient Type, 2019-2028 (USD Thousand)
TABLE 107 FRANCE Minerals in Bioactive ingredient Market, By Ingredient Type, 2019-2028 (USD Thousand)
TABLE 108 FRANCE Vitamins in Bioactive ingredient Market, By Ingredient Type, 2019-2028 (USD Thousand)
TABLE 109 FRANCE Amino Acid in Bioactive ingredient Market, By Ingredient Type, 2019-2028 (USD Thousand)
TABLE 110 FRANCE Bioactive ingredient Market, By Applications, 2019-2028 (USD Thousand)
TABLE 111 FRANCE Functional Food in Bioactive ingredient Market, By Applications, 2019-2028 (USD Thousand)
TABLE 112 FRANCE Dairy in Bioactive ingredient Market, By Applications, 2019-2028 (USD Thousand)
TABLE 113 FRANCE Dairy Alternatives in Bioactive ingredient Market, By Applications, 2019-2028 (USD Thousand)
TABLE 114 FRANCE Beverages in Bioactive ingredient Market, By Applications, 2019-2028 (USD Thousand)
TABLE 115 FRANCE Bars in Bioactive ingredient Market, By Applications, 2019-2028 (USD Thousand)
TABLE 116 FRANCE Animal Nutrition in Bioactive ingredient Market, By Applications, 2019-2028 (USD Thousand)
TABLE 117 FRANCE Personal Care in Bioactive ingredient Market, By Applications, 2019-2028 (USD Thousand)
TABLE 118 FRANCE Bioactive ingredient Market, By Source, 2019-2028 (USD Thousand)
TABLE 119 ITALY Bioactive ingredient Market, By Ingredient Type, 2019-2028 (USD Thousand)
TABLE 120 ITALY Bioactive ingredient Market, By Ingredient Type, 2019-2028 (Tons)
TABLE 121 ITALY Peptides in Bioactive ingredient Market, By Ingredient Type, 2019-2028 (USD Thousand)
TABLE 122 ITALY Prebiotic in Bioactive ingredient Market, By Ingredient Type, 2019-2028 (USD Thousand)
TABLE 123 ITALY Probiotic in Bioactive ingredient Market, By Ingredient Type, 2019-2028 (USD Thousand)
TABLE 124 ITALY Minerals in Bioactive ingredient Market, By Ingredient Type, 2019-2028 (USD Thousand)
TABLE 125 ITALY Vitamins in Bioactive ingredient Market, By Ingredient Type, 2019-2028 (USD Thousand)
TABLE 126 ITALY Amino Acid in Bioactive ingredient Market, By Ingredient Type, 2019-2028 (USD Thousand)
TABLE 127 ITALY Bioactive ingredient Market, By Applications, 2019-2028 (USD Thousand)
TABLE 128 ITALY Functional Food in Bioactive ingredient Market, By Applications, 2019-2028 (USD Thousand)
TABLE 129 ITALY Dairy in Bioactive ingredient Market, By Applications, 2019-2028 (USD Thousand)
TABLE 130 ITALY Dairy Alternatives in Bioactive ingredient Market, By Applications, 2019-2028 (USD Thousand)
TABLE 131 ITALY Beverages in Bioactive ingredient Market, By Applications, 2019-2028 (USD Thousand)
TABLE 132 ITALY Bars in Bioactive ingredient Market, By Applications, 2019-2028 (USD Thousand)
TABLE 133 ITALY Animal Nutrition in Bioactive ingredient Market, By Applications, 2019-2028 (USD Thousand)
TABLE 134 ITALY Personal Care in Bioactive ingredient Market, By Applications, 2019-2028 (USD Thousand)
TABLE 135 ITALY Bioactive ingredient Market, By Source, 2019-2028 (USD Thousand)
TABLE 136 SPAIN Bioactive ingredient Market, By Ingredient Type, 2019-2028 (USD Thousand)
TABLE 137 SPAIN Bioactive ingredient Market, By Ingredient Type, 2019-2028 (Tons)
TABLE 138 SPAIN Peptides in Bioactive ingredient Market, By Ingredient Type, 2019-2028 (USD Thousand)
TABLE 139 SPAIN Prebiotic in Bioactive ingredient Market, By Ingredient Type, 2019-2028 (USD Thousand)
TABLE 140 SPAIN Probiotic in Bioactive ingredient Market, By Ingredient Type, 2019-2028 (USD Thousand)
TABLE 141 SPAIN Minerals in Bioactive ingredient Market, By Ingredient Type, 2019-2028 (USD Thousand)
TABLE 142 SPAIN Vitamins in Bioactive ingredient Market, By Ingredient Type, 2019-2028 (USD Thousand)
TABLE 143 SPAIN Amino Acid in Bioactive ingredient Market, By Ingredient Type, 2019-2028 (USD Thousand)
TABLE 144 SPAIN Bioactive ingredient Market, By Applications, 2019-2028 (USD Thousand)
TABLE 145 SPAIN Functional Food in Bioactive ingredient Market, By Applications, 2019-2028 (USD Thousand)
TABLE 146 SPAIN Dairy in Bioactive ingredient Market, By Applications, 2019-2028 (USD Thousand)
TABLE 147 SPAIN Dairy Alternatives in Bioactive ingredient Market, By Applications, 2019-2028 (USD Thousand)
TABLE 148 SPAIN Beverages in Bioactive ingredient Market, By Applications, 2019-2028 (USD Thousand)
TABLE 149 SPAIN Bars in Bioactive ingredient Market, By Applications, 2019-2028 (USD Thousand)
TABLE 150 SPAIN Animal Nutrition in Bioactive ingredient Market, By Applications, 2019-2028 (USD Thousand)
TABLE 151 SPAIN Personal Care in Bioactive ingredient Market, By Applications, 2019-2028 (USD Thousand)
TABLE 152 SPAIN Bioactive ingredient Market, By Source, 2019-2028 (USD Thousand)
TABLE 153 NETHERLANDS Bioactive ingredient Market, By Ingredient Type, 2019-2028 (USD Thousand)
TABLE 154 NETHERLANDS Bioactive ingredient Market, By Ingredient Type, 2019-2028 (Tons)
TABLE 155 NETHERLANDS Peptides in Bioactive ingredient Market, By Ingredient Type, 2019-2028 (USD Thousand)
TABLE 156 NETHERLANDS Prebiotic in Bioactive ingredient Market, By Ingredient Type, 2019-2028 (USD Thousand)
TABLE 157 NETHERLANDS Probiotic in Bioactive ingredient Market, By Ingredient Type, 2019-2028 (USD Thousand)
TABLE 158 NETHERLANDS Minerals in Bioactive ingredient Market, By Ingredient Type, 2019-2028 (USD Thousand)
TABLE 159 NETHERLANDS Vitamins in Bioactive ingredient Market, By Ingredient Type, 2019-2028 (USD Thousand)
TABLE 160 NETHERLANDS Amino Acid in Bioactive ingredient Market, By Ingredient Type, 2019-2028 (USD Thousand)
TABLE 161 NETHERLANDS Bioactive ingredient Market, By Applications, 2019-2028 (USD Thousand)
TABLE 162 NETHERLANDS Functional Food in Bioactive ingredient Market, By Applications, 2019-2028 (USD Thousand)
TABLE 163 NETHERLANDS Dairy in Bioactive ingredient Market, By Applications, 2019-2028 (USD Thousand)
TABLE 164 NETHERLANDS Dairy Alternatives in Bioactive ingredient Market, By Applications, 2019-2028 (USD Thousand)
TABLE 165 NETHERLANDS Beverages in Bioactive ingredient Market, By Applications, 2019-2028 (USD Thousand)
TABLE 166 NETHERLANDS Bars in Bioactive ingredient Market, By Applications, 2019-2028 (USD Thousand)
TABLE 167 NETHERLANDS Animal Nutrition in Bioactive ingredient Market, By Applications, 2019-2028 (USD Thousand)
TABLE 168 NETHERLANDS Personal Care in Bioactive ingredient Market, By Applications, 2019-2028 (USD Thousand)
TABLE 169 NETHERLANDS Bioactive ingredient Market, By Source, 2019-2028 (USD Thousand)
TABLE 170 BELGIUM Bioactive ingredient Market, By Ingredient Type, 2019-2028 (USD Thousand)
TABLE 171 BELGIUM Bioactive ingredient Market, By Ingredient Type, 2019-2028 (Tons)
TABLE 172 BELGIUM Peptides in Bioactive ingredient Market, By Ingredient Type, 2019-2028 (USD Thousand)
TABLE 173 BELGIUM Prebiotic in Bioactive ingredient Market, By Ingredient Type, 2019-2028 (USD Thousand)
TABLE 174 BELGIUM Probiotic in Bioactive ingredient Market, By Ingredient Type, 2019-2028 (USD Thousand)
TABLE 175 BELGIUM Minerals in Bioactive ingredient Market, By Ingredient Type, 2019-2028 (USD Thousand)
TABLE 176 BELGIUM Vitamins in Bioactive ingredient Market, By Ingredient Type, 2019-2028 (USD Thousand)
TABLE 177 BELGIUM Amino Acid in Bioactive ingredient Market, By Ingredient Type, 2019-2028 (USD Thousand)
TABLE 178 BELGIUM Bioactive ingredient Market, By Applications, 2019-2028 (USD Thousand)
TABLE 179 BELGIUM Functional Food in Bioactive ingredient Market, By Applications, 2019-2028 (USD Thousand)
TABLE 180 BELGIUM Dairy in Bioactive ingredient Market, By Applications, 2019-2028 (USD Thousand)
TABLE 181 BELGIUM Dairy Alternatives in Bioactive ingredient Market, By Applications, 2019-2028 (USD Thousand)
TABLE 182 BELGIUM Beverages in Bioactive ingredient Market, By Applications, 2019-2028 (USD Thousand)
TABLE 183 BELGIUM Bars in Bioactive ingredient Market, By Applications, 2019-2028 (USD Thousand)
TABLE 184 BELGIUM Animal Nutrition in Bioactive ingredient Market, By Applications, 2019-2028 (USD Thousand)
TABLE 185 BELGIUM Personal Care in Bioactive ingredient Market, By Applications, 2019-2028 (USD Thousand)
TABLE 186 BELGIUM Bioactive ingredient Market, By Source, 2019-2028 (USD Thousand)
TABLE 187 RUSSIA Bioactive ingredient Market, By Ingredient Type, 2019-2028 (USD Thousand)
TABLE 188 RUSSIA Bioactive ingredient Market, By Ingredient Type, 2019-2028 (Tons)
TABLE 189 RUSSIA Peptides in Bioactive ingredient Market, By Ingredient Type, 2019-2028 (USD Thousand)
TABLE 190 RUSSIA Prebiotic in Bioactive ingredient Market, By Ingredient Type, 2019-2028 (USD Thousand)
TABLE 191 RUSSIA Probiotic in Bioactive ingredient Market, By Ingredient Type, 2019-2028 (USD Thousand)
TABLE 192 RUSSIA Minerals in Bioactive ingredient Market, By Ingredient Type, 2019-2028 (USD Thousand)
TABLE 193 RUSSIA Vitamins in Bioactive ingredient Market, By Ingredient Type, 2019-2028 (USD Thousand)
TABLE 194 RUSSIA Amino Acid in Bioactive ingredient Market, By Ingredient Type, 2019-2028 (USD Thousand)
TABLE 195 RUSSIA Bioactive ingredient Market, By Applications, 2019-2028 (USD Thousand)
TABLE 196 RUSSIA Functional Food in Bioactive ingredient Market, By Applications, 2019-2028 (USD Thousand)
TABLE 197 RUSSIA Dairy in Bioactive ingredient Market, By Applications, 2019-2028 (USD Thousand)
TABLE 198 RUSSIA Dairy Alternatives in Bioactive ingredient Market, By Applications, 2019-2028 (USD Thousand)
TABLE 199 RUSSIA Beverages in Bioactive ingredient Market, By Applications, 2019-2028 (USD Thousand)
TABLE 200 RUSSIA Bars in Bioactive ingredient Market, By Applications, 2019-2028 (USD Thousand)
TABLE 201 RUSSIA Animal Nutrition in Bioactive ingredient Market, By Applications, 2019-2028 (USD Thousand)
TABLE 202 RUSSIA Personal Care in Bioactive ingredient Market, By Applications, 2019-2028 (USD Thousand)
TABLE 203 RUSSIA Bioactive ingredient Market, By Source, 2019-2028 (USD Thousand)
TABLE 204 TURKEY Bioactive ingredient Market, By Ingredient Type, 2019-2028 (USD Thousand)
TABLE 205 TURKEY Bioactive ingredient Market, By Ingredient Type, 2019-2028 (Tons)
TABLE 206 TURKEY Peptides in Bioactive ingredient Market, By Ingredient Type, 2019-2028 (USD Thousand)
TABLE 207 TURKEY Prebiotic in Bioactive ingredient Market, By Ingredient Type, 2019-2028 (USD Thousand)
TABLE 208 TURKEY Probiotic in Bioactive ingredient Market, By Ingredient Type, 2019-2028 (USD Thousand)
TABLE 209 TURKEY Minerals in Bioactive ingredient Market, By Ingredient Type, 2019-2028 (USD Thousand)
TABLE 210 TURKEY Vitamins in Bioactive ingredient Market, By Ingredient Type, 2019-2028 (USD Thousand)
TABLE 211 TURKEY Amino Acid in Bioactive ingredient Market, By Ingredient Type, 2019-2028 (USD Thousand)
TABLE 212 TURKEY Bioactive ingredient Market, By Applications, 2019-2028 (USD Thousand)
TABLE 213 TURKEY Functional Food in Bioactive ingredient Market, By Applications, 2019-2028 (USD Thousand)
TABLE 214 TURKEY Dairy in Bioactive ingredient Market, By Applications, 2019-2028 (USD Thousand)
TABLE 215 TURKEY Dairy Alternatives in Bioactive ingredient Market, By Applications, 2019-2028 (USD Thousand)
TABLE 216 TURKEY Beverages in Bioactive ingredient Market, By Applications, 2019-2028 (USD Thousand)
TABLE 217 TURKEY Bars in Bioactive ingredient Market, By Applications, 2019-2028 (USD Thousand)
TABLE 218 TURKEY Animal Nutrition in Bioactive ingredient Market, By Applications, 2019-2028 (USD Thousand)
TABLE 219 TURKEY Personal Care in Bioactive ingredient Market, By Applications, 2019-2028 (USD Thousand)
TABLE 220 TURKEY Bioactive ingredient Market, By Source, 2019-2028 (USD Thousand)
TABLE 221 SWITZERLAND Bioactive ingredient Market, By Ingredient Type, 2019-2028 (USD Thousand)
TABLE 222 SWITZERLAND Bioactive ingredient Market, By Ingredient Type, 2019-2028 (Tons)
TABLE 223 SWITZERLAND Peptides in Bioactive ingredient Market, By Ingredient Type, 2019-2028 (USD Thousand)
TABLE 224 SWITZERLAND Prebiotic in Bioactive ingredient Market, By Ingredient Type, 2019-2028 (USD Thousand)
TABLE 225 SWITZERLAND Probiotic in Bioactive ingredient Market, By Ingredient Type, 2019-2028 (USD Thousand)
TABLE 226 SWITZERLAND Minerals in Bioactive ingredient Market, By Ingredient Type, 2019-2028 (USD Thousand)
TABLE 227 SWITZERLAND Vitamins in Bioactive ingredient Market, By Ingredient Type, 2019-2028 (USD Thousand)
TABLE 228 SWITZERLAND Amino Acid in Bioactive ingredient Market, By Ingredient Type, 2019-2028 (USD Thousand)
TABLE 229 SWITZERLAND Bioactive ingredient Market, By Applications, 2019-2028 (USD Thousand)
TABLE 230 SWITZERLAND Functional Food in Bioactive ingredient Market, By Applications, 2019-2028 (USD Thousand)
TABLE 231 SWITZERLAND Dairy in Bioactive ingredient Market, By Applications, 2019-2028 (USD Thousand)
TABLE 232 SWITZERLAND Dairy Alternatives in Bioactive ingredient Market, By Applications, 2019-2028 (USD Thousand)
TABLE 233 SWITZERLAND Beverages in Bioactive ingredient Market, By Applications, 2019-2028 (USD Thousand)
TABLE 234 SWITZERLAND Bars in Bioactive ingredient Market, By Applications, 2019-2028 (USD Thousand)
TABLE 235 SWITZERLAND Animal Nutrition in Bioactive ingredient Market, By Applications, 2019-2028 (USD Thousand)
TABLE 236 SWITZERLAND Personal Care in Bioactive ingredient Market, By Applications, 2019-2028 (USD Thousand)
TABLE 237 SWITZERLAND Bioactive ingredient Market, By Source, 2019-2028 (USD Thousand)
TABLE 238 DENMARK Bioactive ingredient Market, By Ingredient Type, 2019-2028 (USD Thousand)
TABLE 239 DENMARK Bioactive ingredient Market, By Ingredient Type, 2019-2028 (Tons)
TABLE 240 DENMARK Peptides in Bioactive ingredient Market, By Ingredient Type, 2019-2028 (USD Thousand)
TABLE 241 DENMARK Prebiotic in Bioactive ingredient Market, By Ingredient Type, 2019-2028 (USD Thousand)
TABLE 242 DENMARK Probiotic in Bioactive ingredient Market, By Ingredient Type, 2019-2028 (USD Thousand)
TABLE 243 DENMARK Minerals in Bioactive ingredient Market, By Ingredient Type, 2019-2028 (USD Thousand)
TABLE 244 DENMARK Vitamins in Bioactive ingredient Market, By Ingredient Type, 2019-2028 (USD Thousand)
TABLE 245 DENMARK Amino Acid in Bioactive ingredient Market, By Ingredient Type, 2019-2028 (USD Thousand)
TABLE 246 DENMARK Bioactive ingredient Market, By Applications, 2019-2028 (USD Thousand)
TABLE 247 DENMARK Functional Food in Bioactive ingredient Market, By Applications, 2019-2028 (USD Thousand)
TABLE 248 DENMARK Dairy in Bioactive ingredient Market, By Applications, 2019-2028 (USD Thousand)
TABLE 249 DENMARK Dairy Alternatives in Bioactive ingredient Market, By Applications, 2019-2028 (USD Thousand)
TABLE 250 DENMARK Beverages in Bioactive ingredient Market, By Applications, 2019-2028 (USD Thousand)
TABLE 251 DENMARK Bars in Bioactive ingredient Market, By Applications, 2019-2028 (USD Thousand)
TABLE 252 DENMARK Animal Nutrition in Bioactive ingredient Market, By Applications, 2019-2028 (USD Thousand)
TABLE 253 DENMARK Personal Care in Bioactive ingredient Market, By Applications, 2019-2028 (USD Thousand)
TABLE 254 DENMARK Bioactive ingredient Market, By Source, 2019-2028 (USD Thousand)
TABLE 255 SWEDEN Bioactive ingredient Market, By Ingredient Type, 2019-2028 (USD Thousand)
TABLE 256 SWEDEN Bioactive ingredient Market, By Ingredient Type, 2019-2028 (Tons)
TABLE 257 SWEDEN Peptides in Bioactive ingredient Market, By Ingredient Type, 2019-2028 (USD Thousand)
TABLE 258 SWEDEN Prebiotic in Bioactive ingredient Market, By Ingredient Type, 2019-2028 (USD Thousand)
TABLE 259 SWEDEN Probiotic in Bioactive ingredient Market, By Ingredient Type, 2019-2028 (USD Thousand)
TABLE 260 SWEDEN Minerals in Bioactive ingredient Market, By Ingredient Type, 2019-2028 (USD Thousand)
TABLE 261 SWEDEN Vitamins in Bioactive ingredient Market, By Ingredient Type, 2019-2028 (USD Thousand)
TABLE 262 SWEDEN Amino Acid in Bioactive ingredient Market, By Ingredient Type, 2019-2028 (USD Thousand)
TABLE 263 SWEDEN Bioactive ingredient Market, By Applications, 2019-2028 (USD Thousand)
TABLE 264 SWEDEN Functional Food in Bioactive ingredient Market, By Applications, 2019-2028 (USD Thousand)
TABLE 265 SWEDEN Dairy in Bioactive ingredient Market, By Applications, 2019-2028 (USD Thousand)
TABLE 266 SWEDEN Dairy Alternatives in Bioactive ingredient Market, By Applications, 2019-2028 (USD Thousand)
TABLE 267 SWEDEN Beverages in Bioactive ingredient Market, By Applications, 2019-2028 (USD Thousand)
TABLE 268 SWEDEN Bars in Bioactive ingredient Market, By Applications, 2019-2028 (USD Thousand)
TABLE 269 SWEDEN Animal Nutrition in Bioactive ingredient Market, By Applications, 2019-2028 (USD Thousand)
TABLE 270 SWEDEN Personal Care in Bioactive ingredient Market, By Applications, 2019-2028 (USD Thousand)
TABLE 271 SWEDEN Bioactive ingredient Market, By Source, 2019-2028 (USD Thousand)
TABLE 272 POLAND Bioactive ingredient Market, By Ingredient Type, 2019-2028 (USD Thousand)
TABLE 273 POLAND Bioactive ingredient Market, By Ingredient Type, 2019-2028 (Tons)
TABLE 274 POLAND Peptides in Bioactive ingredient Market, By Ingredient Type, 2019-2028 (USD Thousand)
TABLE 275 POLAND Prebiotic in Bioactive ingredient Market, By Ingredient Type, 2019-2028 (USD Thousand)
TABLE 276 POLAND Probiotic in Bioactive ingredient Market, By Ingredient Type, 2019-2028 (USD Thousand)
TABLE 277 POLAND Minerals in Bioactive ingredient Market, By Ingredient Type, 2019-2028 (USD Thousand)
TABLE 278 POLAND Vitamins in Bioactive ingredient Market, By Ingredient Type, 2019-2028 (USD Thousand)
TABLE 279 POLAND Amino Acid in Bioactive ingredient Market, By Ingredient Type, 2019-2028 (USD Thousand)
TABLE 280 POLAND Bioactive ingredient Market, By Applications, 2019-2028 (USD Thousand)
TABLE 281 POLAND Functional Food in Bioactive ingredient Market, By Applications, 2019-2028 (USD Thousand)
TABLE 282 POLAND Dairy in Bioactive ingredient Market, By Applications, 2019-2028 (USD Thousand)
TABLE 283 POLAND Dairy Alternatives in Bioactive ingredient Market, By Applications, 2019-2028 (USD Thousand)
TABLE 284 POLAND Beverages in Bioactive ingredient Market, By Applications, 2019-2028 (USD Thousand)
TABLE 285 POLAND Bars in Bioactive ingredient Market, By Applications, 2019-2028 (USD Thousand)
TABLE 286 POLAND Animal Nutrition in Bioactive ingredient Market, By Applications, 2019-2028 (USD Thousand)
TABLE 287 POLAND Personal Care in Bioactive ingredient Market, By Applications, 2019-2028 (USD Thousand)
TABLE 288 POLAND Bioactive ingredient Market, By Source, 2019-2028 (USD Thousand)
TABLE 289 REST OF EUROPE Bioactive ingredient Market, By Ingredient Type, 2019-2028 (USD Thousand)
TABLE 290 REST OF EUROPE Bioactive ingredient Market, By Ingredient Type, 2019-2028 (Tons)
Список рисунков
FIGURE 1 EUROPE BIOACTIVE INGREDIENT MARKET: segmentation
FIGURE 2 EUROPE BIOACTIVE INGREDIENT MARKET: data triangulation
FIGURE 3 EUROPE BIOACTIVE INGREDIENT MARKET: DROC ANALYSIS
FIGURE 4 EUROPE BIOACTIVE INGREDIENT MARKET: Europe VS. regional MARKET analysis
FIGURE 5 EUROPE BIOACTIVE INGREDIENT MARKET: company research analysis
FIGURE 6 EUROPE BIOACTIVE INGREDIENT MARKET: THE Ingredient Type LIFE LINE CURVE
FIGURE 7 EUROPE BIOACTIVE INGREDIENT MARKET: MULTIVARIATE MODELLING
FIGURE 8 EUROPE BIOACTIVE INGREDIENT MARKET: INTERVIEW DEMOGRAPHICS
FIGURE 9 EUROPE BIOACTIVE INGREDIENT MARKET: DBMR MARKET POSITION GRID
FIGURE 10 EUROPE BIOACTIVE INGREDIENT MARKET: MARKET application COVERAGE GRID
FIGURE 11 EUROPE BIOACTIVE INGREDIENT MARKET: THE MARKET CHALLENGE MATRIX
FIGURE 12 EUROPE BIOACTIVE INGREDIENT MARKET: vendor share analysis
FIGURE 13 EUROPE BIOACTIVE INGREDIENT MARKET: SEGMENTATION
FIGURE 14 Rising demand of bioactive ingredients in functional foodIS DRIVING the EUROPE BIOACTIVE INGREDIENT MARKET in the forecast period of 2021 to 2028
FIGURE 15 peptide SEGMENT is expected to account for the largest share of the EUROPE BIOACTIVE INGREDIENT MARKET in 2021 & 2028
FIGURE 16 Figure 1 DRIVERS, RESTRAINTS, OPPORTUNITIES AND CHALLENGEs OF Europe Bioactive Ingredient MARKET
FIGURE 17 : DRUG USED FOR DIABETES (DOSAGE PER 1,000 INHABITANTS, PER DAY)
FIGURE 1 Europe bioactive ingredient MARKET: BY Ingredient Type, 2020
FIGURE 2 Europe bioactive ingredient MARKET: BY Applications, 2020
FIGURE 3 Europe bioactive ingredient MARKET: BY source, 2020
FIGURE 4 EUROPE bioactive ingredient market: SNAPSHOT (2020)
FIGURE 5 EUROPE BIOACTIVE INGREDIENT market: by COUNTRY (2020)
FIGURE 6 EUROPE BIOACTIVE INGREDIENT market: by COUNTRY (2021 & 2028)
FIGURE 7 EUROPE BIOACTIVE INGREDIENT market: by COUNTRY (2020 & 2028)
FIGURE 8 EUROPE BIOACTIVE INGREDIENT market: by Ingredient Type (2021-2028)
FIGURE 9 EUROPE BIOACTIVE INGREDIENT MARKET: company share 2020 (%)
Методология исследования
Сбор данных и анализ базового года выполняются с использованием модулей сбора данных с большими размерами выборки. Этап включает получение рыночной информации или связанных данных из различных источников и стратегий. Он включает изучение и планирование всех данных, полученных из прошлого заранее. Он также охватывает изучение несоответствий информации, наблюдаемых в различных источниках информации. Рыночные данные анализируются и оцениваются с использованием статистических и последовательных моделей рынка. Кроме того, анализ доли рынка и анализ ключевых тенденций являются основными факторами успеха в отчете о рынке. Чтобы узнать больше, пожалуйста, запросите звонок аналитика или оставьте свой запрос.
Ключевой методологией исследования, используемой исследовательской группой DBMR, является триангуляция данных, которая включает в себя интеллектуальный анализ данных, анализ влияния переменных данных на рынок и первичную (отраслевую экспертную) проверку. Модели данных включают сетку позиционирования поставщиков, анализ временной линии рынка, обзор рынка и руководство, сетку позиционирования компании, патентный анализ, анализ цен, анализ доли рынка компании, стандарты измерения, глобальный и региональный анализ и анализ доли поставщика. Чтобы узнать больше о методологии исследования, отправьте запрос, чтобы поговорить с нашими отраслевыми экспертами.
Доступна настройка
Data Bridge Market Research является лидером в области передовых формативных исследований. Мы гордимся тем, что предоставляем нашим существующим и новым клиентам данные и анализ, которые соответствуют и подходят их целям. Отчет можно настроить, включив в него анализ ценовых тенденций целевых брендов, понимание рынка для дополнительных стран (запросите список стран), данные о результатах клинических испытаний, обзор литературы, обновленный анализ рынка и продуктовой базы. Анализ рынка целевых конкурентов можно проанализировать от анализа на основе технологий до стратегий портфеля рынка. Мы можем добавить столько конкурентов, о которых вам нужны данные в нужном вам формате и стиле данных. Наша команда аналитиков также может предоставить вам данные в сырых файлах Excel, сводных таблицах (книга фактов) или помочь вам в создании презентаций из наборов данных, доступных в отчете.