
Global Predictive Maintenance Market
Market Size in USD Billion
CAGR :
% 
 USD
8.89 Billion
USD
83.45 Billion
2024
2032
USD
8.89 Billion
USD
83.45 Billion
2024
2032
| 2025 - 2032 | |
| USD 8.89 Billion | |
| USD 83.45 Billion | |
| % | |
|
Predictive Maintenance Market Size
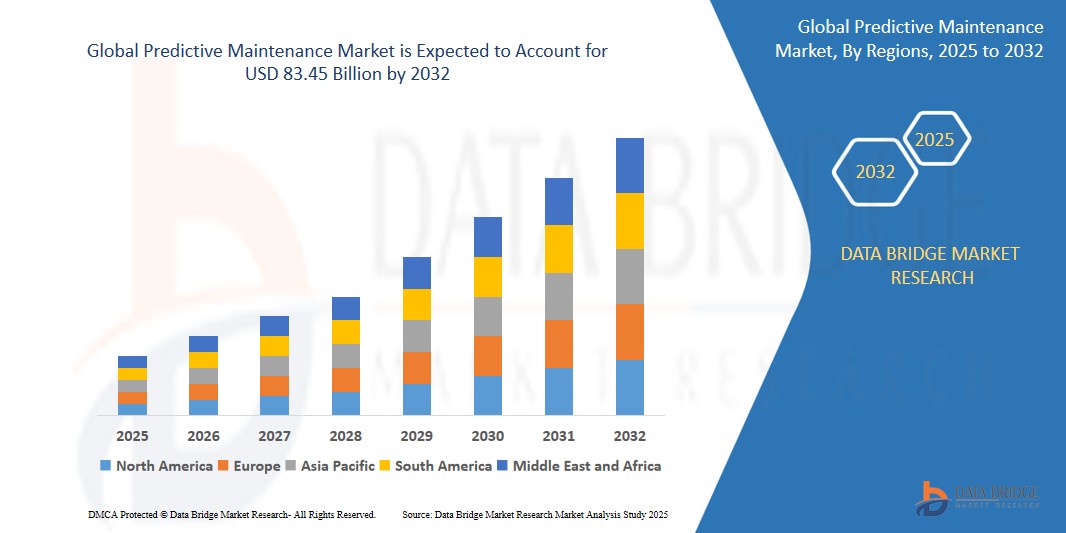
- The global predictive maintenance market size was valued at USD 8.89 billion in 2024 and is expected to reach USD 83.45 billion by 2032, at a CAGR of 32.30% during the forecast period
- This growth is driven by continuous advancements in big data, machine-to-machine (M2M) communication, and artificial intelligence (AI)
Predictive Maintenance Market Analysis
- Predictive Maintenances are essential portable energy storage devices widely used across various sectors including consumer electronics, automotive, medical devices, industrial applications, and travel accessories, due to their convenient recharging capability, compact design, and ability to support multiple devices simultaneously
- The demand for predictive maintenances is largely driven by increased smartphone penetration, growing digital dependency, and rising demand for backup power solutions across on-the-go consumers and professionals
- North America is expected to dominate the predictive maintenance market with the largest market share of 35.71%, driven by strong industrial digitization and early adoption of advanced technologies such as IoT, AI, and machine learning
- The Asia-Pacific region is expected to witness the highest growth rate in the predictive maintenance market, driven by rapid industrialization, growing investments in smart manufacturing, and government-led initiatives such as “Make in India” and “Made in China 2025”
- The solution segment is expected to dominate the predictive maintenance market with the largest share of 81.11% in 2025 due to its ability to provide advanced analytics, real-time monitoring, and actionable insights that help organizations reduce unplanned downtime, lower maintenance costs, and extend equipment lifespan
Report Scope and Predictive Maintenance Market Segmentation
|
Attributes |
Predictive Maintenance Key Market Insights |
|
Segments Covered |
|
|
Countries Covered |
North America
Europe
Asia-Pacific
Middle East and Africa
South America
|
|
Key Market Players |
|
|
Market Opportunities |
|
|
Value Added Data Infosets |
In addition to the insights on market scenarios such as market value, growth rate, segmentation, geographical coverage, and major players, the market reports curated by the Data Bridge Market Research also include import export analysis, production capacity overview, production consumption analysis, price trend analysis, climate change scenario, supply chain analysis, value chain analysis, raw material/consumables overview, vendor selection criteria, PESTLE Analysis, Porter Analysis, and regulatory framework. |
Predictive Maintenance Market Trends
“Integration of AI and Machine Learning for Condition Monitoring”
- A major trend influencing the predictive maintenance market is the increasing integration of artificial intelligence (AI) and machine learning (ML) algorithms for real-time condition monitoring and failure prediction
- These technologies enable data-driven decision-making, reducing unplanned downtime and optimizing maintenance schedules across industries such as manufacturing, transportation, and energy
- AI-powered analytics platforms help identify subtle anomalies in machine behavior that traditional methods often miss
- For instance, in February 2024, IBM partnered with ABB to integrate AI-driven predictive analytics into industrial equipment, enhancing fault detection and maintenance planning
- As AI capabilities become more accessible, industries are rapidly adopting predictive maintenance to improve operational efficiency and cost savings
Predictive Maintenance Market Dynamics
Driver
“Surge in Industrial IoT Deployments”
- The widespread implementation of Industrial Internet of Things (IIoT) devices has significantly accelerated the adoption of predictive maintenance solutions
- IIoT sensors continuously collect equipment data such as temperature, vibration, and pressure, which are then analyzed for early signs of failure
- This enhances asset reliability and reduces maintenance costs across sectors such as oil & gas, manufacturing, and energy
- For instance, in 2023, Siemens expanded its MindSphere IIoT platform with new predictive maintenance modules for heavy machinery used in power plants and automotive facilities
- The proliferation of IIoT infrastructure is expected to propel the predictive maintenance market, especially in asset-intensive industries
Opportunity
“Adoption in the Transportation and Logistics Sector”
- Predictive maintenance is gaining traction in the transportation and logistics industry to improve fleet uptime, reduce breakdowns, and ensure regulatory compliance
- With logistics companies focusing on real-time vehicle monitoring and route optimization, predictive analytics plays a pivotal role in preemptive repairs
- Integration with telematics systems allows for actionable insights into vehicle health, reducing operational disruptions
- For instance, In May 2024, GE Transportation introduced a predictive maintenance solution for freight locomotives to forecast part failures and optimize service intervals
- This trend opens lucrative opportunities for predictive maintenance providers to offer tailored solutions for fleet management companies globally
Restraint/Challenge
“High Initial Investment and Data Integration Complexity”
- One of the key restraints in the predictive maintenance market is the high initial cost of implementing advanced monitoring systems, including sensor installation, software platforms, and skilled personnel
- In addition, integrating predictive tools with existing enterprise systems such as ERP and SCADA can be technically challenging, particularly for legacy infrastructures
- SMEs often face difficulty justifying the ROI without long-term visibility into benefits
- For instance, A 2023 Deloitte survey revealed that 38% of manufacturing firms delayed predictive maintenance adoption due to integration hurdles and unclear cost-benefit analysis
- These financial and technical barriers may limit adoption, especially in cost-sensitive markets or mid-sized enterprises
Predictive Maintenance Market Scope
The market is segmented on the basis of component, deployment mode, organization size, vertical, and stakeholder.
|
Segmentation |
Sub-Segmentation |
|
By Components |
|
|
By Deployment Mode |
|
|
By Organization Size |
|
|
By Vertical |
|
|
By Stakeholder |
|
In 2025, the solution is projected to dominate the market with a largest share in type components
The solution segment is expected to dominate the predictive maintenance market with the largest share of 81.11% in 2025 due to its ability to provide advanced analytics, real-time monitoring, and actionable insights that help organizations reduce unplanned downtime, lower maintenance costs, and extend equipment lifespan.
The On-premises is expected to account for the largest share during the forecast period in battery segment
In 2025, the On-premises segment is expected to dominate the market with the largest market share of 76.31% due to its enhanced data security, greater control over infrastructure, and suitability for organizations with strict compliance requirements or limited internet connectivity.
Predictive Maintenance Market Regional Analysis
“North America Holds the Largest Share in the Predictive Maintenance Market”
- North America is expected to dominate the predictive maintenance market with the largest market share of 35.71%, driven by strong industrial digitization and early adoption of advanced technologies such as IoT, AI, and machine learning
- The presence of major solution providers and robust infrastructure across industries such as manufacturing, aerospace, and automotive further supports regional dominance
- Regulatory focus on workplace safety and operational efficiency has led enterprises to invest heavily in predictive maintenance platforms
“Asia-Pacific is Projected to Register the Highest CAGR in the Predictive Maintenance Market”
- Asia-Pacific region is expected to witness the highest growth rate in the predictive maintenance market, driven by rapid industrialization, growing investments in smart manufacturing, and government-led initiatives such as “Make in India” and “Made in China 2025”
- Expansion of manufacturing facilities and rising demand for asset optimization across sectors such as energy, transportation, and logistics are accelerating predictive maintenance adoption
- Increasing awareness about cost-saving benefits and technological advancements is encouraging both large enterprises and SMEs in countries such as China, India, and South Korea to deploy predictive maintenance solutions
Predictive Maintenance Market Share
The market competitive landscape provides details by competitor. Details included are company overview, company financials, revenue generated, market potential, investment in research and development, new market initiatives, global presence, production sites and facilities, production capacities, company strengths and weaknesses, product launch, product width and breadth, application dominance. The above data points provided are only related to the companies' focus related to market.
The Major Market Leaders Operating in the Market Are:
- Microsoft (U.S.)
- IBM (U.S.)
- SAP (Germany)
- SAS Institute Inc. (U.S.)
- Software GmbH (Germany)
- Cloud Software Group, Inc. (U.S.)
- Hewlett Packard Enterprise Development LP (U.S.)
- Altair Engineering Inc. (U.S.)
- Splunk LLC (U.S.)
- Oracle (U.S.)
- Google (U.S.)
- Amazon Web Services, Inc. (U.S.)
- General Electric Company (U.S.)
- Schneider Electric (France)
- Hitachi, Ltd. (Japan)
- PTC (U.S.)
- DINGO Software Pty. Ltd (Australia)
Latest Developments in Global Predictive Maintenance Market
- In September 2024, Siemens entered into a strategic partnership with Merck, a leading science and technology company, to accelerate digital transformation and elevate smart manufacturing practices; this collaboration is expected to significantly enhance industrial efficiency and innovation
- In June 2024, IBM Corporation launched version 9.0 of its Maximo Application Suite (MAS), featuring an enhanced AI-driven predictive maintenance (PdM) interface and expanded IoT integration for real-time analytics. This release is anticipated to improve user experience and asset reliability across sectors
- In June 2024, C3.ai, Inc. implemented its C3 AI Reliability solution at Holcim, a global leader in sustainable building materials, to support digital transformation and sustainability goals. The deployment is set to reduce operational risks and help the company work towards a net-zero future
- In March 2024, General Electric Vernova announced its partnership with Saudi Arabia–based TASNEE to deliver advanced predictive analytics software for critical equipment monitoring. This solution is designed to prevent downtime and improve operational resilience in petrochemical operations
- In January 2024, Rockwell Automation partnered with MakinaRocks to integrate AI-powered predictive maintenance solutions in industrial automation systems; the initiative aims to minimize unplanned downtimes and drive productivity improvements across manufacturing operations
SKU-
Get online access to the report on the World's First Market Intelligence Cloud

- Interactive Data Analysis Dashboard
- Company Analysis Dashboard for high growth potential opportunities
- Research Analyst Access for customization & queries
- Competitor Analysis with Interactive dashboard
- Latest News, Updates & Trend analysis
- Harness the Power of Benchmark Analysis for Comprehensive Competitor Tracking
Research Methodology
Data collection and base year analysis are done using data collection modules with large sample sizes. The stage includes obtaining market information or related data through various sources and strategies. It includes examining and planning all the data acquired from the past in advance. It likewise envelops the examination of information inconsistencies seen across different information sources. The market data is analysed and estimated using market statistical and coherent models. Also, market share analysis and key trend analysis are the major success factors in the market report. To know more, please request an analyst call or drop down your inquiry.
The key research methodology used by DBMR research team is data triangulation which involves data mining, analysis of the impact of data variables on the market and primary (industry expert) validation. Data models include Vendor Positioning Grid, Market Time Line Analysis, Market Overview and Guide, Company Positioning Grid, Patent Analysis, Pricing Analysis, Company Market Share Analysis, Standards of Measurement, Global versus Regional and Vendor Share Analysis. To know more about the research methodology, drop in an inquiry to speak to our industry experts.
Customization Available
Data Bridge Market Research is a leader in advanced formative research. We take pride in servicing our existing and new customers with data and analysis that match and suits their goal. The report can be customized to include price trend analysis of target brands understanding the market for additional countries (ask for the list of countries), clinical trial results data, literature review, refurbished market and product base analysis. Market analysis of target competitors can be analyzed from technology-based analysis to market portfolio strategies. We can add as many competitors that you require data about in the format and data style you are looking for. Our team of analysts can also provide you data in crude raw excel files pivot tables (Fact book) or can assist you in creating presentations from the data sets available in the report.


