
Europe Polyurethane Foam Market
Market Size in USD Billion
CAGR :
% 
 USD
8.34 Billion
USD
12.45 Billion
2024
2032
USD
8.34 Billion
USD
12.45 Billion
2024
2032
| 2025 –2032 | |
| USD 8.34 Billion | |
| USD 12.45 Billion | |
| % | |
Polyurethane Foam Market Analysis
The polyurethane foam market is experiencing steady growth, driven by increasing demand from industries such as construction, automotive, and furniture due to its excellent insulation and cushioning properties. The market is broadly divided into rigid and flexible foams, with rigid foams seeing strong adoption in insulation applications and flexible foams widely used in bedding and furniture. Rising sustainability concerns and environmental regulations are encouraging the development of bio-based and low-emission alternatives. The Asia-Pacific region leads the market, fueled by rapid urbanization, infrastructure expansion, and industrial growth. Additionally, innovations in lightweight and energy-efficient foam solutions continue to shape the industry's future.
Polyurethane Foam Market Size
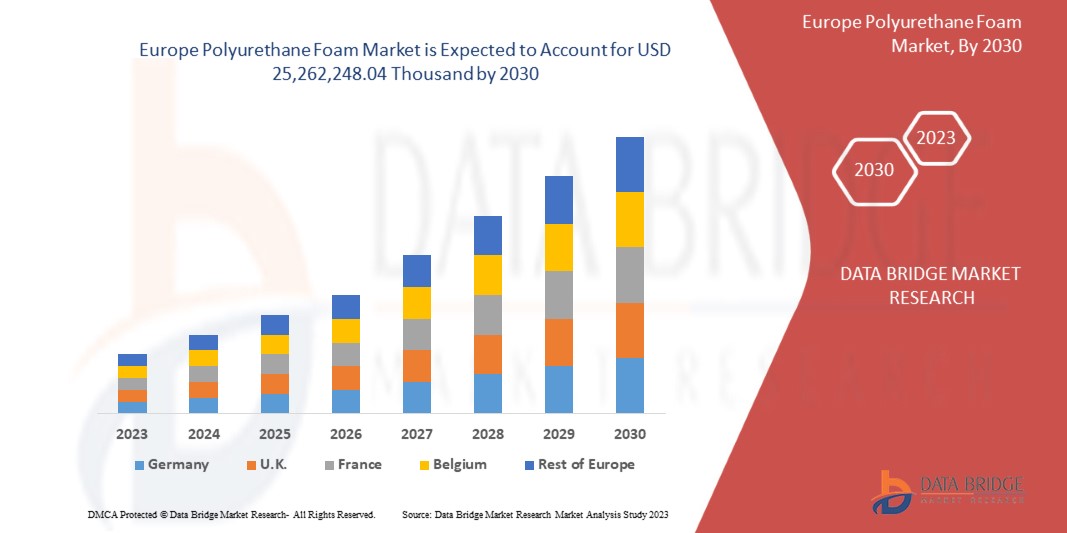
Europe polyurethane foam market is expected to reach USD 12.45 billion by 2032 from USD 8.34 billion in 2024, growing with a substantial CAGR of 5.3% in the forecast period of 2025 to 2032. In addition to the insights on market scenarios such as market value, growth rate, segmentation, geographical coverage, and major players, the market reports curated by the Data Bridge Market Research also include import export analysis, production capacity overview, production consumption analysis, price trend analysis, climate change scenario, supply chain analysis, value chain analysis, raw material/consumables overview, vendor selection criteria, PESTLE Analysis, Porter Analysis, and regulatory framework.
Polyurethane Foam Market Trends
“Positive Outlook Toward the Construction Sector”
The construction industry can be a major driving force in expanding the polyurethane foam market. Construction-related activities are rising due to foreign direct investment in emerging economies. Cement, wood, glass, metals, and clay are some of the most common materials used in the construction industry. Polyurethane is used in construction to create high-performance products that are strong but light in weight, function well, and are long-lasting and adaptable. Polyurethane foam is a flexible chemical product utilized in many typical construction applications such as bonding, filling, sealing, and insulation. Its high thermal and acoustic insulation capabilities make it a perfect product for water pipe insulation, bonding and sealing roofs and walls, and, most significantly, installing window and door frames. Such growth of construction-related activities and the wide application of polyurethane foam in the construction industry has increased the market growth of polyurethane foam.
Report Scope and Polyurethane Foam Market Segmentation
|
Attributes |
Polyurethane Foam Market Insights |
|
Segments Covered |
|
|
Countries Covered |
U.K., France, Germany, Spain, Italy, Netherlands, Luxemburg, Turkey, Belgium, Russia, Switzerland, and Rest of Europe |
|
Key Market Players |
Henkel AG & Co. KGaA (Germany), Saint-Gobain (France), Huntsman International LLC (U.S.), BASF (Germany), INOAC CORPORATION (Japan), Dow (U.S.), SEKISUI CHEMICAL CO., LTD. (Japan), Sunpreeth Engineers (India), Recticel NV/SA (Belgium), Sheela Foam Ltd. (India), Eurofoam S.r.l. (Italy), Rogers Corporation (U.S.), UFP Technologies, Inc. (U.S.), General Plastics Manufacturing Company, Inc. (U.S.), Meenakshi Polymers Pvt. Ltd. (India), Foamcraft Inc. (U.S.), ALSTONE INDUSTRIES PVT. LTD. (India), Wisconsin Foam Products (U.S.), Tirupati Foam Ltd (India) |
|
Market Opportunities |
|
|
Value Added Data Infosets |
In addition to the insights on market scenarios such as market value, growth rate, segmentation, geographical coverage, and major players, the market reports curated by the Data Bridge Market Research also include import export analysis, production capacity overview, production consumption analysis, price trend analysis, climate change scenario, supply chain analysis, value chain analysis, raw material/consumables overview, vendor selection criteria, PESTLE Analysis, Porter Analysis, and regulatory framework. |
Polyurethane Foam Market Definition
Polyurethane foam is a polymer obtained by reacting diisocyanate and polyol. Polyurethane foam is generally called PU foam or PUR foam. Polyurethane foam provides insulation and protection to the materials from external sources that cause corrosion. The type of reagent or catalyst used with isocyanate in polyurethane foam production depends on the PU foam's application. There are three types of polyurethane foam available: rigid, flexible, and spray foam.
Polyurethane Foam Market Dynamics
Drivers
- Growing Acceptance in the Automotive and Aviation Sector
Polyurethane foam is a polymeric material with high tensile strength, low weight, chemical resistance, processability, and mechanical characteristics that have been utilized in various applications. Due to its distinctive properties, there has been a growing demand for lightweight and high-performance materials in the aerospace and automotive industries. In the automotive industry, automotive foam plays an important role as it serves a significant role in passenger safety and comfort, from automotive seating to carpet underlay. Polyurethane foam is used in the automotive industry for trims, seats, headrests, acoustic insulation, and air conditioning filters. This is because foam is a material that provides a wide range of properties, such as vibration blocking, sound absorption, and insulation. Both open and closed-cell foams can be used in automotive cushioning and seating in modern cars. Polyurethane foam in current automobiles offers vehicles greater mileage due to its durable and extremely lightweight nature further lowering the overall weight of a car. As a result, fuel efficiency is improved and has reduced environmental impact. Such high-end-use applications in the automotive sector will drive the market growth of polyurethane foam.
The application of polyurethane foam in the aerospace industry is too diverse. It is used in structural pieces such as passenger cabin walls, baggage sections, ceilings, lavatory elements, flight deck pads, and class and section dividers. The foam can protect the aircraft and passengers inside it from excessive temperature fluctuations. Aerospace foam density also aids in the prevention of air leakage into and out of the aircraft, hence preserving cabin pressure. It may also serve as a sound barrier that protects passengers from the high decibel levels of airplane engines. For instance, In June 2022, according to an article published by Linden Industries, LLC. Polyurethane foam is widely used in automotive interiors for its cushioning, durability, and noise-reduction properties. It enhances comfort and support in car seats and headrests while also providing shock absorption. Dashboards and door panels use it to insulate and minimize road noise. Its durability ensures longevity despite frequent use. Essential in improving safety and passenger experience, it remains a key material in vehicle construction
- Rising Demand for Various Home Furnishing Applications
Home furnishing is objects placed in a room to make it more comfortable and pleasant. They include any moveable things such as furniture, curtains, carpets, and décor items that complement the room's design. Polyurethane foams are widely applied in home furnishing due to their unique characteristics, such as low density, high mechanical properties, and low thermal conductivity. Polyurethane foams are lightweight porous materials that have promising performance characteristics. Such materials are further applied in end applications in cushions present in furniture items such as sofas and chairs, which drives the growth of the polyurethane foam market.
Factors such as rising population, increasing urbanization, inclination towards quality mattresses, and improvement in institutional infrastructure drive mattress sales in the real estate and hospitality segments. Flexible polyurethane foam has a cellular structure that allows certain compression and resilience, which provides a cushioning effect. This feature is widely used in furniture, mattresses, pillows, and carpet applications. The growth of sectors such as housing, hospitality, and railways is too one factor for the polyurethane foam mattress market growth. For instance, According to the ISPF, research was conducted by Indian Sleep Products Federation. In India, the overall mattress market was around 18.6 million units, with an expected new demand for mattresses of 7 million units yearly. Furthermore, the average mattress replacement cycle was 12 years, and the replacement demand for mattresses was 11.6 million units. The study also revealed that the furniture channel is essential to new demand, accounting for 50% of overall mattress sales. In addition, foam-based mattresses accounted for 52.6 % of total sales, while spring-based mattresses represented 13.5 percent and coir-based mattresses represented 34%
Opportunities
- Lucrative Outlook Towards Environmentally Friendly Foams
Polyurethane foams have become one of the industry's most essential materials since they are among the most adaptable polymers. They are employed in the automotive industry for seats, upholstery, and bumpers; in furniture as filling materials for seating cushions, sofas, and mattresses; in the packaging sector; in construction for thermal and acoustic insulation; and among other applications. Apart from their low density, low heat conductivity, and outstanding mechanical characteristics, one of the primary advantages of polyurethane foams is the ability to adjust their density and rigidity to market application requirements.
This polymer, however, is primarily petroleum-based. Concerns regarding the environment demand that polyurethanes be made more sustainably, such as using renewable raw resources or recycling polyurethane foams. The shifting consumer behavior towards the use of sustainable materials, stringent rules and regulations of the government, and the manufacturer's steps to lessen the usage of petroleum-based raw materials in producing foams are a few factors that have led to the positive outlook towards the environmentally friendly foams. Such steps will lead to the developing of polyurethane foams that are biodegradable and environmentally friendly. The manufacturers are also collaborating with other companies and developing facilities for recycling polyurethane foam. For instance, Iin September 2023, according to an article published by Crain Communications, Inc., Covestro collaborated with Selena Group to develop sustainable polyurethane (PU) foams for building insulation. It used Covestro’s bio-attributed MDI in an upgraded Ultra-Fast 70 foam, reducing its carbon footprint by 60%. The foam cured within 90 minutes and offered a 70-litre yield per container. It matched the quality of fossil-based foams and supported seamless integration. Selena included bio-based polyols and recycled PET materials in its foam range
- Supportive Government Policies Regarding Investment in Domestic Markets
The increased disposable income, rapid urbanization, diverse industrial applications, high consumption, increased foreign direct investment, and promising export potential are some factors encouraging chemical industry growth in developing economies such as India and China. Various upcoming opportunities to manufacture specialty chemicals and polymer products will create a huge domestic demand. Developing countries will be self-efficient in producing raw materials and the end product. In addition, investment from developed countries or setting up a chemical plant in emerging economies can offer a wide opportunity for the growth of the Europe polyurethane foam market.
Polyurethane foam has applications in various industries, such as automotive, furniture, construction, packaging, textiles, footwear, and others. The market growth of these industries will further boost the economy of developing nations. The research and development activities, technological advancements, rise in demand from end-user industries, and favorable policies and frameworks have influenced the growth of the chemical industry in such countries. For instance, in September 2022, according to the Arab News, With an overall expenditure of USD 1.1 trillion in infrastructure and real estate projects since the announcement of Saudi Arabia's Vision 2030 in 2016, the country of Saudi Arabia is well on its way to becoming world's largest building site. Saudi Arabia will easily become the world's largest construction site, with over 555,000 residential units, over 275,000 hotel keys, over 4.3 million square meters of retail space, and over 6.1 million square meters of office space planned for the kingdom. Such a huge infrastructure setup will lead to the wide usage of polyurethane foam in the construction sector in the upcoming years
Restraints/Challenges
- Harmful Chemical Usage in Polyurethane Foam Production
Polyurethane foams are used in various applications ranging from furniture to insulation. However, using various chemicals in producing polyurethane foams raises environmental and health concerns for the workforce involved in the production.Polyurethane is a product of polymerization between various polyols and diisocyanates derived from crude oils. Various blowing agents, curatives, flame retardants, surfactants, and catalysts are involved in the process. The commonly used polyols are polyethylene glycol, polypropylene glycol, and polytetramethylene glycol. At the same time, Toluene Diisocyanate (TDI) and Methylene Diphenyl Diisocyanate (MDI) are commonly used di-isocyanate materials. For instance, in March 2023, according to U.S. Environmental Protection Agency (EPA), di-isocyanates such as MDI and TDI are said to cause asthma, lung damage, and even death in some cases to the workers involved. EPA has designed an action plan for protective control of them in working units. The release of volatile organic compounds in the production process is said to create environmental concerns
- Volatility in Raw Material Prices
The manufacturing process in any sector depends on the price of raw materials. The higher the volatility of the price of raw material, the higher the chance for fluctuation in product cost and market growth.
The major raw materials for polyurethane foam production are polyols and diisocyanates derived from crude oil. Several reasons, such as climate, supply chain, demand, availability, limitations, and economic situation of the country, determine the price of these raw materials. For instance, in November 2024, according to an article published by Polymerupdate, oil processing companies faced a significant profitability decline in Q3 2024 due to weak refining margins, with GRM dropping to USD 1.3 per barrel in September 2024, the lowest since the Covid-19 peak. It resulted from low crude oil prices, increased Russian crude availability, and weak demand, particularly from China. Europe economic growth remained stable at 3.1% in 2024, with downside risks from geopolitical tensions and China's property sector. It also suffered as the adoption of EVs, biofuels, and LNG reduced petroleum fuel demand in Asia and Europe. New refining capacity further pressured margins
Impact and Current Market Scenario of Raw Material Shortage and Shipping Delays
Data Bridge Market Research offers a high-level analysis of the market and delivers information by keeping in account the impact and current market environment of raw material shortage and shipping delays. This translates into assessing strategic possibilities, creating effective action plans, and assisting businesses in making important decisions.
Apart from the standard report, we also offer in-depth analysis of the procurement level from forecasted shipping delays, distributor mapping by region, commodity analysis, production analysis, price mapping trends, sourcing, category performance analysis, supply chain risk management solutions, advanced benchmarking, and other services for procurement and strategic support.
Expected Impact of Economic Slowdown on the Pricing and Availability of Products
When economic activity slows, industries begin to suffer. The forecasted effects of the economic downturn on the pricing and accessibility of the products are taken into account in the market insight reports and intelligence services provided by DBMR. With this, our clients can typically keep one step ahead of their competitors, project their sales and revenue, and estimate their profit and loss expenditures.
Polyurethane Foam Market Scope
The market is segmented on the basis product, category, density composition, process, and end-user. The growth amongst these segments will help you analyze meagre growth segments in the industries and provide the users with a valuable market overview and market insights to help them make strategic decisions for identifying core market applications.
Product
- Flexible foam
- Rigid foam
- Spray foam
Category
- Open cell
- Closed cell
Density Composition
- Low-density composition
- Medium-density composition
- High-density composition
Process
- Molded foam
- Slabstock foam
- Spraying
- Lamination
End-User
- Bedding & Furniture
- Building & Construction
- Automotive
- Electronics
- Packaging
- Footwear
- Others
Polyurethane Foam Market Regional Analysis
The market is analyzed and market size insights and trends are provided by product, category, density composition, process, and end-user as referenced above.
The countries covered in the market are U.K., France, Germany, Spain, Italy, Netherlands, Luxemburg, Turkey, Belgium, Russia, Switzerland, and rest of Europe.
Germany is expected to dominate the European polyurethane market due to its strong industrial base, advanced automotive sector, and high demand for energy-efficient construction materials. The country is home to leading polyurethane manufacturers, benefiting from cutting-edge research and development, as well as a well-established supply chain. Additionally, stringent regulations promoting sustainable and high-performance materials drive innovation and increased adoption of polyurethane products.
Germany is expected to be one of the fastest-growing markets due to rising investments in eco-friendly and high-performance polyurethane solutions. The country’s push toward sustainable construction, lightweight automotive components, and advanced insulation materials supports market expansion. Moreover, increasing demand from industries such as furniture, electronics, and footwear further fuels growth.
The country section of the report also provides individual market impacting factors and changes in regulation in the market domestically that impacts the current and future trends of the market. Data points like down-stream and upstream value chain analysis, technical trends and porter's five forces analysis, case studies are some of the pointers used to forecast the market scenario for individual countries. Also, the presence and availability of Europe brands and their challenges faced due to large or scarce competition from local and domestic brands, impact of domestic tariffs and trade routes are considered while providing forecast analysis of the country data.
Polyurethane Foam Market Share
The market competitive landscape provides details by competitors. Details included are company overview, company financials, revenue generated, market potential, investment in research and development, new market initiatives, Europe presence, production sites and facilities, production capacities, company strengths and weaknesses, product launch, product width and breadth, application dominance. The above data points provided are only related to the companies' focus related to market.
Polyurethane Foam Market Leaders Operating in the Market Are:
- Henkel AG & Co. KGaA (Germany)
- Saint-Gobain (France)
- Huntsman International LLC (U.S.)
- BASF (Germany)
- INOAC CORPORATION (Japan)
- Dow (U.S.)
- SEKISUI CHEMICAL CO., LTD. (Japan)
- Sunpreeth Engineers (India)
- Recticel NV/SA (Belgium)
- Sheela Foam Ltd. (India)
- Eurofoam S.r.l. (Italy)
- Rogers Corporation (U.S.)
- UFP Technologies, Inc. (U.S.)
- General Plastics Manufacturing Company, Inc. (U.S.)
- Meenakshi Polymers Pvt. Ltd. (India)
- Foamcraft Inc. (U.S.)
- ALSTONE INDUSTRIES PVT. LTD. (India)
- Wisconsin Foam Products (U.S.)
- Tirupati Foam Ltd (India)
Latest Developments in Polyurethane Foam Market:
- In September 2022, Saint-Gobain has received all the required approvals from relevant authorities for the acquisition of GCP Applied Technologies Inc.,(a major Europe player in construction chemicals). This acquisition helps company to gain more recognition in the field of construction chemicals
- In May 2020, Huntsman Corporation announced the rebranding of its world-leading spray polyurethane foam business as Huntsman Building Solutions. Huntsman Building Solutions is a worldwide platform under Huntsman's Polyurethanes division. This rebranding helped the company to expand its business in the polyurethane foam business
SKU-
Get online access to the report on the World's First Market Intelligence Cloud

- Interactive Data Analysis Dashboard
- Company Analysis Dashboard for high growth potential opportunities
- Research Analyst Access for customization & queries
- Competitor Analysis with Interactive dashboard
- Latest News, Updates & Trend analysis
- Harness the Power of Benchmark Analysis for Comprehensive Competitor Tracking
Table of Content
1 INTRODUCTION
1.1 OBJECTIVES OF THE STUDY
1.2 MARKET DEFINITION
1.3 OVERVIEW
1.4 LIMITATIONS
1.5 MARKETS COVERED
2 MARKET SEGMENTATION
2.1 MARKETS COVERED
2.2 GEOGRAPHICAL SCOPE
2.3 YEARS CONSIDERED FOR THE STUDY
2.4 CURRENCY AND PRICING
2.5 DBMR TRIPOD DATA VALIDATION MODEL
2.6 PRODUCT LIFE LINE CURVE
2.7 MULTIVARIATE MODELING
2.8 PRIMARY INTERVIEWS WITH KEY OPINION LEADERS
2.9 DBMR MARKET POSITION GRID
2.1 MARKET END-USER COVERAGE GRID
2.11 DBMR VENDOR SHARE ANALYSIS
2.12 SECONDARY SOURCES
2.13 ASSUMPTIONS
3 EXECUTIVE SUMMARY
4 PREMIUM INSIGHTS
4.1 PESTLE ANALYSIS
4.1.1 POLITICAL FACTORS:
4.1.2 ECONOMIC FACTORS:
4.1.3 SOCIAL FACTORS:
4.1.4 TECHNOLOGICAL FACTORS:
4.1.5 LEGAL FACTORS:
4.1.6 ENVIRONMENTAL FACTORS:
4.2 PORTER'S FIVE FORCES:
4.2.1 THE THREAT OF NEW ENTRANTS:
4.2.2 THE THREAT OF SUBSTITUTES:
4.2.3 CUSTOMER BARGAINING POWER:
4.2.4 SUPPLIER BARGAINING POWER:
4.2.5 INTERNAL COMPETITION (RIVALRY):
4.3 CLIMATE CHANGE SCENARIO
4.3.1 ENVIRONMENTAL CONCERNS
4.3.2 INDUSTRY RESPONSE
4.3.3 GOVERNMENT'S ROLE
4.3.4 ANALYST RECOMMENDATION
4.4 SUPPLY CHAIN ANALYSIS
4.4.1 OVERVIEW
4.4.2 LOGISTIC COST SCENARIO
4.4.3 IMPORTANCE OF LOGISTICS SERVICE PROVIDERS
4.5 TECHNOLOGICAL ADVANCEMENTS BY MANUFACTURERS
4.6 VENDOR SELECTION CRITERIA
4.6.1 RAW MATERIAL COVERAGE
4.7 PRICING ANALYSIS
4.8 PRODUCTION CONSUMPTION ANALYSIS
4.9 PRODUCTION CAPACITY ANALYSIS
5 REGULATION COVERAGE
6 MARKET OVERVIEW
6.1 DRIVERS
6.1.1 POSITIVE OUTLOOK TOWARD THE CONSTRUCTION SECTOR
6.1.2 GROWING ACCEPTANCE IN THE AUTOMOTIVE AND AVIATION SECTOR
6.1.3 RISING DEMAND FOR VARIOUS HOME FURNISHING APPLICATIONS
6.1.4 INCREASING DEMAND FOR PROTECTIVE PACKAGING
6.1.5 RISING ADOPTION OF POLYURETHANE FOAMS IN THE TEXTILE AND FOOTWEAR INDUSTRY
6.2 RESTRAINTS
6.2.1 ENVIRONMENTAL AND HEALTH HAZARDS ASSOCIATED WITH THE USAGE OF POLYURETHANE FOAM
6.2.2 AVAILABILITY OF SUBSTITUTES IN MARKET
6.3 OPPORTUNITIES
6.3.1 LUCRATIVE OUTLOOK TOWARDS ENVIRONMENTALLY FRIENDLY FOAMS
6.3.2 SUPPORTIVE GOVERNMENT POLICIES REGARDING INVESTMENT IN DOMESTIC MARKETS, INCLUDING CHINA AND INDIA
6.4 CHALLENGES
6.4.1 HARMFUL CHEMICAL USAGE IN POLYURETHANE FOAM PRODUCTION
6.4.2 VOLATILITY IN RAW MATERIAL PRICES
6.4.3 STRINGENT RULES AND REGULATIONS FOR POLYURETHANE FOAMS
7 EUROPE POLYURETHANE FOAM MARKET, BY PRODUCT
7.1 OVERVIEW
7.2 FLEXIBLE FOAM
7.3 RIGID FOAM
7.4 SPRAY FOAM
8 EUROPE POLYURETHANE FOAM MARKET, BY CATEGORY
8.1 OVERVIEW
8.2 OPEN CELL
8.3 CLOSED CELL
9 EUROPE POLYURETHANE FOAM MARKET, BY DENSITY COMPOSITION
9.1 OVERVIEW
9.2 LOW-DENSITY COMPOSITION
9.3 MEDIUM-DENSITY COMPOSITION
9.4 HIGH-DENSITY COMPOSITION
10 EUROPE POLYURETHANE FOAM MARKET, BY PROCESS
10.1 OVERVIEW
10.2 MOLDED FOAM
10.3 SLABSTOCK FOAM
10.4 SPRAYING
10.5 LAMINATION
11 EUROPE POLYURETHANE FOAM MARKET, BY END-USER
11.1 OVERVIEW
11.2 BEDDING & FURNITURE
11.3 BUILDING & CONSTRUCTION
11.4 AUTOMOTIVE
11.5 ELECTRONICS
11.6 PACKAGING
11.7 FOOTWEAR
11.8 OTHERS
12 EUROPE POLYURETHANE FOAM MARKET, BY REGION
12.1 EUROPE
12.1.1 GERMANY
12.1.2 FRANCE
12.1.3 U.K.
12.1.4 SPAIN
12.1.5 ITALY
12.1.6 POLAND
12.1.7 NETHERLANDS
12.1.8 RUSSIA
12.1.9 TURKEY
12.1.10 BELGIUM
12.1.11 SWEDEN
12.1.12 SWITZERLAND
12.1.13 DENMARK
12.1.14 FINLAND
12.1.15 NORWAY
12.1.16 REST OF EUROPE
13 EUROPE POLYURETHANE FOAM MARKET: COMPANY LANDSCAPE
13.1 COMPANY SHARE ANALYSIS: EUROPE
14 COMPANY PROFILES
14.1 HENKEL AG & CO. KGAA
14.1.1 COMPANY SNAPSHOT
14.1.2 REVENUE ANALYSIS
14.1.3 SWOT ANALYSIS
14.1.4 COMPANY SHARE ANALYSIS
14.1.5 PRODUCT PORTFOLIO
14.1.6 RECENT DEVELOPMENTS
14.2 SAINT-GOBAIN
14.2.1 COMPANY SNAPSHOT
14.2.2 REVENUE ANALYSIS
14.2.3 COMPANY SHARE ANALYSIS
14.2.4 PRODUCT PORTFOLIO
14.2.5 SWOT ANALYSIS
14.2.6 RECENT DEVELOPMENT
14.3 HUNTSMAN INTERNATIONAL LLC
14.3.1 COMPANY SNAPSHOT
14.3.2 REVENUE ANALYSIS
14.3.3 COMPANY SHARE ANALYSIS
14.3.4 SWOT ANALYSIS
14.3.5 PRODUCT PORTFOLIO
14.3.6 RECENT DEVELOPMENTS
14.4 BASF
14.4.1 COMPANY SNAPSHOT
14.4.2 REVENUE ANALYSIS
14.4.3 COMPANY SHARE ANALYSIS
14.4.4 PRODUCT PORTFOLIO
14.4.5 SWOT ANALYSIS
14.4.6 RECENT DEVELOPMENT
14.5 INOAC CORPORATION
14.5.1 COMPANY SNAPSHOT
14.5.2 COMPANY SHARE ANALYSIS
14.5.3 PRODUCT PORTFOLIO
14.5.4 SWOT ANALYSIS
14.5.5 RECENT DEVELOPMENT
14.6 ALSTONE INDUSTRIES PVT. LTD.
14.6.1 COMPANY SNAPSHOT
14.6.2 SWOT ANALYSIS
14.6.3 PRODUCT PORTFOLIO
14.6.4 RECENT DEVELOPMENTS
14.7 DOW
14.7.1 COMPANY SNAPSHOT
14.7.2 REVENUE ANALYSIS
14.7.3 PRODUCT PORTFOLIO
14.8 EUROFOAM S.R.L.
14.8.1 COMPANY SNAPSHOT
14.8.2 SWOT ANALYSIS
14.8.3 PRODUCT PORTFOLIO
14.8.4 RECENT DEVELOPMENTS
14.9 FOAMCRAFT, INC.
14.9.1 COMPANY SNAPSHOT
14.9.2 PRODUCT PORTFOLIO
14.9.3 SWOT ANALYSIS
14.9.4 RECENT DEVELOPMENTS
14.1 GENERAL PLASTICS MANUFACTURING COMPANY, INC.
14.10.1 COMPANY SNAPSHOT
14.10.2 SWOT ANALYSIS
14.10.3 PRODUCT PORTFOLIO
14.10.4 RECENT DEVELOPMENTS
14.11 MEENAKSHI POLYMERS PVT. LTD.
14.11.1 COMPANY SNAPSHOT
14.11.2 SWOT ANALYSIS
14.11.3 PRODUCT PORTFOLIO
14.11.4 RECENT DEVELOPMENTS
14.12 RECTICEL NV/SA
14.12.1 COMPANY SNAPSHOT
14.12.2 REVENUE ANALYSIS
14.12.3 SWOT ANALYSIS
14.12.4 PRODUCT PORTFOLIO
14.12.5 RECENT DEVELOPMENT
14.13 ROGERS CORPORATION
14.13.1 COMPANY SNAPSHOT
14.13.2 PRODUCT PORTFOLIO
14.13.3 REVENUE ANALYSIS
14.13.4 SWOT ANALYSIS
14.13.5 RECENT DEVELOPMENTS
14.14 SEKISUI CHEMICAL CO., LTD.
14.14.1 COMPANY SNAPSHOT
14.14.2 REVENUE ANALYSIS
14.14.3 PRODUCT PORTFOLIO
14.14.4 SWOT ANALYSIS
14.14.5 RECENT DEVELOPMENT
14.15 SHEELA FOAM LTD.
14.15.1 COMPANY SNAPSHOT
14.15.2 REVENUE ANALYSIS
14.15.3 SWOT ANALYSIS
14.15.4 PRODUCT PORTFOLIO
14.15.5 RECENT DEVELOPMENTS
14.16 SUNPREETH ENGINEERS
14.16.1 COMPANY SNAPSHOT
14.16.2 SWOT ANALYSIS
14.16.3 PRODUCT PORTFOLIO
14.16.4 RECENT DEVELOPMENTS
14.17 TIRUPATI FOAM LTD.
14.17.1 COMPANY SNAPSHOT
14.17.2 REVENUE ANALYSIS
14.17.3 SWOT ANALYSIS
14.17.4 PRODUCT PORTFOLIO
14.17.5 RECENT DEVELOPMENTS
14.18 UFP TECHNOLOGIES, INC.
14.18.1 COMPANY SNAPSHOT
14.18.2 REVENUE ANALYSIS
14.18.3 PRODUCT PORTFOLIO
14.18.4 SWOT ANALYSIS
14.18.5 RECENT DEVELOPMENT
14.19 WISCONSIN FOAM PRODUCTS
14.19.1 COMPANY SNAPSHOT
14.19.2 PRODUCT PORTFOLIO
14.19.3 SWOT ANALYSIS
14.19.4 RECENT DEVELOPMENTS
15 QUESTIONNAIRE
16 RELATED REPORTS
List of Table
TABLE 1 REGULATORY COVERAGE
TABLE 2 EUROPE POLYURETHANE FOAM MARKET: BY PRODUCT, 2018-2032 (USD THOUSAND)
TABLE 3 EUROPE POLYURETHANE FOAM MARKET: BY PRODUCT, 2018-2032 (TONS)
TABLE 4 EUROPE FLEXIBLE FOAM IN POLYURETHANE FOAM MARKET, BY REGION, 2018-2032, (USD THOUSAND)
TABLE 5 EUROPE FLEXIBLE FOAM IN POLYURETHANE FOAM MARKET, BY REGION, 2018-2032, (TONS)
TABLE 6 EUROPE RIGID FOAM IN POLYURETHANE FOAM MARKET, BY REGION, 2018-2032, (USD THOUSAND)
TABLE 7 EUROPE RIGID FOAM IN POLYURETHANE FOAM MARKET, BY REGION, 2018-2032, (TONS)
TABLE 8 EUROPE SPRAY FOAM IN POLYURETHANE FOAM MARKET, BY REGION, 2018-2032, (USD THOUSAND)
TABLE 9 EUROPE SPRAY FOAM IN POLYURETHANE FOAM MARKET, BY REGION, 2018-2032, (TONS)
TABLE 10 EUROPE POLYURETHANE FOAM MARKET: BY CATEGORY, 2018-2032 (USD THOUSAND)
TABLE 11 EUROPE POLYURETHANE FOAM MARKET: BY CATEGORY, 2018-2032 (TONS)
TABLE 12 EUROPE OPEN CELL IN POLYURETHANE FOAM MARKET, BY REGION, 2018-2032, (USD THOUSAND)
TABLE 13 EUROPE OPEN CELL IN POLYURETHANE FOAM MARKET, BY REGION, 2018-2032, (TONS)
TABLE 14 EUROPE CLOSED CELL IN POLYURETHANE FOAM MARKET, BY REGION, 2018-2032, (USD THOUSAND)
TABLE 15 EUROPE CLOSED CELL IN POLYURETHANE FOAM MARKET, BY REGION, 2018-2032, (TONS)
TABLE 16 EUROPE POLYURETHANE FOAM MARKET: BY DENSITY COMPOSITION, 2018-2032 (USD THOUSAND)
TABLE 17 EUROPE POLYURETHANE FOAM MARKET: BY DENSITY COMPOSITION, 2018-2032 (TONS)
TABLE 18 EUROPE LOW-DENSITY COMPOSITION IN POLYURETHANE FOAM MARKET, BY REGION, 2018-2032, (USD THOUSAND)
TABLE 19 EUROPE LOW-DENSITY COMPOSITION IN POLYURETHANE FOAM MARKET, BY REGION, 2018-2032, (TONS)
TABLE 20 EUROPE MEDIUM-DENSITY COMPOSITION IN POLYURETHANE FOAM MARKET, BY REGION, 2018-2032, (USD THOUSAND)
TABLE 21 EUROPE MEDIUM-DENSITY COMPOSITION IN POLYURETHANE FOAM MARKET, BY REGION, 2018-2032, (TONS)
TABLE 22 EUROPE HIGH-DENSITY COMPOSITION IN POLYURETHANE FOAM MARKET, BY REGION, 2018-2032, (USD THOUSAND)
TABLE 23 EUROPE HIGH-DENSITY COMPOSITION IN POLYURETHANE FOAM MARKET, BY REGION, 2018-2032, (TONS)
TABLE 24 EUROPE POLYURETHANE FOAM MARKET: BY PROCESS, 2018-2032 (USD THOUSAND)
TABLE 25 EUROPE POLYURETHANE FOAM MARKET: BY PROCESS, 2018-2032 (TONS)
TABLE 26 EUROPE MOLDED FOAM IN POLYURETHANE FOAM MARKET, BY REGION, 2018-2032, (USD THOUSAND)
TABLE 27 EUROPE MOLDED FOAM IN POLYURETHANE FOAM MARKET, BY REGION, 2018-2032, (TONS)
TABLE 28 EUROPE SLABSTOCK FOAM IN POLYURETHANE FOAM MARKET, BY REGION, 2018-2032, (USD THOUSAND)
TABLE 29 EUROPE SLABSTOCK FOAM IN POLYURETHANE FOAM MARKET, BY REGION, 2018-2032, (TONS)
TABLE 30 EUROPE SPRAYING IN POLYURETHANE FOAM MARKET, BY REGION, 2018-2032, (USD THOUSAND)
TABLE 31 EUROPE SPRAYING IN POLYURETHANE FOAM MARKET, BY REGION, 2018-2032, (TONS)
TABLE 32 EUROPE LAMINATION IN POLYURETHANE FOAM MARKET, BY REGION, 2018-2032, (USD THOUSAND)
TABLE 33 EUROPE LAMINATION IN POLYURETHANE FOAM MARKET, BY REGION, 2018-2032, (TONS)
TABLE 34 EUROPE POLYURETHANE FOAM MARKET: BY END-USER, 2018-2032 (USD THOUSAND)
TABLE 35 EUROPE POLYURETHANE FOAM MARKET: BY END-USER, 2018-2032 (TONS)
TABLE 36 EUROPE BEDDING & FURNITURE IN POLYURETHANE FOAM MARKET, BY REGION, 2018-2032, (USD THOUSAND)
TABLE 37 EUROPE BEDDING & FURNITURE IN POLYURETHANE FOAM MARKET, BY REGION, 2018-2032, (TONS)
TABLE 38 EUROPE BEDDING & FURNITURE IN POLYURETHANE FOAM MARKET, BY END-USER, 2018-2032 (USD THOUSAND)
TABLE 39 EUROPE BEDDING & FURNITURE IN POLYURETHANE FOAM MARKET, BY PRODUCT TYPE, 2018-2032 (USD THOUSAND)
TABLE 40 EUROPE BUILDING & CONSTRUCTION IN POLYURETHANE FOAM MARKET, BY REGION, 2018-2032, (USD THOUSAND)
TABLE 41 EUROPE BUILDING & CONSTRUCTION IN POLYURETHANE FOAM MARKET, BY REGION, 2018-2032, (TONS)
TABLE 42 EUROPE BUILDING & CONSTRUCTION IN POLYURETHANE FOAM MARKET, BY END-USER, 2018-2032 (USD THOUSAND)
TABLE 43 EUROPE BUILDING & CONSTRUCTION IN POLYURETHANE FOAM MARKET, BY PRODUCT TYPE, 2018-2032 (USD THOUSAND)
TABLE 44 EUROPE AUTOMOTIVE IN POLYURETHANE FOAM MARKET, BY REGION, 2018-2032, (USD THOUSAND)
TABLE 45 EUROPE AUTOMOTIVE IN POLYURETHANE FOAM MARKET, BY REGION, 2018-2032, (TONS)
TABLE 46 EUROPE AUTOMOTIVE IN POLYURETHANE FOAM MARKET, BY END-USER, 2018-2032 (USD THOUSAND)
TABLE 47 EUROPE AUTOMOTIVE IN POLYURETHANE FOAM MARKET, BY PRODUCT TYPE, 2018-2032 (USD THOUSAND)
TABLE 48 EUROPE ELECTRONICS IN POLYURETHANE FOAM MARKET, BY REGION, 2018-2032, (USD THOUSAND)
TABLE 49 EUROPE ELECTRONICS IN POLYURETHANE FOAM MARKET, BY REGION, 2018-2032, (TONS)
TABLE 50 EUROPE ELECTRONICS IN POLYURETHANE FOAM MARKET, BY PRODUCT TYPE, 2018-2032 (USD THOUSAND)
TABLE 51 EUROPE PACKAGING IN POLYURETHANE FOAM MARKET, BY REGION, 2018-2032, (USD THOUSAND)
TABLE 52 EUROPE PACKAGING IN POLYURETHANE FOAM MARKET, BY REGION, 2018-2032, (TONS)
TABLE 53 EUROPE PACKAGING IN POLYURETHANE FOAM MARKET, BY END-USER, 2018-2032 (USD THOUSAND)
TABLE 54 EUROPE PACKAGING IN POLYURETHANE FOAM MARKET, BY PRODUCT TYPE, 2018-2032 (USD THOUSAND)
TABLE 55 EUROPE FOOTWEAR IN POLYURETHANE FOAM MARKET, BY REGION, 2018-2032, (USD THOUSAND)
TABLE 56 EUROPE FOOTWEAR IN POLYURETHANE FOAM MARKET, BY REGION, 2018-2032, (TONS)
TABLE 57 EUROPE FOOTWEAR IN POLYURETHANE FOAM MARKET, BY END-USER, 2018-2032 (USD THOUSAND)
TABLE 58 EUROPE FOOTWEAR IN POLYURETHANE FOAM MARKET, BY PRODUCT TYPE, 2018-2032 (USD THOUSAND)
TABLE 59 EUROPE OTHERS IN POLYURETHANE FOAM MARKET, BY REGION, 2018-2032, (USD THOUSAND)
TABLE 60 EUROPE OTHERS IN POLYURETHANE FOAM MARKET, BY REGION, 2018-2032, (TONS)
TABLE 61 EUROPE OTHERS IN POLYURETHANE FOAM MARKET, BY PRODUCT TYPE, 2018-2032 (USD THOUSAND)
TABLE 62 EUROPE POLYURETHANE FOAM MARKET, BY COUNTRY, 2018-2032 (USD THOUSAND)
TABLE 63 EUROPE POLYURETHANE FOAM MARKET, BY COUNTRY, 2018-2032 (TONS)
TABLE 64 EUROPE POLYURETHANE FOAM MARKET, BY PRODUCT, 2018-2032 (USD THOUSAND)
TABLE 65 EUROPE POLYURETHANE FOAM MARKET, BY PRODUCT, 2018-2032 (TONS)
TABLE 66 EUROPE POLYURETHANE FOAM MARKET, BY CATEGORY, 2018-2032 (USD THOUSAND)
TABLE 67 EUROPE POLYURETHANE FOAM MARKET, BY CATEGORY, 2018-2032 (TONS)
TABLE 68 EUROPE POLYURETHANE FOAM MARKET, BY DENSITY COMPOSITION, 2018-2032 (USD THOUSAND)
TABLE 69 EUROPE POLYURETHANE FOAM MARKET, BY DENSITY COMPOSITION, 2018-2032 (TONS)
TABLE 70 EUROPE POLYURETHANE FOAM MARKET, BY PROCESS, 2018-2032 (USD THOUSAND)
TABLE 71 EUROPE POLYURETHANE FOAM MARKET, BY PROCESS, 2018-2032 (TONS)
TABLE 72 EUROPE POLYURETHANE FOAM MARKET, BY END-USER, 2018-2032 (USD THOUSAND)
TABLE 73 EUROPE POLYURETHANE FOAM MARKET, BY END-USER, 2018-2032 (TONS)
TABLE 74 EUROPE BEDDING & FURNITURE IN POLYURETHANE FOAM MARKET, BY END-USER, 2018-2032 (USD THOUSAND)
TABLE 75 EUROPE BEDDING & FURNITURE IN POLYURETHANE FOAM MARKET, BY PRODUCT TYPE, 2018-2032 (USD THOUSAND)
TABLE 76 EUROPE BUILDING & CONSTRUCTION IN POLYURETHANE FOAM MARKET, BY END-USER, 2018-2032 (USD THOUSAND)
TABLE 77 EUROPE BUILDING & CONSTRUCTION IN POLYURETHANE FOAM MARKET, BY PRODUCT TYPE, 2018-2032 (USD THOUSAND)
TABLE 78 EUROPE AUTOMOTIVE IN POLYURETHANE FOAM MARKET, BY END-USER, 2018-2032 (USD THOUSAND)
TABLE 79 EUROPE AUTOMOTIVE IN POLYURETHANE FOAM MARKET, BY PRODUCT TYPE, 2018-2032 (USD THOUSAND)
TABLE 80 EUROPE ELECTRONICS IN POLYURETHANE FOAM MARKET, BY PRODUCT TYPE, 2018-2032 (USD THOUSAND)
TABLE 81 EUROPE PACKAGING IN POLYURETHANE FOAM MARKET, BY END-USER, 2018-2032 (USD THOUSAND)
TABLE 82 EUROPE PACKAGING IN POLYURETHANE FOAM MARKET, BY PRODUCT TYPE, 2018-2032 (USD THOUSAND)
TABLE 83 EUROPE FOOTWEAR IN POLYURETHANE FOAM MARKET, BY END-USER, 2018-2032 (USD THOUSAND)
TABLE 84 EUROPE FOOTWEAR IN POLYURETHANE FOAM MARKET, BY PRODUCT TYPE, 2018-2032 (USD THOUSAND)
TABLE 85 EUROPE OTHERS IN POLYURETHANE FOAM MARKET, BY PRODUCT TYPE, 2018-2032 (USD THOUSAND)
TABLE 86 GERMANY POLYURETHANE FOAM MARKET, BY PRODUCT, 2018-2032 (USD THOUSAND)
TABLE 87 GERMANY POLYURETHANE FOAM MARKET, BY PRODUCT, 2018-2032 (TONS)
TABLE 88 GERMANY POLYURETHANE FOAM MARKET, BY CATEGORY, 2018-2032 (USD THOUSAND)
TABLE 89 GERMANY POLYURETHANE FOAM MARKET, BY CATEGORY, 2018-2032 (TONS)
TABLE 90 GERMANY POLYURETHANE FOAM MARKET, BY DENSITY COMPOSITION, 2018-2032 (USD THOUSAND)
TABLE 91 GERMANY POLYURETHANE FOAM MARKET, BY DENSITY COMPOSITION, 2018-2032 (TONS)
TABLE 92 GERMANY POLYURETHANE FOAM MARKET, BY PROCESS, 2018-2032 (USD THOUSAND)
TABLE 93 GERMANY POLYURETHANE FOAM MARKET, BY PROCESS, 2018-2032 (TONS)
TABLE 94 GERMANY POLYURETHANE FOAM MARKET, BY END-USER, 2018-2032 (USD THOUSAND)
TABLE 95 GERMANY POLYURETHANE FOAM MARKET, BY END-USER, 2018-2032 (TONS)
TABLE 96 GERMANY BEDDING & FURNITURE IN POLYURETHANE FOAM MARKET, BY END-USER, 2018-2032 (USD THOUSAND)
TABLE 97 GERMANY BEDDING & FURNITURE IN POLYURETHANE FOAM MARKET, BY PRODUCT TYPE, 2018-2032 (USD THOUSAND)
TABLE 98 GERMANY BUILDING & CONSTRUCTION IN POLYURETHANE FOAM MARKET, BY END-USER, 2018-2032 (USD THOUSAND)
TABLE 99 GERMANY BUILDING & CONSTRUCTION IN POLYURETHANE FOAM MARKET, BY PRODUCT TYPE, 2018-2032 (USD THOUSAND)
TABLE 100 GERMANY AUTOMOTIVE IN POLYURETHANE FOAM MARKET, BY END-USER, 2018-2032 (USD THOUSAND)
TABLE 101 GERMANY AUTOMOTIVE IN POLYURETHANE FOAM MARKET, BY PRODUCT TYPE, 2018-2032 (USD THOUSAND)
TABLE 102 GERMANY ELECTRONICS IN POLYURETHANE FOAM MARKET, BY PRODUCT TYPE, 2018-2032 (USD THOUSAND)
TABLE 103 GERMANY PACKAGING IN POLYURETHANE FOAM MARKET, BY END-USER, 2018-2032 (USD THOUSAND)
TABLE 104 GERMANY PACKAGING IN POLYURETHANE FOAM MARKET, BY PRODUCT TYPE, 2018-2032 (USD THOUSAND)
TABLE 105 GERMANY FOOTWEAR IN POLYURETHANE FOAM MARKET, BY END-USER, 2018-2032 (USD THOUSAND)
TABLE 106 GERMANY FOOTWEAR IN POLYURETHANE FOAM MARKET, BY PRODUCT TYPE, 2018-2032 (USD THOUSAND)
TABLE 107 GERMANY OTHERS IN POLYURETHANE FOAM MARKET, BY PRODUCT TYPE, 2018-2032 (USD THOUSAND)
TABLE 108 FRANCE POLYURETHANE FOAM MARKET, BY PRODUCT, 2018-2032 (USD THOUSAND)
TABLE 109 FRANCE POLYURETHANE FOAM MARKET, BY PRODUCT, 2018-2032 (TONS)
TABLE 110 FRANCE POLYURETHANE FOAM MARKET, BY CATEGORY, 2018-2032 (USD THOUSAND)
TABLE 111 FRANCE POLYURETHANE FOAM MARKET, BY CATEGORY, 2018-2032 (TONS)
TABLE 112 FRANCE POLYURETHANE FOAM MARKET, BY DENSITY COMPOSITION, 2018-2032 (USD THOUSAND)
TABLE 113 FRANCE POLYURETHANE FOAM MARKET, BY DENSITY COMPOSITION, 2018-2032 (TONS)
TABLE 114 FRANCE POLYURETHANE FOAM MARKET, BY PROCESS, 2018-2032 (USD THOUSAND)
TABLE 115 FRANCE POLYURETHANE FOAM MARKET, BY PROCESS, 2018-2032 (TONS)
TABLE 116 FRANCE POLYURETHANE FOAM MARKET, BY END-USER, 2018-2032 (USD THOUSAND)
TABLE 117 FRANCE POLYURETHANE FOAM MARKET, BY END-USER, 2018-2032 (TONS)
TABLE 118 FRANCE BEDDING & FURNITURE IN POLYURETHANE FOAM MARKET, BY END-USER, 2018-2032 (USD THOUSAND)
TABLE 119 FRANCE BEDDING & FURNITURE IN POLYURETHANE FOAM MARKET, BY PRODUCT TYPE, 2018-2032 (USD THOUSAND)
TABLE 120 FRANCE BUILDING & CONSTRUCTION IN POLYURETHANE FOAM MARKET, BY END-USER, 2018-2032 (USD THOUSAND)
TABLE 121 FRANCE BUILDING & CONSTRUCTION IN POLYURETHANE FOAM MARKET, BY PRODUCT TYPE, 2018-2032 (USD THOUSAND)
TABLE 122 FRANCE AUTOMOTIVE IN POLYURETHANE FOAM MARKET, BY END-USER, 2018-2032 (USD THOUSAND)
TABLE 123 FRANCE AUTOMOTIVE IN POLYURETHANE FOAM MARKET, BY PRODUCT TYPE, 2018-2032 (USD THOUSAND)
TABLE 124 FRANCE ELECTRONICS IN POLYURETHANE FOAM MARKET, BY PRODUCT TYPE, 2018-2032 (USD THOUSAND)
TABLE 125 FRANCE PACKAGING IN POLYURETHANE FOAM MARKET, BY END-USER, 2018-2032 (USD THOUSAND)
TABLE 126 FRANCE PACKAGING IN POLYURETHANE FOAM MARKET, BY PRODUCT TYPE, 2018-2032 (USD THOUSAND)
TABLE 127 FRANCE FOOTWEAR IN POLYURETHANE FOAM MARKET, BY END-USER, 2018-2032 (USD THOUSAND)
TABLE 128 FRANCE FOOTWEAR IN POLYURETHANE FOAM MARKET, BY PRODUCT TYPE, 2018-2032 (USD THOUSAND)
TABLE 129 FRANCE OTHERS IN POLYURETHANE FOAM MARKET, BY PRODUCT TYPE, 2018-2032 (USD THOUSAND)
TABLE 130 U.K. POLYURETHANE FOAM MARKET, BY PRODUCT, 2018-2032 (USD THOUSAND)
TABLE 131 U.K. POLYURETHANE FOAM MARKET, BY PRODUCT, 2018-2032 (TONS)
TABLE 132 U.K. POLYURETHANE FOAM MARKET, BY CATEGORY, 2018-2032 (USD THOUSAND)
TABLE 133 U.K. POLYURETHANE FOAM MARKET, BY CATEGORY, 2018-2032 (TONS)
TABLE 134 U.K. POLYURETHANE FOAM MARKET, BY DENSITY COMPOSITION, 2018-2032 (USD THOUSAND)
TABLE 135 U.K. POLYURETHANE FOAM MARKET, BY DENSITY COMPOSITION, 2018-2032 (TONS)
TABLE 136 U.K. POLYURETHANE FOAM MARKET, BY PROCESS, 2018-2032 (USD THOUSAND)
TABLE 137 U.K. POLYURETHANE FOAM MARKET, BY PROCESS, 2018-2032 (TONS)
TABLE 138 U.K. POLYURETHANE FOAM MARKET, BY END-USER, 2018-2032 (USD THOUSAND)
TABLE 139 U.K. POLYURETHANE FOAM MARKET, BY END-USER, 2018-2032 (TONS)
TABLE 140 U.K. BEDDING & FURNITURE IN POLYURETHANE FOAM MARKET, BY END-USER, 2018-2032 (USD THOUSAND)
TABLE 141 U.K. BEDDING & FURNITURE IN POLYURETHANE FOAM MARKET, BY PRODUCT TYPE, 2018-2032 (USD THOUSAND)
TABLE 142 U.K. BUILDING & CONSTRUCTION IN POLYURETHANE FOAM MARKET, BY END-USER, 2018-2032 (USD THOUSAND)
TABLE 143 U.K. BUILDING & CONSTRUCTION IN POLYURETHANE FOAM MARKET, BY PRODUCT TYPE, 2018-2032 (USD THOUSAND)
TABLE 144 U.K. AUTOMOTIVE IN POLYURETHANE FOAM MARKET, BY END-USER, 2018-2032 (USD THOUSAND)
TABLE 145 U.K. AUTOMOTIVE IN POLYURETHANE FOAM MARKET, BY PRODUCT TYPE, 2018-2032 (USD THOUSAND)
TABLE 146 U.K. ELECTRONICS IN POLYURETHANE FOAM MARKET, BY PRODUCT TYPE, 2018-2032 (USD THOUSAND)
TABLE 147 U.K. PACKAGING IN POLYURETHANE FOAM MARKET, BY END-USER, 2018-2032 (USD THOUSAND)
TABLE 148 U.K. PACKAGING IN POLYURETHANE FOAM MARKET, BY PRODUCT TYPE, 2018-2032 (USD THOUSAND)
TABLE 149 U.K. FOOTWEAR IN POLYURETHANE FOAM MARKET, BY END-USER, 2018-2032 (USD THOUSAND)
TABLE 150 U.K. FOOTWEAR IN POLYURETHANE FOAM MARKET, BY PRODUCT TYPE, 2018-2032 (USD THOUSAND)
TABLE 151 U.K. OTHERS IN POLYURETHANE FOAM MARKET, BY PRODUCT TYPE, 2018-2032 (USD THOUSAND)
TABLE 152 SPAIN POLYURETHANE FOAM MARKET, BY PRODUCT, 2018-2032 (USD THOUSAND)
TABLE 153 SPAIN POLYURETHANE FOAM MARKET, BY PRODUCT, 2018-2032 (TONS)
TABLE 154 SPAIN POLYURETHANE FOAM MARKET, BY CATEGORY, 2018-2032 (USD THOUSAND)
TABLE 155 SPAIN POLYURETHANE FOAM MARKET, BY CATEGORY, 2018-2032 (TONS)
TABLE 156 SPAIN POLYURETHANE FOAM MARKET, BY DENSITY COMPOSITION, 2018-2032 (USD THOUSAND)
TABLE 157 SPAIN POLYURETHANE FOAM MARKET, BY DENSITY COMPOSITION, 2018-2032 (TONS)
TABLE 158 SPAIN POLYURETHANE FOAM MARKET, BY PROCESS, 2018-2032 (USD THOUSAND)
TABLE 159 SPAIN POLYURETHANE FOAM MARKET, BY PROCESS, 2018-2032 (TONS)
TABLE 160 SPAIN POLYURETHANE FOAM MARKET, BY END-USER, 2018-2032 (USD THOUSAND)
TABLE 161 SPAIN POLYURETHANE FOAM MARKET, BY END-USER, 2018-2032 (TONS)
TABLE 162 SPAIN BEDDING & FURNITURE IN POLYURETHANE FOAM MARKET, BY END-USER, 2018-2032 (USD THOUSAND)
TABLE 163 SPAIN BEDDING & FURNITURE IN POLYURETHANE FOAM MARKET, BY PRODUCT TYPE, 2018-2032 (USD THOUSAND)
TABLE 164 SPAIN BUILDING & CONSTRUCTION IN POLYURETHANE FOAM MARKET, BY END-USER, 2018-2032 (USD THOUSAND)
TABLE 165 SPAIN BUILDING & CONSTRUCTION IN POLYURETHANE FOAM MARKET, BY PRODUCT TYPE, 2018-2032 (USD THOUSAND)
TABLE 166 SPAIN AUTOMOTIVE IN POLYURETHANE FOAM MARKET, BY END-USER, 2018-2032 (USD THOUSAND)
TABLE 167 SPAIN AUTOMOTIVE IN POLYURETHANE FOAM MARKET, BY PRODUCT TYPE, 2018-2032 (USD THOUSAND)
TABLE 168 SPAIN ELECTRONICS IN POLYURETHANE FOAM MARKET, BY PRODUCT TYPE, 2018-2032 (USD THOUSAND)
TABLE 169 SPAIN PACKAGING IN POLYURETHANE FOAM MARKET, BY END-USER, 2018-2032 (USD THOUSAND)
TABLE 170 SPAIN PACKAGING IN POLYURETHANE FOAM MARKET, BY PRODUCT TYPE, 2018-2032 (USD THOUSAND)
TABLE 171 SPAIN FOOTWEAR IN POLYURETHANE FOAM MARKET, BY END-USER, 2018-2032 (USD THOUSAND)
TABLE 172 SPAIN FOOTWEAR IN POLYURETHANE FOAM MARKET, BY PRODUCT TYPE, 2018-2032 (USD THOUSAND)
TABLE 173 SPAIN OTHERS IN POLYURETHANE FOAM MARKET, BY PRODUCT TYPE, 2018-2032 (USD THOUSAND)
TABLE 174 ITALY POLYURETHANE FOAM MARKET, BY PRODUCT, 2018-2032 (USD THOUSAND)
TABLE 175 ITALY POLYURETHANE FOAM MARKET, BY PRODUCT, 2018-2032 (TONS)
TABLE 176 ITALY POLYURETHANE FOAM MARKET, BY CATEGORY, 2018-2032 (USD THOUSAND)
TABLE 177 ITALY POLYURETHANE FOAM MARKET, BY CATEGORY, 2018-2032 (TONS)
TABLE 178 ITALY POLYURETHANE FOAM MARKET, BY DENSITY COMPOSITION, 2018-2032 (USD THOUSAND)
TABLE 179 ITALY POLYURETHANE FOAM MARKET, BY DENSITY COMPOSITION, 2018-2032 (TONS)
TABLE 180 ITALY POLYURETHANE FOAM MARKET, BY PROCESS, 2018-2032 (USD THOUSAND)
TABLE 181 ITALY POLYURETHANE FOAM MARKET, BY PROCESS, 2018-2032 (TONS)
TABLE 182 ITALY POLYURETHANE FOAM MARKET, BY END-USER, 2018-2032 (USD THOUSAND)
TABLE 183 ITALY POLYURETHANE FOAM MARKET, BY END-USER, 2018-2032 (TONS)
TABLE 184 ITALY BEDDING & FURNITURE IN POLYURETHANE FOAM MARKET, BY END-USER, 2018-2032 (USD THOUSAND)
TABLE 185 ITALY BEDDING & FURNITURE IN POLYURETHANE FOAM MARKET, BY PRODUCT TYPE, 2018-2032 (USD THOUSAND)
TABLE 186 ITALY BUILDING & CONSTRUCTION IN POLYURETHANE FOAM MARKET, BY END-USER, 2018-2032 (USD THOUSAND)
TABLE 187 ITALY BUILDING & CONSTRUCTION IN POLYURETHANE FOAM MARKET, BY PRODUCT TYPE, 2018-2032 (USD THOUSAND)
TABLE 188 ITALY AUTOMOTIVE IN POLYURETHANE FOAM MARKET, BY END-USER, 2018-2032 (USD THOUSAND)
TABLE 189 ITALY AUTOMOTIVE IN POLYURETHANE FOAM MARKET, BY PRODUCT TYPE, 2018-2032 (USD THOUSAND)
TABLE 190 ITALY ELECTRONICS IN POLYURETHANE FOAM MARKET, BY PRODUCT TYPE, 2018-2032 (USD THOUSAND)
TABLE 191 ITALY PACKAGING IN POLYURETHANE FOAM MARKET, BY END-USER, 2018-2032 (USD THOUSAND)
TABLE 192 ITALY PACKAGING IN POLYURETHANE FOAM MARKET, BY PRODUCT TYPE, 2018-2032 (USD THOUSAND)
TABLE 193 ITALY FOOTWEAR IN POLYURETHANE FOAM MARKET, BY END-USER, 2018-2032 (USD THOUSAND)
TABLE 194 ITALY FOOTWEAR IN POLYURETHANE FOAM MARKET, BY PRODUCT TYPE, 2018-2032 (USD THOUSAND)
TABLE 195 ITALY OTHERS IN POLYURETHANE FOAM MARKET, BY PRODUCT TYPE, 2018-2032 (USD THOUSAND)
TABLE 196 POLAND POLYURETHANE FOAM MARKET, BY PRODUCT, 2018-2032 (USD THOUSAND)
TABLE 197 POLAND POLYURETHANE FOAM MARKET, BY PRODUCT, 2018-2032 (TONS)
TABLE 198 POLAND POLYURETHANE FOAM MARKET, BY CATEGORY, 2018-2032 (USD THOUSAND)
TABLE 199 POLAND POLYURETHANE FOAM MARKET, BY CATEGORY, 2018-2032 (TONS)
TABLE 200 POLAND POLYURETHANE FOAM MARKET, BY DENSITY COMPOSITION, 2018-2032 (USD THOUSAND)
TABLE 201 POLAND POLYURETHANE FOAM MARKET, BY DENSITY COMPOSITION, 2018-2032 (TONS)
TABLE 202 POLAND POLYURETHANE FOAM MARKET, BY PROCESS, 2018-2032 (USD THOUSAND)
TABLE 203 POLAND POLYURETHANE FOAM MARKET, BY PROCESS, 2018-2032 (TONS)
TABLE 204 POLAND POLYURETHANE FOAM MARKET, BY END-USER, 2018-2032 (USD THOUSAND)
TABLE 205 POLAND POLYURETHANE FOAM MARKET, BY END-USER, 2018-2032 (TONS)
TABLE 206 POLAND BEDDING & FURNITURE IN POLYURETHANE FOAM MARKET, BY END-USER, 2018-2032 (USD THOUSAND)
TABLE 207 POLAND BEDDING & FURNITURE IN POLYURETHANE FOAM MARKET, BY PRODUCT TYPE, 2018-2032 (USD THOUSAND)
TABLE 208 POLAND BUILDING & CONSTRUCTION IN POLYURETHANE FOAM MARKET, BY END-USER, 2018-2032 (USD THOUSAND)
TABLE 209 POLAND BUILDING & CONSTRUCTION IN POLYURETHANE FOAM MARKET, BY PRODUCT TYPE, 2018-2032 (USD THOUSAND)
TABLE 210 POLAND AUTOMOTIVE IN POLYURETHANE FOAM MARKET, BY END-USER, 2018-2032 (USD THOUSAND)
TABLE 211 POLAND AUTOMOTIVE IN POLYURETHANE FOAM MARKET, BY PRODUCT TYPE, 2018-2032 (USD THOUSAND)
TABLE 212 POLAND ELECTRONICS IN POLYURETHANE FOAM MARKET, BY PRODUCT TYPE, 2018-2032 (USD THOUSAND)
TABLE 213 POLAND PACKAGING IN POLYURETHANE FOAM MARKET, BY END-USER, 2018-2032 (USD THOUSAND)
TABLE 214 POLAND PACKAGING IN POLYURETHANE FOAM MARKET, BY PRODUCT TYPE, 2018-2032 (USD THOUSAND)
TABLE 215 POLAND FOOTWEAR IN POLYURETHANE FOAM MARKET, BY END-USER, 2018-2032 (USD THOUSAND)
TABLE 216 POLAND FOOTWEAR IN POLYURETHANE FOAM MARKET, BY PRODUCT TYPE, 2018-2032 (USD THOUSAND)
TABLE 217 POLAND OTHERS IN POLYURETHANE FOAM MARKET, BY PRODUCT TYPE, 2018-2032 (USD THOUSAND)
TABLE 218 NETHERLANDS POLYURETHANE FOAM MARKET, BY PRODUCT, 2018-2032 (USD THOUSAND)
TABLE 219 NETHERLANDS POLYURETHANE FOAM MARKET, BY PRODUCT, 2018-2032 (TONS)
TABLE 220 NETHERLANDS POLYURETHANE FOAM MARKET, BY CATEGORY, 2018-2032 (USD THOUSAND)
TABLE 221 NETHERLANDS POLYURETHANE FOAM MARKET, BY CATEGORY, 2018-2032 (TONS)
TABLE 222 NETHERLANDS POLYURETHANE FOAM MARKET, BY DENSITY COMPOSITION, 2018-2032 (USD THOUSAND)
TABLE 223 NETHERLANDS POLYURETHANE FOAM MARKET, BY DENSITY COMPOSITION, 2018-2032 (TONS)
TABLE 224 NETHERLANDS POLYURETHANE FOAM MARKET, BY PROCESS, 2018-2032 (USD THOUSAND)
TABLE 225 NETHERLANDS POLYURETHANE FOAM MARKET, BY PROCESS, 2018-2032 (TONS)
TABLE 226 NETHERLANDS POLYURETHANE FOAM MARKET, BY END-USER, 2018-2032 (USD THOUSAND)
TABLE 227 NETHERLANDS POLYURETHANE FOAM MARKET, BY END-USER, 2018-2032 (TONS)
TABLE 228 NETHERLANDS BEDDING & FURNITURE IN POLYURETHANE FOAM MARKET, BY END-USER, 2018-2032 (USD THOUSAND)
TABLE 229 NETHERLANDS BEDDING & FURNITURE IN POLYURETHANE FOAM MARKET, BY PRODUCT TYPE, 2018-2032 (USD THOUSAND)
TABLE 230 NETHERLANDS BUILDING & CONSTRUCTION IN POLYURETHANE FOAM MARKET, BY END-USER, 2018-2032 (USD THOUSAND)
TABLE 231 NETHERLANDS BUILDING & CONSTRUCTION IN POLYURETHANE FOAM MARKET, BY PRODUCT TYPE, 2018-2032 (USD THOUSAND)
TABLE 232 NETHERLANDS AUTOMOTIVE IN POLYURETHANE FOAM MARKET, BY END-USER, 2018-2032 (USD THOUSAND)
TABLE 233 NETHERLANDS AUTOMOTIVE IN POLYURETHANE FOAM MARKET, BY PRODUCT TYPE, 2018-2032 (USD THOUSAND)
TABLE 234 NETHERLANDS ELECTRONICS IN POLYURETHANE FOAM MARKET, BY PRODUCT TYPE, 2018-2032 (USD THOUSAND)
TABLE 235 NETHERLANDS PACKAGING IN POLYURETHANE FOAM MARKET, BY END-USER, 2018-2032 (USD THOUSAND)
TABLE 236 NETHERLANDS PACKAGING IN POLYURETHANE FOAM MARKET, BY PRODUCT TYPE, 2018-2032 (USD THOUSAND)
TABLE 237 NETHERLANDS FOOTWEAR IN POLYURETHANE FOAM MARKET, BY END-USER, 2018-2032 (USD THOUSAND)
TABLE 238 NETHERLANDS FOOTWEAR IN POLYURETHANE FOAM MARKET, BY PRODUCT TYPE, 2018-2032 (USD THOUSAND)
TABLE 239 NETHERLANDS OTHERS IN POLYURETHANE FOAM MARKET, BY PRODUCT TYPE, 2018-2032 (USD THOUSAND)
TABLE 240 RUSSIA POLYURETHANE FOAM MARKET, BY PRODUCT, 2018-2032 (USD THOUSAND)
TABLE 241 RUSSIA POLYURETHANE FOAM MARKET, BY PRODUCT, 2018-2032 (TONS)
TABLE 242 RUSSIA POLYURETHANE FOAM MARKET, BY CATEGORY, 2018-2032 (USD THOUSAND)
TABLE 243 RUSSIA POLYURETHANE FOAM MARKET, BY CATEGORY, 2018-2032 (TONS)
TABLE 244 RUSSIA POLYURETHANE FOAM MARKET, BY DENSITY COMPOSITION, 2018-2032 (USD THOUSAND)
TABLE 245 RUSSIA POLYURETHANE FOAM MARKET, BY DENSITY COMPOSITION, 2018-2032 (TONS)
TABLE 246 RUSSIA POLYURETHANE FOAM MARKET, BY PROCESS, 2018-2032 (USD THOUSAND)
TABLE 247 RUSSIA POLYURETHANE FOAM MARKET, BY PROCESS, 2018-2032 (TONS)
TABLE 248 RUSSIA POLYURETHANE FOAM MARKET, BY END-USER, 2018-2032 (USD THOUSAND)
TABLE 249 RUSSIA POLYURETHANE FOAM MARKET, BY END-USER, 2018-2032 (TONS)
TABLE 250 RUSSIA BEDDING & FURNITURE IN POLYURETHANE FOAM MARKET, BY END-USER, 2018-2032 (USD THOUSAND)
TABLE 251 RUSSIA BEDDING & FURNITURE IN POLYURETHANE FOAM MARKET, BY PRODUCT TYPE, 2018-2032 (USD THOUSAND)
TABLE 252 RUSSIA BUILDING & CONSTRUCTION IN POLYURETHANE FOAM MARKET, BY END-USER, 2018-2032 (USD THOUSAND)
TABLE 253 RUSSIA BUILDING & CONSTRUCTION IN POLYURETHANE FOAM MARKET, BY PRODUCT TYPE, 2018-2032 (USD THOUSAND)
TABLE 254 RUSSIA AUTOMOTIVE IN POLYURETHANE FOAM MARKET, BY END-USER, 2018-2032 (USD THOUSAND)
TABLE 255 RUSSIA AUTOMOTIVE IN POLYURETHANE FOAM MARKET, BY PRODUCT TYPE, 2018-2032 (USD THOUSAND)
TABLE 256 RUSSIA ELECTRONICS IN POLYURETHANE FOAM MARKET, BY PRODUCT TYPE, 2018-2032 (USD THOUSAND)
TABLE 257 RUSSIA PACKAGING IN POLYURETHANE FOAM MARKET, BY END-USER, 2018-2032 (USD THOUSAND)
TABLE 258 RUSSIA PACKAGING IN POLYURETHANE FOAM MARKET, BY PRODUCT TYPE, 2018-2032 (USD THOUSAND)
TABLE 259 RUSSIA FOOTWEAR IN POLYURETHANE FOAM MARKET, BY END-USER, 2018-2032 (USD THOUSAND)
TABLE 260 RUSSIA FOOTWEAR IN POLYURETHANE FOAM MARKET, BY PRODUCT TYPE, 2018-2032 (USD THOUSAND)
TABLE 261 RUSSIA OTHERS IN POLYURETHANE FOAM MARKET, BY PRODUCT TYPE, 2018-2032 (USD THOUSAND)
TABLE 262 TURKEY POLYURETHANE FOAM MARKET, BY PRODUCT, 2018-2032 (USD THOUSAND)
TABLE 263 TURKEY POLYURETHANE FOAM MARKET, BY PRODUCT, 2018-2032 (TONS)
TABLE 264 TURKEY POLYURETHANE FOAM MARKET, BY CATEGORY, 2018-2032 (USD THOUSAND)
TABLE 265 TURKEY POLYURETHANE FOAM MARKET, BY CATEGORY, 2018-2032 (TONS)
TABLE 266 TURKEY POLYURETHANE FOAM MARKET, BY DENSITY COMPOSITION, 2018-2032 (USD THOUSAND)
TABLE 267 TURKEY POLYURETHANE FOAM MARKET, BY DENSITY COMPOSITION, 2018-2032 (TONS)
TABLE 268 TURKEY POLYURETHANE FOAM MARKET, BY PROCESS, 2018-2032 (USD THOUSAND)
TABLE 269 TURKEY POLYURETHANE FOAM MARKET, BY PROCESS, 2018-2032 (TONS)
TABLE 270 TURKEY POLYURETHANE FOAM MARKET, BY END-USER, 2018-2032 (USD THOUSAND)
TABLE 271 TURKEY POLYURETHANE FOAM MARKET, BY END-USER, 2018-2032 (TONS)
TABLE 272 TURKEY BEDDING & FURNITURE IN POLYURETHANE FOAM MARKET, BY END-USER, 2018-2032 (USD THOUSAND)
TABLE 273 TURKEY BEDDING & FURNITURE IN POLYURETHANE FOAM MARKET, BY PRODUCT TYPE, 2018-2032 (USD THOUSAND)
TABLE 274 TURKEY BUILDING & CONSTRUCTION IN POLYURETHANE FOAM MARKET, BY END-USER, 2018-2032 (USD THOUSAND)
TABLE 275 TURKEY BUILDING & CONSTRUCTION IN POLYURETHANE FOAM MARKET, BY PRODUCT TYPE, 2018-2032 (USD THOUSAND)
TABLE 276 TURKEY AUTOMOTIVE IN POLYURETHANE FOAM MARKET, BY END-USER, 2018-2032 (USD THOUSAND)
TABLE 277 TURKEY AUTOMOTIVE IN POLYURETHANE FOAM MARKET, BY PRODUCT TYPE, 2018-2032 (USD THOUSAND)
TABLE 278 TURKEY ELECTRONICS IN POLYURETHANE FOAM MARKET, BY PRODUCT TYPE, 2018-2032 (USD THOUSAND)
TABLE 279 TURKEY PACKAGING IN POLYURETHANE FOAM MARKET, BY END-USER, 2018-2032 (USD THOUSAND)
TABLE 280 TURKEY PACKAGING IN POLYURETHANE FOAM MARKET, BY PRODUCT TYPE, 2018-2032 (USD THOUSAND)
TABLE 281 TURKEY FOOTWEAR IN POLYURETHANE FOAM MARKET, BY END-USER, 2018-2032 (USD THOUSAND)
TABLE 282 TURKEY FOOTWEAR IN POLYURETHANE FOAM MARKET, BY PRODUCT TYPE, 2018-2032 (USD THOUSAND)
TABLE 283 TURKEY OTHERS IN POLYURETHANE FOAM MARKET, BY PRODUCT TYPE, 2018-2032 (USD THOUSAND)
TABLE 284 BELGIUM POLYURETHANE FOAM MARKET, BY PRODUCT, 2018-2032 (USD THOUSAND)
TABLE 285 BELGIUM POLYURETHANE FOAM MARKET, BY PRODUCT, 2018-2032 (TONS)
TABLE 286 BELGIUM POLYURETHANE FOAM MARKET, BY CATEGORY, 2018-2032 (USD THOUSAND)
TABLE 287 BELGIUM POLYURETHANE FOAM MARKET, BY CATEGORY, 2018-2032 (TONS)
TABLE 288 BELGIUM POLYURETHANE FOAM MARKET, BY DENSITY COMPOSITION, 2018-2032 (USD THOUSAND)
TABLE 289 BELGIUM POLYURETHANE FOAM MARKET, BY DENSITY COMPOSITION, 2018-2032 (TONS)
TABLE 290 BELGIUM POLYURETHANE FOAM MARKET, BY PROCESS, 2018-2032 (USD THOUSAND)
TABLE 291 BELGIUM POLYURETHANE FOAM MARKET, BY PROCESS, 2018-2032 (TONS)
TABLE 292 BELGIUM POLYURETHANE FOAM MARKET, BY END-USER, 2018-2032 (USD THOUSAND)
TABLE 293 BELGIUM POLYURETHANE FOAM MARKET, BY END-USER, 2018-2032 (TONS)
TABLE 294 BELGIUM BEDDING & FURNITURE IN POLYURETHANE FOAM MARKET, BY END-USER, 2018-2032 (USD THOUSAND)
TABLE 295 BELGIUM BEDDING & FURNITURE IN POLYURETHANE FOAM MARKET, BY PRODUCT TYPE, 2018-2032 (USD THOUSAND)
TABLE 296 BELGIUM BUILDING & CONSTRUCTION IN POLYURETHANE FOAM MARKET, BY END-USER, 2018-2032 (USD THOUSAND)
TABLE 297 BELGIUM BUILDING & CONSTRUCTION IN POLYURETHANE FOAM MARKET, BY PRODUCT TYPE, 2018-2032 (USD THOUSAND)
TABLE 298 BELGIUM AUTOMOTIVE IN POLYURETHANE FOAM MARKET, BY END-USER, 2018-2032 (USD THOUSAND)
TABLE 299 BELGIUM AUTOMOTIVE IN POLYURETHANE FOAM MARKET, BY PRODUCT TYPE, 2018-2032 (USD THOUSAND)
TABLE 300 BELGIUM ELECTRONICS IN POLYURETHANE FOAM MARKET, BY PRODUCT TYPE, 2018-2032 (USD THOUSAND)
TABLE 301 BELGIUM PACKAGING IN POLYURETHANE FOAM MARKET, BY END-USER, 2018-2032 (USD THOUSAND)
TABLE 302 BELGIUM PACKAGING IN POLYURETHANE FOAM MARKET, BY PRODUCT TYPE, 2018-2032 (USD THOUSAND)
TABLE 303 BELGIUM FOOTWEAR IN POLYURETHANE FOAM MARKET, BY END-USER, 2018-2032 (USD THOUSAND)
TABLE 304 BELGIUM FOOTWEAR IN POLYURETHANE FOAM MARKET, BY PRODUCT TYPE, 2018-2032 (USD THOUSAND)
TABLE 305 BELGIUM OTHERS IN POLYURETHANE FOAM MARKET, BY PRODUCT TYPE, 2018-2032 (USD THOUSAND)
TABLE 306 SWEDEN POLYURETHANE FOAM MARKET, BY PRODUCT, 2018-2032 (USD THOUSAND)
TABLE 307 SWEDEN POLYURETHANE FOAM MARKET, BY PRODUCT, 2018-2032 (TONS)
TABLE 308 SWEDEN POLYURETHANE FOAM MARKET, BY CATEGORY, 2018-2032 (USD THOUSAND)
TABLE 309 SWEDEN POLYURETHANE FOAM MARKET, BY CATEGORY, 2018-2032 (TONS)
TABLE 310 SWEDEN POLYURETHANE FOAM MARKET, BY DENSITY COMPOSITION, 2018-2032 (USD THOUSAND)
TABLE 311 SWEDEN POLYURETHANE FOAM MARKET, BY DENSITY COMPOSITION, 2018-2032 (TONS)
TABLE 312 SWEDEN POLYURETHANE FOAM MARKET, BY PROCESS, 2018-2032 (USD THOUSAND)
TABLE 313 SWEDEN POLYURETHANE FOAM MARKET, BY PROCESS, 2018-2032 (TONS)
TABLE 314 SWEDEN POLYURETHANE FOAM MARKET, BY END-USER, 2018-2032 (USD THOUSAND)
TABLE 315 SWEDEN POLYURETHANE FOAM MARKET, BY END-USER, 2018-2032 (TONS)
TABLE 316 SWEDEN BEDDING & FURNITURE IN POLYURETHANE FOAM MARKET, BY END-USER, 2018-2032 (USD THOUSAND)
TABLE 317 SWEDEN BEDDING & FURNITURE IN POLYURETHANE FOAM MARKET, BY PRODUCT TYPE, 2018-2032 (USD THOUSAND)
TABLE 318 SWEDEN BUILDING & CONSTRUCTION IN POLYURETHANE FOAM MARKET, BY END-USER, 2018-2032 (USD THOUSAND)
TABLE 319 SWEDEN BUILDING & CONSTRUCTION IN POLYURETHANE FOAM MARKET, BY PRODUCT TYPE, 2018-2032 (USD THOUSAND)
TABLE 320 SWEDEN AUTOMOTIVE IN POLYURETHANE FOAM MARKET, BY END-USER, 2018-2032 (USD THOUSAND)
TABLE 321 SWEDEN AUTOMOTIVE IN POLYURETHANE FOAM MARKET, BY PRODUCT TYPE, 2018-2032 (USD THOUSAND)
TABLE 322 SWEDEN ELECTRONICS IN POLYURETHANE FOAM MARKET, BY PRODUCT TYPE, 2018-2032 (USD THOUSAND)
TABLE 323 SWEDEN PACKAGING IN POLYURETHANE FOAM MARKET, BY END-USER, 2018-2032 (USD THOUSAND)
TABLE 324 SWEDEN PACKAGING IN POLYURETHANE FOAM MARKET, BY PRODUCT TYPE, 2018-2032 (USD THOUSAND)
TABLE 325 SWEDEN FOOTWEAR IN POLYURETHANE FOAM MARKET, BY END-USER, 2018-2032 (USD THOUSAND)
TABLE 326 SWEDEN FOOTWEAR IN POLYURETHANE FOAM MARKET, BY PRODUCT TYPE, 2018-2032 (USD THOUSAND)
TABLE 327 SWEDEN OTHERS IN POLYURETHANE FOAM MARKET, BY PRODUCT TYPE, 2018-2032 (USD THOUSAND)
TABLE 328 SWITZERLAND POLYURETHANE FOAM MARKET, BY PRODUCT, 2018-2032 (USD THOUSAND)
TABLE 329 SWITZERLAND POLYURETHANE FOAM MARKET, BY PRODUCT, 2018-2032 (TONS)
TABLE 330 SWITZERLAND POLYURETHANE FOAM MARKET, BY CATEGORY, 2018-2032 (USD THOUSAND)
TABLE 331 SWITZERLAND POLYURETHANE FOAM MARKET, BY CATEGORY, 2018-2032 (TONS)
TABLE 332 SWITZERLAND POLYURETHANE FOAM MARKET, BY DENSITY COMPOSITION, 2018-2032 (USD THOUSAND)
TABLE 333 SWITZERLAND POLYURETHANE FOAM MARKET, BY DENSITY COMPOSITION, 2018-2032 (TONS)
TABLE 334 SWITZERLAND POLYURETHANE FOAM MARKET, BY PROCESS, 2018-2032 (USD THOUSAND)
TABLE 335 SWITZERLAND POLYURETHANE FOAM MARKET, BY PROCESS, 2018-2032 (TONS)
TABLE 336 SWITZERLAND POLYURETHANE FOAM MARKET, BY END-USER, 2018-2032 (USD THOUSAND)
TABLE 337 SWITZERLAND POLYURETHANE FOAM MARKET, BY END-USER, 2018-2032 (TONS)
TABLE 338 SWITZERLAND BEDDING & FURNITURE IN POLYURETHANE FOAM MARKET, BY END-USER, 2018-2032 (USD THOUSAND)
TABLE 339 SWITZERLAND BEDDING & FURNITURE IN POLYURETHANE FOAM MARKET, BY PRODUCT TYPE, 2018-2032 (USD THOUSAND)
TABLE 340 SWITZERLAND BUILDING & CONSTRUCTION IN POLYURETHANE FOAM MARKET, BY END-USER, 2018-2032 (USD THOUSAND)
TABLE 341 SWITZERLAND BUILDING & CONSTRUCTION IN POLYURETHANE FOAM MARKET, BY PRODUCT TYPE, 2018-2032 (USD THOUSAND)
TABLE 342 SWITZERLAND AUTOMOTIVE IN POLYURETHANE FOAM MARKET, BY END-USER, 2018-2032 (USD THOUSAND)
TABLE 343 SWITZERLAND AUTOMOTIVE IN POLYURETHANE FOAM MARKET, BY PRODUCT TYPE, 2018-2032 (USD THOUSAND)
TABLE 344 SWITZERLAND ELECTRONICS IN POLYURETHANE FOAM MARKET, BY PRODUCT TYPE, 2018-2032 (USD THOUSAND)
TABLE 345 SWITZERLAND PACKAGING IN POLYURETHANE FOAM MARKET, BY END-USER, 2018-2032 (USD THOUSAND)
TABLE 346 SWITZERLAND PACKAGING IN POLYURETHANE FOAM MARKET, BY PRODUCT TYPE, 2018-2032 (USD THOUSAND)
TABLE 347 SWITZERLAND FOOTWEAR IN POLYURETHANE FOAM MARKET, BY END-USER, 2018-2032 (USD THOUSAND)
TABLE 348 SWITZERLAND FOOTWEAR IN POLYURETHANE FOAM MARKET, BY PRODUCT TYPE, 2018-2032 (USD THOUSAND)
TABLE 349 SWITZERLAND OTHERS IN POLYURETHANE FOAM MARKET, BY PRODUCT TYPE, 2018-2032 (USD THOUSAND)
TABLE 350 DENMARK POLYURETHANE FOAM MARKET, BY PRODUCT, 2018-2032 (USD THOUSAND)
TABLE 351 DENMARK POLYURETHANE FOAM MARKET, BY PRODUCT, 2018-2032 (TONS)
TABLE 352 DENMARK POLYURETHANE FOAM MARKET, BY CATEGORY, 2018-2032 (USD THOUSAND)
TABLE 353 DENMARK POLYURETHANE FOAM MARKET, BY CATEGORY, 2018-2032 (TONS)
TABLE 354 DENMARK POLYURETHANE FOAM MARKET, BY DENSITY COMPOSITION, 2018-2032 (USD THOUSAND)
TABLE 355 DENMARK POLYURETHANE FOAM MARKET, BY DENSITY COMPOSITION, 2018-2032 (TONS)
TABLE 356 DENMARK POLYURETHANE FOAM MARKET, BY PROCESS, 2018-2032 (USD THOUSAND)
TABLE 357 DENMARK POLYURETHANE FOAM MARKET, BY PROCESS, 2018-2032 (TONS)
TABLE 358 DENMARK POLYURETHANE FOAM MARKET, BY END-USER, 2018-2032 (USD THOUSAND)
TABLE 359 DENMARK POLYURETHANE FOAM MARKET, BY END-USER, 2018-2032 (TONS)
TABLE 360 DENMARK BEDDING & FURNITURE IN POLYURETHANE FOAM MARKET, BY END-USER, 2018-2032 (USD THOUSAND)
TABLE 361 DENMARK BEDDING & FURNITURE IN POLYURETHANE FOAM MARKET, BY PRODUCT TYPE, 2018-2032 (USD THOUSAND)
TABLE 362 DENMARK BUILDING & CONSTRUCTION IN POLYURETHANE FOAM MARKET, BY END-USER, 2018-2032 (USD THOUSAND)
TABLE 363 DENMARK BUILDING & CONSTRUCTION IN POLYURETHANE FOAM MARKET, BY PRODUCT TYPE, 2018-2032 (USD THOUSAND)
TABLE 364 DENMARK AUTOMOTIVE IN POLYURETHANE FOAM MARKET, BY END-USER, 2018-2032 (USD THOUSAND)
TABLE 365 DENMARK AUTOMOTIVE IN POLYURETHANE FOAM MARKET, BY PRODUCT TYPE, 2018-2032 (USD THOUSAND)
TABLE 366 DENMARK ELECTRONICS IN POLYURETHANE FOAM MARKET, BY PRODUCT TYPE, 2018-2032 (USD THOUSAND)
TABLE 367 DENMARK PACKAGING IN POLYURETHANE FOAM MARKET, BY END-USER, 2018-2032 (USD THOUSAND)
TABLE 368 DENMARK PACKAGING IN POLYURETHANE FOAM MARKET, BY PRODUCT TYPE, 2018-2032 (USD THOUSAND)
TABLE 369 DENMARK FOOTWEAR IN POLYURETHANE FOAM MARKET, BY END-USER, 2018-2032 (USD THOUSAND)
TABLE 370 DENMARK FOOTWEAR IN POLYURETHANE FOAM MARKET, BY PRODUCT TYPE, 2018-2032 (USD THOUSAND)
TABLE 371 DENMARK OTHERS IN POLYURETHANE FOAM MARKET, BY PRODUCT TYPE, 2018-2032 (USD THOUSAND)
TABLE 372 FINLAND POLYURETHANE FOAM MARKET, BY PRODUCT, 2018-2032 (USD THOUSAND)
TABLE 373 FINLAND POLYURETHANE FOAM MARKET, BY PRODUCT, 2018-2032 (TONS)
TABLE 374 FINLAND POLYURETHANE FOAM MARKET, BY CATEGORY, 2018-2032 (USD THOUSAND)
TABLE 375 FINLAND POLYURETHANE FOAM MARKET, BY CATEGORY, 2018-2032 (TONS)
TABLE 376 FINLAND POLYURETHANE FOAM MARKET, BY DENSITY COMPOSITION, 2018-2032 (USD THOUSAND)
TABLE 377 FINLAND POLYURETHANE FOAM MARKET, BY DENSITY COMPOSITION, 2018-2032 (TONS)
TABLE 378 FINLAND POLYURETHANE FOAM MARKET, BY PROCESS, 2018-2032 (USD THOUSAND)
TABLE 379 FINLAND POLYURETHANE FOAM MARKET, BY PROCESS, 2018-2032 (TONS)
TABLE 380 FINLAND POLYURETHANE FOAM MARKET, BY END-USER, 2018-2032 (USD THOUSAND)
TABLE 381 FINLAND POLYURETHANE FOAM MARKET, BY END-USER, 2018-2032 (TONS)
TABLE 382 FINLAND BEDDING & FURNITURE IN POLYURETHANE FOAM MARKET, BY END-USER, 2018-2032 (USD THOUSAND)
TABLE 383 FINLAND BEDDING & FURNITURE IN POLYURETHANE FOAM MARKET, BY PRODUCT TYPE, 2018-2032 (USD THOUSAND)
TABLE 384 FINLAND BUILDING & CONSTRUCTION IN POLYURETHANE FOAM MARKET, BY END-USER, 2018-2032 (USD THOUSAND)
TABLE 385 FINLAND BUILDING & CONSTRUCTION IN POLYURETHANE FOAM MARKET, BY PRODUCT TYPE, 2018-2032 (USD THOUSAND)
TABLE 386 FINLAND AUTOMOTIVE IN POLYURETHANE FOAM MARKET, BY END-USER, 2018-2032 (USD THOUSAND)
TABLE 387 FINLAND AUTOMOTIVE IN POLYURETHANE FOAM MARKET, BY PRODUCT TYPE, 2018-2032 (USD THOUSAND)
TABLE 388 FINLAND ELECTRONICS IN POLYURETHANE FOAM MARKET, BY PRODUCT TYPE, 2018-2032 (USD THOUSAND)
TABLE 389 FINLAND PACKAGING IN POLYURETHANE FOAM MARKET, BY END-USER, 2018-2032 (USD THOUSAND)
TABLE 390 FINLAND PACKAGING IN POLYURETHANE FOAM MARKET, BY PRODUCT TYPE, 2018-2032 (USD THOUSAND)
TABLE 391 FINLAND FOOTWEAR IN POLYURETHANE FOAM MARKET, BY END-USER, 2018-2032 (USD THOUSAND)
TABLE 392 FINLAND FOOTWEAR IN POLYURETHANE FOAM MARKET, BY PRODUCT TYPE, 2018-2032 (USD THOUSAND)
TABLE 393 FINLAND OTHERS IN POLYURETHANE FOAM MARKET, BY PRODUCT TYPE, 2018-2032 (USD THOUSAND)
TABLE 394 NORWAY POLYURETHANE FOAM MARKET, BY PRODUCT, 2018-2032 (USD THOUSAND)
TABLE 395 NORWAY POLYURETHANE FOAM MARKET, BY PRODUCT, 2018-2032 (TONS)
TABLE 396 NORWAY POLYURETHANE FOAM MARKET, BY CATEGORY, 2018-2032 (USD THOUSAND)
TABLE 397 NORWAY POLYURETHANE FOAM MARKET, BY CATEGORY, 2018-2032 (TONS)
TABLE 398 NORWAY POLYURETHANE FOAM MARKET, BY DENSITY COMPOSITION, 2018-2032 (USD THOUSAND)
TABLE 399 NORWAY POLYURETHANE FOAM MARKET, BY DENSITY COMPOSITION, 2018-2032 (TONS)
TABLE 400 NORWAY POLYURETHANE FOAM MARKET, BY PROCESS, 2018-2032 (USD THOUSAND)
TABLE 401 NORWAY POLYURETHANE FOAM MARKET, BY PROCESS, 2018-2032 (TONS)
TABLE 402 NORWAY POLYURETHANE FOAM MARKET, BY END-USER, 2018-2032 (USD THOUSAND)
TABLE 403 NORWAY POLYURETHANE FOAM MARKET, BY END-USER, 2018-2032 (TONS)
TABLE 404 NORWAY BEDDING & FURNITURE IN POLYURETHANE FOAM MARKET, BY END-USER, 2018-2032 (USD THOUSAND)
TABLE 405 NORWAY BEDDING & FURNITURE IN POLYURETHANE FOAM MARKET, BY PRODUCT TYPE, 2018-2032 (USD THOUSAND)
TABLE 406 NORWAY BUILDING & CONSTRUCTION IN POLYURETHANE FOAM MARKET, BY END-USER, 2018-2032 (USD THOUSAND)
TABLE 407 NORWAY BUILDING & CONSTRUCTION IN POLYURETHANE FOAM MARKET, BY PRODUCT TYPE, 2018-2032 (USD THOUSAND)
TABLE 408 NORWAY AUTOMOTIVE IN POLYURETHANE FOAM MARKET, BY END-USER, 2018-2032 (USD THOUSAND)
TABLE 409 NORWAY AUTOMOTIVE IN POLYURETHANE FOAM MARKET, BY PRODUCT TYPE, 2018-2032 (USD THOUSAND)
TABLE 410 NORWAY ELECTRONICS IN POLYURETHANE FOAM MARKET, BY PRODUCT TYPE, 2018-2032 (USD THOUSAND)
TABLE 411 NORWAY PACKAGING IN POLYURETHANE FOAM MARKET, BY END-USER, 2018-2032 (USD THOUSAND)
TABLE 412 NORWAY PACKAGING IN POLYURETHANE FOAM MARKET, BY PRODUCT TYPE, 2018-2032 (USD THOUSAND)
TABLE 413 NORWAY FOOTWEAR IN POLYURETHANE FOAM MARKET, BY END-USER, 2018-2032 (USD THOUSAND)
TABLE 414 NORWAY FOOTWEAR IN POLYURETHANE FOAM MARKET, BY PRODUCT TYPE, 2018-2032 (USD THOUSAND)
TABLE 415 NORWAY OTHERS IN POLYURETHANE FOAM MARKET, BY PRODUCT TYPE, 2018-2032 (USD THOUSAND)
TABLE 416 REST OF EUROPE POLYURETHANE FOAM MARKET, BY PRODUCT, 2018-2032 (USD THOUSAND)
TABLE 417 REST OF EUROPE POLYURETHANE FOAM MARKET, BY PRODUCT, 2018-2032 (TONS)
List of Figure
FIGURE 1 EUROPE POLYURETHANE FOAM MARKET
FIGURE 2 EUROPE POLYURETHANE FOAM MARKET: DATA TRIANGULATION
FIGURE 3 EUROPE POLYURETHANE FOAM MARKET: DROC ANALYSIS
FIGURE 4 EUROPE POLYURETHANE FOAM MARKET: EUROPE VS REGIONAL MARKET ANALYSIS
FIGURE 5 EUROPE POLYURETHANE FOAM MARKET: COMPANY RESEARCH ANALYSIS
FIGURE 6 EUROPE POLYURETHANE FOAM MARKET: THE PRODUCT LIFE LINE CURVE
FIGURE 7 EUROPE POLYURETHANE FOAM MARKET: MULTIVARIATE MODELLING
FIGURE 8 EUROPE POLYURETHANE FOAM MARKET: INTERVIEW DEMOGRAPHICS
FIGURE 9 EUROPE POLYURETHANE FOAM MARKET: DBMR MARKET POSITION GRID
FIGURE 10 EUROPE POLYURETHANE FOAM MARKET: MARKET END-USER COVERAGE GRID
FIGURE 11 EUROPE POLYURETHANE FOAM MARKET: VENDOR SHARE ANALYSIS
FIGURE 12 EUROPE POLYURETHANE FOAM MARKET: SEGMENTATION
FIGURE 13 EUROPE POLYURETHANE FOAM MARKET EXECUTIVE SUMMARY
FIGURE 14 THREE SEGMENTS COMPRISE THE EUROPE POLYURETHANE FOAM MARKET, BY PRODUCT
FIGURE 15 STRATEGIC DECISIONS
FIGURE 16 A POSITIVE OUTLOOK TOWARDS THE BUILDING AND CONSTRUCTION SECTOR IS EXPECTED TO DRIVE THE EUROPE POLYURETHANE FOAM MARKET IN THE FORECAST PERIOD
FIGURE 17 THE FLEXIBLE FOAM SEGMENT IS EXPECTED TO ACCOUNT FOR THE LARGEST SHARE OF THE EUROPE POLYURETHANE FOAM MARKET IN 2025 AND 2032
FIGURE 18 VENDOR SELECTION CRITERIA
FIGURE 19 ESTIMATED PRODUCTION CONSUMPTION ANALYSIS
FIGURE 20 DRIVERS, RESTRAINTS, OPPORTUNITIES, AND CHALLENGES OF THE EUROPE POLYURETHANE FOAM MARKET
FIGURE 21 EUROPE POLYURETHANE FOAM MARKET: BY PRODUCT, 2024
FIGURE 22 EUROPE POLYURETHANE FOAM MARKET: BY CATEGORY, 2024
FIGURE 23 EUROPE POLYURETHANE FOAM MARKET: BY DENSITY COMPOSITION, 2024
FIGURE 24 EUROPE POLYURETHANE FOAM MARKET: BY PROCESS, 2024
FIGURE 25 EUROPE POLYURETHANE FOAM MARKET: BY END-USER, 2024
FIGURE 26 EUROPE POLYURETHANE FOAM MARKET: SNAPSHOT (2024)
FIGURE 27 EUROPE POLYURETHANE FOAM MARKET: COMPANY SHARE 2024 (%)
Europe Polyurethane Foam Market, Supply Chain Analysis and Ecosystem Framework
To support market growth and help clients navigate the impact of geopolitical shifts, DBMR has integrated in-depth supply chain analysis into its Europe Polyurethane Foam Market research reports. This addition empowers clients to respond effectively to global changes affecting their industries. The supply chain analysis section includes detailed insights such as Europe Polyurethane Foam Market consumption and production by country, price trend analysis, the impact of tariffs and geopolitical developments, and import and export trends by country and HSN code. It also highlights major suppliers with data on production capacity and company profiles, as well as key importers and exporters. In addition to research, DBMR offers specialized supply chain consulting services backed by over a decade of experience, providing solutions like supplier discovery, supplier risk assessment, price trend analysis, impact evaluation of inflation and trade route changes, and comprehensive market trend analysis.
Research Methodology
Data collection and base year analysis are done using data collection modules with large sample sizes. The stage includes obtaining market information or related data through various sources and strategies. It includes examining and planning all the data acquired from the past in advance. It likewise envelops the examination of information inconsistencies seen across different information sources. The market data is analysed and estimated using market statistical and coherent models. Also, market share analysis and key trend analysis are the major success factors in the market report. To know more, please request an analyst call or drop down your inquiry.
The key research methodology used by DBMR research team is data triangulation which involves data mining, analysis of the impact of data variables on the market and primary (industry expert) validation. Data models include Vendor Positioning Grid, Market Time Line Analysis, Market Overview and Guide, Company Positioning Grid, Patent Analysis, Pricing Analysis, Company Market Share Analysis, Standards of Measurement, Global versus Regional and Vendor Share Analysis. To know more about the research methodology, drop in an inquiry to speak to our industry experts.
Customization Available
Data Bridge Market Research is a leader in advanced formative research. We take pride in servicing our existing and new customers with data and analysis that match and suits their goal. The report can be customized to include price trend analysis of target brands understanding the market for additional countries (ask for the list of countries), clinical trial results data, literature review, refurbished market and product base analysis. Market analysis of target competitors can be analyzed from technology-based analysis to market portfolio strategies. We can add as many competitors that you require data about in the format and data style you are looking for. Our team of analysts can also provide you data in crude raw excel files pivot tables (Fact book) or can assist you in creating presentations from the data sets available in the report.

