

Global Gallium Nitride Gan Powered Chargers Market
Tamanho do mercado em biliões de dólares
CAGR :
% 
 USD
690.40 Million
USD
841.00 Million
2022
2030
USD
690.40 Million
USD
841.00 Million
2022
2030
| 2023 –2030 | |
| USD 690.40 Million | |
| USD 841.00 Million | |
| % | |
|
Global Gallium Nitride (GaN) Powered Chargers Market, By Power Output (25W GaN Chargers, 30W GaN Chargers, 45W GaN Chargers, 60W GaN Chargers, 65W GaN Chargers, 90W GaN Chargers, 100W GaN Chargers), Application (Smartphones and Tablets, Laptops and Notebooks, Autonomous Robots, Industrial Equipment, and Wireless Charging), End User (Consumer Electronics, IT and Telecommunication, Automotive, Aerospace and Defense, and Others) - Industry Trends and Forecast to 2030.
Gallium Nitride (GaN) Powered Chargers Market Analysis and Size
The global market for gallium nitride (GaN) powered chargers has experienced consistent growth from over a past few years. The expansion of the consumer electronics, automotive, aerospace, and military, and defense industries is mainly responsible for the global market. The advent of novel GaN applications, rising RF power electronics utilization, and outstanding characteristics, including high breakdown voltage and low energy consumption, are key factors fuelling the growth of the global market.
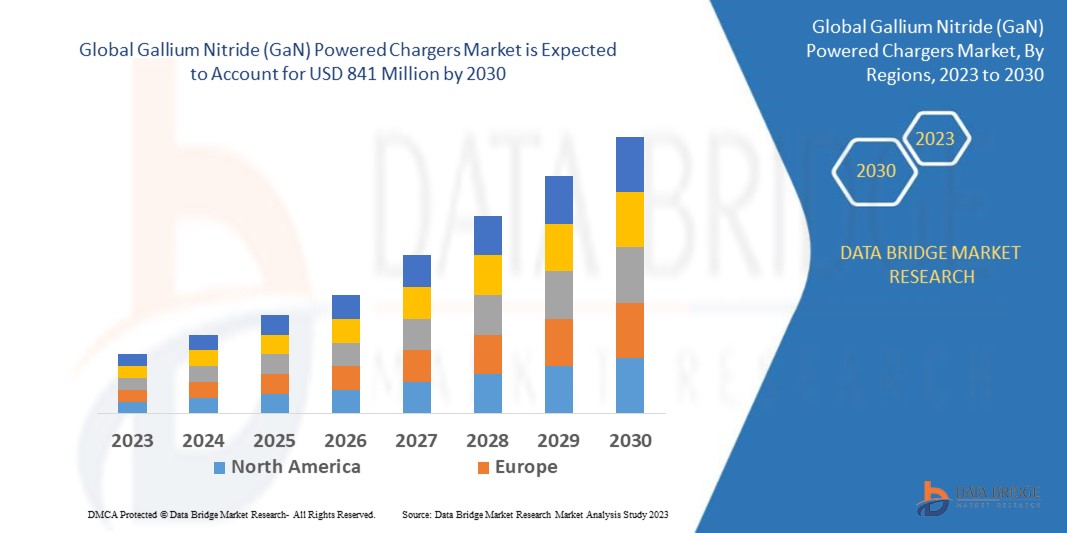
Data Bridge Market Research analyses that the global gallium nitride (GaN) powered chargers market was valued at USD 690.40 million in 2022, and is expected to reach USD 841 million by 2030, registering a CAGR of 5.2% during the forecast period of 2023-2030. In addition to the market insights such as market value, growth rate, market segments, geographical coverage, market players, and market scenario, the market report curated by the Data Bridge Market Research team includes in-depth expert analysis, import/export analysis, pricing analysis, production consumption analysis, and pestle analysis.
Gallium Nitride (GaN) Powered Chargers Market Scope and Segmentation
|
Report Metric |
Details |
|
Forecast Period |
2023 to 2030 |
|
Base Year |
2022 |
|
Historic Years |
2021 (Customizable to 2015-2020) |
|
Quantitative Units |
Revenue in USD Million, Volumes in Units, Pricing in USD |
|
Segments Covered |
Power Output (25W GaN Chargers, 30W GaN Chargers, 45W GaN Chargers, 60W GaN Chargers, 65W GaN Chargers, 90W GaN Chargers, 100W GaN Chargers), Application (Smartphones and Tablets, Laptops and Notebooks, Autonomous Robots, Industrial Equipment, and Wireless Charging), End User (Consumer Electronics, IT and Telecommunication, Automotive, Aerospace and Defense, and Others) |
|
Countries Covered |
U.S., Canada, Mexico, Brazil, Argentina, Rest of South America, Germany, Italy, U.K., France, Spain, Netherlands, Belgium, Switzerland, Turkey, Russia, Rest of Europe, Japan, China, India, South Korea, Australia, Singapore, Malaysia, Thailand, Indonesia, Philippines, Rest of Asia-Pacific, Saudi Arabia, U.A.E., South Africa, Egypt, Israel, Rest of the Middle East and Africa |
|
Market Players Covered |
Fujitsu (Japan), Toshiba Corporation (Japan), Texas Instruments Incorporated (U.S.), Cree LED (U.S.), Aixtron (Germany), Mitsubishi Chemical Corporation (Japan), Eaton (Ireland), Siemens (Germany), Belkin International, Inc (U.S.), Aukey (China), Gizmochina (China), VisIC Technologies (Israel), Koninklijke Philips N.V. (Netherlands), VINA International Holdings LTD. (U.S.), GaN Systems Inc. (Canada), Epigan NV (Belgium) and Navitas Semiconductor Ltd. (U.S.) |
|
Market Opportunities |
|
Market Definition
GaN (Gallium Nitride) phone chargers, also known as GaN-based chargers or GaN power adapters, are compact and high-performance charging devices specifically designed for charging smartphones and other electronic devices. They utilize Gallium Nitride semiconductor technology, which offers several advantages over traditional silicon-based chargers. Gallium nitride, or GaN, is a material that is beginning to be used in charger semiconductors. But now it has been used in the manufacture of LEDs since the 1990s, and is also a popular material for solar cell arrays on satellites. The most important feature of GaN in chargers is that it produces less heat.
Global Gallium Nitride (GaN) Powered Chargers Market Dynamics
Drivers
- Burgeoning Demand for Gallium Nitride (GaN) Powered Chargers
The demand for quick charging solutions that generate less heat and reduce the likelihood of overcharging is what drives the market for GaN-powered chargers. The increased usage of modern chargers, which include monitoring systems across various end-use industries, is expected to fuel the market for GaN-powered chargers. The demand for fast charging while preserving all power capabilities and safety regulations for the telecommunications sectors has been driving industry expansion.
Furthermore, the integration of the technologies including Internet of Things (IoT), machine learning, artificial intelligence (AI) and others is further estimated to accelerate the overall market expansion during the forecast period. Additionally, the high demand for these chargers across the verticals is also anticipated to drive the market's growth rate. The surge in demand for energy-efficient and fast charging devices will further positively impact the market's growth rate during the forecast period.
Opportunities
- Development of Micro GaN-Powered Chargers
The development of micro GaN-powered chargers that can be incorporated with compact electronics devices is estimated to generate lucrative opportunities for the market, which will further expand the gallium nitride (GaN) powered chargers market's growth rate during the forecast period of 2023-2030. In addition, industry participants are concentrating on research and development operations to advance GaN technology and launch more effective products. To keep or grow their market share in the worldwide market, makers of consumer electronics products are signing long-term contracts with producers of GaN-powered chargers.
- Shift In Emphasis from Si to GaN
The shift in emphasis from Si to GaN due to the improvement in electronic device operating frequency and decrease in component charging time, weight, and cost further offers numerous growth opportunities within the market. The GaN-powered chargers have a broadband gap, high switching frequencies and are relatively small.
Restraints/Challenges
- Prevalence of Local Brands
The low-quality GaN-powered chargers are produced in large quantities due to the prevalence of local brands and the lack of manufacturing norms or regulations. Consequently, the global market for GaN-powered chargers is projected to experience slow growth as a result of this reason over the forecast period of 2023 to 2030.
- Lack of Uniformity and Standards
A significant obstacle is the lack of uniformity in the technology and parts used to produce GaN-powered chargers. GaN-powered charger market expansion is anticipated to be hampered by the lack of clear standards in the marketplace, which result in considerable product and price differentiation which is estimated to be significant challenge for the global gallium nitride (GaN) powered chargers market over the forecast period of 2023 to 2030.
This global gallium nitride (GaN) powered chargers market report provides details of new recent developments, trade regulations, import-export analysis, production analysis, value chain optimization, market share, impact of domestic and localized market players, analyses opportunities in terms of emerging revenue pockets, changes in market regulations, strategic market growth analysis, market size, category market growths, application niches and dominance, product approvals, product launches, geographic expansions, technological innovations in the market. To gain more info on the global gallium nitride (GaN) powered chargers market contact Data Bridge Market Research for an Analyst Brief, our team will help you take an informed market decision to achieve market growth.
Recent Developments
- In January 2021, Dell and Navitas Semiconductor partnered to develop innovative charging technologies based on GaN. Both businesses have joined together to create fresh applications for gallium nitride (GaN)
- In September 2020, Samsung Electronics struck a contract with Verizon as its first client in the United States in order to expand indoor coverage. The current standard for rapid charging is GaN-based wall chargers, which Verizon offers. GaN-based wall chargers are considerably more compact than other types of conventional chargers
- In November 2020, New Gallium Nitride (GaN) Series 120W charging heads from Baseus was available in 45W, 65W, and 120W outputs. Leading the charging business, the company recently unveiled the first 65W triple-port quick charging plug. Up to 100W 20V/5A laptop charging is the primary purpose of the new 120W Gallium Nitride (GaN) Series. In addition, it supports MacBook, Dell, HP, Lenovo, and more. It can rapidly charge two laptops at once
- In November 2020, With GaN power module evaluation kits such as the 100V Driver GaN DC/DC Power Stage Module, 650V 150A Half-Bridge IPM, 650V 150A Full-Bridge Module and Driver, and 650V 300A 3-Phase Module and Driver, GaN Systems increased the size of the power market. GaN modules have higher system performance and conform to industry standards for footprints
Global Gallium Nitride (GaN) Powered Chargers Market Scope
The global gallium nitride (GaN) powered chargers market is segmented on the basis of power output, application and end user. The growth amongst these segments will help you analyse meagre growth segments in the industries and provide the users with a valuable market overview and market insights to help them make strategic decisions for identifying core market applications.
Power Output
- 25W GaN Chargers
- 30W GaN Chargers
- 45W GaN Chargers
- 60W GaN Chargers
- 65W GaN Chargers
- 90W GaN Chargers
- 100W GaN Chargers
Application
- Smartphones and Tablets
- Laptops and Notebooks
- Autonomous Robots
- Industrial Equipment
- Wireless Charging
End User
- Consumer Electronics
- IT and Telecommunication
- Automotive
- Aerospace and Defense
- Others
Global Gallium Nitride (GaN) Powered Chargers Market Region Analysis/Insights
The global gallium nitride (GaN) powered chargers market is analysed and market size insights and trends are provided by region, power output, application and end user as referenced above.
The countries covered in the global gallium nitride (GaN) powered chargers market report are U.S., Canada, Mexico, Brazil, Argentina, the Rest of South America, Germany, Italy, U.K., France, Spain, Netherlands, Belgium, Switzerland, Turkey, Russia, Rest of Europe, Japan, China, India, South Korea, Australia, Singapore, Malaysia, Thailand, Indonesia, Philippines, Rest of Asia-Pacific, Saudi Arabia, U.A.E., South Africa, Egypt, Israel, Rest of the Middle East and Africa
Asia-Pacific dominates the global gallium nitride (GaN) powered chargers market because of the high demand for LEDs across the consumer electronics and automotive industries within the region over the forecast period of 2023 to 2030. Moreover, the high adoption of electric vehicles coupled with the rapidly expanding semiconductor industry is further estimated to accelerate the expansion over the forecast period.
Asia-Pacific will register the highest CAGR and will be the fastest growing region in the global gallium nitride (GaN) powered chargers market for this period of 2023 to 2030, due to increase economic growth witnessed by key countries such as China and Japan in this region.
The region section of the report also provides individual market-impacting factors and changes in regulation in the market domestically that impact the current and future trends of the market. Data points like downstream and upstream value chain analysis, technical trends, and Porter’s five forces analysis, case studies are some of the pointers used to forecast the market scenario for individual countries. Also, the presence and availability of global brands and the challenges faced due to large or scarce competition from local and domestic brands, the impact of domestic tariffs, and trade routes are considered while providing forecast analysis of the region data.
Competitive Landscape and Global Gallium Nitride (GaN) Powered Chargers Market Share Analysis
The global gallium nitride (GaN) powered chargers market competitive landscape provides details of competitors. Details included are company overview, company financials, revenue generated, market potential, investment in research and development, new market initiatives, global presence, production sites and facilities, production capacities, company strengths and weaknesses, product launch, product width and breadth, and application dominance. The above data points provided are only related to the companies' focus related to the global gallium nitride (GaN) powered chargers market.
Some of the major players operating in the global gallium nitride (GaN) powered chargers market are:
- Fujitsu (Japan)
- Toshiba Corporation (Japan)
- Texas Instruments Incorporated (U.S.)
- Cree LED (U.S.)
- Aixtron (Germany)
- Mitsubishi Chemical Corporation (Japan)
- Eaton (Ireland)
- Siemens (Germany)
- Belkin International, Inc (U.S.)
- Aukey (China)
- Gizmochina (China)
- VisIC Technologies (Israel)
- Koninklijke Philips N.V. (Netherlands)
- VINA International Holdings LTD. (U.S.)
- GaN Systems Inc. (Canada)
- Epigan NV (Belgium)
- Navitas Semiconductor Ltd.(U.S.)
SKU-
Obtenha acesso online ao relatório sobre a primeira nuvem de inteligência de mercado do mundo

- Painel interativo de análise de dados
- Painel de análise da empresa para oportunidades de elevado potencial de crescimento
- Acesso de analista de pesquisa para personalização e customização. consultas
- Análise da concorrência com painel interativo
- Últimas notícias, atualizações e atualizações Análise de tendências
- Aproveite o poder da análise de benchmark para um rastreio abrangente da concorrência
Índice
1. INTRODUCTION
1.1 OBJECTIVES OF THE STUDY
1.2 MARKET DEFINITION
1.3 OVERVIEW OF GLOBAL GALLIUM NITRIDE (GAN) POWERED CHARGERS MARKET
1.4 CURRENCY AND PRICING
1.5 LIMITATION
1.6 MARKETS COVERED
2. MARKET SEGMENTATION
2.1 KEY TAKEAWAYS
2.2 ARRIVING AT THE GLOBAL GALLIUM NITRIDE (GAN) POWERED CHARGERS MARKET
2.2.1 VENDOR POSITIONING GRID
2.2.2 TECHNOLOGY LIFE LINE CURVE
2.2.3 MARKET GUIDE
2.2.4 COMPANY POSITIONING GRID
2.2.5 MULTIVARIATE MODELLING
2.2.6 STANDARDS OF MEASUREMENT
2.2.7 TOP TO BOTTOM ANALYSIS
2.2.8 VENDOR SHARE ANALYSIS
2.2.9 DATA POINTS FROM KEY PRIMARY INTERVIEWS
2.2.10 DATA POINTS FROM KEY SECONDARY DATABASES
2.3 GLOBAL GALLIUM NITRIDE (GAN) POWERED CHARGERS MARKET: RESEARCH SNAPSHOT
2.4 ASSUMPTIONS
3. MARKET OVERVIEW
3.1 DRIVERS
3.2 RESTRAINTS
3.3 OPPORTUNITIES
3.4 CHALLENGES
4. EXECUTIVE SUMMARY
5. PREMIUM INSIGHTS
5.1 CASE STUDIES
5.2 REGULATORY FRAMEWORK
5.3 TECHNOLOGICAL TRENDS
5.4 PRICING ANALYSIS
5.5 COMPANY COMPARATIVE ANALYSIS
6. GLOBAL GALLIUM NITRIDE (GAN) POWERED CHARGERS MARKET, BY POWER OUTPUT
6.1 OVERVIEW
6.2 BELOW 30W
6.3 31-65W
6.4 66-100W
6.5 ABOVE 100W
7. GLOBAL GALLIUM NITRIDE (GAN) POWERED CHARGERS MARKET, BY OUTPUT PORT
7.1 OVERVIEW
7.2 USB-A
7.3 USB-C
8. GLOBAL GALLIUM NITRIDE (GAN) POWERED CHARGERS MARKET, BY CHARGING PROTOCOLS
8.1 OVERVIEW
8.2 QUALCOMM QUICK CHARGE
8.2.1 QC 3.0
8.2.2 QC 4.0
8.3 PD FAST CHARGING
8.3.1 USB PD 2.0
8.3.2 USB PD 3.0
8.3.3 USB PD 3.0 (PPS)
8.4 VOOC TECHNOLOGY
8.5 HUAWEI SUPERCHARGE
8.6 OTHERS
9. GLOBAL GALLIUM NITRIDE (GAN) POWERED CHARGERS MARKET, BY NUMBER OF PORTS
9.1 OVERVIEW
9.2 SINGLE PORT
9.3 MULTI-PORT
10. GLOBAL GALLIUM NITRIDE (GAN) POWERED CHARGERS MARKET, BY SALES CHANNEL
10.1 OVERVIEW
10.2 ONLINE
10.3 OFFLINE
11. GLOBAL GALLIUM NITRIDE (GAN) POWERED CHARGERS MARKET, BY APPLICATION
11.1 OVERVIEW
11.2 SMARTPHONE & TABLETS
11.2.1 BY POWER OUTPUT
11.2.1.1. BELOW 30W
11.2.1.2. 31-65W
11.2.1.3. 66-100W
11.2.1.4. ABOVE 100W
11.3 LAPTOPS & NOTEBOOKS
11.3.1 BY POWER OUTPUT
11.3.1.1. BELOW 30W
11.3.1.2. 31-65W
11.3.1.3. 66-100W
11.3.1.4. ABOVE 100W
11.4 ACCESSORIES
11.4.1 BY POWER OUTPUT
11.4.1.1. BELOW 30W
11.4.1.2. 31-65W
11.4.1.3. 66-100W
11.4.1.4. ABOVE 100W
11.5 IOT & SMART DEVICES
11.5.1 BY POWER OUTPUT
11.5.1.1. BELOW 30W
11.5.1.2. 31-65W
11.5.1.3. 66-100W
11.5.1.4. ABOVE 100W
11.6 EQUIPMENT AND TOOLS
11.6.1 BY POWER OUTPUT
11.6.1.1. BELOW 30W
11.6.1.2. 31-65W
11.6.1.3. 66-100W
11.6.1.4. ABOVE 100W
11.7 OTHERS
12. GLOBAL GALLIUM NITRIDE (GAN) POWERED CHARGERS MARKET, BY REGION
GLOBAL GALLIUM NITRIDE (GAN) POWERED CHARGERS MARKET, (ALL SEGMENTATION PROVIDED ABOVE IS REPRESENTED IN THIS CHAPTER BY COUNTRY)
12.1 NORTH AMERICA
12.1.1 U.S.
12.1.2 CANADA
12.1.3 MEXICO
12.2 EUROPE
12.2.1 GERMANY
12.2.2 FRANCE
12.2.3 U.K.
12.2.4 ITALY
12.2.5 SPAIN
12.2.6 RUSSIA
12.2.7 TURKEY
12.2.8 BELGIUM
12.2.9 NETHERLANDS
12.2.10 NORWAY
12.2.11 FINLAND
12.2.12 SWITZERLAND
12.2.13 DENMARK
12.2.14 SWEDEN
12.2.15 POLAND
12.2.16 REST OF EUROPE
12.3 ASIA PACIFIC
12.3.1 JAPAN
12.3.2 CHINA
12.3.3 SOUTH KOREA
12.3.4 INDIA
12.3.5 AUSTRALIA & NEW ZEALAND
12.3.6 SINGAPORE
12.3.7 THAILAND
12.3.8 MALAYSIA
12.3.9 INDONESIA
12.3.10 PHILIPPINES
12.3.11 TAIWAN
12.3.12 VIETNAM
12.3.13 REST OF ASIA PACIFIC
12.4 SOUTH AMERICA
12.4.1 BRAZIL
12.4.2 ARGENTINA
12.4.3 REST OF SOUTH AMERICA
12.5 MIDDLE EAST AND AFRICA
12.5.1 SOUTH AFRICA
12.5.2 EGYPT
12.5.3 SAUDI ARABIA
12.5.4 U.A.E
12.5.5 ISRAEL
12.5.6 OMAN
12.5.7 BAHRAIN
12.5.8 KUWAIT
12.5.9 QATAR
12.5.10 REST OF MIDDLE EAST AND AFRICA
13. GLOBAL GALLIUM NITRIDE (GAN) POWERED CHARGERS MARKET,COMPANY LANDSCAPE
13.1 COMPANY SHARE ANALYSIS: GLOBAL
13.2 COMPANY SHARE ANALYSIS: NORTH AMERICA
13.3 COMPANY SHARE ANALYSIS: EUROPE
13.4 COMPANY SHARE ANALYSIS: ASIA-PACIFIC
13.5 MERGERS & ACQUISITIONS
13.6 NEW PRODUCT DEVELOPMENT AND APPROVALS
13.7 EXPANSIONS
13.8 REGULATORY CHANGES
13.9 PARTNERSHIP AND OTHER STRATEGIC DEVELOPMENTS
14. GLOBAL GALLIUM NITRIDE (GAN) POWERED CHARGERS MARKET, SWOT AND DBMR ANALYSIS
15. GLOBAL GALLIUM NITRIDE (GAN) POWERED CHARGERS MARKET, COMPANY PROFILE
15.1 TOPBAND GROUP
15.1.1 COMPANY SNAPSHOT
15.1.2 REVENUE ANALYSIS
15.1.3 GEOGRAPHIC PRESENCE
15.1.4 PRODUCT PORTFOLIO
15.1.5 RECENT DEVELOPMENTS
15.2 APPLE
15.2.1 COMPANY SNAPSHOT
15.2.2 REVENUE ANALYSIS
15.2.3 GEOGRAPHIC PRESENCE
15.2.4 PRODUCT PORTFOLIO
15.2.5 RECENT DEVELOPMENTS
15.3 AMERICA UGREEN LIMITED
15.3.1 COMPANY SNAPSHOT
15.3.2 REVENUE ANALYSIS
15.3.3 GEOGRAPHIC PRESENCE
15.3.4 PRODUCT PORTFOLIO
15.3.5 RECENT DEVELOPMENTS
15.4 EATON
15.4.1 COMPANY SNAPSHOT
15.4.2 REVENUE ANALYSIS
15.4.3 GEOGRAPHIC PRESENCE
15.4.4 PRODUCT PORTFOLIO
15.4.5 RECENT DEVELOPMENTS
15.5 AVENIR TELECOM
15.5.1 COMPANY SNAPSHOT
15.5.2 REVENUE ANALYSIS
15.5.3 GEOGRAPHIC PRESENCE
15.5.4 PRODUCT PORTFOLIO
15.5.5 RECENT DEVELOPMENTS
15.6 SAMSUNG ELECTRONICS
15.6.1 COMPANY SNAPSHOT
15.6.2 REVENUE ANALYSIS
15.6.3 GEOGRAPHIC PRESENCE
15.6.4 PRODUCT PORTFOLIO
15.6.5 RECENT DEVELOPMENTS
15.7 ZAGG INC.
15.7.1 COMPANY SNAPSHOT
15.7.2 REVENUE ANALYSIS
15.7.3 GEOGRAPHIC PRESENCE
15.7.4 PRODUCT PORTFOLIO
15.7.5 RECENT DEVELOPMENTS
15.8 XIAOMI
15.8.1 COMPANY SNAPSHOT
15.8.2 REVENUE ANALYSIS
15.8.3 GEOGRAPHIC PRESENCE
15.8.4 PRODUCT PORTFOLIO
15.8.5 RECENT DEVELOPMENTS
15.9 KONINKLIJKE PHILIPS N.V.
15.9.1 COMPANY SNAPSHOT
15.9.2 REVENUE ANALYSIS
15.9.3 GEOGRAPHIC PRESENCE
15.9.4 PRODUCT PORTFOLIO
15.9.5 RECENT DEVELOPMENTS
15.10 BELKIN
15.10.1 COMPANY SNAPSHOT
15.10.2 REVENUE ANALYSIS
15.10.3 GEOGRAPHIC PRESENCE
15.10.4 PRODUCT PORTFOLIO
15.10.5 RECENT DEVELOPMENTS
15.11 BASEUS
15.11.1 COMPANY SNAPSHOT
15.11.2 REVENUE ANALYSIS
15.11.3 GEOGRAPHIC PRESENCE
15.11.4 PRODUCT PORTFOLIO
15.11.5 RECENT DEVELOPMENTS
15.12 RAVPOWER
15.12.1 COMPANY SNAPSHOT
15.12.2 REVENUE ANALYSIS
15.12.3 GEOGRAPHIC PRESENCE
15.12.4 PRODUCT PORTFOLIO
15.12.5 RECENT DEVELOPMENTS
15.13 ANKER INNOVATIONS TECHNOLOGY CO., LTD
15.13.1 COMPANY SNAPSHOT
15.13.2 REVENUE ANALYSIS
15.13.3 GEOGRAPHIC PRESENCE
15.13.4 PRODUCT PORTFOLIO
15.13.5 RECENT DEVELOPMENTS
15.14 AUKEY
15.14.1 COMPANY SNAPSHOT
15.14.2 REVENUE ANALYSIS
15.14.3 GEOGRAPHIC PRESENCE
15.14.4 PRODUCT PORTFOLIO
15.14.5 RECENT DEVELOPMENTS
15.15 SPIGEN, INC.
15.15.1 COMPANY SNAPSHOT
15.15.2 REVENUE ANALYSIS
15.15.3 GEOGRAPHIC PRESENCE
15.15.4 PRODUCT PORTFOLIO
15.15.5 RECENT DEVELOPMENTS
15.16 AGELESS DIGITAL TECHNOLOGIES PRIVATE LIMITED
15.16.1 COMPANY SNAPSHOT
15.16.2 REVENUE ANALYSIS
15.16.3 GEOGRAPHIC PRESENCE
15.16.4 PRODUCT PORTFOLIO
15.16.5 RECENT DEVELOPMENTS
15.17 HYPER
15.17.1 COMPANY SNAPSHOT
15.17.2 REVENUE ANALYSIS
15.17.3 GEOGRAPHIC PRESENCE
15.17.4 PRODUCT PORTFOLIO
15.17.5 RECENT DEVELOPMENTS
15.18 NOMAD GOODS, INC.
15.18.1 COMPANY SNAPSHOT
15.18.2 REVENUE ANALYSIS
15.18.3 GEOGRAPHIC PRESENCE
15.18.4 PRODUCT PORTFOLIO
15.18.5 RECENT DEVELOPMENTS
15.19 SATECHI
15.19.1 COMPANY SNAPSHOT
15.19.2 REVENUE ANALYSIS
15.19.3 GEOGRAPHIC PRESENCE
15.19.4 PRODUCT PORTFOLIO
15.19.5 RECENT DEVELOPMENTS
15.20 ZENDURE POWER BANK USA INC.
15.20.1 COMPANY SNAPSHOT
15.20.2 REVENUE ANALYSIS
15.20.3 GEOGRAPHIC PRESENCE
15.20.4 PRODUCT PORTFOLIO
15.20.5 RECENT DEVELOPMENTS
15.21 INVZI
15.21.1 COMPANY SNAPSHOT
15.21.2 REVENUE ANALYSIS
15.21.3 GEOGRAPHIC PRESENCE
15.21.4 PRODUCT PORTFOLIO
15.21.5 RECENT DEVELOPMENTS
15.22 ANGRY MIAO.
15.22.1 COMPANY SNAPSHOT
15.22.2 REVENUE ANALYSIS
15.22.3 GEOGRAPHIC PRESENCE
15.22.4 PRODUCT PORTFOLIO
15.22.5 RECENT DEVELOPMENTS
15.23 ARTMU KOREA CO., LTD.
15.23.1 COMPANY SNAPSHOT
15.23.2 REVENUE ANALYSIS
15.23.3 GEOGRAPHIC PRESENCE
15.23.4 PRODUCT PORTFOLIO
15.23.5 RECENT DEVELOPMENTS
15.24 ASUSTEK COMPUTER INC.
15.24.1 COMPANY SNAPSHOT
15.24.2 REVENUE ANALYSIS
15.24.3 GEOGRAPHIC PRESENCE
15.24.4 PRODUCT PORTFOLIO
15.24.5 RECENT DEVELOPMENTS
15.25 DELL INC.
15.25.1 COMPANY SNAPSHOT
15.25.2 REVENUE ANALYSIS
15.25.3 GEOGRAPHIC PRESENCE
15.25.4 PRODUCT PORTFOLIO
15.25.5 RECENT DEVELOPMENTS
NOTE: THE COMPANIES PROFILED IS NOT EXHAUSTIVE LIST AND IS AS PER OUR PREVIOUS CLIENT REQUIREMENT. WE PROFILE MORE THAN 100 COMPANIES IN OUR STUDIES AND HENCE THE LIST OF COMPANIES CAN BE MODIFIED OR REPLACED ON REQUEST.
16. CONCLUSION
17. QUESTIONNAIRE
18. RELATED REPORTS
19. ABOUT DATA BRIDGE MARKET RESEARCH
Metodologia de Investigação
A recolha de dados e a análise do ano base são feitas através de módulos de recolha de dados com amostras grandes. A etapa inclui a obtenção de informações de mercado ou dados relacionados através de diversas fontes e estratégias. Inclui examinar e planear antecipadamente todos os dados adquiridos no passado. Da mesma forma, envolve o exame de inconsistências de informação observadas em diferentes fontes de informação. Os dados de mercado são analisados e estimados utilizando modelos estatísticos e coerentes de mercado. Além disso, a análise da quota de mercado e a análise das principais tendências são os principais fatores de sucesso no relatório de mercado. Para saber mais, solicite uma chamada de analista ou abra a sua consulta.
A principal metodologia de investigação utilizada pela equipa de investigação do DBMR é a triangulação de dados que envolve a mineração de dados, a análise do impacto das variáveis de dados no mercado e a validação primária (especialista do setor). Os modelos de dados incluem grelha de posicionamento de fornecedores, análise da linha de tempo do mercado, visão geral e guia de mercado, grelha de posicionamento da empresa, análise de patentes, análise de preços, análise da quota de mercado da empresa, normas de medição, análise global versus regional e de participação dos fornecedores. Para saber mais sobre a metodologia de investigação, faça uma consulta para falar com os nossos especialistas do setor.
Personalização disponível
A Data Bridge Market Research é líder em investigação formativa avançada. Orgulhamo-nos de servir os nossos clientes novos e existentes com dados e análises que correspondem e atendem aos seus objetivos. O relatório pode ser personalizado para incluir análise de tendências de preços de marcas-alvo, compreensão do mercado para países adicionais (solicite a lista de países), dados de resultados de ensaios clínicos, revisão de literatura, mercado remodelado e análise de base de produtos . A análise de mercado dos concorrentes-alvo pode ser analisada desde análises baseadas em tecnologia até estratégias de carteira de mercado. Podemos adicionar quantos concorrentes necessitar de dados no formato e estilo de dados que procura. A nossa equipa de analistas também pode fornecer dados em tabelas dinâmicas de ficheiros Excel em bruto (livro de factos) ou pode ajudá-lo a criar apresentações a partir dos conjuntos de dados disponíveis no relatório.

