
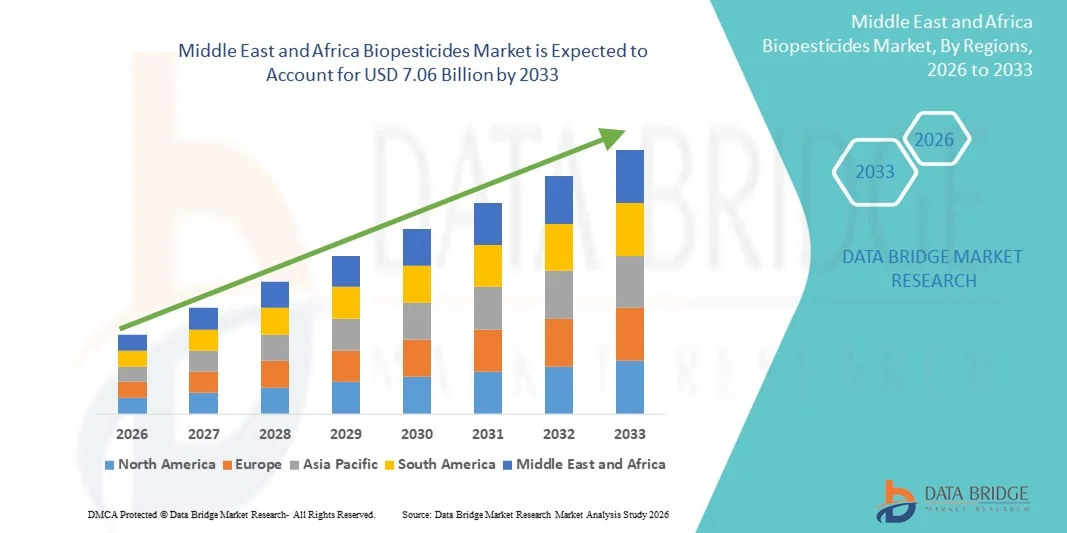
Middle East And Africa Biopesticides Market
Tamanho do mercado em biliões de dólares
CAGR :
% 
 USD
2.11 Billion
USD
7.06 Billion
2025
2033
USD
2.11 Billion
USD
7.06 Billion
2025
2033
| 2026 –2033 | |
| USD 2.11 Billion | |
| USD 7.06 Billion | |
| % | |
|
Segmentação do mercado de biopesticidas no Oriente Médio e África, por tipo (bioinseticidas, biofungicidas, bionematicidas, bioherbicidas e outros), fonte (microbiana, bioquímica e insetos), forma (seca e líquida), aplicação (aplicação foliar, fertirrigação, tratamento do solo, tratamento de sementes e outras), categoria (agricultura e horticultura), culturas (frutas e hortaliças, cereais e grãos, oleaginosas e leguminosas, gramados e plantas ornamentais e outras culturas) - Tendências e previsões do setor até 2033.
Tamanho do mercado de biopesticidas no Oriente Médio e na África
- O mercado de biopesticidas foi avaliado em US$ 2,11 bilhões em 2025 e deverá atingir US$ 7,06 bilhões em 2033 , com uma taxa de crescimento anual composta (CAGR) de 16,30% durante o período de previsão.
- O crescimento do mercado é impulsionado principalmente pela crescente demanda global por alimentos orgânicos, pelas maiores preocupações ambientais e pelo apoio governamental às práticas de agricultura sustentável.
- A crescente conscientização dos agricultores sobre os efeitos adversos dos pesticidas químicos e a tendência cada vez maior do manejo integrado de pragas (MIP) estão acelerando ainda mais a adoção de biopesticidas.
Análise do Mercado de Biopesticidas no Oriente Médio e na África
- O mercado de biopesticidas está experimentando um crescimento robusto, impulsionado pela crescente adoção de práticas agrícolas sustentáveis e pela demanda por soluções ecológicas para a proteção de cultivos.
- Os biopesticidas, derivados de materiais naturais como animais, plantas, bactérias e certos minerais, estão ganhando destaque devido aos seus níveis de toxicidade mais baixos, menor impacto ambiental e ação direcionada.
- O Egito dominou o mercado de biopesticidas em 2025, devido à alta adoção de bioinseticidas e biofungicidas no cultivo de frutas e hortaliças. Os agricultores estão cada vez mais dependendo de soluções de manejo de pragas ecologicamente corretas para atender aos padrões de exportação relativos a resíduos químicos e garantir a segurança das colheitas.
- A África do Sul deverá apresentar a maior taxa de crescimento anual composta (CAGR) no mercado de biopesticidas do Oriente Médio e da África, devido à crescente conscientização sobre práticas agrícolas ecologicamente corretas, à expansão do cultivo de hortaliças e culturas de alto valor agregado e aos investimentos em soluções biológicas para proteção de cultivos. O aumento do apoio regulatório à agricultura sustentável e a crescente preferência por produtos orgânicos são fatores-chave que impulsionam a adoção do mercado.
- O segmento de bioinseticidas representou a maior fatia da receita de mercado em 2025, com 37,4%, impulsionado principalmente por sua ação direcionada contra espécies de pragas e impacto mínimo em organismos não-alvo. A crescente resistência das pragas aos produtos químicos convencionais levou os agricultores a adotarem bioinseticidas como uma alternativa sustentável. Além disso, o apoio regulatório a soluções de proteção de cultivos ecologicamente corretas e a crescente demanda por produtos orgânicos impulsionam ainda mais o domínio desse segmento.
Escopo do relatório e segmentação do mercado de biopesticidas no Oriente Médio e na África
|
Atributos |
Principais informações sobre o mercado de biopesticidas no Oriente Médio e na África |
|
Segmentos abrangidos |
|
|
Países abrangidos |
Oriente Médio e África
|
|
Principais participantes do mercado |
• Olivine Biopesticides (África do Sul) |
|
Oportunidades de mercado |
|
|
Conjuntos de informações de dados de valor agregado |
Além das informações sobre cenários de mercado, como valor de mercado, taxa de crescimento, segmentação, cobertura geográfica e principais participantes, os relatórios de mercado elaborados pela Data Bridge Market Research também incluem análise de importação e exportação, visão geral da capacidade de produção, análise de produção e consumo, análise de tendências de preços, cenário de mudanças climáticas, análise da cadeia de suprimentos, análise da cadeia de valor, visão geral de matérias-primas/insumos, critérios de seleção de fornecedores, análise PESTLE, análise de Porter e estrutura regulatória. |
Tendências do mercado de biopesticidas no Oriente Médio e na África
Adoção crescente de soluções ecológicas para proteção de cultivos
- O crescente foco na agricultura sustentável e ambientalmente segura está moldando significativamente o mercado de biopesticidas, à medida que os agricultores preferem cada vez mais produtos que minimizem os resíduos químicos e preservem a saúde do solo. Os biopesticidas estão ganhando espaço devido à sua capacidade de combater pragas e patógenos sem prejudicar os organismos benéficos, fortalecendo sua adoção no cultivo de cereais, frutas, hortaliças e culturas de alto valor agregado. Essa tendência incentiva os fabricantes a inovar com novas formulações que atendam às práticas agrícolas em constante evolução.
- A crescente conscientização sobre a saúde do solo, a qualidade da produção agrícola e as práticas agrícolas ecologicamente corretas acelerou a demanda por biopesticidas em lavouras, horticultura e cultivo em estufas. Agricultores e agroindústrias ambientalmente conscientes buscam ativamente produtos derivados de fontes naturais, o que leva as marcas a priorizarem o fornecimento e os processos de produção sustentáveis. Isso também resultou em colaborações entre fornecedores de ingredientes e fabricantes de agroquímicos para aprimorar a eficácia do controle de pragas e a segurança das culturas.
- As tendências de sustentabilidade e conformidade regulatória estão influenciando as decisões de compra, com os fabricantes enfatizando soluções de biopesticidas rastreáveis, ecológicas e certificadas. Esses fatores estão ajudando as marcas a diferenciar seus produtos em um mercado competitivo e a construir confiança entre os agricultores, além de impulsionar a adoção da certificação orgânica e da rotulagem ambientalmente segura. As empresas estão utilizando cada vez mais campanhas educativas para destacar esses benefícios e incentivar a adoção.
- Por exemplo, em 2024, os principais fabricantes de biopesticidas expandiram seus portfólios de produtos com o lançamento de novas formulações microbianas, bioquímicas e bionematicidas. Esses lançamentos foram uma resposta à crescente demanda por soluções de manejo de pragas ecológicas e eficazes, com distribuição em cooperativas agrícolas, varejo e canais online. Os produtos foram comercializados como seguros para o solo, as plantações e os insetos benéficos, aumentando a confiança dos agricultores e incentivando a recompra.
- Embora a demanda por biopesticidas esteja crescendo, a expansão sustentada do mercado depende de pesquisa e desenvolvimento contínuos, produção com boa relação custo-benefício e manutenção de desempenho funcional comparável ao dos pesticidas químicos. Os fabricantes também estão se concentrando em melhorar a escalabilidade, a confiabilidade da cadeia de suprimentos e desenvolver soluções inovadoras que equilibrem custo, eficácia e sustentabilidade para uma adoção mais ampla.
Dinâmica do mercado de biopesticidas no Oriente Médio e na África
Motorista
Crescente preferência por soluções sustentáveis e ecológicas para a proteção de cultivos.
- A crescente preferência dos agricultores por soluções naturais e ambientalmente seguras para o controle de pragas é um dos principais impulsionadores do mercado de biopesticidas. Os fabricantes estão substituindo cada vez mais os pesticidas químicos por alternativas microbianas, bioquímicas e botânicas para atender aos requisitos de sustentabilidade, melhorar a segurança das culturas e cumprir as normas regulamentares. Essa tendência também está impulsionando a pesquisa de novas fontes naturais para a produção de biopesticidas, apoiando a diversificação de produtos.
- A crescente aplicação em cereais, grãos, frutas, hortaliças, leguminosas, gramados e plantas ornamentais está influenciando o crescimento do mercado. Os biopesticidas ajudam a aumentar a produtividade, a qualidade e a vida útil das culturas, mantendo práticas ecologicamente corretas, permitindo que os agricultores atendam às expectativas de sustentabilidade. A crescente adoção de práticas de manejo integrado de pragas (MIP) em todo o mundo reforça ainda mais essa tendência.
- Os fabricantes de agroquímicos e sementes estão promovendo ativamente formulações à base de biopesticidas por meio da inovação de produtos, campanhas de marketing e certificações. Esses esforços são apoiados pela crescente preferência dos agricultores por soluções de proteção de cultivos sustentáveis, seguras e de alta qualidade, e também incentivam parcerias entre fornecedores e agroindústrias para melhorar o desempenho dos produtos e reduzir o impacto ambiental.
- Por exemplo, em 2023, as principais empresas agroquímicas relataram um aumento na incorporação de biopesticidas microbianos e bioquímicos em soluções de proteção de cultivos. Essa expansão acompanhou a crescente demanda por produtos de controle de pragas não tóxicos, ecológicos e eficazes, impulsionando o uso recorrente e a diferenciação no mercado. As empresas também destacaram a sustentabilidade e a rastreabilidade em campanhas promocionais para fortalecer a confiança e a fidelidade dos agricultores.
- Embora as tendências crescentes de sustentabilidade impulsionem o crescimento, uma adoção mais ampla depende da otimização de custos, da disponibilidade de ingredientes e de processos de produção escaláveis. O investimento em eficiência da cadeia de suprimentos, fornecimento sustentável e tecnologia de formulação avançada será crucial para atender à demanda global e manter a vantagem competitiva.
Restrição/Desafio
Custo mais elevado e conhecimento limitado em comparação com os pesticidas convencionais.
- O custo relativamente mais elevado dos biopesticidas em comparação com os pesticidas químicos convencionais continua sendo um desafio crucial, limitando sua adoção entre os agricultores sensíveis a preços. Custos mais altos de matéria-prima, produção complexa e métodos de formulação elaborados contribuem para a elevação dos preços. Além disso, a disponibilidade variável de ingredientes microbianos ou botânicos certificados pode afetar a estabilidade de custos e a penetração no mercado.
- O conhecimento e a compreensão dos agricultores ainda são desiguais, principalmente em regiões onde predominam os pesticidas convencionais. O conhecimento limitado sobre os benefícios funcionais restringe a adoção em certos tipos de culturas. Isso também leva a uma adoção mais lenta em áreas onde a educação agrícola sobre biopesticidas é mínima.
- Os desafios na cadeia de suprimentos e distribuição também impactam o crescimento do mercado, uma vez que os biopesticidas exigem o fornecimento de produtores certificados e a adesão a rigorosos padrões de qualidade. Complexidades logísticas e menor prazo de validade de alguns produtos microbianos ou bioquímicos aumentam os custos operacionais. As empresas devem investir em redes adequadas de armazenamento, manuseio e transporte para manter a integridade do produto.
- Por exemplo, em 2024, os distribuidores de bioinseticidas e biofungicidas relataram uma menor adesão devido aos preços mais altos e ao conhecimento limitado sobre a eficácia em comparação com as alternativas químicas. Os requisitos de armazenamento e a conformidade com as certificações orgânicas ou ecológicas foram barreiras adicionais. Alguns varejistas também limitaram o espaço nas prateleiras para produtos biopesticidas premium, afetando a visibilidade e as vendas.
- Superar esses desafios exigirá produção com boa relação custo-benefício, redes de distribuição ampliadas e iniciativas educacionais focadas em agricultores e agronegócios. A colaboração com cooperativas agrícolas, organismos de certificação e fornecedores de tecnologia pode ajudar a desbloquear o potencial de crescimento a longo prazo do mercado global de biopesticidas. Além disso, o desenvolvimento de formulações altamente eficazes e com preços competitivos, bem como o fortalecimento das estratégias de marketing em torno dos benefícios de sustentabilidade, serão essenciais para a adoção em larga escala.
Escopo do mercado de biopesticidas no Oriente Médio e na África
O mercado é segmentado com base no tipo, fonte, forma, aplicação, categoria e culturas.
- Por tipo
Com base no tipo, o mercado de biopesticidas no Oriente Médio e na África é segmentado em bioinseticidas, biofungicidas, bionematicidas, bioherbicidas e outros. O segmento de bioinseticidas representou a maior participação na receita de mercado, com 37,4% em 2025, impulsionado principalmente por sua ação direcionada contra espécies de pragas e impacto mínimo em organismos não-alvo. A crescente resistência das pragas aos produtos químicos convencionais levou os agricultores a adotarem bioinseticidas como uma alternativa sustentável. Além disso, o apoio regulatório a soluções de proteção de cultivos ecologicamente corretas e a crescente demanda por produtos orgânicos impulsionam ainda mais o domínio desse segmento.
O segmento de bionematicidas deverá apresentar o crescimento mais rápido entre 2026 e 2033, devido às crescentes preocupações com a saúde do solo e os efeitos adversos dos nematicidas sintéticos. Os bionematicidas oferecem uma alternativa mais segura para a proteção das raízes e estão ganhando popularidade em programas de manejo integrado de pragas (MIP), especialmente em regiões com cultivo intensivo de hortaliças e frutas. A crescente conscientização dos agricultores sobre práticas agrícolas sustentáveis e a manutenção da fertilidade do solo impulsiona ainda mais esse segmento. Além disso, espera-se que iniciativas governamentais de apoio, que promovem alternativas ecologicamente corretas na agricultura, aumentem a penetração de mercado dos bionematicidas.
- Por Fonte
Com base na fonte, o mercado de biopesticidas no Oriente Médio e na África é segmentado em microbianos, bioquímicos e inseticidas. O segmento microbiano dominou o mercado em 2025, devido à ampla disponibilidade de cepas microbianas como Bacillus thuringiensis e Trichoderma. Esses microrganismos são amplamente utilizados em diversos tipos de culturas devido à sua eficácia comprovada, facilidade de formulação e compatibilidade com outros insumos agrícolas. Além disso, pesquisas em andamento estão levando à descoberta de novas cepas microbianas que atuam contra pragas e patógenos específicos, aumentando a eficiência dos produtos. O segmento também se beneficia de fortes redes de distribuição e da crescente conscientização dos agricultores sobre soluções de proteção de cultivos ecologicamente corretas.
O segmento bioquímico deverá apresentar o crescimento mais rápido entre 2026 e 2033, impulsionado pelo aumento do uso de extratos vegetais e feromônios que oferecem mecanismos únicos de controle de pragas sem prejudicar insetos benéficos ou polinizadores. Inovações em técnicas de extração e estabilização estão possibilitando maior potência e eficácia mais duradoura dos produtos bioquímicos. A crescente tendência da agricultura de precisão e das estratégias de manejo integrado de pragas (MIP) também está impulsionando a adoção de biopesticidas bioquímicos. Além disso, os órgãos reguladores estão concedendo aprovações favoráveis para soluções bioquímicas, fortalecendo seu potencial de mercado.
- Por formulário
Com base na forma, o mercado de biopesticidas no Oriente Médio e na África é segmentado em seco e líquido. O segmento de forma líquida detinha a maior participação em 2025, favorecido pela facilidade de aplicação por meio de diversos sistemas de distribuição, como pulverização foliar, fertirrigação e irrigação do solo. As formulações líquidas também oferecem absorção mais rápida e melhor eficácia no controle de pragas em diversas condições ambientais. O segmento é ainda impulsionado pelos avanços nas tecnologias de pulverização e nos sistemas de irrigação automatizados, que aumentam a precisão e minimizam o desperdício de produto. A crescente preferência dos agricultores por formulações prontas para uso e produtos de alta solubilidade também está impulsionando a adoção de biopesticidas líquidos.
Espera-se que o segmento de biopesticidas secos apresente o crescimento mais rápido entre 2026 e 2033, devido às suas vantagens em termos de estabilidade de armazenamento, menor custo de transporte e adequação para aplicações no tratamento de sementes, especialmente em grãos e leguminosas. As formulações secas também são mais fáceis de armazenar e manusear, reduzindo os desafios logísticos em regiões agrícolas remotas. A crescente adoção de métodos de revestimento e aplicação em grânulos está aprimorando a eficácia dos biopesticidas secos. Além disso, startups agrícolas e empresas de sementes estão incorporando cada vez mais biopesticidas secos em soluções integradas de proteção de cultivos.
- Por meio de aplicação
Com base na aplicação, o mercado de biopesticidas no Oriente Médio e na África é segmentado em aplicação foliar, fertirrigação, tratamento do solo, tratamento de sementes e outros. O segmento de aplicação foliar dominou o mercado com a maior participação em 2025, devido à sua eficácia no controle imediato de pragas e à mínima persistência ambiental. Esse método é comumente adotado no cultivo de frutas e hortaliças, onde os danos visíveis causados por pragas afetam diretamente o valor da safra. O segmento se beneficia do desenvolvimento de equipamentos de pulverização de alta precisão e drones automatizados que melhoram a cobertura e a eficácia. Além disso, pesquisas sobre a compatibilidade das formulações garantem que os produtos foliares não danifiquem as culturas nem afetem o crescimento.
O segmento de tratamento de sementes deverá apresentar o crescimento mais rápido entre 2026 e 2033, impulsionado pela maior conscientização sobre a proteção de cultivos em estágios iniciais, a relação custo-benefício e a compatibilidade com práticas agrícolas sustentáveis. O tratamento de sementes também oferece proteção a longo prazo contra patógenos e pragas do solo, reduzindo a necessidade de aplicações químicas repetidas. A crescente adoção de sementes híbridas e geneticamente modificadas incentiva ainda mais a integração com biopesticidas. O segmento é sustentado por parcerias entre empresas de sementes e fabricantes de biopesticidas para fornecer sementes pré-tratadas aos agricultores.
- Por categoria
Com base na categoria, o mercado de biopesticidas no Oriente Médio e na África é segmentado em agricultura e horticultura. O segmento agrícola representou a maior participação de mercado em 2025, impulsionado pela crescente adoção de biopesticidas em culturas agrícolas como cereais, grãos e leguminosas. Os agricultores estão cada vez mais dependendo de biopesticidas para atender aos padrões regulatórios e reduzir os níveis de resíduos químicos. Além disso, grandes operações agrícolas estão investindo em soluções de biopesticidas para melhorar suas credenciais de sustentabilidade e cumprir os requisitos de exportação. Serviços de extensão rural e programas de apoio governamental também estão promovendo o uso de biopesticidas na agricultura convencional.
Espera-se que o segmento de horticultura apresente o crescimento mais rápido entre 2026 e 2033, principalmente no cultivo em estufa e em culturas de alto valor agregado, como frutas vermelhas e hortaliças folhosas, onde a qualidade e a segurança do produto são cruciais. Técnicas de aplicação de precisão e agricultura em ambiente controlado estão impulsionando o uso eficiente de biopesticidas na horticultura. A crescente demanda do consumidor por frutas e verduras orgânicas e livres de agrotóxicos está impulsionando ainda mais a adoção nesse segmento. A colaboração com fornecedores de tecnologia hortícola também está possibilitando soluções personalizadas em biopesticidas.
- Por colheitas
Com base nas culturas, o mercado de biopesticidas no Oriente Médio e na África é segmentado em frutas e vegetais, cereais e grãos, oleaginosas e leguminosas, gramados e plantas ornamentais, e outras culturas. O segmento de frutas e vegetais dominou o mercado em 2025, devido às rigorosas regulamentações de exportação relativas a resíduos químicos e à crescente demanda por produtos orgânicos. Além disso, culturas de alto valor agregado com padrões de qualidade exigentes se beneficiam significativamente dos biopesticidas, o que impulsiona sua preferência em relação às alternativas químicas. Campanhas de conscientização e incentivos governamentais para a agricultura orgânica também contribuem para o crescimento do mercado nessa categoria de culturas.
O segmento de gramados e plantas ornamentais deverá apresentar o crescimento mais rápido entre 2026 e 2033, principalmente em regiões desenvolvidas, onde a saúde estética das plantas e as práticas de paisagismo ecologicamente conscientes estão ganhando força. Os biopesticidas nesse segmento ajudam a controlar pragas, mantendo o apelo visual e a segurança ambiental. A crescente adoção em campos de golfe, parques e projetos de paisagismo urbano impulsiona esse crescimento. Os avanços tecnológicos em equipamentos de aplicação e na estabilidade das formulações aumentam ainda mais a penetração no mercado de gramados e plantas ornamentais.
Análise Regional do Mercado de Biopesticidas no Oriente Médio e África
- O Egito dominou o mercado de biopesticidas em 2025, devido à alta adoção de bioinseticidas e biofungicidas no cultivo de frutas e hortaliças. Os agricultores estão cada vez mais dependendo de soluções de manejo de pragas ecologicamente corretas para atender aos padrões de exportação relativos a resíduos químicos e garantir a segurança das colheitas.
- O apoio governamental, aliado à crescente conscientização sobre a saúde do solo e a agricultura sustentável, está incentivando o uso de biopesticidas em culturas agrícolas e hortícolas de alto valor agregado.
- O mercado também é sustentado por fortes redes de distribuição e colaborações entre fabricantes e empresas do agronegócio.
Análise do Mercado de Biopesticidas na África do Sul
O mercado de biopesticidas da África do Sul deverá apresentar o crescimento mais rápido entre 2025 e 2033, impulsionado pela expansão da agricultura voltada para a exportação, pela crescente adoção de soluções microbianas e bioquímicas para o controle de pragas e por iniciativas governamentais de apoio que promovem práticas agrícolas sustentáveis. A crescente conscientização dos agricultores sobre a redução de resíduos químicos e a melhoria da qualidade das colheitas está acelerando ainda mais a adoção do mercado. Além disso, o aumento dos investimentos em P&D e as colaborações entre distribuidores locais e fabricantes globais de biopesticidas estão contribuindo para a rápida expansão do mercado.
Participação de mercado de biopesticidas no Oriente Médio e na África
A indústria de biopesticidas no Oriente Médio e na África é liderada principalmente por empresas consolidadas, incluindo:
• Olivine Biopesticides (África do Sul)
• Rainbow Biotech (África do Sul)
• Inqaba Biotec (África do Sul)
• EPAX Holdings Ltd (África do Sul)
• BioGreen (África do Sul)
• Green Biotech Solutions (Egito)
• AgriLife (Egito)
• East African Bioproducts (Quênia)
• Biotab (Quênia)
• BioWorld (Arábia Saudita)
• Jordan Bio Industries Center (Jordânia)
• Biocare Egypt (Egito)
• BioArabia (Emirados Árabes Unidos)
• TechnoPhage Africa (África do Sul)
Últimos desenvolvimentos no mercado de biopesticidas no Oriente Médio e na África
- Em dezembro de 2024, a Silal e a Bayer assinaram um memorando de entendimento (MoU) na Cúpula Mundial de Inovação em Agrotecnologia para expandir sua parceria em agricultura sustentável no deserto. A colaboração concentra-se na implementação de soluções de agricultura digital e na realização de testes de sementes de hortaliças adequadas às condições do Oriente Médio e da África. Espera-se que essa iniciativa impulsione a adoção de biopesticidas na região, apoiando práticas de proteção de cultivos ecologicamente corretas e aumentando a produtividade agrícola.
- Em agosto de 2024, a IPL Biologicals anunciou uma parceria com a Azufrera y Fertilizantes Pallarés, SAU (AFEPASA), sediada na Espanha, para o registro conjunto global de biopesticidas microbianos, visando a entrada no mercado do Oriente Médio e da África. Apoiada por um investimento planejado de US$ 48 milhões em uma nova unidade em Gujarat, a parceria busca expandir as exportações regionais e melhorar o acesso a soluções eficazes de proteção biológica de cultivos, impulsionando o mercado de biopesticidas na região como um todo.
- Em maio de 2024, o Grupo Andermatt e a Novonesis lançaram inoculantes para soja nos mercados africanos, com o objetivo de aumentar a fixação de nitrogênio e melhorar a saúde do solo em sistemas de cultivo de leguminosas. Esse desenvolvimento fortalece o mercado de biopesticidas no Oriente Médio e na África, promovendo práticas agrícolas sustentáveis, aumentando a produtividade das culturas e oferecendo alternativas ecológicas aos fertilizantes químicos.
SKU-
Obtenha acesso online ao relatório sobre a primeira nuvem de inteligência de mercado do mundo

- Painel interativo de análise de dados
- Painel de análise da empresa para oportunidades de elevado potencial de crescimento
- Acesso de analista de pesquisa para personalização e customização. consultas
- Análise da concorrência com painel interativo
- Últimas notícias, atualizações e atualizações Análise de tendências
- Aproveite o poder da análise de benchmark para um rastreio abrangente da concorrência
Metodologia de Investigação
A recolha de dados e a análise do ano base são feitas através de módulos de recolha de dados com amostras grandes. A etapa inclui a obtenção de informações de mercado ou dados relacionados através de diversas fontes e estratégias. Inclui examinar e planear antecipadamente todos os dados adquiridos no passado. Da mesma forma, envolve o exame de inconsistências de informação observadas em diferentes fontes de informação. Os dados de mercado são analisados e estimados utilizando modelos estatísticos e coerentes de mercado. Além disso, a análise da quota de mercado e a análise das principais tendências são os principais fatores de sucesso no relatório de mercado. Para saber mais, solicite uma chamada de analista ou abra a sua consulta.
A principal metodologia de investigação utilizada pela equipa de investigação do DBMR é a triangulação de dados que envolve a mineração de dados, a análise do impacto das variáveis de dados no mercado e a validação primária (especialista do setor). Os modelos de dados incluem grelha de posicionamento de fornecedores, análise da linha de tempo do mercado, visão geral e guia de mercado, grelha de posicionamento da empresa, análise de patentes, análise de preços, análise da quota de mercado da empresa, normas de medição, análise global versus regional e de participação dos fornecedores. Para saber mais sobre a metodologia de investigação, faça uma consulta para falar com os nossos especialistas do setor.
Personalização disponível
A Data Bridge Market Research é líder em investigação formativa avançada. Orgulhamo-nos de servir os nossos clientes novos e existentes com dados e análises que correspondem e atendem aos seus objetivos. O relatório pode ser personalizado para incluir análise de tendências de preços de marcas-alvo, compreensão do mercado para países adicionais (solicite a lista de países), dados de resultados de ensaios clínicos, revisão de literatura, mercado remodelado e análise de base de produtos . A análise de mercado dos concorrentes-alvo pode ser analisada desde análises baseadas em tecnologia até estratégias de carteira de mercado. Podemos adicionar quantos concorrentes necessitar de dados no formato e estilo de dados que procura. A nossa equipa de analistas também pode fornecer dados em tabelas dinâmicas de ficheiros Excel em bruto (livro de factos) ou pode ajudá-lo a criar apresentações a partir dos conjuntos de dados disponíveis no relatório.

