
Global Virtual Infrastructure Manager Market
Tamanho do mercado em biliões de dólares
CAGR :
% 
 USD
3.40 Billion
USD
13.42 Billion
2023
2030
USD
3.40 Billion
USD
13.42 Billion
2023
2030
| 2024 –2030 | |
| USD 3.40 Billion | |
| USD 13.42 Billion | |
| % | |
|
Segmentação do mercado global de gerenciadores de infraestrutura virtual, por oferta (solução e serviços), desenvolvimento (IaaS e local), usuário final (TI e telecomunicações, BFSI, saúde, manufatura, varejo e outros) - Tendências do setor e previsão até 2032
Tamanho do mercado de gerenciadores de infraestrutura virtual
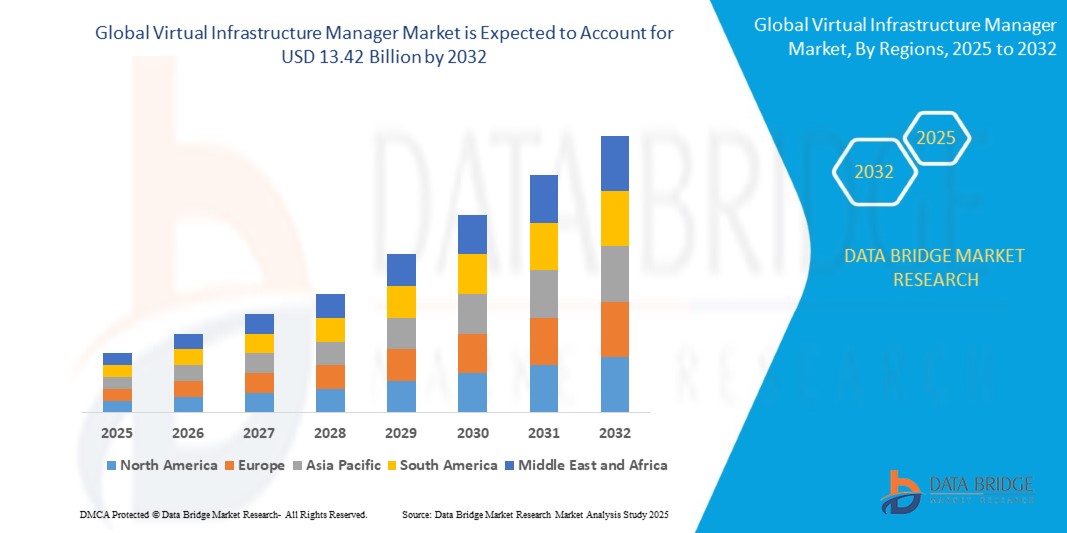
- O tamanho do mercado global de gerentes de infraestrutura virtual foi avaliado em US$ 3,40 bilhões em 2024 e deve atingir US$ 13,42 bilhões até 2032 , com um CAGR de 18,70% durante o período previsto.
- O crescimento do mercado é amplamente impulsionado pela crescente adoção de infraestrutura nativa da nuvem, pela crescente demanda por gerenciamento centralizado e automatizado de ambientes virtuais e pela crescente mudança em direção à virtualização de funções de rede (NFV) e data centers definidos por software (SDDC) em todas as empresas.
- A expansão das iniciativas de transformação digital e a ênfase crescente na otimização das cargas de trabalho de TI e na redução das despesas de capital (CapEx) estão acelerando ainda mais a adoção de gerentes de infraestrutura virtual em vários setores
Análise de Mercado do Gerenciador de Infraestrutura Virtual
- A demanda por gerentes de infraestrutura virtual está aumentando à medida que as organizações priorizam a agilidade de TI, a escalabilidade e a eficiência de custos no tratamento de ambientes híbridos e de múltiplas nuvens complexos.
- A crescente implantação de infraestrutura 5G e tecnologias de computação de ponta está aumentando a necessidade de orquestração dinâmica e em tempo real de recursos virtuais, onde os gerentes de infraestrutura virtual desempenham um papel crítico
- A América do Norte dominou o mercado de gerenciadores de infraestrutura virtual com a maior participação na receita de 37,82% em 2024, impulsionada pela alta adoção de serviços em nuvem, ampla transformação digital em todos os setores e presença de provedores de tecnologia importantes
- Espera-se que a região da Ásia-Pacífico testemunhe a maior taxa de crescimento no mercado global de gerenciadores de infraestrutura virtual, impulsionada pela crescente penetração da Internet, rápido crescimento dos setores de comércio eletrônico e telecomunicações e iniciativas governamentais de apoio à transformação digital e ao desenvolvimento de cidades inteligentes em países como China, Índia e Japão.
- O segmento de soluções dominou o mercado, com a maior participação na receita, de 61,4% em 2024, impulsionado pela crescente demanda por gerenciamento centralizado de infraestrutura e automação em ambientes virtuais e de nuvem. As organizações estão investindo fortemente em plataformas de gerenciamento escaláveis e inteligentes para oferecer suporte a arquiteturas de TI híbridas e complexas. A rápida adoção da virtualização em data centers impulsionou ainda mais a demanda por soluções robustas que ofereçam monitoramento, orquestração e otimização de desempenho em tempo real.
Escopo do Relatório e Segmentação de Mercado do Gerenciador de Infraestrutura Virtual
|
Atributos |
Principais insights de mercado do Virtual Infrastructure Manager |
|
Segmentos abrangidos |
|
|
Países abrangidos |
América do Norte
Europa
Ásia-Pacífico
Oriente Médio e África
Ámérica do Sul
|
|
Principais participantes do mercado |
|
|
Oportunidades de mercado |
|
|
Conjuntos de informações de dados de valor agregado |
Além dos insights sobre cenários de mercado, como valor de mercado, taxa de crescimento, segmentação, cobertura geográfica e principais participantes, os relatórios de mercado selecionados pela Data Bridge Market Research também incluem análises aprofundadas de especialistas, produção e capacidade de empresas representadas geograficamente, layouts de rede de distribuidores e parceiros, análises detalhadas e atualizadas de tendências de preços e análises de déficit da cadeia de suprimentos e demanda. |
Tendências de mercado do gerenciador de infraestrutura virtual
“Maior integração de inteligência artificial (IA) e aprendizado de máquina (ML) na gestão de infraestrutura”
- IA e ML estão sendo cada vez mais incorporados em plataformas de gerenciamento de infraestrutura virtual para automatizar tarefas rotineiras, gerenciar cargas de trabalho e reduzir a dependência humana em ambientes de grande escala. Essas tecnologias ajudam a otimizar processos complexos, melhorar os tempos de resposta e garantir a consistência na gestão de desempenho em grandes infraestruturas digitais.
- Essas tecnologias aumentam a confiabilidade do sistema por meio de análises em tempo real, diagnósticos automatizados e detecção de anomalias. Esses recursos ajudam as organizações a detectar e resolver problemas proativamente, reduzindo significativamente o tempo de inatividade da infraestrutura e melhorando a continuidade do serviço ao usuário final.
- O balanceamento de carga de trabalho baseado em IA permite a alocação dinâmica de recursos de computação, armazenamento e rede com base na demanda variável em todos os ecossistemas de nuvem. Isso garante eficiência de custos, evita a subutilização ou sobrecarga de recursos e melhora a capacidade de resposta do sistema para aplicativos críticos.
- A manutenção preditiva, impulsionada por algoritmos de ML, está ajudando as empresas a identificar gargalos de desempenho, degradação de hardware e tendências de falha antes que afetem as operações. Essa abordagem proativa melhora a estabilidade da infraestrutura, reduz reparos emergenciais e aprimora o planejamento de continuidade dos negócios a longo prazo.
- Por exemplo, a plataforma Turbonomic da IBM utiliza IA para analisar o desempenho de aplicações em tempo real e gerenciar automaticamente os recursos de infraestrutura. Ela ajuda as empresas a garantir que as aplicações sempre recebam a computação e a memória necessárias, sem intervenção manual ou provisionamento excessivo.
Dinâmica de mercado do gerenciador de infraestrutura virtual
Motorista
“Crescente demanda por virtualização de funções de rede (NFV) e aplicativos nativos da nuvem”
- A ascensão da NFV está permitindo que redes de telecomunicações e corporativas migrem de funções baseadas em hardware para soluções virtualizadas, proporcionando maior flexibilidade. Ao virtualizar serviços de rede, como roteamento, comutação e segurança, as organizações estão reduzindo custos operacionais e aprimorando a agilidade dos serviços.
- Aplicações nativas em nuvem, construídas em microsserviços e contêineres, exigem orquestração dinâmica e escalonamento entre plataformas de nuvem. Os gerentes de infraestrutura virtual desempenham um papel fundamental, automatizando o posicionamento de contêineres, gerenciando as demandas de armazenamento e equilibrando o consumo de recursos.
- A NFV permite a dissociação entre hardware e software, acelerando a implementação de serviços e simplificando as atualizações de rede sem reconfigurações físicas. Essa transformação está ajudando as operadoras de telecomunicações a responder mais rapidamente às demandas dos clientes, minimizando os gastos de capital com hardware legado.
- Os gerenciadores de infraestrutura virtual ajudam a reduzir a complexidade operacional em ambientes híbridos e multilocatários, automatizando o provisionamento e o monitoramento de recursos. Eles fornecem controle centralizado sobre as camadas de infraestrutura, melhorando a visibilidade e o gerenciamento de desempenho em sistemas distribuídos.
- Por exemplo, a Plataforma OpenStack da Red Hat habilita a infraestrutura NFV utilizando gerenciadores de infraestrutura virtual para alta disponibilidade e orquestração eficiente. Isso auxilia as operadoras de telecomunicações na entrega de serviços escaláveis e automatizados com melhor tempo de atividade e otimização de recursos.
Restrição/Desafio
“Complexidade na integração com infraestrutura legada”
- Muitos sistemas legados não possuem as APIs, o suporte de software ou a compatibilidade necessários para funcionar com os gerenciadores de infraestrutura virtual modernos. Isso resulta em cronogramas de integração prolongados, custos mais altos e riscos maiores durante a migração de ambientes tradicionais para ambientes baseados em nuvem.
- A transição de data centers centrados em hardware para uma infraestrutura definida por software exige um grande investimento em ferramentas e treinamento. A interrupção durante a migração pode impactar temporariamente operações comerciais críticas e reduzir a produtividade durante o período de adaptação.
- Um dos principais desafios é a escassez de profissionais qualificados tanto em tecnologias legadas quanto em plataformas de virtualização modernas. Essa lacuna de talentos aumenta a carga sobre os departamentos de TI e retarda a adoção bem-sucedida de ferramentas de gerenciamento de infraestrutura virtual.
- Sistemas legados frequentemente operam com protocolos, formatos de arquivo e configurações de segurança desatualizados. Integrá-los a sistemas de nuvem otimizados para IA pode expor vulnerabilidades, aumentar a complexidade e exigir esforços de integração personalizados.
- Por exemplo, hospitais que operam sistemas de EMR legados têm dificuldade em se alinhar às plataformas de infraestrutura modernas devido à incompatibilidade de dados e a problemas de conformidade. Essas limitações atrasam as atualizações digitais, dificultam a adoção da nuvem e retardam a inovação em ambientes de saúde de missão crítica.
Escopo de mercado do gerenciador de infraestrutura virtual
O mercado é segmentado com base na oferta, no desenvolvimento e no usuário final.
• Por Oferta
Com base na oferta, o mercado de gerenciadores de infraestrutura virtual é segmentado em soluções e serviços. O segmento de soluções dominou o mercado, com a maior participação na receita, de 61,4% em 2024, impulsionado pela crescente demanda por gerenciamento e automação centralizados de infraestrutura em ambientes virtuais e de nuvem. As organizações estão investindo fortemente em plataformas de gerenciamento escaláveis e inteligentes para suportar arquiteturas de TI híbridas e complexas. A rápida adoção da virtualização em data centers impulsionou ainda mais a demanda por soluções robustas que ofereçam monitoramento, orquestração e otimização de desempenho em tempo real.
Espera-se que o segmento de serviços apresente a maior taxa de crescimento entre 2025 e 2032, impulsionado pela crescente dependência de serviços gerenciados e integração de sistemas. À medida que as empresas navegam pela transformação digital, a necessidade de serviços de consultoria, implantação e suporte continua a aumentar, especialmente entre pequenas e médias empresas sem expertise interna em TI.
• Por Desenvolvimento
Com base no desenvolvimento, o mercado é segmentado em Infraestrutura como Serviço (IaaS) e on-premises. O segmento de IaaS deteve a maior fatia de receita de mercado em 2024, impulsionado pelo crescimento da computação em nuvem e pela crescente necessidade de soluções de infraestrutura escaláveis. O IaaS oferece flexibilidade, menor dependência de hardware e modelos de implantação econômicos, essenciais para empresas que operam em ecossistemas digitais dinâmicos.
Espera-se que o segmento local apresente a maior taxa de crescimento entre 2025 e 2032, impulsionado pela demanda de setores altamente regulamentados, como bancos e saúde. Esses setores preferem a implantação local para manter o controle sobre dados confidenciais e cumprir padrões rigorosos de governança, especialmente em regiões com leis rigorosas de residência de dados.
• Por usuário final
Com base no usuário final, o mercado é segmentado em TI e telecomunicações, bancos, serviços financeiros e seguros (BFSI), saúde, manufatura, varejo e outros. O segmento de TI e telecomunicações dominou o mercado em 2024, em grande parte devido ao aumento do investimento em tecnologias nativas da nuvem e virtualização para gerenciamento de funções de rede. A dependência desse setor em disponibilidade contínua e infraestrutura de alto desempenho acelerou a adoção de gerenciadores de infraestrutura virtual.
Espera-se que o segmento de saúde apresente a maior taxa de crescimento entre 2025 e 2032, impulsionado pela digitalização de prontuários de pacientes, pela expansão da telemedicina e pela necessidade de uma infraestrutura segura e ágil. Gerentes de infraestrutura virtual ajudam a otimizar as operações, garantir a conformidade com os regulamentos de privacidade de dados e oferecer suporte a soluções escaláveis para armazenamento e processamento de dados de saúde.
Análise regional do mercado de gerenciadores de infraestrutura virtual
- A América do Norte dominou o mercado de gerenciadores de infraestrutura virtual com a maior participação na receita de 37,82% em 2024, impulsionada pela alta adoção de serviços em nuvem, ampla transformação digital em todos os setores e presença de provedores de tecnologia importantes
- As empresas da região priorizam a escalabilidade da infraestrutura e as operações de TI contínuas, tornando os gerentes de infraestrutura virtual essenciais para melhorar a eficiência, reduzir os custos operacionais e aprimorar a segurança dos dados.
- O forte ecossistema tecnológico, combinado com a adoção antecipada de modelos de infraestrutura como serviço (IaaS), apoia o crescimento do mercado em setores como bancos, saúde e telecomunicações
Visão de mercado do gerente de infraestrutura virtual dos EUA
O mercado de gerenciadores de infraestrutura virtual dos EUA capturou a maior fatia de receita, de 79%, em 2024 na América do Norte, principalmente devido à rápida expansão de aplicativos nativos em nuvem e plataformas de virtualização. A crescente demanda por controle centralizado, automação e gerenciamento eficiente de recursos está impulsionando a implantação nos setores público e privado. Além disso, a crescente necessidade de infraestrutura em nuvem híbrida e modernização de data centers está levando as organizações a integrar gerenciadores de infraestrutura virtual avançados. Os principais provedores de serviços em nuvem sediados nos EUA também contribuem para a inovação e a disponibilidade de soluções no mercado.
Visão do mercado de gerentes de infraestrutura virtual da Europa
Espera-se que o mercado europeu de gerenciadores de infraestrutura virtual apresente a maior taxa de crescimento entre 2025 e 2032, impulsionado pelo aumento da digitalização empresarial e pelas rigorosas leis de proteção de dados. O Regulamento Geral sobre a Proteção de Dados (GDPR) aumentou a demanda por soluções de gerenciamento de infraestrutura seguras e em conformidade. Países como Alemanha, França e Holanda estão investindo em tecnologias avançadas de virtualização para otimizar a infraestrutura de TI. A região também se beneficia do forte apoio governamental à adoção da nuvem e a estratégias de TI sustentáveis.
Visão de mercado do gerente de infraestrutura virtual do Reino Unido
Espera-se que o mercado de gestores de infraestrutura virtual do Reino Unido apresente a maior taxa de crescimento entre 2025 e 2032, impulsionado por uma economia digital em expansão e pelo aumento do investimento em TI nos setores bancário e financeiro, varejo e saúde. A demanda por plataformas de infraestrutura virtual ágeis e escaláveis está sendo impulsionada pela necessidade de otimizar as operações e oferecer suporte a ambientes de trabalho remoto. A presença de provedores líderes de soluções em nuvem e um ecossistema vibrante de startups de tecnologia impulsionam ainda mais o crescimento do mercado no país.
Visão de mercado do gerente de infraestrutura virtual da Alemanha
Espera-se que o mercado de gerentes de infraestrutura virtual na Alemanha apresente a maior taxa de crescimento entre 2025 e 2032, devido ao seu setor industrial avançado e à robusta infraestrutura de TI. O compromisso do país com os conceitos da Indústria 4.0 e de fábrica digital está impulsionando a implementação de infraestrutura virtualizada na manufatura e engenharia. As empresas alemãs também estão investindo em modelos de nuvem local e híbrida, necessitando de ferramentas eficientes de gerenciamento de infraestrutura que ofereçam escalabilidade, integridade de dados e automação operacional.
Visão de mercado do Gerenciador de Infraestrutura Virtual da Ásia-Pacífico
Espera-se que o mercado de gerenciadores de infraestrutura virtual da Ásia-Pacífico apresente a maior taxa de crescimento entre 2025 e 2032, impulsionado pelo boom digital em economias emergentes como Índia, China e países do Sudeste Asiático. A crescente adoção da computação em nuvem, a proliferação de data centers e as iniciativas governamentais de apoio à transformação digital são os principais impulsionadores do crescimento. À medida que mais pequenas e médias empresas (PMEs) migram para a infraestrutura em nuvem, a demanda por gerenciadores de infraestrutura virtual flexíveis e econômicos aumenta.
Visão do mercado de gerentes de infraestrutura virtual do Japão
Espera-se que o mercado japonês de gerenciadores de infraestrutura virtual apresente a maior taxa de crescimento entre 2025 e 2032, impulsionado pela ampla transformação digital nos setores de saúde, financeiro e manufatura. O forte foco do Japão em inovação, automação e resiliência nas operações de TI está fomentando a integração de ferramentas avançadas de virtualização. As empresas estão utilizando gerenciadores de infraestrutura virtual para aumentar o tempo de atividade, otimizar o desempenho e garantir a conformidade de segurança em diversas cargas de trabalho. A crescente popularidade da conteinerização e da computação de ponta também está influenciando a dinâmica do mercado.
Visão do mercado de gerentes de infraestrutura virtual da China
O mercado chinês de gerenciadores de infraestrutura virtual foi responsável pela maior fatia da receita na região Ásia-Pacífico em 2024, impulsionado por uma explosão na geração de dados, uso da nuvem e desenvolvimento de cidades inteligentes. O foco do governo em infraestrutura digital, juntamente com a presença de gigantes nacionais da nuvem, como Alibaba Cloud e Tencent Cloud, está acelerando a implantação de gerenciadores de infraestrutura virtual. Essas ferramentas estão sendo amplamente adotadas em e-commerce, serviços financeiros e telecomunicações, permitindo escalabilidade, automação e eficiência de recursos em tempo real.
Participação de mercado do gerenciador de infraestrutura virtual
O setor de gerenciadores de infraestrutura virtual é liderado principalmente por empresas bem estabelecidas, incluindo:
- SolarWinds Worldwide, LLC (EUA)
- Ciena Corporation (EUA)
- Ribbon Communications Operating Company, Inc. (EUA)
- Corsa Technology Inc. (Canadá)
- Telefonaktiebolaget LM Ericsson (Suécia)
- Broadcom (EUA)
- Fujitsu (Japão)
- IBM Corporation (EUA)
- Nokia (Finlândia)
- NetApp (EUA)
- Enterprise Management Associates, Inc. (EUA)
- Virtual Open Systems SAS (França)
- HashRoot Ltd. (Índia)
- Netedge Technology (Índia)
- Datanetiix Solutions Inc. (EUA)
- Paessler AG (Alemanha)
- Micropro (Índia)
- eG Innovations (EUA)
- Zuci (EUA)
Últimos desenvolvimentos no mercado global de gerenciadores de infraestrutura virtual
- Em setembro de 2023, a Corsa Technology Inc. firmou parceria com a Eventus Security, principal provedora de serviços de segurança gerenciada da Índia. A Eventus expandiu seu portfólio de serviços de segurança gerenciada por meio dessa colaboração, adotando o serviço de firewall virtual hospedado e gerenciado da Corsa Security. Utilizando o Corsa Security Orchestrator (CSO) e firewalls de software dos principais fornecedores, a Eventus alcançou uma rápida entrega de serviços, oferecendo aos clientes capacidade de firewall flexível e serviços de segurança personalizados para atender às suas necessidades específicas.
- Em outubro de 2023, a Ciena Corporation apresentou soluções inovadoras de banda larga aberta e sua expertise na Network X 2023, durante o Broadband Forum (BBF) e o CloudCo Proof of Concept. A demonstração destacou os recursos do Virtual Broadband Network Gateway (vBNG) e do Secure Service Edge (SSE) da Ciena dentro de uma estrutura Secure Access Service Edge (SASE), oferecendo segurança de ponta para residências e pequenas empresas. Os casos de uso em destaque incluíram internet de alta velocidade segura como um serviço de sobreposição com filtragem de spam e proteção contra DDoS. Isso beneficia a empresa na expansão de seu portfólio de produtos e soluções e, assim, no aumento da receita.
- Em maio de 2023, a Telefonaktiebolaget LM Ericsson conquistou o Prêmio FutureNet World Network Sustainability por sua solução de Gerenciamento Preditivo de Energia Celular (PCEM). Reconhecido por reduzir o consumo de energia sem comprometer a qualidade do serviço, o PCEM é um componente essencial da oferta de Operações de Infraestrutura de Energia da Ericsson. Esta aplicação multifornecedor e multitecnologia otimiza o uso de energia no nível da célula, garantindo a qualidade da rede e a experiência do cliente. Isso beneficia a empresa, fortalecendo sua imagem no setor de TI.
- Em janeiro de 2023, a Micropro saiu vitoriosa do Digital India Awards, um prestigiado prêmio concedido pelo Ministério de Eletrônica e Tecnologia da Informação do Governo da Índia. O prêmio reconhece a excelência em iniciativas de governança eletrônica e destaca as contribuições excepcionais da Micropro para a transformação digital da Índia. Isso beneficia a empresa e fortalece sua imagem na região.
- Em agosto de 2022, a SolarWinds Worldwide, LLC foi reconhecida pelo GigaOm Radar Reports como Líder em Observabilidade de Rede e Nuvem em 2022. As soluções de observabilidade híbrida e multinuvem da empresa foram elogiadas por aprimorar a visibilidade, a inteligência e a produtividade corporativa nos ambientes de rede distribuída atuais. O reconhecimento da GigaOm posicionou a SolarWinds como Líder e com Desempenho Superior em Observabilidade de Rede e Líder e Rápida Mudança em Soluções de Observabilidade de Nuvem em 2022. As avaliações foram baseadas em capacidades técnicas, roteiro de produtos, inovação e capacidade de execução. Isso beneficia a empresa, acelerando seus esforços de transformação digital e adotando uma postura proativa de TI.
SKU-
Obtenha acesso online ao relatório sobre a primeira nuvem de inteligência de mercado do mundo

- Painel interativo de análise de dados
- Painel de análise da empresa para oportunidades de elevado potencial de crescimento
- Acesso de analista de pesquisa para personalização e customização. consultas
- Análise da concorrência com painel interativo
- Últimas notícias, atualizações e atualizações Análise de tendências
- Aproveite o poder da análise de benchmark para um rastreio abrangente da concorrência
Metodologia de Investigação
A recolha de dados e a análise do ano base são feitas através de módulos de recolha de dados com amostras grandes. A etapa inclui a obtenção de informações de mercado ou dados relacionados através de diversas fontes e estratégias. Inclui examinar e planear antecipadamente todos os dados adquiridos no passado. Da mesma forma, envolve o exame de inconsistências de informação observadas em diferentes fontes de informação. Os dados de mercado são analisados e estimados utilizando modelos estatísticos e coerentes de mercado. Além disso, a análise da quota de mercado e a análise das principais tendências são os principais fatores de sucesso no relatório de mercado. Para saber mais, solicite uma chamada de analista ou abra a sua consulta.
A principal metodologia de investigação utilizada pela equipa de investigação do DBMR é a triangulação de dados que envolve a mineração de dados, a análise do impacto das variáveis de dados no mercado e a validação primária (especialista do setor). Os modelos de dados incluem grelha de posicionamento de fornecedores, análise da linha de tempo do mercado, visão geral e guia de mercado, grelha de posicionamento da empresa, análise de patentes, análise de preços, análise da quota de mercado da empresa, normas de medição, análise global versus regional e de participação dos fornecedores. Para saber mais sobre a metodologia de investigação, faça uma consulta para falar com os nossos especialistas do setor.
Personalização disponível
A Data Bridge Market Research é líder em investigação formativa avançada. Orgulhamo-nos de servir os nossos clientes novos e existentes com dados e análises que correspondem e atendem aos seus objetivos. O relatório pode ser personalizado para incluir análise de tendências de preços de marcas-alvo, compreensão do mercado para países adicionais (solicite a lista de países), dados de resultados de ensaios clínicos, revisão de literatura, mercado remodelado e análise de base de produtos . A análise de mercado dos concorrentes-alvo pode ser analisada desde análises baseadas em tecnologia até estratégias de carteira de mercado. Podemos adicionar quantos concorrentes necessitar de dados no formato e estilo de dados que procura. A nossa equipa de analistas também pode fornecer dados em tabelas dinâmicas de ficheiros Excel em bruto (livro de factos) ou pode ajudá-lo a criar apresentações a partir dos conjuntos de dados disponíveis no relatório.

