

Global Spend Analytics Market
Tamanho do mercado em biliões de dólares
CAGR :
% 
 USD
3.21 Billion
USD
21.30 Billion
2024
2032
USD
3.21 Billion
USD
21.30 Billion
2024
2032
| 2025 –2032 | |
| USD 3.21 Billion | |
| USD 21.30 Billion | |
| % | |
|
Segmentação do mercado global de análise de gastos, por aplicação (gestão financeira, gestão de riscos, governança e gestão de conformidade, terceirização de fornecedores e gestão de desempenho, previsão de demanda e fornecimento e outros), componente (software e serviços), tipo de análise (preditiva, prescritiva e descritiva), função comercial (finanças, tecnologia da informação (TI), marketing e aquisição), modelo de implantação (local e nuvem), tamanho da organização (pequenas e médias empresas (PMEs) e grandes empresas), vertical da indústria (manufatura, varejo e comércio eletrônico, governo e defesa, saúde e ciências biológicas, telecomunicações e TI, energia e serviços públicos, bancos, serviços financeiros e seguros (BFSI) e outros) - tendências da indústria e previsão para 2032
Análise de mercado de análise de gastos globais
O mercado global de análise de gastos está experimentando um crescimento significativo, impulsionado pela crescente necessidade de otimização de custos, gerenciamento de riscos e processos de aquisição aprimorados em todos os setores. A análise de gastos permite que as organizações obtenham insights acionáveis sobre padrões de gastos, desempenho de fornecedores e eficiências financeiras, aprimorando a tomada de decisões. O mercado é segmentado por aplicativo, componente, tipo de análise, função comercial, modelo de implantação, tamanho da organização e vertical do setor. Os principais impulsionadores incluem a crescente adoção de soluções baseadas em nuvem, análises orientadas por IA e estratégias de aquisição orientadas por dados. Os desenvolvimentos recentes incluem avanços em análises preditivas e prescritivas, integração de aprendizado de máquina para maior visibilidade de gastos e investimentos crescentes em automação. Os principais participantes, como SAP, IBM, Oracle e Coupa Software, estão expandindo seus portfólios com soluções inovadoras. À medida que as empresas priorizam o gerenciamento financeiro e a conformidade orientados por dados, a demanda por análise de gastos deve aumentar. O crescimento futuro do mercado é alimentado pela transformação digital, pelo aumento dos requisitos regulatórios e pela necessidade de estratégias de aquisição com boa relação custo-benefício.
Tamanho do mercado global de análise de gastos
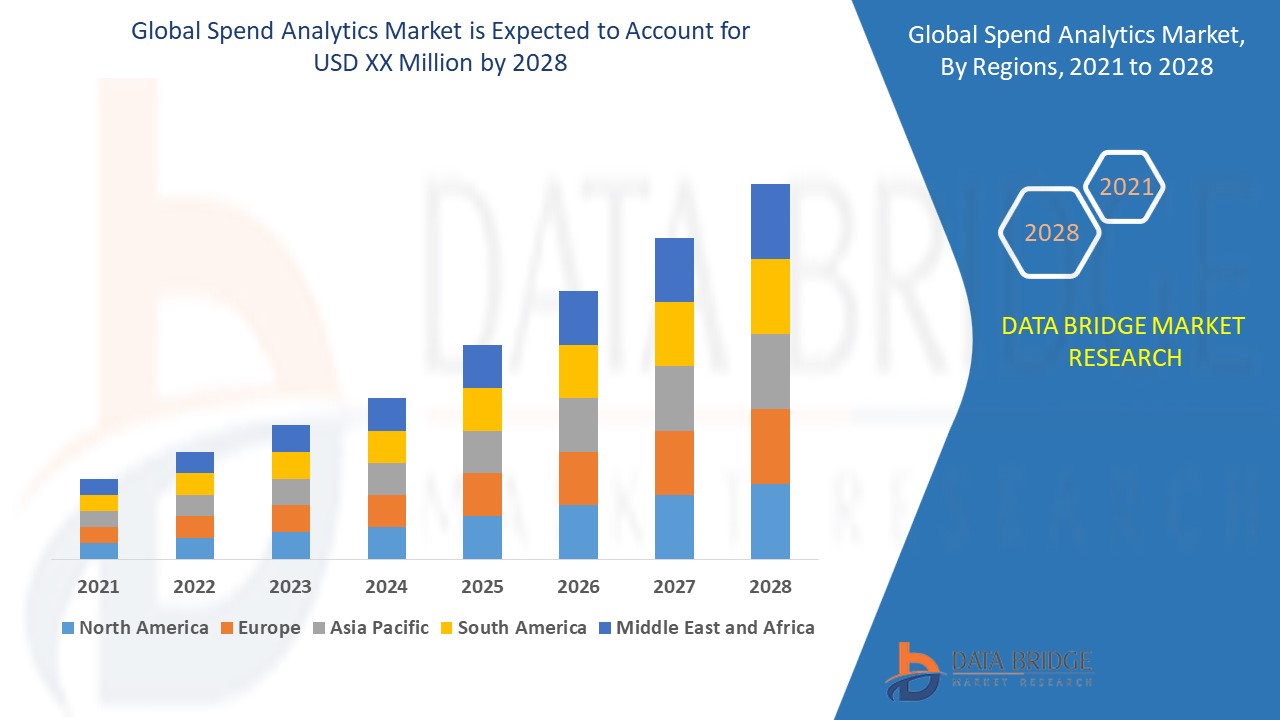
O tamanho do mercado global de análise de gastos foi avaliado em US$ 3,21 bilhões em 2024 e está projetado para atingir US$ 21,30 bilhões até 2032, com um CAGR de 26,71% durante o período previsto de 2025 a 2032. Além dos insights de mercado, como valor de mercado, taxa de crescimento, segmentos de mercado, cobertura geográfica, participantes do mercado e cenário de mercado, o relatório de mercado com curadoria da equipe de pesquisa de mercado da Data Bridge inclui análise aprofundada de especialistas, análise de importação/exportação, análise de preços, análise de consumo de produção e análise Pilstle.
Tendências do mercado de análise de gastos globais
“Soluções de análise de gastos baseadas em nuvem”
Uma tendência importante no mercado global de análise de gastos é a crescente adoção de soluções baseadas em nuvem em vez de sistemas tradicionais locais. As organizações estão cada vez mais aproveitando plataformas de nuvem para aumentar a escalabilidade, flexibilidade e eficiência de custos. Ao contrário das implantações locais, as soluções de análise de gastos baseadas em nuvem oferecem acesso a dados em tempo real, integração perfeita do sistema e atualizações automatizadas, reduzindo os custos de manutenção de TI. A nuvem permite que as empresas gerenciem aquisições, desempenho do fornecedor e insights financeiros de qualquer lugar, facilitando uma melhor tomada de decisão. Além disso, as soluções baseadas em nuvem oferecem suporte a análises avançadas orientadas por IA, melhorando a visibilidade dos gastos e o gerenciamento de riscos. À medida que as empresas priorizam a transformação digital , a mudança para a tecnologia de nuvem está se acelerando, fornecendo às empresas segurança, colaboração e escalabilidade aprimoradas para gerenciamento financeiro e de aquisições eficiente.
Escopo do relatório e segmentação do mercado global de análise de gastos
|
Atributos |
Principais insights de mercado da Global Spend Analytics |
|
Segmentos abrangidos |
|
|
Países abrangidos |
EUA, Canadá e México na América do Norte, Alemanha, França, Reino Unido, Holanda, Suíça, Bélgica, Rússia, Itália, Espanha, Turquia, Resto da Europa na Europa, China, Japão, Índia, Coreia do Sul, Cingapura, Malásia, Austrália, Tailândia, Indonésia, Filipinas, Resto da Ásia-Pacífico (APAC) na Ásia-Pacífico (APAC), Arábia Saudita, Emirados Árabes Unidos, África do Sul, Egito, Israel, Resto do Oriente Médio e África (MEA) como parte do Oriente Médio e África (MEA), Brasil, Argentina e Resto da América do Sul como parte da América do Sul |
|
Principais participantes do mercado |
SAP (Alemanha), IBM (EUA), SAS Institute Inc. (EUA), Oracle (EUA), Coupa (EUA), Zycus Inc. (EUA), Proactis Holdings Limited. (Reino Unido), Empronc Solutions Pvt. Ltd. (Índia), JAGGAER (EUA), Rosslyn Data Technologies Plc (Reino Unido), Ivalua Inc. (EUA), Genpact (EUA), Capgemini (França), Simfoni (EUA), WNS (Holdings) Ltd. (Índia), GEP (EUA), PRM360 (Índia), BRAVOSOLUTION SPA (Itália), Efficio Consulting (Reino Unido), DXC Technology Company (EUA) |
|
Oportunidades de Mercado |
|
|
Conjuntos de informações de dados de valor agregado |
Além de insights de mercado, como valor de mercado, taxa de crescimento, segmentos de mercado, cobertura geográfica, participantes do mercado e cenário de mercado, o relatório de mercado com curadoria da equipe de pesquisa de mercado da Data Bridge inclui análise aprofundada de especialistas, análise de importação/exportação, análise de preços, análise de consumo de produção e análise Pilstle. |
Definição do mercado global de análise de gastos
A análise de gastos globais se refere ao processo de coleta, análise e interpretação de dados de gastos empresariais para aprimorar a tomada de decisões financeiras, otimização de custos e eficiência de aquisição. Envolve alavancar análises avançadas de dados, inteligência artificial (IA) e aprendizado de máquina para obter insights sobre padrões de gastos, desempenho de fornecedores e gerenciamento de riscos. A análise de gastos ajuda as organizações a categorizar despesas, identificar oportunidades de economia de custos, detectar anomalias e melhorar a conformidade com os requisitos regulatórios. O mercado inclui soluções implantadas no local e na nuvem, atendendo a empresas de todos os tamanhos em vários setores, como manufatura, BFSI, saúde e varejo. Ao transformar dados brutos de gastos em insights acionáveis, a análise de gastos capacita as organizações a otimizar estratégias de aquisição, impulsionar a eficiência e alcançar melhores resultados financeiros.
Dinâmica de mercado de análise de gastos globais
Motoristas
- Aumento da demanda por otimização de custos
Um dos principais impulsionadores do mercado global de análise de gastos é o foco crescente na otimização de custos. As organizações estão alavancando a análise de gastos para obter insights mais profundos sobre seus dados financeiros, ajudando-as a identificar oportunidades de economia de custos e eliminar despesas desnecessárias. Ao analisar tendências de aquisição, desempenho do fornecedor e padrões de gastos, as empresas podem negociar melhores contratos, reduzir gastos não planejados e melhorar a eficiência financeira geral. Ferramentas avançadas de análise permitem visibilidade em tempo real das despesas, permitindo que as empresas controlem orçamentos proativamente e aloquem recursos de forma mais eficaz. À medida que as empresas buscam maximizar a lucratividade e melhorar a transparência financeira, a demanda por soluções de análise de gastos continua a crescer.
- Adoção de IA e Machine Learning em Analytics
A integração de inteligência artificial (IA) em análises de gastos é um fator-chave que impulsiona a expansão do mercado. As análises de gastos com tecnologia de IA aprimoram os insights preditivos, permitindo que as empresas prevejam tendências de gastos, identifiquem oportunidades de economia de custos e otimizem estratégias de aquisição. Além disso, os mecanismos de detecção de fraudes orientados por IA analisam padrões de transações para detectar anomalias e evitar perdas financeiras. A avaliação de risco do fornecedor também é aprimorada por meio da IA, permitindo que as empresas avaliem a confiabilidade do fornecedor, avaliem os riscos de conformidade e mitiguem as interrupções da cadeia de suprimentos. À medida que as organizações adotam cada vez mais soluções orientadas por IA para tomada de decisão orientada por dados e eficiência operacional, a demanda por ferramentas inteligentes de análise de gastos continua a aumentar, acelerando o crescimento do mercado.
Oportunidades
- Foco crescente na otimização do relacionamento com fornecedores
A ênfase crescente na otimização de fornecedores apresenta uma oportunidade de mercado significativa para análise de gastos. As empresas estão alavancando a análise de gastos para avaliar o desempenho do fornecedor, avaliar a confiabilidade e garantir a relação custo-benefício na aquisição. Ao analisar dados históricos de gastos e métricas de fornecedores, as organizações podem identificar os fornecedores mais eficientes, negociar melhores termos de contrato e reduzir os riscos de aquisição. Essa abordagem orientada por dados ajuda a otimizar o gerenciamento de fornecedores, melhorando a eficiência operacional e a economia de custos. Além disso, com o aumento das cadeias de suprimentos globais, as empresas estão buscando soluções avançadas de análise para aprimorar a colaboração com fornecedores e mitigar interrupções. Como resultado, espera-se que a demanda por soluções de análise de gastos aumente significativamente.
- Penetração de mercado em economias emergentes
A rápida transformação digital em economias emergentes apresenta uma oportunidade de mercado significativa para soluções de análise de gastos. À medida que as indústrias adotam cada vez mais ferramentas digitais para otimizar as operações, a necessidade de análise de gastos para aprimorar o controle de custos, a eficiência de aquisição e a tomada de decisões financeiras está crescendo. As empresas nessas regiões buscam análises avançadas para obter visibilidade sobre suas despesas, identificar oportunidades de economia de custos e otimizar relacionamentos com fornecedores. As empresas que entram nesses mercados podem capitalizar o potencial inexplorado, oferecendo soluções personalizadas que atendem às necessidades comerciais locais. Ao expandir sua presença global, os provedores de análise de gastos podem impulsionar a adoção e estabelecer uma forte presença em economias de alto crescimento.
Restrições/Desafios
- Integração de dados e problemas de qualidade
Um dos maiores desafios no mercado global de análise de gastos é a complexidade de integrar dados de gastos de várias fontes e formatos. As empresas geralmente coletam dados de aquisição de vários departamentos, fornecedores e sistemas legados, levando a inconsistências e imprecisões. Formatos de dados díspares, entradas ausentes e registros duplicados complicam ainda mais o processo, dificultando a obtenção de insights precisos. A baixa qualidade dos dados pode reduzir a confiabilidade da análise, resultando em tomada de decisão falha e oportunidades perdidas de economia de custos. À medida que as organizações dependem cada vez mais de estratégias de aquisição orientadas por dados, superar esses desafios de integração de dados continua sendo essencial para maximizar a eficácia da solução de análise de gastos.
- Altos custos de implementação
Uma restrição importante no mercado global de análise de gastos é o alto custo de implementação, que representa uma barreira significativa, especialmente para pequenas e médias empresas (PMEs). A implantação de plataformas avançadas de análise de gastos exige investimentos substanciais em software, infraestrutura e treinamento de funcionários. Muitas PMEs operam com orçamentos limitados, o que torna desafiador alocar recursos para soluções de análise sofisticadas. Além disso, a necessidade de pessoal qualificado para gerenciar e interpretar dados aumenta ainda mais os custos operacionais. Como resultado, empresas menores podem demorar para adotar a análise de gastos, limitando a penetração no mercado. Abordar as preocupações com custos por meio de soluções escaláveis e acessíveis é essencial para uma adoção mais ampla.
Escopo do mercado de análise de gastos globais
O mercado é segmentado com base em aplicação, componente, tipo de análise, função de negócios, modelo de implantação, tamanho da organização e vertical da indústria. O crescimento entre esses segmentos ajudará você a analisar segmentos de crescimento escassos nas indústrias e fornecerá aos usuários uma visão geral valiosa do mercado e insights de mercado para ajudá-los a tomar decisões estratégicas para identificar as principais aplicações de mercado.
Aplicativo
- Gestão Financeira
- Gestão de Riscos
- Gestão de Governança e Compliance
- Fornecimento de fornecedores e gestão de desempenho
- Previsão de demanda e oferta
- Outros
Componente
- Programas
- Serviços
Tipo de análise
- Análise preditiva
- Análise prescritiva
- Análise Descritiva
Função de negócios
- Financiar
- Tecnologia da Informação (TI)
- Marketing
- Aquisição
Modelo de Implantação
- No local
- Nuvem
Tamanho da organização
- Pequenas e Médias Empresas (PME)
- Grandes Empresas
Indústria Vertical
- Fabricação
- Varejo e comércio eletrônico
- Governo e Defesa
- Saúde e Ciências da Vida
- Telecomunicações e TI
- Energia e Serviços Públicos
- Bancos, Serviços Financeiros e Seguros (BFSI)
- Outros
Análise regional do mercado global de análise de gastos
O mercado é analisado e insights e tendências sobre o tamanho do mercado são fornecidos por país, aplicação, componente, tipo de análise, função comercial, modelo de implantação, tamanho da organização e setor vertical, conforme referenciado acima.
Os países abrangidos no relatório de mercado são EUA, Canadá, México na América do Norte, Alemanha, Suécia, Polônia, Dinamarca, Itália, Reino Unido, França, Espanha, Holanda, Bélgica, Suíça, Turquia, Rússia, Resto da Europa na Europa, Japão, China, Índia, Coreia do Sul, Nova Zelândia, Vietnã, Austrália, Cingapura, Malásia, Tailândia, Indonésia, Filipinas, Resto da Ásia-Pacífico (APAC) na Ásia-Pacífico (APAC), Brasil, Argentina, Resto da América do Sul como parte da América do Sul, Emirados Árabes Unidos, Arábia Saudita, Omã, Catar, Kuwait, África do Sul, Resto do Oriente Médio e África (MEA) como parte do Oriente Médio e África (MEA).
A América do Norte domina o mercado de análise de gastos devido à sua adoção antecipada de tecnologias avançadas e forte infraestrutura digital. A presença de grandes players do setor fortalece ainda mais a posição de mercado da região. Além disso, espera-se que a fácil disponibilidade de soluções de análise de gastos impulsione o crescimento contínuo durante o período previsto.
A Ásia-Pacífico é a região de crescimento mais rápido no mercado de análise de gastos, testemunhando um crescimento substancial no mercado de análise de gastos devido à crescente adoção de software e serviços de análise de baixo custo entre PMEs. A conscientização crescente, os volumes crescentes de dados de gastos e a crescente demanda por análise em tempo real são fatores-chave que impulsionam a expansão do mercado. Espera-se que essa tendência acelere ainda mais nos próximos anos, impulsionando o crescimento do mercado da região.
A seção do país do relatório também fornece fatores de impacto de mercado individuais e mudanças na regulamentação de mercado que impactam as tendências atuais e futuras do mercado. Pontos de dados como análise da cadeia de valor downstream e upstream, tendências técnicas e análise das cinco forças de Porter, estudos de caso são alguns dos indicadores usados para prever o cenário de mercado para países individuais. Além disso, a presença e disponibilidade de marcas globais e seus desafios enfrentados devido à grande ou escassa concorrência de marcas locais e nacionais, impacto de tarifas domésticas e rotas comerciais são considerados ao fornecer análise de previsão dos dados do país.
Participação no mercado global de análise de gastos
O cenário competitivo do mercado fornece detalhes por concorrente. Os detalhes incluídos são visão geral da empresa, finanças da empresa, receita gerada, potencial de mercado, investimento em pesquisa e desenvolvimento, novas iniciativas de mercado, presença global, locais e instalações de produção, capacidades de produção, pontos fortes e fracos da empresa, lançamento de produto, largura e amplitude do produto, domínio da aplicação. Os pontos de dados fornecidos acima são relacionados apenas ao foco das empresas em relação ao mercado.
Os líderes do mercado global de análise de gastos que operam no mercado são:
- SAP (Alemanha)
- IBM (EUA)
- SAS Institute Inc. (EUA)
- Oracle (EUA)
- Coupa (EUA)
- Zycus Inc. (EUA)
- Proactis Holdings Limited. (Reino Unido)
- Empronc Solutions Pvt. Ltd. (Índia)
- JAGGAER (EUA)
- Rosslyn Data Technologies Plc (Reino Unido)
- Ivalua Inc. (EUA)
- Genpact (EUA)
- Capgemini (França)
- Simfoni (EUA)
- WNS (Holdings) Ltd. (Índia)
- GEP (EUA)
- PRM360 (Índia)
- BRAVOSOLUTION SPA (Itália)
- Efficio Consulting (Reino Unido)
- DXC Technology Company (EUA)
Últimos desenvolvimentos no mercado global de análise de gastos
- Em outubro de 2023, a SAP SE anunciou melhorias em suas soluções de gerenciamento de gastos e rede de negócios, integrando IA e melhorando a experiência do usuário para ajudar as empresas a reduzir custos, mitigar riscos e aumentar a produtividade. O anúncio foi feito no SAP Spend Connect Live em Viena, um evento de destaque para profissionais de gerenciamento de gastos. Esses avanços visam agilizar as compras e gerar maior eficiência para os clientes da SAP
- Em abril de 2022, a SAS e a Microsoft anunciaram uma colaboração para aprimorar a acessibilidade de análises de saúde integrando o SAS Health no Azure com o Azure Health Data Services, dando suporte aos padrões FHIR para melhor interoperabilidade
- Em janeiro de 2022, a SAP SE e a Icertis expandiram sua parceria para aprimorar o gerenciamento de contratos, visando aumentar a eficiência, reduzir riscos e impulsionar a conformidade por meio de insights e automação com tecnologia de IA. A colaboração inclui um potencial investimento financeiro da SAP e uma integração tecnológica mais profunda para maximizar o valor em toda a empresa
- Em julho de 2022, a SpendHQ se fundiu com a empresa de gestão de desempenho de compras Per Angusta, apoiada por um investimento de US$ 65 milhões da Pamlico Capital para dar suporte à transação
- Em março de 2022, a Xeeva, uma provedora de software de aquisição e gerenciamento de gastos com IA, lançou o Spend Analytics com Intelligent Opportunities. Esta nova versão apresenta uma interface de usuário aprimorada, permitindo que os clientes identifiquem e atuem em oportunidades de economia e sourcing geradas por IA de forma mais eficaz
SKU-
Obtenha acesso online ao relatório sobre a primeira nuvem de inteligência de mercado do mundo

- Painel interativo de análise de dados
- Painel de análise da empresa para oportunidades de elevado potencial de crescimento
- Acesso de analista de pesquisa para personalização e customização. consultas
- Análise da concorrência com painel interativo
- Últimas notícias, atualizações e atualizações Análise de tendências
- Aproveite o poder da análise de benchmark para um rastreio abrangente da concorrência
Metodologia de Investigação
A recolha de dados e a análise do ano base são feitas através de módulos de recolha de dados com amostras grandes. A etapa inclui a obtenção de informações de mercado ou dados relacionados através de diversas fontes e estratégias. Inclui examinar e planear antecipadamente todos os dados adquiridos no passado. Da mesma forma, envolve o exame de inconsistências de informação observadas em diferentes fontes de informação. Os dados de mercado são analisados e estimados utilizando modelos estatísticos e coerentes de mercado. Além disso, a análise da quota de mercado e a análise das principais tendências são os principais fatores de sucesso no relatório de mercado. Para saber mais, solicite uma chamada de analista ou abra a sua consulta.
A principal metodologia de investigação utilizada pela equipa de investigação do DBMR é a triangulação de dados que envolve a mineração de dados, a análise do impacto das variáveis de dados no mercado e a validação primária (especialista do setor). Os modelos de dados incluem grelha de posicionamento de fornecedores, análise da linha de tempo do mercado, visão geral e guia de mercado, grelha de posicionamento da empresa, análise de patentes, análise de preços, análise da quota de mercado da empresa, normas de medição, análise global versus regional e de participação dos fornecedores. Para saber mais sobre a metodologia de investigação, faça uma consulta para falar com os nossos especialistas do setor.
Personalização disponível
A Data Bridge Market Research é líder em investigação formativa avançada. Orgulhamo-nos de servir os nossos clientes novos e existentes com dados e análises que correspondem e atendem aos seus objetivos. O relatório pode ser personalizado para incluir análise de tendências de preços de marcas-alvo, compreensão do mercado para países adicionais (solicite a lista de países), dados de resultados de ensaios clínicos, revisão de literatura, mercado remodelado e análise de base de produtos . A análise de mercado dos concorrentes-alvo pode ser analisada desde análises baseadas em tecnologia até estratégias de carteira de mercado. Podemos adicionar quantos concorrentes necessitar de dados no formato e estilo de dados que procura. A nossa equipa de analistas também pode fornecer dados em tabelas dinâmicas de ficheiros Excel em bruto (livro de factos) ou pode ajudá-lo a criar apresentações a partir dos conjuntos de dados disponíveis no relatório.

