

Global Powder Sulfur Market
Tamanho do mercado em biliões de dólares
CAGR :
% 
 USD
956,188.51 Thousand
USD
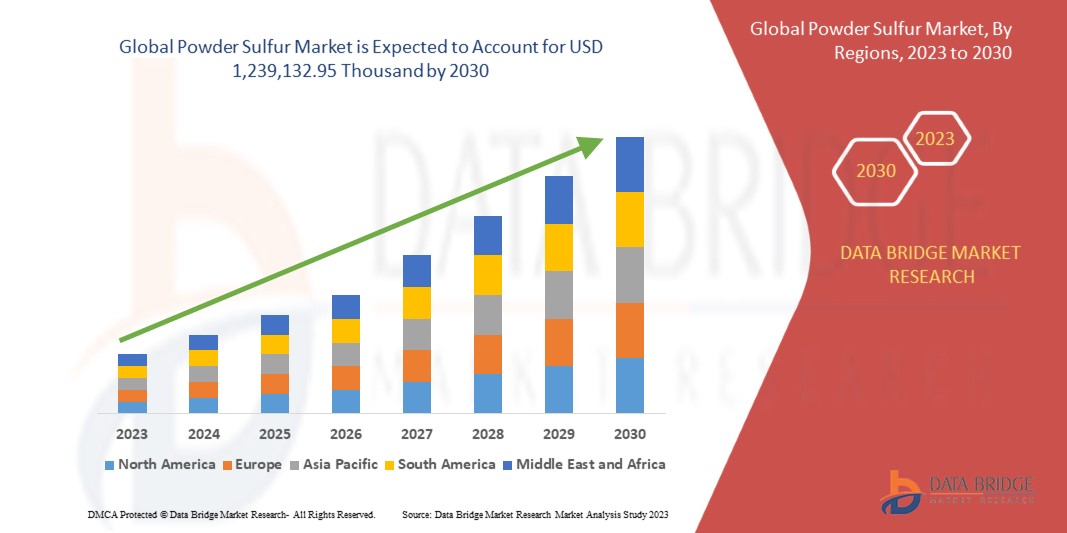
1,239,132.95 Thousand
2021
2029
USD
956,188.51 Thousand
USD
1,239,132.95 Thousand
2021
2029
| 2022 –2029 | |
| USD 956,188.51 Thousand | |
| USD 1,239,132.95 Thousand | |
| % | |
|
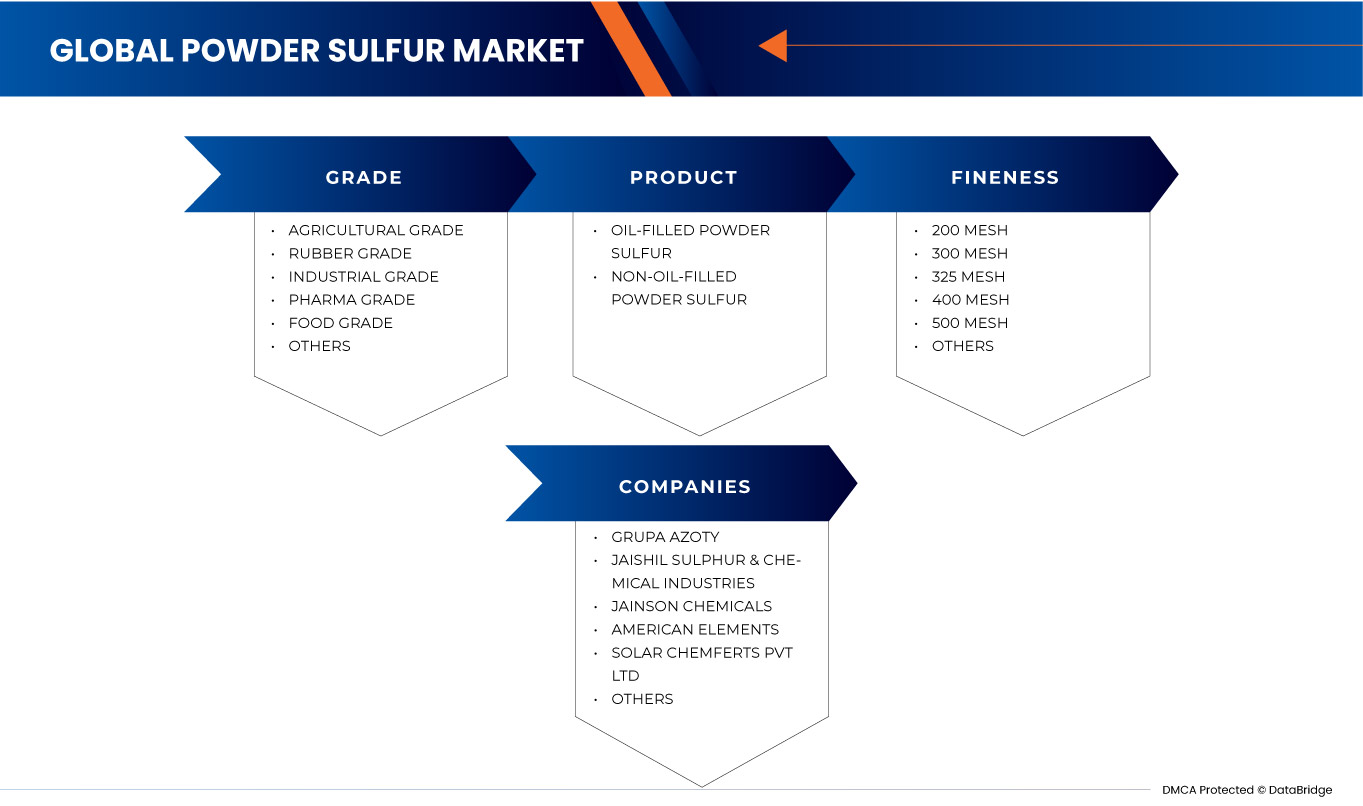
Global Powder Sulfur Market, By Grade (Agricultural Grade, Rubber Grade, Industrial Grade, Pharma Grade, Food Grade, and Others), Product (Non-Oil Filled Powder Sulfur and Oil-Filled Powder Sulfur), Fineness (200 Mesh, 300 Mesh, 325 Mesh, 400 Mesh, 500 Mesh, and Others) – Industry Trends and Forcast to 2030.
Powder Sulfur Market Analysis and Size
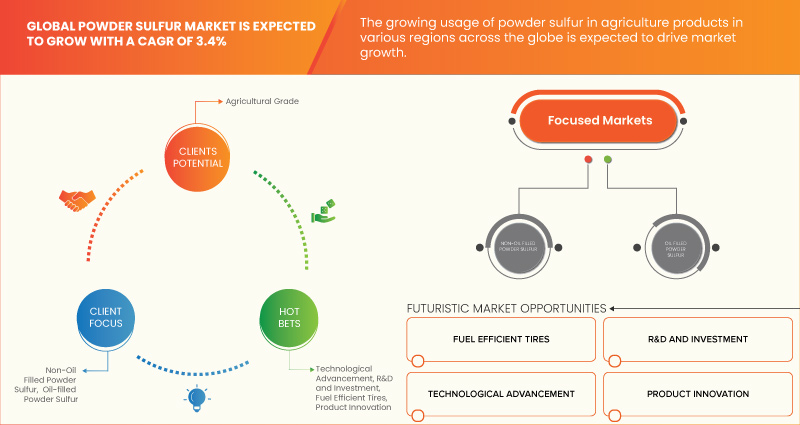
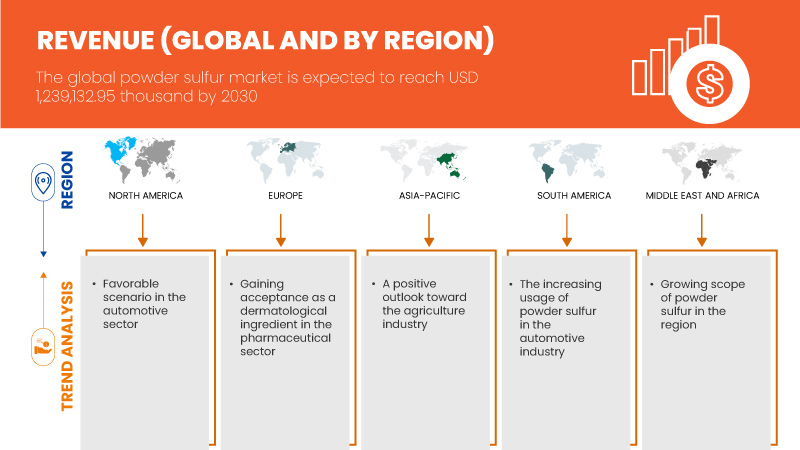
Data Bridge Market Research analyzes that the global powder sulfur market is expected to reach USD 1,239,132.95 thousand by 2030 from USD 956,188.51 thousand in 2022, growing with a substantial CAGR of 3.4% in the forecast period of 2023 to 2030.
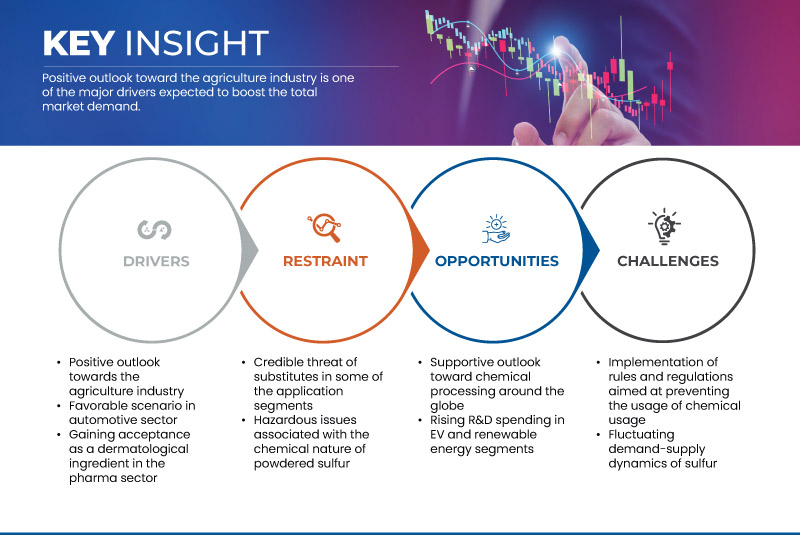
A positive outlook toward the agriculture industry and the gaining acceptance as a dermatological ingredient in the pharma sector are some of the driving factors expected to drive market growth. However, hazardous issues associated with the chemical nature of powder sulfur and the availability of substitutes in some of the application segments are expected to restrain the market growth. The rising R&D spending in EV (Electric Vehicle) and renewable energy segments are expected to provide opportunities for market growth. However, the implementation of rules and regulations aimed at preventing the usage of chemical storage is expected to challenge market growth.
The global powder sulfur market report provides details of market share, new developments, and the impact of domestic and localized market players, analyzes opportunities in terms of emerging revenue pockets, changes in market regulations, products approvals, strategic decisions, product launches, geographic expansions, and technological innovations in the market. To understand the analysis and the market scenario, contact us for an analyst brief. Our team will help you create a revenue-impact solution to achieve your desired goal.
|
Report Metric |
Details |
|
Forecast Period |
2023 to 2030 |
|
Base Year |
2022 |
|
Historic Year |
2021 (Customizable to 2015 - 2020) |
|
Quantitative Units |
Revenue in USD Thousand |
|
Segments Covered |
Grade (Agricultural Grade, Rubber Grade, Industrial Grade, Pharma Grade, Food Grade, and Others), Product (Non-Oil Filled Powder Sulfur and Oil-Filled Powder Sulfur), Fineness (200 Mesh, 300 Mesh, 325 Mesh, 400 Mesh, 500 Mesh, and Others) |
|
Countries Covered |
U.S., Canada, Mexico, Germany, France, U.K., Spain, Italy, Netherlands, Russia, Turkey, Belgium, Switzerland, Luxembourg, Rest of Europe, China, Japan, India, South Korea, Australia & New Zealand, Thailand, Singapore, Philippines, Malaysia, Indonesia, Rest of Asia-Pacific, Brazil, Argentina, Rest of South America, Morocco, South Africa, Saudi Arabia, Egypt, Israel, and Rest of Middle East and Africa |
|
Market Players Covered |
Grupa Azoty, Kaycee Chem Industries, M. K. CHEMICAL INDUSTRIES, Jordan Sulphur, Golden Chemicals, Sulphur., J K Industries, Solar Chemferts Pvt Ltd, American Elements, JAINSON CHEMICALS, and Jaishil Sulphur & Chemical Industries among others |
Market Definition
Powder sulfur refers to a finely ground form of elemental sulfur, commonly used in various industries and applications. It is characterized by its powdered consistency, typically composed of small particles with a high degree of purity. It serves as a key ingredient in the production of fertilizers, pesticides, and fungicides and in the manufacturing of chemicals and pharmaceuticals. Its versatile nature allows it to be used as an additive in industrial processes, such as rubber vulcanization and metallurgical applications. It plays a vital role in diverse sectors due to its unique chemical properties and wide-ranging industrial utility.
Global Powder Sulfur Market Dynamics
Drivers
- Positive Outlook Towards Agriculture Industry
Sulfur stands out in agriculture for many uses such as crop protection as a phytosanitary product, fungicidal and acaricidal properties, and the potential it offers as an agro nutrient due to its potential as a fertilizer and natural biostimulant. This is because sulfur encourages plants to produce essential amino acids such as cysteine, cystine, and methionine on their own, strengthening their natural defenses against fungi.
The sulfur powder will benefit all plants if soil sulfur levels are low as sulfur is required for plant growth. Some veggies, such as onion, garlic, and mustard, require sulfur to become more flavorful. As a result, the agricultural sector will benefit significantly, which is expected to drive market growth because it is the most effective ingredient for outstanding crop growth.
- Favorable Scenario in Automotive Sector
The tire industry is one of the most important vehicle components in the automobile market. The tire and tube, which are essential components of automobile vehicles, are critical to a country's economy. Tires are used by passenger vehicles, commercial vehicles, big trucks, light trucks, and other types of vehicles.
Tire sales, demand, and production are all generally on the rise globally as a result. There is consequently a rising demand for effective tires. To increase elasticity, strength, and durability, it is added to both natural and synthetic rubber. Crosslinks are created by sulfur and rubber molecules, giving rubber its distinctive characteristics. These factors make it a necessary raw material in the production of tires. Sulfur powder is consequently heavily utilized in the manufacture of tires. Moreover, tires have the potential to be a significant driver for market growth due to their increasing demand, production, and sales.
Opportunity
- Supportive Outlook Towards Chemical Processing in Around the Globe
Chemicals such as sulfuric acid, sulfites, and sulfur dioxide are all produced using sulfur powder. The manufacturing of paper, water filtration, and metal processing are just a few industrial uses for these compounds. The production of explosives such as TNT (Trinitrotoluene) and fuel oil containing ammonium nitrate also uses it as a component. It gives the explosive mixture the essential amount of sulfur it needs while also assisting in keeping the reaction stable. Sulfur powder is sometimes used in water purification to eliminate contaminants and to prevent the growth of bacteria and algae in water systems, as well as a bleaching agent in the manufacturing of paper, wool, and silk. In addition, it is used in the production of several types of soap and detergents
The use of chemicals processed from sulfur powder has been in many industries such as water treatment, fireworks, and construction among others. Furthermore, it is expected that the different uses of chemicals in various industries will present prospects for the industry.
Restraints/Challenges
- Credible Threat of Substitutes in Some of the Application Segments
Powdered sulfur plays various roles in the production of different products in different segments such as automotive, agricultural, pharmaceuticals, and others. The multi-segment role can have both positive and negative impacts on the overall market as each application segment may have various substitutes which can effectively overturn the usage of powdered sulfur.
From the above instances, it is understandable that there are many substitute chemical compounds established already that can be used as substitutes for powdered sulfur. Hence, the availability of these substitutes is expected to restrain market growth.
- Implementation of Rules and Regulations Aimed at Preventing the Usage of Chemical Usage
Increasing concern about the use of hazardous chemicals in its manufacturing process has led to strict rules and regulations being applied to the powdered sulfur sector. These guidelines and laws cover the use of chemicals involved in the production of sulfur itself as well as the usage of sulfur in the production of other products. Thus, stringent regulations are expected to restrain market growth.
The restriction to use certain materials, chemicals, and production process makes the company invest more in new R&D methods and materials, production schemes, technology, and equipment to meet the requirements of the regulation, which in turn, will have an impact on the product cost and availability which ultimately affect the market. On the other hand, the true purpose of these rules and regulations is to emphasize sustainability and innovation, and collaboration among various companies for long-term viability and delivering harmless products to the customer. So, manufacturers should take these regulations as a challenge and take the required steps to overcome and stand alone among the other manufacturers.
Global Powder Sulfur Market Scope
The global powder sulfur market is segmented into three notable segments based on grade, product, and fineness. The growth amongst these segments will help you analyze major growth segments in the industries and provide the users with a valuable market overview and market insights to make strategic decisions to identify core market applications.
Grade
- Agricultural Grade
- Rubber Grade
- Industrial Grade
- Pharma Grade
- Food Grade
- Others
On the basis of grade, the global powder sulfur market is segmented into agricultural grade, rubber grade, industrial grade, pharma grade, food grade, and others.
Product
- Oil-Filled Powder Sulfur
- Non-Oil Filled Powder Sulfur
On the basis of product, the global powder sulfur market is segmented into oil-filled powder sulfur and non-oil filled powder sulfur.
Fineness
- 200 Mesh
- 300 Mesh
- 325 Mesh
- 400 Mesh
- 500 Mesh
- Others
On the basis of fineness, the global powder sulfur market is segmented into 200 mesh, 300 mesh, 325 mesh, 400 mesh, 500 mesh, and others.
Global Powder Sulfur Market Regional Analysis/Insights
The global powder sulfur market is segmented into three notable segments based on grade, product, and fineness.
The countries covered in this market report are U.S., Canada, Mexico, Germany, France, U.K., Spain, Italy, Netherlands, Russia, Turkey, Belgium, Switzerland, Luxembourg, Rest of Europe, China, Japan, India, South Korea, Australia & New Zealand, Thailand, Singapore, Philippines, Malaysia, Indonesia, Rest of Asia-Pacific, Brazil, Argentina, Rest of South America, Morocco, South Africa, Saudi Arabia, Egypt, Israel, and Rest of Middle East and Africa.
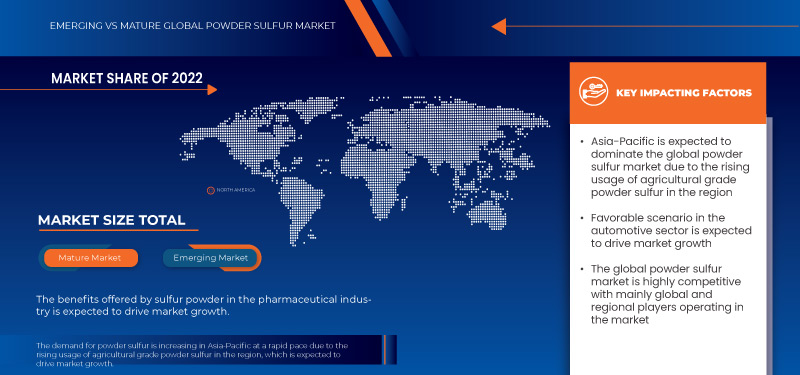
China is expected to dominate the Asia-Pacific powder sulfur market due to the increasing demand for powder sulfur in the agriculture sector. Russia is expected to dominate the Europe powder sulfur market due to the manufacturing of tires around the world that makes use of powder sulfur extensively. The U.S. is expected to dominate the North America powder sulfur market due to the increasing demand for powder sulfur in the agriculture sector.
The country section of the report also provides individual market-impacting factors and changes in market regulation that impact the current and future trends of the market. Data point downstream and upstream value chain analysis, technical trends, Porter's five forces analysis, and case studies are some of the pointers used to forecast the market scenario for individual countries. Also, the presence and availability of global brands and their challenges faced due to large or scarce competition from local and domestic brands, the impact of domestic tariffs, and trade routes are considered while providing forecast analysis of the country data.
Competitive Landscape and Global Powder Sulfur Market Share Analysis
The global powder sulfur market competitive landscape provides details of competitors. Details included are company overview, company financials, revenue generated, market potential, investment in research and development, new market initiatives, production sites and facilities, company strengths and weaknesses, product launch, product trials pipelines, product approvals, patents, product width and breadth, application dominance, and technology lifeline curve. The above data points provided are only related to the companies’ focus related to the market.
Some of the major market players operating in the global powder sulfur market are Grupa Azoty, Kaycee Chem Industries, M. K. CHEMICAL INDUSTRIES, Jordan Sulphur, Golden Chemicals, Sulphur., J K Industries, Solar Chemferts Pvt Ltd, American Elements, JAINSON CHEMICALS, and Jaishil Sulphur & Chemical Industries among others.
SKU-
Obtenha acesso online ao relatório sobre a primeira nuvem de inteligência de mercado do mundo

- Painel interativo de análise de dados
- Painel de análise da empresa para oportunidades de elevado potencial de crescimento
- Acesso de analista de pesquisa para personalização e customização. consultas
- Análise da concorrência com painel interativo
- Últimas notícias, atualizações e atualizações Análise de tendências
- Aproveite o poder da análise de benchmark para um rastreio abrangente da concorrência
Índice
1 INTRODUCTION
1.1 OBJECTIVES OF THE STUDY
1.2 MARKET DEFINITION
1.3 OVERVIEW
1.4 LIMITATIONS
1.5 MARKETS COVERED
2 MARKET SEGMENTATION
2.1 MARKETS COVERED
2.2 GEOGRAPHICAL SCOPE
2.3 YEARS CONSIDERED FOR THE STUDY
2.4 CURRENCY AND PRICING
2.5 DBMR TRIPOD DATA VALIDATION MODEL
2.6 PRODUCT LIFELINE CURVE
2.7 MULTIVARIATE MODELING
2.8 PRIMARY INTERVIEWS WITH KEY OPINION LEADERS
2.9 DBMR MARKET POSITION GRID
2.1 DBMR MARKET CHALLENGE MATRIX
2.11 DBMR VENDOR SHARE ANALYSIS
2.12 SECONDARY SOURCES
2.13 ASSUMPTIONS
3 EXECUTIVE SUMMARY
4 PREMIUM INSIGHTS
4.1 PESTLE ANALYSIS
4.1.1 POLITICAL FACTORS
4.1.2 ECONOMIC FACTORS
4.1.3 SOCIAL FACTORS
4.1.4 TECHNOLOGICAL FACTORS
4.1.5 LEGAL FACTORS
4.1.6 ENVIRONMENTAL FACTORS
4.2 PORTER’S FIVE FORCES
4.2.1 THREAT OF NEW ENTRANTS
4.2.2 THREAT OF SUBSTITUTES
4.2.3 CUSTOMER BARGAINING POWER
4.2.4 SUPPLIER BARGAINING POWER
4.2.5 INTERNAL COMPETITION (RIVALRY)
4.3 CLIMATE CHANGE SCENARIO
4.3.1 ENVIRONMENTAL CONCERNS
4.3.2 INDUSTRY RESPONSE
4.3.3 GOVERNMENT’S ROLE
4.3.4 ANALYST RECOMMENDATION
4.4 IMPORT-EXPORT SCENARIO
4.5 PRICE ANALYSIS
4.6 PRODUCTION CONSUMPTION ANALYSIS
4.7 PRODUCTION CAPACITY OVERVIEW
4.8 SUPPLY CHAIN ANALYSIS
4.8.1 OVERVIEW
4.8.2 LOGISTICS COST SCENARIO
4.8.3 IMPORTANCE OF LOGISTICS SERVICE PROVIDERS
4.9 TECHNOLOGICAL ADVANCEMENTS BY MANUFACTURERS
4.1 VENDOR SELECTION CRITERIA
5 REGULATION COVERAGE
6 MARKET OVERVIEW
6.1 DRIVERS
6.1.1 POSITIVE OUTLOOK TOWARDS AGRICULTURE INDUSTRY
6.1.2 FAVORABLE SCENARIO IN THE AUTOMOTIVE SECTOR
6.1.3 GAINING ACCEPTANCE AS A DERMATOLOGICAL INGREDIENT IN PHARMA SECTOR
6.2 RESTRAINTS
6.2.1 CREDIBLE THREAT OF SUBSTITUTES IN SOME OF THE APPLICATION SEGMENTS
6.2.2 HAZARDOUS ISSUES ASSOCIATED WITH THE CHEMICAL NATURE OF POWDERED SULFUR
6.3 OPPORTUNITIES
6.3.1 SUPPORTIVE OUTLOOK TOWARD CHEMICAL PROCESSING AROUND THE GLOBE
6.3.2 RISING R&D SPENDING IN EV AND RENEWABLE ENERGY SEGMENTS
6.4 CHALLENGES
6.4.1 IMPLEMENTATION OF RULES AND REGULATIONS AIMED AT PREVENTING THE USAGE OF CHEMICAL USAGE
6.4.2 FLUCTUATING DEMAND-SUPPLY DYNAMICS OF SULFUR
7 GLOBAL POWDER SULFUR MARKET, BY REGION
7.1 OVERVIEW
7.2 ASIA-PACIFIC
7.2.1 CHINA
7.2.2 INDIA
7.2.3 INDONESIA
7.2.4 JAPAN
7.2.5 SOUTH KOREA
7.2.6 THAILAND
7.2.7 MALAYSIA
7.2.8 AUSTRALIA & NEW ZEALAND
7.2.9 SINGAPORE
7.2.10 PHILIPPINES
7.2.11 REST OF ASIA-PACIFIC
7.3 EUROPE
7.3.1 RUSSIA
7.3.2 GERMANY
7.3.3 FRANCE
7.3.4 U.K.
7.3.5 NETHERLANDS
7.3.6 TURKEY
7.3.7 ITALY
7.3.8 SPAIN
7.3.9 BELGIUM
7.3.10 SWITZERLAND
7.3.11 LUXEMBOURG
7.3.12 REST OF EUROPE
7.4 NORTH AMERICA
7.4.1 U.S.
7.4.2 MEXICO
7.4.3 CANADA
7.5 MIDDLE EAST AND AFRICA
7.5.1 MOROCCO
7.5.2 SAUDI ARABIA
7.5.3 EGYPT
7.5.4 SOUTH AFRICA
7.5.5 ISRAEL
7.5.6 REST OF MIDDLE EAST AND AFRICA
7.6 SOUTH AMERICA
7.6.1 BRAZIL
7.6.2 ARGENTINA
7.6.3 REST OF SOUTH AMERICA
8 GLOBAL POWDER SULFUR MARKET: COMPANY LANDSCAPE
8.1 COMPANY SHARE ANALYSIS: GLOBAL
8.2 COMPANY SHARE ANALYSIS: NORTH AMERICA
8.3 COMPANY SHARE ANALYSIS: EUROPE
8.4 COMPANY SHARE ANALYSIS: ASIA-PACIFIC
9 COMPANY PROFILES
9.1 GRUPA AZOTY
9.1.1 COMPANY SNAPSHOT
9.1.2 REVENUE ANALYSIS
9.1.3 SWOT ANALYSIS
9.1.4 COMPANY SHARE ANALYSIS
9.1.5 PRODUCT PORTFOLIO
9.1.6 RECENT DEVELOPMENTS
9.2 JAISHIL SULPHUR & CHEMICAL INDUSTRIES
9.2.1 COMPANY SNAPSHOT
9.2.2 SWOT
9.2.3 COMPANY SHARE ANALYSIS
9.2.4 PRODUCT PORTFOLIO
9.2.5 RECENT DEVELOPMENTS
9.3 JAINSON CHEMICALS
9.3.1 COMPANY SNAPSHOT
9.3.2 SWOT
9.3.3 COMPANY SHARE ANALYSIS
9.3.4 PRODUCT PORTFOLIO
9.3.5 RECENT DEVELOPMENTS
9.4 AMERICAN ELEMENTS
9.4.1 COMPANY SNAPSHOT
9.4.2 SWOT ANALYSIS
9.4.3 COMPANY SHARE ANALYSIS
9.4.4 PRODUCT PORTFOLIO
9.4.5 RECENT DEVELOPMENTS
9.5 SOLAR CHEMFERTS PVT LTD
9.5.1 COMPANY SNAPSHOT
9.5.2 SWOT ANALYSIS
9.5.3 COMPANY SHARE ANALYSIS
9.5.4 PRODUCT PORTFOLIO
9.5.5 RECENT DEVELOPMENTS
9.6 GOLDEN CHEMICALS
9.6.1 COMPANY SNAPSHOT
9.6.2 SWOT
9.6.3 PRODUCT PORTFOLIO
9.6.4 RECENT DEVELOPMENTS
9.7 J K INDUSTRIES
9.7.1 COMPANY SNAPSHOT
9.7.2 SWOT
9.7.3 PRODUCT PORTFOLIO
9.7.4 RECENT DEVELOPMENTS
9.8 JORDAN SULPHUR
9.8.1 COMPANY SNAPSHOT
9.8.2 SWOT ANALYSIS
9.8.3 PRODUCT PORTFOLIO
9.8.4 RECENT DEVELOPMENT
9.9 KAYCEE CHEM INDUSTRIES
9.9.1 COMPANY SNAPSHOT
9.9.2 SWOT
9.9.3 PRODUCT PORTFOLIO
9.9.4 RECENT DEVELOPMENTS
9.1 M. K. CHEMICAL INDUSTRIES
9.10.1 COMPANY SNAPSHOT
9.10.2 SWOT
9.10.3 PRODUCT PORTFOLIO
9.10.4 RECENT DEVELOPMENTS
9.11 SULPHUR.
9.11.1 COMPANY SNAPSHOT
9.11.2 SWOT ANALYSIS
9.11.3 PRODUCT PORTFOLIO
9.11.4 RECENT DEVELOPMENTS
10 QUESTIONNAIRE
11 RELATED REPORTS
Lista de Tabela
TABLE 1 REGULATORY COVERAGE
TABLE 2 GLOBAL POWDER SULFUR MARKET, BY REGION, 2021-2030 (USD THOUSAND)
TABLE 3 GLOBAL POWDER SULFUR MARKET, BY REGION, 2021-2030 (TONS)
TABLE 4 GLOBAL POWDER SULFUR MARKET, BY GRADE, 2021-2030 (USD THOUSAND)
TABLE 5 GLOBAL POWDER SULFUR MARKET, BY GRADE, 2021-2030 (TONS)
TABLE 6 GLOBAL POWDER SULFUR MARKET, BY GRADE, 2021-2030 (AVERAGE SELLING PRICE (USD) PER TON)
TABLE 7 GLOBAL AGRICULTURAL GRADE IN POWDER SULFUR MARKET, BY PRODUCT, 2021-2030 (USD THOUSAND)
TABLE 8 GLOBAL RUBBER GRADE IN POWDER SULFUR MARKET, BY PRODUCT, 2021-2030 (USD THOUSAND)
TABLE 9 GLOBAL RUBBER GRADE IN POWDER SULFUR MARKET, BY TYPE, 2021-2030 (USD THOUSAND)
TABLE 10 GLOBAL INDUSTRIAL GRADE IN POWDER SULFUR MARKET, BY PRODUCT, 2021-2030 (USD THOUSAND)
TABLE 11 GLOBAL PHARMA GRADE IN POWDER SULFUR MARKET, BY PRODUCT, 2021-2030 (USD THOUSAND)
TABLE 12 GLOBAL FOOD GRADE IN POWDER SULFUR MARKET, BY PRODUCT, 2021-2030 (USD THOUSAND)
TABLE 13 GLOBAL OTHERS IN POWDER SULFUR MARKET, BY PRODUCT, 2021-2030 (USD THOUSAND)
TABLE 14 GLOBAL POWDER SULFUR MARKET, BY PRODUCT, 2021-2030 (USD THOUSAND)
TABLE 15 GLOBAL POWDER SULFUR MARKET, BY PRODUCT, 2021-2030 (TONS)
TABLE 16 GLOBAL POWDER SULFUR MARKET, BY FINENESS, 2021-2030 (USD THOUSAND)
TABLE 17 GLOBAL POWDER SULFUR MARKET, BY FINENESS, 2021-2030 (TONS)
TABLE 18 ASIA-PACIFIC POWDER SULFUR MARKET, BY COUNTRY, 2021-2030 (USD THOUSAND)
TABLE 19 ASIA-PACIFIC POWDER SULFUR MARKET, BY COUNTRY, 2021-2030 (TONS)
TABLE 20 ASIA-PACIFIC POWDER SULFUR MARKET, BY GRADE, 2021-2030 (USD THOUSAND)
TABLE 21 ASIA-PACIFIC POWDER SULFUR MARKET, BY GRADE, 2021-2030 (TONS)
TABLE 22 ASIA-PACIFIC AGRICULTURAL GRADE IN POWDER SULFUR MARKET, BY PRODUCT, 2021-2030 (USD THOUSAND)
TABLE 23 ASIA-PACIFIC RUBBER GRADE IN POWDER SULFUR MARKET, BY PRODUCT, 2021-2030 (USD THOUSAND)
TABLE 24 ASIA-PACIFIC RUBBER GRADE IN POWDER SULFUR MARKET, BY TYPE, 2021-2030 (USD THOUSAND)
TABLE 25 ASIA-PACIFIC INDUSTRIAL GRADE IN POWDER SULFUR MARKET, BY PRODUCT, 2021-2030 (USD THOUSAND)
TABLE 26 ASIA-PACIFIC PHARMA GRADE IN POWDER SULFUR MARKET, BY PRODUCT, 2021-2030 (USD THOUSAND)
TABLE 27 ASIA-PACIFIC FOOD GRADE IN POWDER SULFUR MARKET, BY PRODUCT, 2021-2030 (USD THOUSAND)
TABLE 28 ASIA-PACIFIC OTHERS IN POWDER SULFUR MARKET, BY PRODUCT, 2021-2030 (USD THOUSAND)
TABLE 29 ASIA-PACIFIC POWDER SULFUR MARKET, BY PRODUCT, 2021-2030 (USD THOUSAND)
TABLE 30 ASIA-PACIFIC POWDER SULFUR MARKET, BY PRODUCT, 2021-2030 (TONS)
TABLE 31 ASIA-PACIFIC POWDER SULFUR MARKET, BY FINENESS, 2021-2030 (USD THOUSAND)
TABLE 32 ASIA-PACIFIC POWDER SULFUR MARKET, BY FINENESS, 2021-2030 (TONS)
TABLE 33 CHINA POWDER SULFUR MARKET, BY GRADE, 2021-2030 (USD THOUSAND)
TABLE 34 CHINA POWDER SULFUR MARKET, BY GRADE, 2021-2030 (TONS)
TABLE 35 CHINA AGRICULTURAL GRADE IN POWDER SULFUR MARKET, BY PRODUCT, 2021-2030 (USD THOUSAND)
TABLE 36 CHINA RUBBER GRADE IN POWDER SULFUR MARKET, BY PRODUCT, 2021-2030 (USD THOUSAND)
TABLE 37 CHINA RUBBER GRADE IN POWDER SULFUR MARKET, BY TYPE, 2021-2030 (USD THOUSAND)
TABLE 38 CHINA INDUSTRIAL GRADE IN POWDER SULFUR MARKET, BY PRODUCT, 2021-2030 (USD THOUSAND)
TABLE 39 CHINA PHARMA GRADE IN POWDER SULFUR MARKET, BY PRODUCT, 2021-2030 (USD THOUSAND)
TABLE 40 CHINA FOOD GRADE IN POWDER SULFUR MARKET, BY PRODUCT, 2021-2030 (USD THOUSAND)
TABLE 41 CHINA OTHERS IN POWDER SULFUR MARKET, BY PRODUCT, 2021-2030 (USD THOUSAND)
TABLE 42 CHINA POWDER SULFUR MARKET, BY PRODUCT, 2021-2030 (USD THOUSAND)
TABLE 43 CHINA POWDER SULFUR MARKET, BY PRODUCT, 2021-2030 (TONS)
TABLE 44 CHINA POWDER SULFUR MARKET, BY FINENESS, 2021-2030 (USD THOUSAND)
TABLE 45 CHINA POWDER SULFUR MARKET, BY FINENESS, 2021-2030 (TONS)
TABLE 46 INDIA POWDER SULFUR MARKET, BY GRADE, 2021-2030 (USD THOUSAND)
TABLE 47 INDIA POWDER SULFUR MARKET, BY GRADE, 2021-2030 (TONS)
TABLE 48 INDIA AGRICULTURAL GRADE IN POWDER SULFUR MARKET, BY PRODUCT, 2021-2030 (USD THOUSAND)
TABLE 49 INDIA RUBBER GRADE IN POWDER SULFUR MARKET, BY PRODUCT, 2021-2030 (USD THOUSAND)
TABLE 50 INDIA RUBBER GRADE IN POWDER SULFUR MARKET, BY TYPE, 2021-2030 (USD THOUSAND)
TABLE 51 INDIA INDUSTRIAL GRADE IN POWDER SULFUR MARKET, BY PRODUCT, 2021-2030 (USD THOUSAND)
TABLE 52 INDIA PHARMA GRADE IN POWDER SULFUR MARKET, BY PRODUCT, 2021-2030 (USD THOUSAND)
TABLE 53 INDIA FOOD GRADE IN POWDER SULFUR MARKET, BY PRODUCT, 2021-2030 (USD THOUSAND)
TABLE 54 INDIA OTHERS IN POWDER SULFUR MARKET, BY PRODUCT, 2021-2030 (USD THOUSAND)
TABLE 55 INDIA POWDER SULFUR MARKET, BY PRODUCT, 2021-2030 (USD THOUSAND)
TABLE 56 INDIA POWDER SULFUR MARKET, BY PRODUCT, 2021-2030 (TONS)
TABLE 57 INDIA POWDER SULFUR MARKET, BY FINENESS, 2021-2030 (USD THOUSAND)
TABLE 58 INDIA POWDER SULFUR MARKET, BY FINENESS, 2021-2030 (TONS)
TABLE 59 INDONESIA POWDER SULFUR MARKET, BY GRADE, 2021-2030 (USD THOUSAND)
TABLE 60 INDONESIA POWDER SULFUR MARKET, BY GRADE, 2021-2030 (TONS)
TABLE 61 INDONESIA AGRICULTURAL GRADE IN POWDER SULFUR MARKET, BY PRODUCT, 2021-2030 (USD THOUSAND)
TABLE 62 INDONESIA RUBBER GRADE IN POWDER SULFUR MARKET, BY PRODUCT, 2021-2030 (USD THOUSAND)
TABLE 63 INDONESIA RUBBER GRADE IN POWDER SULFUR MARKET, BY TYPE, 2021-2030 (USD THOUSAND)
TABLE 64 INDONESIA INDUSTRIAL GRADE IN POWDER SULFUR MARKET, BY PRODUCT, 2021-2030 (USD THOUSAND)
TABLE 65 INDONESIA PHARMA GRADE IN POWDER SULFUR MARKET, BY PRODUCT, 2021-2030 (USD THOUSAND)
TABLE 66 INDONESIA FOOD GRADE IN POWDER SULFUR MARKET, BY PRODUCT, 2021-2030 (USD THOUSAND)
TABLE 67 INDONESIA OTHERS IN POWDER SULFUR MARKET, BY PRODUCT, 2021-2030 (USD THOUSAND)
TABLE 68 INDONESIA POWDER SULFUR MARKET, BY PRODUCT, 2021-2030 (USD THOUSAND)
TABLE 69 INDONESIA POWDER SULFUR MARKET, BY PRODUCT, 2021-2030 (TONS)
TABLE 70 INDONESIA POWDER SULFUR MARKET, BY FINENESS, 2021-2030 (USD THOUSAND)
TABLE 71 INDONESIA POWDER SULFUR MARKET, BY FINENESS, 2021-2030 (TONS)
TABLE 72 JAPAN POWDER SULFUR MARKET, BY GRADE, 2021-2030 (USD THOUSAND)
TABLE 73 JAPAN POWDER SULFUR MARKET, BY GRADE, 2021-2030 (TONS)
TABLE 74 JAPAN AGRICULTURAL GRADE IN POWDER SULFUR MARKET, BY PRODUCT, 2021-2030 (USD THOUSAND)
TABLE 75 JAPAN RUBBER GRADE IN POWDER SULFUR MARKET, BY PRODUCT, 2021-2030 (USD THOUSAND)
TABLE 76 JAPAN RUBBER GRADE IN POWDER SULFUR MARKET, BY TYPE, 2021-2030 (USD THOUSAND)
TABLE 77 JAPAN INDUSTRIAL GRADE IN POWDER SULFUR MARKET, BY PRODUCT, 2021-2030 (USD THOUSAND)
TABLE 78 JAPAN PHARMA GRADE IN POWDER SULFUR MARKET, BY PRODUCT, 2021-2030 (USD THOUSAND)
TABLE 79 JAPAN FOOD GRADE IN POWDER SULFUR MARKET, BY PRODUCT, 2021-2030 (USD THOUSAND)
TABLE 80 JAPAN OTHERS IN POWDER SULFUR MARKET, BY PRODUCT, 2021-2030 (USD THOUSAND)
TABLE 81 JAPAN POWDER SULFUR MARKET, BY PRODUCT, 2021-2030 (USD THOUSAND)
TABLE 82 JAPAN POWDER SULFUR MARKET, BY PRODUCT, 2021-2030 (TONS)
TABLE 83 JAPAN POWDER SULFUR MARKET, BY FINENESS, 2021-2030 (USD THOUSAND)
TABLE 84 JAPAN POWDER SULFUR MARKET, BY FINENESS, 2021-2030 (TONS)
TABLE 85 SOUTH KOREA POWDER SULFUR MARKET, BY GRADE, 2021-2030 (USD THOUSAND)
TABLE 86 SOUTH KOREA POWDER SULFUR MARKET, BY GRADE, 2021-2030 (TONS)
TABLE 87 SOUTH KOREA AGRICULTURAL GRADE IN POWDER SULFUR MARKET, BY PRODUCT, 2021-2030 (USD THOUSAND)
TABLE 88 SOUTH KOREA RUBBER GRADE IN POWDER SULFUR MARKET, BY PRODUCT, 2021-2030 (USD THOUSAND)
TABLE 89 SOUTH KOREA RUBBER GRADE IN POWDER SULFUR MARKET, BY TYPE, 2021-2030 (USD THOUSAND)
TABLE 90 SOUTH KOREA INDUSTRIAL GRADE IN POWDER SULFUR MARKET, BY PRODUCT, 2021-2030 (USD THOUSAND)
TABLE 91 SOUTH KOREA PHARMA GRADE IN POWDER SULFUR MARKET, BY PRODUCT, 2021-2030 (USD THOUSAND)
TABLE 92 SOUTH KOREA FOOD GRADE IN POWDER SULFUR MARKET, BY PRODUCT, 2021-2030 (USD THOUSAND)
TABLE 93 SOUTH KOREA OTHERS IN POWDER SULFUR MARKET, BY PRODUCT, 2021-2030 (USD THOUSAND)
TABLE 94 SOUTH KOREA POWDER SULFUR MARKET, BY PRODUCT, 2021-2030 (USD THOUSAND)
TABLE 95 SOUTH KOREA POWDER SULFUR MARKET, BY PRODUCT, 2021-2030 (TONS)
TABLE 96 SOUTH KOREA POWDER SULFUR MARKET, BY FINENESS, 2021-2030 (USD THOUSAND)
TABLE 97 SOUTH KOREA POWDER SULFUR MARKET, BY FINENESS, 2021-2030 (TONS)
TABLE 98 THAILAND POWDER SULFUR MARKET, BY GRADE, 2021-2030 (USD THOUSAND)
TABLE 99 THAILAND POWDER SULFUR MARKET, BY GRADE, 2021-2030 (TONS)
TABLE 100 THAILAND AGRICULTURAL GRADE IN POWDER SULFUR MARKET, BY PRODUCT, 2021-2030 (USD THOUSAND)
TABLE 101 THAILAND RUBBER GRADE IN POWDER SULFUR MARKET, BY PRODUCT, 2021-2030 (USD THOUSAND)
TABLE 102 THAILAND RUBBER GRADE IN POWDER SULFUR MARKET, BY TYPE, 2021-2030 (USD THOUSAND)
TABLE 103 THAILAND INDUSTRIAL GRADE IN POWDER SULFUR MARKET, BY PRODUCT, 2021-2030 (USD THOUSAND)
TABLE 104 THAILAND PHARMA GRADE IN POWDER SULFUR MARKET, BY PRODUCT, 2021-2030 (USD THOUSAND)
TABLE 105 THAILAND FOOD GRADE IN POWDER SULFUR MARKET, BY PRODUCT, 2021-2030 (USD THOUSAND)
TABLE 106 THAILAND OTHERS IN POWDER SULFUR MARKET, BY PRODUCT, 2021-2030 (USD THOUSAND)
TABLE 107 THAILAND POWDER SULFUR MARKET, BY PRODUCT, 2021-2030 (USD THOUSAND)
TABLE 108 THAILAND POWDER SULFUR MARKET, BY PRODUCT, 2021-2030 (TONS)
TABLE 109 THAILAND POWDER SULFUR MARKET, BY FINENESS, 2021-2030 (USD THOUSAND)
TABLE 110 THAILAND POWDER SULFUR MARKET, BY FINENESS, 2021-2030 (TONS)
TABLE 111 MALAYSIA POWDER SULFUR MARKET, BY GRADE, 2021-2030 (USD THOUSAND)
TABLE 112 MALAYSIA POWDER SULFUR MARKET, BY GRADE, 2021-2030 (TONS)
TABLE 113 MALAYSIA AGRICULTURAL GRADE IN POWDER SULFUR MARKET, BY PRODUCT, 2021-2030 (USD THOUSAND)
TABLE 114 MALAYSIA RUBBER GRADE IN POWDER SULFUR MARKET, BY PRODUCT, 2021-2030 (USD THOUSAND)
TABLE 115 MALAYSIA RUBBER GRADE IN POWDER SULFUR MARKET, BY TYPE, 2021-2030 (USD THOUSAND)
TABLE 116 MALAYSIA INDUSTRIAL GRADE IN POWDER SULFUR MARKET, BY PRODUCT, 2021-2030 (USD THOUSAND)
TABLE 117 MALAYSIA PHARMA GRADE IN POWDER SULFUR MARKET, BY PRODUCT, 2021-2030 (USD THOUSAND)
TABLE 118 MALAYSIA FOOD GRADE IN POWDER SULFUR MARKET, BY PRODUCT, 2021-2030 (USD THOUSAND)
TABLE 119 MALAYSIA OTHERS IN POWDER SULFUR MARKET, BY PRODUCT, 2021-2030 (USD THOUSAND)
TABLE 120 MALAYSIA POWDER SULFUR MARKET, BY PRODUCT, 2021-2030 (USD THOUSAND)
TABLE 121 MALAYSIA POWDER SULFUR MARKET, BY PRODUCT, 2021-2030 (TONS)
TABLE 122 MALAYSIA POWDER SULFUR MARKET, BY FINENESS, 2021-2030 (USD THOUSAND)
TABLE 123 MALAYSIA POWDER SULFUR MARKET, BY FINENESS, 2021-2030 (TONS)
TABLE 124 AUSTRALIA & NEW ZEALAND POWDER SULFUR MARKET, BY GRADE, 2021-2030 (USD THOUSAND)
TABLE 125 AUSTRALIA & NEW ZEALAND POWDER SULFUR MARKET, BY GRADE, 2021-2030 (TONS)
TABLE 126 AUSTRALIA & NEW ZEALAND AGRICULTURAL GRADE IN POWDER SULFUR MARKET, BY PRODUCT, 2021-2030 (USD THOUSAND)
TABLE 127 AUSTRALIA & NEW ZEALAND RUBBER GRADE IN POWDER SULFUR MARKET, BY PRODUCT, 2021-2030 (USD THOUSAND)
TABLE 128 AUSTRALIA & NEW ZEALAND RUBBER GRADE IN POWDER SULFUR MARKET, BY TYPE, 2021-2030 (USD THOUSAND)
TABLE 129 AUSTRALIA & NEW ZEALAND INDUSTRIAL GRADE IN POWDER SULFUR MARKET, BY PRODUCT, 2021-2030 (USD THOUSAND)
TABLE 130 AUSTRALIA & NEW ZEALAND PHARMA GRADE IN POWDER SULFUR MARKET, BY PRODUCT, 2021-2030 (USD THOUSAND)
TABLE 131 AUSTRALIA & NEW ZEALAND FOOD GRADE IN POWDER SULFUR MARKET, BY PRODUCT, 2021-2030 (USD THOUSAND)
TABLE 132 AUSTRALIA & NEW ZEALAND OTHERS IN POWDER SULFUR MARKET, BY PRODUCT, 2021-2030 (USD THOUSAND)
TABLE 133 AUSTRALIA & NEW ZEALAND POWDER SULFUR MARKET, BY PRODUCT, 2021-2030 (USD THOUSAND)
TABLE 134 AUSTRALIA & NEW ZEALAND POWDER SULFUR MARKET, BY PRODUCT, 2021-2030 (TONS)
TABLE 135 AUSTRALIA & NEW ZEALAND POWDER SULFUR MARKET, BY FINENESS, 2021-2030 (USD THOUSAND)
TABLE 136 AUSTRALIA & NEW ZEALAND POWDER SULFUR MARKET, BY FINENESS, 2021-2030 (TONS)
TABLE 137 SINGAPORE POWDER SULFUR MARKET, BY GRADE, 2021-2030 (USD THOUSAND)
TABLE 138 SINGAPORE POWDER SULFUR MARKET, BY GRADE, 2021-2030 (TONS)
TABLE 139 SINGAPORE AGRICULTURAL GRADE IN POWDER SULFUR MARKET, BY PRODUCT, 2021-2030 (USD THOUSAND)
TABLE 140 SINGAPORE RUBBER GRADE IN POWDER SULFUR MARKET, BY PRODUCT, 2021-2030 (USD THOUSAND)
TABLE 141 SINGAPORE RUBBER GRADE IN POWDER SULFUR MARKET, BY TYPE, 2021-2030 (USD THOUSAND)
TABLE 142 SINGAPORE INDUSTRIAL GRADE IN POWDER SULFUR MARKET, BY PRODUCT, 2021-2030 (USD THOUSAND)
TABLE 143 SINGAPORE PHARMA GRADE IN POWDER SULFUR MARKET, BY PRODUCT, 2021-2030 (USD THOUSAND)
TABLE 144 SINGAPORE FOOD GRADE IN POWDER SULFUR MARKET, BY PRODUCT, 2021-2030 (USD THOUSAND)
TABLE 145 SINGAPORE OTHERS IN POWDER SULFUR MARKET, BY PRODUCT, 2021-2030 (USD THOUSAND)
TABLE 146 SINGAPORE POWDER SULFUR MARKET, BY PRODUCT, 2021-2030 (USD THOUSAND)
TABLE 147 SINGAPORE POWDER SULFUR MARKET, BY PRODUCT, 2021-2030 (TONS)
TABLE 148 SINGAPORE POWDER SULFUR MARKET, BY FINENESS, 2021-2030 (USD THOUSAND)
TABLE 149 SINGAPORE POWDER SULFUR MARKET, BY FINENESS, 2021-2030 (TONS)
TABLE 150 PHILIPPINES POWDER SULFUR MARKET, BY GRADE, 2021-2030 (USD THOUSAND)
TABLE 151 PHILIPPINES POWDER SULFUR MARKET, BY GRADE, 2021-2030 (TONS)
TABLE 152 PHILIPPINES AGRICULTURAL GRADE IN POWDER SULFUR MARKET, BY PRODUCT, 2021-2030 (USD THOUSAND)
TABLE 153 PHILIPPINES RUBBER GRADE IN POWDER SULFUR MARKET, BY PRODUCT, 2021-2030 (USD THOUSAND)
TABLE 154 PHILIPPINES RUBBER GRADE IN POWDER SULFUR MARKET, BY TYPE, 2021-2030 (USD THOUSAND)
TABLE 155 PHILIPPINES INDUSTRIAL GRADE IN POWDER SULFUR MARKET, BY PRODUCT, 2021-2030 (USD THOUSAND)
TABLE 156 PHILIPPINES PHARMA GRADE IN POWDER SULFUR MARKET, BY PRODUCT, 2021-2030 (USD THOUSAND)
TABLE 157 PHILIPPINES FOOD GRADE IN POWDER SULFUR MARKET, BY PRODUCT, 2021-2030 (USD THOUSAND)
TABLE 158 PHILIPPINES OTHERS IN POWDER SULFUR MARKET, BY PRODUCT, 2021-2030 (USD THOUSAND)
TABLE 159 PHILIPPINES POWDER SULFUR MARKET, BY PRODUCT, 2021-2030 (USD THOUSAND)
TABLE 160 PHILIPPINES POWDER SULFUR MARKET, BY PRODUCT, 2021-2030 (TONS)
TABLE 161 PHILIPPINES POWDER SULFUR MARKET, BY FINENESS, 2021-2030 (USD THOUSAND)
TABLE 162 PHILIPPINES POWDER SULFUR MARKET, BY FINENESS, 2021-2030 (TONS)
TABLE 163 REST OF ASIA-PACIFIC POWDER SULFUR MARKET, BY GRADE, 2021-2030 (USD THOUSAND)
TABLE 164 REST OF ASIA-PACIFIC POWDER SULFUR MARKET, BY GRADE, 2021-2030 (TONS)
TABLE 165 EUROPE POWDER SULFUR MARKET, BY COUNTRY, 2021-2030 (USD THOUSAND)
TABLE 166 EUROPE POWDER SULFUR MARKET, BY COUNTRY, 2021-2030 (TONS)
TABLE 167 EUROPE POWDER SULFUR MARKET, BY GRADE, 2021-2030 (USD THOUSAND)
TABLE 168 EUROPE POWDER SULFUR MARKET, BY GRADE, 2021-2030 (TONS)
TABLE 169 EUROPE AGRICULTURAL GRADE IN POWDER SULFUR MARKET, BY PRODUCT, 2021-2030 (USD THOUSAND)
TABLE 170 EUROPE RUBBER GRADE IN POWDER SULFUR MARKET, BY PRODUCT, 2021-2030 (USD THOUSAND)
TABLE 171 EUROPE RUBBER GRADE IN POWDER SULFUR MARKET, BY TYPE, 2021-2030 (USD THOUSAND)
TABLE 172 EUROPE INDUSTRIAL GRADE IN POWDER SULFUR MARKET, BY PRODUCT, 2021-2030 (USD THOUSAND)
TABLE 173 EUROPE PHARMA GRADE IN POWDER SULFUR MARKET, BY PRODUCT, 2021-2030 (USD THOUSAND)
TABLE 174 EUROPE FOOD GRADE IN POWDER SULFUR MARKET, BY PRODUCT, 2021-2030 (USD THOUSAND)
TABLE 175 EUROPE OTHERS IN POWDER SULFUR MARKET, BY PRODUCT, 2021-2030 (USD THOUSAND)
TABLE 176 EUROPE POWDER SULFUR MARKET, BY PRODUCT, 2021-2030 (USD THOUSAND)
TABLE 177 EUROPE POWDER SULFUR MARKET, BY PRODUCT, 2021-2030 (TONS)
TABLE 178 EUROPE POWDER SULFUR MARKET, BY FINENESS, 2021-2030 (USD THOUSAND)
TABLE 179 EUROPE POWDER SULFUR MARKET, BY FINENESS, 2021-2030 (TONS)
TABLE 180 RUSSIA POWDER SULFUR MARKET, BY GRADE, 2021-2030 (USD THOUSAND)
TABLE 181 RUSSIA POWDER SULFUR MARKET, BY GRADE, 2021-2030 (TONS)
TABLE 182 RUSSIA AGRICULTURAL GRADE IN POWDER SULFUR MARKET, BY PRODUCT, 2021-2030 (USD THOUSAND)
TABLE 183 RUSSIA RUBBER GRADE IN POWDER SULFUR MARKET, BY PRODUCT, 2021-2030 (USD THOUSAND)
TABLE 184 RUSSIA RUBBER GRADE IN POWDER SULFUR MARKET, BY TYPE, 2021-2030 (USD THOUSAND)
TABLE 185 RUSSIA INDUSTRIAL GRADE IN POWDER SULFUR MARKET, BY PRODUCT, 2021-2030 (USD THOUSAND)
TABLE 186 RUSSIA PHARMA GRADE IN POWDER SULFUR MARKET, BY PRODUCT, 2021-2030 (USD THOUSAND)
TABLE 187 RUSSIA FOOD GRADE IN POWDER SULFUR MARKET, BY PRODUCT, 2021-2030 (USD THOUSAND)
TABLE 188 RUSSIA OTHERS IN POWDER SULFUR MARKET, BY PRODUCT, 2021-2030 (USD THOUSAND)
TABLE 189 RUSSIA POWDER SULFUR MARKET, BY PRODUCT, 2021-2030 (USD THOUSAND)
TABLE 190 RUSSIA POWDER SULFUR MARKET, BY PRODUCT, 2021-2030 (TONS)
TABLE 191 RUSSIA POWDER SULFUR MARKET, BY FINENESS, 2021-2030 (USD THOUSAND)
TABLE 192 RUSSIA POWDER SULFUR MARKET, BY FINENESS, 2021-2030 (TONS)
TABLE 193 GERMANY POWDER SULFUR MARKET, BY GRADE, 2021-2030 (USD THOUSAND)
TABLE 194 GERMANY POWDER SULFUR MARKET, BY GRADE, 2021-2030 (TONS)
TABLE 195 GERMANY AGRICULTURAL GRADE IN POWDER SULFUR MARKET, BY PRODUCT, 2021-2030 (USD THOUSAND)
TABLE 196 GERMANY RUBBER GRADE IN POWDER SULFUR MARKET, BY PRODUCT, 2021-2030 (USD THOUSAND)
TABLE 197 GERMANY RUBBER GRADE IN POWDER SULFUR MARKET, BY TYPE, 2021-2030 (USD THOUSAND)
TABLE 198 GERMANY INDUSTRIAL GRADE IN POWDER SULFUR MARKET, BY PRODUCT, 2021-2030 (USD THOUSAND)
TABLE 199 GERMANY PHARMA GRADE IN POWDER SULFUR MARKET, BY PRODUCT, 2021-2030 (USD THOUSAND)
TABLE 200 GERMANY FOOD GRADE IN POWDER SULFUR MARKET, BY PRODUCT, 2021-2030 (USD THOUSAND)
TABLE 201 GERMANY OTHERS IN POWDER SULFUR MARKET, BY PRODUCT, 2021-2030 (USD THOUSAND)
TABLE 202 GERMANY POWDER SULFUR MARKET, BY PRODUCT, 2021-2030 (USD THOUSAND)
TABLE 203 GERMANY POWDER SULFUR MARKET, BY PRODUCT, 2021-2030 (TONS)
TABLE 204 GERMANY POWDER SULFUR MARKET, BY FINENESS, 2021-2030 (USD THOUSAND)
TABLE 205 GERMANY POWDER SULFUR MARKET, BY FINENESS, 2021-2030 (TONS)
TABLE 206 FRANCE POWDER SULFUR MARKET, BY GRADE, 2021-2030 (USD THOUSAND)
TABLE 207 FRANCE POWDER SULFUR MARKET, BY GRADE, 2021-2030 (TONS)
TABLE 208 FRANCE AGRICULTURAL GRADE IN POWDER SULFUR MARKET, BY PRODUCT, 2021-2030 (USD THOUSAND)
TABLE 209 FRANCE RUBBER GRADE IN POWDER SULFUR MARKET, BY PRODUCT, 2021-2030 (USD THOUSAND)
TABLE 210 FRANCE RUBBER GRADE IN POWDER SULFUR MARKET, BY TYPE, 2021-2030 (USD THOUSAND)
TABLE 211 FRANCE INDUSTRIAL GRADE IN POWDER SULFUR MARKET, BY PRODUCT, 2021-2030 (USD THOUSAND)
TABLE 212 FRANCE PHARMA GRADE IN POWDER SULFUR MARKET, BY PRODUCT, 2021-2030 (USD THOUSAND)
TABLE 213 FRANCE FOOD GRADE IN POWDER SULFUR MARKET, BY PRODUCT, 2021-2030 (USD THOUSAND)
TABLE 214 FRANCE OTHERS IN POWDER SULFUR MARKET, BY PRODUCT, 2021-2030 (USD THOUSAND)
TABLE 215 FRANCE POWDER SULFUR MARKET, BY PRODUCT, 2021-2030 (USD THOUSAND)
TABLE 216 FRANCE POWDER SULFUR MARKET, BY PRODUCT, 2021-2030 (TONS)
TABLE 217 FRANCE POWDER SULFUR MARKET, BY FINENESS, 2021-2030 (USD THOUSAND)
TABLE 218 FRANCE POWDER SULFUR MARKET, BY FINENESS, 2021-2030 (TONS)
TABLE 219 U.K. POWDER SULFUR MARKET, BY GRADE, 2021-2030 (USD THOUSAND)
TABLE 220 U.K. POWDER SULFUR MARKET, BY GRADE, 2021-2030 (TONS)
TABLE 221 U.K. AGRICULTURAL GRADE IN POWDER SULFUR MARKET, BY PRODUCT, 2021-2030 (USD THOUSAND)
TABLE 222 U.K. RUBBER GRADE IN POWDER SULFUR MARKET, BY PRODUCT, 2021-2030 (USD THOUSAND)
TABLE 223 U.K. RUBBER GRADE IN POWDER SULFUR MARKET, BY TYPE, 2021-2030 (USD THOUSAND)
TABLE 224 U.K. INDUSTRIAL GRADE IN POWDER SULFUR MARKET, BY PRODUCT, 2021-2030 (USD THOUSAND)
TABLE 225 U.K. PHARMA GRADE IN POWDER SULFUR MARKET, BY PRODUCT, 2021-2030 (USD THOUSAND)
TABLE 226 U.K. FOOD GRADE IN POWDER SULFUR MARKET, BY PRODUCT, 2021-2030 (USD THOUSAND)
TABLE 227 U.K. OTHERS IN POWDER SULFUR MARKET, BY PRODUCT, 2021-2030 (USD THOUSAND)
TABLE 228 U.K. POWDER SULFUR MARKET, BY PRODUCT, 2021-2030 (USD THOUSAND)
TABLE 229 U.K. POWDER SULFUR MARKET, BY PRODUCT, 2021-2030 (TONS)
TABLE 230 U.K. POWDER SULFUR MARKET, BY FINENESS, 2021-2030 (USD THOUSAND)
TABLE 231 U.K. POWDER SULFUR MARKET, BY FINENESS, 2021-2030 (TONS)
TABLE 232 NETHERLANDS POWDER SULFUR MARKET, BY GRADE, 2021-2030 (USD THOUSAND)
TABLE 233 NETHERLANDS POWDER SULFUR MARKET, BY GRADE, 2021-2030 (TONS)
TABLE 234 NETHERLANDS AGRICULTURAL GRADE IN POWDER SULFUR MARKET, BY PRODUCT, 2021-2030 (USD THOUSAND)
TABLE 235 NETHERLANDS RUBBER GRADE IN POWDER SULFUR MARKET, BY PRODUCT, 2021-2030 (USD THOUSAND)
TABLE 236 NETHERLANDS RUBBER GRADE IN POWDER SULFUR MARKET, BY TYPE, 2021-2030 (USD THOUSAND)
TABLE 237 NETHERLANDS INDUSTRIAL GRADE IN POWDER SULFUR MARKET, BY PRODUCT, 2021-2030 (USD THOUSAND)
TABLE 238 NETHERLANDS PHARMA GRADE IN POWDER SULFUR MARKET, BY PRODUCT, 2021-2030 (USD THOUSAND)
TABLE 239 NETHERLANDS FOOD GRADE IN POWDER SULFUR MARKET, BY PRODUCT, 2021-2030 (USD THOUSAND)
TABLE 240 NETHERLANDS OTHERS IN POWDER SULFUR MARKET, BY PRODUCT, 2021-2030 (USD THOUSAND)
TABLE 241 NETHERLANDS POWDER SULFUR MARKET, BY PRODUCT, 2021-2030 (USD THOUSAND)
TABLE 242 NETHERLANDS POWDER SULFUR MARKET, BY PRODUCT, 2021-2030 (TONS)
TABLE 243 NETHERLANDS POWDER SULFUR MARKET, BY FINENESS, 2021-2030 (USD THOUSAND)
TABLE 244 NETHERLANDS POWDER SULFUR MARKET, BY FINENESS, 2021-2030 (TONS)
TABLE 245 TURKEY POWDER SULFUR MARKET, BY GRADE, 2021-2030 (USD THOUSAND)
TABLE 246 TURKEY POWDER SULFUR MARKET, BY GRADE, 2021-2030 (TONS)
TABLE 247 TURKEY AGRICULTURAL GRADE IN POWDER SULFUR MARKET, BY PRODUCT, 2021-2030 (USD THOUSAND)
TABLE 248 TURKEY RUBBER GRADE IN POWDER SULFUR MARKET, BY PRODUCT, 2021-2030 (USD THOUSAND)
TABLE 249 TURKEY RUBBER GRADE IN POWDER SULFUR MARKET, BY TYPE, 2021-2030 (USD THOUSAND)
TABLE 250 TURKEY INDUSTRIAL GRADE IN POWDER SULFUR MARKET, BY PRODUCT, 2021-2030 (USD THOUSAND)
TABLE 251 TURKEY PHARMA GRADE IN POWDER SULFUR MARKET, BY PRODUCT, 2021-2030 (USD THOUSAND)
TABLE 252 TURKEY FOOD GRADE IN POWDER SULFUR MARKET, BY PRODUCT, 2021-2030 (USD THOUSAND)
TABLE 253 TURKEY OTHERS IN POWDER SULFUR MARKET, BY PRODUCT, 2021-2030 (USD THOUSAND)
TABLE 254 TURKEY POWDER SULFUR MARKET, BY PRODUCT, 2021-2030 (USD THOUSAND)
TABLE 255 TURKEY POWDER SULFUR MARKET, BY PRODUCT, 2021-2030 (TONS)
TABLE 256 TURKEY POWDER SULFUR MARKET, BY FINENESS, 2021-2030 (USD THOUSAND)
TABLE 257 TURKEY POWDER SULFUR MARKET, BY FINENESS, 2021-2030 (TONS)
TABLE 258 ITALY POWDER SULFUR MARKET, BY GRADE, 2021-2030 (USD THOUSAND)
TABLE 259 ITALY POWDER SULFUR MARKET, BY GRADE, 2021-2030 (TONS)
TABLE 260 ITALY AGRICULTURAL GRADE IN POWDER SULFUR MARKET, BY PRODUCT, 2021-2030 (USD THOUSAND)
TABLE 261 ITALY RUBBER GRADE IN POWDER SULFUR MARKET, BY PRODUCT, 2021-2030 (USD THOUSAND)
TABLE 262 ITALY RUBBER GRADE IN POWDER SULFUR MARKET, BY TYPE, 2021-2030 (USD THOUSAND)
TABLE 263 ITALY INDUSTRIAL GRADE IN POWDER SULFUR MARKET, BY PRODUCT, 2021-2030 (USD THOUSAND)
TABLE 264 ITALY PHARMA GRADE IN POWDER SULFUR MARKET, BY PRODUCT, 2021-2030 (USD THOUSAND)
TABLE 265 ITALY FOOD GRADE IN POWDER SULFUR MARKET, BY PRODUCT, 2021-2030 (USD THOUSAND)
TABLE 266 ITALY OTHERS IN POWDER SULFUR MARKET, BY PRODUCT, 2021-2030 (USD THOUSAND)
TABLE 267 ITALY POWDER SULFUR MARKET, BY PRODUCT, 2021-2030 (USD THOUSAND)
TABLE 268 ITALY POWDER SULFUR MARKET, BY PRODUCT, 2021-2030 (TONS)
TABLE 269 ITALY POWDER SULFUR MARKET, BY FINENESS, 2021-2030 (USD THOUSAND)
TABLE 270 ITALY POWDER SULFUR MARKET, BY FINENESS, 2021-2030 (TONS)
TABLE 271 SPAIN POWDER SULFUR MARKET, BY GRADE, 2021-2030 (USD THOUSAND)
TABLE 272 SPAIN POWDER SULFUR MARKET, BY GRADE, 2021-2030 (TONS)
TABLE 273 SPAIN AGRICULTURAL GRADE IN POWDER SULFUR MARKET, BY PRODUCT, 2021-2030 (USD THOUSAND)
TABLE 274 SPAIN RUBBER GRADE IN POWDER SULFUR MARKET, BY PRODUCT, 2021-2030 (USD THOUSAND)
TABLE 275 SPAIN RUBBER GRADE IN POWDER SULFUR MARKET, BY TYPE, 2021-2030 (USD THOUSAND)
TABLE 276 SPAIN INDUSTRIAL GRADE IN POWDER SULFUR MARKET, BY PRODUCT, 2021-2030 (USD THOUSAND)
TABLE 277 SPAIN PHARMA GRADE IN POWDER SULFUR MARKET, BY PRODUCT, 2021-2030 (USD THOUSAND)
TABLE 278 SPAIN FOOD GRADE IN POWDER SULFUR MARKET, BY PRODUCT, 2021-2030 (USD THOUSAND)
TABLE 279 SPAIN OTHERS IN POWDER SULFUR MARKET, BY PRODUCT, 2021-2030 (USD THOUSAND)
TABLE 280 SPAIN POWDER SULFUR MARKET, BY PRODUCT, 2021-2030 (USD THOUSAND)
TABLE 281 SPAIN POWDER SULFUR MARKET, BY PRODUCT, 2021-2030 (TONS)
TABLE 282 SPAIN POWDER SULFUR MARKET, BY FINENESS, 2021-2030 (USD THOUSAND)
TABLE 283 SPAIN POWDER SULFUR MARKET, BY FINENESS, 2021-2030 (TONS)
TABLE 284 BELGIUM POWDER SULFUR MARKET, BY GRADE, 2021-2030 (USD THOUSAND)
TABLE 285 BELGIUM POWDER SULFUR MARKET, BY GRADE, 2021-2030 (TONS)
TABLE 286 BELGIUM AGRICULTURAL GRADE IN POWDER SULFUR MARKET, BY PRODUCT, 2021-2030 (USD THOUSAND)
TABLE 287 BELGIUM RUBBER GRADE IN POWDER SULFUR MARKET, BY PRODUCT, 2021-2030 (USD THOUSAND)
TABLE 288 BELGIUM RUBBER GRADE IN POWDER SULFUR MARKET, BY TYPE, 2021-2030 (USD THOUSAND)
TABLE 289 BELGIUM INDUSTRIAL GRADE IN POWDER SULFUR MARKET, BY PRODUCT, 2021-2030 (USD THOUSAND)
TABLE 290 BELGIUM PHARMA GRADE IN POWDER SULFUR MARKET, BY PRODUCT, 2021-2030 (USD THOUSAND)
TABLE 291 BELGIUM FOOD GRADE IN POWDER SULFUR MARKET, BY PRODUCT, 2021-2030 (USD THOUSAND)
TABLE 292 BELGIUM OTHERS IN POWDER SULFUR MARKET, BY PRODUCT, 2021-2030 (USD THOUSAND)
TABLE 293 BELGIUM POWDER SULFUR MARKET, BY PRODUCT, 2021-2030 (USD THOUSAND)
TABLE 294 BELGIUM POWDER SULFUR MARKET, BY PRODUCT, 2021-2030 (TONS)
TABLE 295 BELGIUM POWDER SULFUR MARKET, BY FINENESS, 2021-2030 (USD THOUSAND)
TABLE 296 BELGIUM POWDER SULFUR MARKET, BY FINENESS, 2021-2030 (TONS)
TABLE 297 SWITZERLAND POWDER SULFUR MARKET, BY GRADE, 2021-2030 (USD THOUSAND)
TABLE 298 SWITZERLAND POWDER SULFUR MARKET, BY GRADE, 2021-2030 (TONS)
TABLE 299 SWITZERLAND AGRICULTURAL GRADE IN POWDER SULFUR MARKET, BY PRODUCT, 2021-2030 (USD THOUSAND)
TABLE 300 SWITZERLAND RUBBER GRADE IN POWDER SULFUR MARKET, BY PRODUCT, 2021-2030 (USD THOUSAND)
TABLE 301 SWITZERLAND RUBBER GRADE IN POWDER SULFUR MARKET, BY TYPE, 2021-2030 (USD THOUSAND)
TABLE 302 SWITZERLAND INDUSTRIAL GRADE IN POWDER SULFUR MARKET, BY PRODUCT, 2021-2030 (USD THOUSAND)
TABLE 303 SWITZERLAND PHARMA GRADE IN POWDER SULFUR MARKET, BY PRODUCT, 2021-2030 (USD THOUSAND)
TABLE 304 SWITZERLAND FOOD GRADE IN POWDER SULFUR MARKET, BY PRODUCT, 2021-2030 (USD THOUSAND)
TABLE 305 SWITZERLAND OTHERS IN POWDER SULFUR MARKET, BY PRODUCT, 2021-2030 (USD THOUSAND)
TABLE 306 SWITZERLAND POWDER SULFUR MARKET, BY PRODUCT, 2021-2030 (USD THOUSAND)
TABLE 307 SWITZERLAND POWDER SULFUR MARKET, BY PRODUCT, 2021-2030 (TONS)
TABLE 308 SWITZERLAND POWDER SULFUR MARKET, BY FINENESS, 2021-2030 (USD THOUSAND)
TABLE 309 SWITZERLAND POWDER SULFUR MARKET, BY FINENESS, 2021-2030 (TONS)
TABLE 310 LUXEMBOURG POWDER SULFUR MARKET, BY GRADE, 2021-2030 (USD THOUSAND)
TABLE 311 LUXEMBOURG POWDER SULFUR MARKET, BY GRADE, 2021-2030 (TONS)
TABLE 312 LUXEMBOURG AGRICULTURAL GRADE IN POWDER SULFUR MARKET, BY PRODUCT, 2021-2030 (USD THOUSAND)
TABLE 313 LUXEMBOURG RUBBER GRADE IN POWDER SULFUR MARKET, BY PRODUCT, 2021-2030 (USD THOUSAND)
TABLE 314 LUXEMBOURG RUBBER GRADE IN POWDER SULFUR MARKET, BY TYPE, 2021-2030 (USD THOUSAND)
TABLE 315 LUXEMBOURG INDUSTRIAL GRADE IN POWDER SULFUR MARKET, BY PRODUCT, 2021-2030 (USD THOUSAND)
TABLE 316 LUXEMBOURG PHARMA GRADE IN POWDER SULFUR MARKET, BY PRODUCT, 2021-2030 (USD THOUSAND)
TABLE 317 LUXEMBOURG FOOD GRADE IN POWDER SULFUR MARKET, BY PRODUCT, 2021-2030 (USD THOUSAND)
TABLE 318 LUXEMBOURG OTHERS IN POWDER SULFUR MARKET, BY PRODUCT, 2021-2030 (USD THOUSAND)
TABLE 319 LUXEMBOURG POWDER SULFUR MARKET, BY PRODUCT, 2021-2030 (USD THOUSAND)
TABLE 320 LUXEMBOURG POWDER SULFUR MARKET, BY PRODUCT, 2021-2030 (TONS)
TABLE 321 LUXEMBOURG POWDER SULFUR MARKET, BY FINENESS, 2021-2030 (USD THOUSAND)
TABLE 322 LUXEMBOURG POWDER SULFUR MARKET, BY FINENESS, 2021-2030 (TONS)
TABLE 323 REST OF EUROPE POWDER SULFUR MARKET, BY GRADE, 2021-2030 (USD THOUSAND)
TABLE 324 REST OF EUROPE POWDER SULFUR MARKET, BY GRADE, 2021-2030 (TONS)
TABLE 325 NORTH AMERICA POWDER SULFUR MARKET, BY COUNTRY, 2021-2030 (USD THOUSAND)
TABLE 326 NORTH AMERICA POWDER SULFUR MARKET, BY COUNTRY, 2021-2030 (TONS)
TABLE 327 NORTH AMERICA POWDER SULFUR MARKET, BY GRADE, 2021-2030 (USD THOUSAND)
TABLE 328 NORTH AMERICA POWDER SULFUR MARKET, BY GRADE, 2021-2030 (TONS)
TABLE 329 NORTH AMERICA AGRICULTURAL GRADE IN POWDER SULFUR MARKET, BY PRODUCT, 2021-2030 (USD THOUSAND)
TABLE 330 NORTH AMERICA RUBBER GRADE IN POWDER SULFUR MARKET, BY PRODUCT, 2021-2030 (USD THOUSAND)
TABLE 331 NORTH AMERICA RUBBER GRADE IN POWDER SULFUR MARKET, BY TYPE, 2021-2030 (USD THOUSAND)
TABLE 332 NORTH AMERICA INDUSTRIAL GRADE IN POWDER SULFUR MARKET, BY PRODUCT, 2021-2030 (USD THOUSAND)
TABLE 333 NORTH AMERICA PHARMA GRADE IN POWDER SULFUR MARKET, BY PRODUCT, 2021-2030 (USD THOUSAND)
TABLE 334 NORTH AMERICA FOOD GRADE IN POWDER SULFUR MARKET, BY PRODUCT, 2021-2030 (USD THOUSAND)
TABLE 335 NORTH AMERICA OTHERS IN POWDER SULFUR MARKET, BY PRODUCT, 2021-2030 (USD THOUSAND)
TABLE 336 NORTH AMERICA POWDER SULFUR MARKET, BY PRODUCT, 2021-2030 (USD THOUSAND)
TABLE 337 NORTH AMERICA POWDER SULFUR MARKET, BY PRODUCT, 2021-2030 (TONS)
TABLE 338 NORTH AMERICA POWDER SULFUR MARKET, BY FINENESS, 2021-2030 (USD THOUSAND)
TABLE 339 NORTH AMERICA POWDER SULFUR MARKET, BY FINENESS, 2021-2030 (TONS)
TABLE 340 U.S. POWDER SULFUR MARKET, BY GRADE, 2021-2030 (USD THOUSAND)
TABLE 341 U.S. POWDER SULFUR MARKET, BY GRADE, 2021-2030 (TONS)
TABLE 342 U.S. AGRICULTURAL GRADE IN POWDER SULFUR MARKET, BY PRODUCT, 2021-2030 (USD THOUSAND)
TABLE 343 U.S. RUBBER GRADE IN POWDER SULFUR MARKET, BY PRODUCT, 2021-2030 (USD THOUSAND)
TABLE 344 U.S. RUBBER GRADE IN POWDER SULFUR MARKET, BY TYPE, 2021-2030 (USD THOUSAND)
TABLE 345 U.S. INDUSTRIAL GRADE IN POWDER SULFUR MARKET, BY PRODUCT, 2021-2030 (USD THOUSAND)
TABLE 346 U.S. PHARMA GRADE IN POWDER SULFUR MARKET, BY PRODUCT, 2021-2030 (USD THOUSAND)
TABLE 347 U.S. FOOD GRADE IN POWDER SULFUR MARKET, BY PRODUCT, 2021-2030 (USD THOUSAND)
TABLE 348 U.S. OTHERS IN POWDER SULFUR MARKET, BY PRODUCT, 2021-2030 (USD THOUSAND)
TABLE 349 U.S. POWDER SULFUR MARKET, BY PRODUCT, 2021-2030 (USD THOUSAND)
TABLE 350 U.S. POWDER SULFUR MARKET, BY PRODUCT, 2021-2030 (TONS)
TABLE 351 U.S. POWDER SULFUR MARKET, BY FINENESS, 2021-2030 (USD THOUSAND)
TABLE 352 U.S. POWDER SULFUR MARKET, BY FINENESS, 2021-2030 (TONS)
TABLE 353 MEXICO POWDER SULFUR MARKET, BY GRADE, 2021-2030 (USD THOUSAND)
TABLE 354 MEXICO POWDER SULFUR MARKET, BY GRADE, 2021-2030 (TONS)
TABLE 355 MEXICO AGRICULTURAL GRADE IN POWDER SULFUR MARKET, BY PRODUCT, 2021-2030 (USD THOUSAND)
TABLE 356 MEXICO RUBBER GRADE IN POWDER SULFUR MARKET, BY PRODUCT, 2021-2030 (USD THOUSAND)
TABLE 357 MEXICO RUBBER GRADE IN POWDER SULFUR MARKET, BY TYPE, 2021-2030 (USD THOUSAND)
TABLE 358 MEXICO INDUSTRIAL GRADE IN POWDER SULFUR MARKET, BY PRODUCT, 2021-2030 (USD THOUSAND)
TABLE 359 MEXICO PHARMA GRADE IN POWDER SULFUR MARKET, BY PRODUCT, 2021-2030 (USD THOUSAND)
TABLE 360 MEXICO FOOD GRADE IN POWDER SULFUR MARKET, BY PRODUCT, 2021-2030 (USD THOUSAND)
TABLE 361 MEXICO OTHERS IN POWDER SULFUR MARKET, BY PRODUCT, 2021-2030 (USD THOUSAND)
TABLE 362 MEXICO POWDER SULFUR MARKET, BY PRODUCT, 2021-2030 (USD THOUSAND)
TABLE 363 MEXICO POWDER SULFUR MARKET, BY PRODUCT, 2021-2030 (TONS)
TABLE 364 MEXICO POWDER SULFUR MARKET, BY FINENESS, 2021-2030 (USD THOUSAND)
TABLE 365 MEXICO POWDER SULFUR MARKET, BY FINENESS, 2021-2030 (TONS)
TABLE 366 CANADA POWDER SULFUR MARKET, BY GRADE, 2021-2030 (USD THOUSAND)
TABLE 367 CANADA POWDER SULFUR MARKET, BY GRADE, 2021-2030 (TONS)
TABLE 368 CANADA AGRICULTURAL GRADE IN POWDER SULFUR MARKET, BY PRODUCT, 2021-2030 (USD THOUSAND)
TABLE 369 CANADA RUBBER GRADE IN POWDER SULFUR MARKET, BY PRODUCT, 2021-2030 (USD THOUSAND)
TABLE 370 CANADA RUBBER GRADE IN POWDER SULFUR MARKET, BY TYPE, 2021-2030 (USD THOUSAND)
TABLE 371 CANADA INDUSTRIAL GRADE IN POWDER SULFUR MARKET, BY PRODUCT, 2021-2030 (USD THOUSAND)
TABLE 372 CANADA PHARMA GRADE IN POWDER SULFUR MARKET, BY PRODUCT, 2021-2030 (USD THOUSAND)
TABLE 373 CANADA FOOD GRADE IN POWDER SULFUR MARKET, BY PRODUCT, 2021-2030 (USD THOUSAND)
TABLE 374 CANADA OTHERS IN POWDER SULFUR MARKET, BY PRODUCT, 2021-2030 (USD THOUSAND)
TABLE 375 CANADA POWDER SULFUR MARKET, BY PRODUCT, 2021-2030 (USD THOUSAND)
TABLE 376 CANADA POWDER SULFUR MARKET, BY PRODUCT, 2021-2030 (TONS)
TABLE 377 CANADA POWDER SULFUR MARKET, BY FINENESS, 2021-2030 (USD THOUSAND)
TABLE 378 CANADA POWDER SULFUR MARKET, BY FINENESS, 2021-2030 (TONS)
TABLE 379 MIDDLE EAST AND AFRICA POWDER SULFUR MARKET, BY COUNTRY, 2021-2030 (USD THOUSAND)
TABLE 380 MIDDLE EAST AND AFRICA POWDER SULFUR MARKET, BY COUNTRY, 2021-2030 (TONS)
TABLE 381 MIDDLE EAST AND AFRICA POWDER SULFUR MARKET, BY GRADE, 2021-2030 (USD THOUSAND)
TABLE 382 MIDDLE EAST AND AFRICA POWDER SULFUR MARKET, BY GRADE, 2021-2030 (TONS)
TABLE 383 MIDDLE EAST AND AFRICA AGRICULTURAL GRADE IN POWDER SULFUR MARKET, BY PRODUCT, 2021-2030 (USD THOUSAND)
TABLE 384 MIDDLE EAST AND AFRICA RUBBER GRADE IN POWDER SULFUR MARKET, BY PRODUCT, 2021-2030 (USD THOUSAND)
TABLE 385 MIDDLE EAST AND AFRICA RUBBER GRADE IN POWDER SULFUR MARKET, BY TYPE, 2021-2030 (USD THOUSAND)
TABLE 386 MIDDLE EAST AND AFRICA INDUSTRIAL GRADE IN POWDER SULFUR MARKET, BY PRODUCT, 2021-2030 (USD THOUSAND)
TABLE 387 MIDDLE EAST AND AFRICA PHARMA GRADE IN POWDER SULFUR MARKET, BY PRODUCT, 2021-2030 (USD THOUSAND)
TABLE 388 MIDDLE EAST AND AFRICA FOOD GRADE IN POWDER SULFUR MARKET, BY PRODUCT, 2021-2030 (USD THOUSAND)
TABLE 389 MIDDLE EAST AND AFRICA OTHERS IN POWDER SULFUR MARKET, BY PRODUCT, 2021-2030 (USD THOUSAND)
TABLE 390 MIDDLE EAST AND AFRICA POWDER SULFUR MARKET, BY PRODUCT, 2021-2030 (USD THOUSAND)
TABLE 391 MIDDLE EAST AND AFRICA POWDER SULFUR MARKET, BY PRODUCT, 2021-2030 (TONS)
TABLE 392 MIDDLE EAST AND AFRICA POWDER SULFUR MARKET, BY FINENESS, 2021-2030 (USD THOUSAND)
TABLE 393 MIDDLE EAST AND AFRICA POWDER SULFUR MARKET, BY FINENESS, 2021-2030 (TONS)
TABLE 394 MOROCCO POWDER SULFUR MARKET, BY GRADE, 2021-2030 (USD THOUSAND)
TABLE 395 MOROCCO POWDER SULFUR MARKET, BY GRADE, 2021-2030 (TONS)
TABLE 396 MOROCCO AGRICULTURAL GRADE IN POWDER SULFUR MARKET, BY PRODUCT, 2021-2030 (USD THOUSAND)
TABLE 397 MOROCCO RUBBER GRADE IN POWDER SULFUR MARKET, BY PRODUCT, 2021-2030 (USD THOUSAND)
TABLE 398 MOROCCO RUBBER GRADE IN POWDER SULFUR MARKET, BY TYPE, 2021-2030 (USD THOUSAND)
TABLE 399 MOROCCO INDUSTRIAL GRADE IN POWDER SULFUR MARKET, BY PRODUCT, 2021-2030 (USD THOUSAND)
TABLE 400 MOROCCO PHARMA GRADE IN POWDER SULFUR MARKET, BY PRODUCT, 2021-2030 (USD THOUSAND)
TABLE 401 MOROCCO FOOD GRADE IN POWDER SULFUR MARKET, BY PRODUCT, 2021-2030 (USD THOUSAND)
TABLE 402 MOROCCO OTHERS IN POWDER SULFUR MARKET, BY PRODUCT, 2021-2030 (USD THOUSAND)
TABLE 403 MOROCCO POWDER SULFUR MARKET, BY PRODUCT, 2021-2030 (USD THOUSAND)
TABLE 404 MOROCCO POWDER SULFUR MARKET, BY PRODUCT, 2021-2030 (TONS)
TABLE 405 MOROCCO POWDER SULFUR MARKET, BY FINENESS, 2021-2030 (USD THOUSAND)
TABLE 406 MOROCCO POWDER SULFUR MARKET, BY FINENESS, 2021-2030 (TONS)
TABLE 407 SAUDI ARABIA POWDER SULFUR MARKET, BY GRADE, 2021-2030 (USD THOUSAND)
TABLE 408 SAUDI ARABIA POWDER SULFUR MARKET, BY GRADE, 2021-2030 (TONS)
TABLE 409 SAUDI ARABIA AGRICULTURAL GRADE IN POWDER SULFUR MARKET, BY PRODUCT, 2021-2030 (USD THOUSAND)
TABLE 410 SAUDI ARABIA RUBBER GRADE IN POWDER SULFUR MARKET, BY PRODUCT, 2021-2030 (USD THOUSAND)
TABLE 411 SAUDI ARABIA RUBBER GRADE IN POWDER SULFUR MARKET, BY TYPE, 2021-2030 (USD THOUSAND)
TABLE 412 SAUDI ARABIA INDUSTRIAL GRADE IN POWDER SULFUR MARKET, BY PRODUCT, 2021-2030 (USD THOUSAND)
TABLE 413 SAUDI ARABIA PHARMA GRADE IN POWDER SULFUR MARKET, BY PRODUCT, 2021-2030 (USD THOUSAND)
TABLE 414 SAUDI ARABIA FOOD GRADE IN POWDER SULFUR MARKET, BY PRODUCT, 2021-2030 (USD THOUSAND)
TABLE 415 SAUDI ARABIA OTHERS IN POWDER SULFUR MARKET, BY PRODUCT, 2021-2030 (USD THOUSAND)
TABLE 416 SAUDI ARABIA POWDER SULFUR MARKET, BY PRODUCT, 2021-2030 (USD THOUSAND)
TABLE 417 SAUDI ARABIA POWDER SULFUR MARKET, BY PRODUCT, 2021-2030 (TONS)
TABLE 418 SAUDI ARABIA POWDER SULFUR MARKET, BY FINENESS, 2021-2030 (USD THOUSAND)
TABLE 419 SAUDI ARABIA POWDER SULFUR MARKET, BY FINENESS, 2021-2030 (TONS)
TABLE 420 EGYPT POWDER SULFUR MARKET, BY GRADE, 2021-2030 (USD THOUSAND)
TABLE 421 EGYPT POWDER SULFUR MARKET, BY GRADE, 2021-2030 (TONS)
TABLE 422 EGYPT AGRICULTURAL GRADE IN POWDER SULFUR MARKET, BY PRODUCT, 2021-2030 (USD THOUSAND)
TABLE 423 EGYPT RUBBER GRADE IN POWDER SULFUR MARKET, BY PRODUCT, 2021-2030 (USD THOUSAND)
TABLE 424 EGYPT RUBBER GRADE IN POWDER SULFUR MARKET, BY TYPE, 2021-2030 (USD THOUSAND)
TABLE 425 EGYPT INDUSTRIAL GRADE IN POWDER SULFUR MARKET, BY PRODUCT, 2021-2030 (USD THOUSAND)
TABLE 426 EGYPT PHARMA GRADE IN POWDER SULFUR MARKET, BY PRODUCT, 2021-2030 (USD THOUSAND)
TABLE 427 EGYPT FOOD GRADE IN POWDER SULFUR MARKET, BY PRODUCT, 2021-2030 (USD THOUSAND)
TABLE 428 EGYPT OTHERS IN POWDER SULFUR MARKET, BY PRODUCT, 2021-2030 (USD THOUSAND)
TABLE 429 EGYPT POWDER SULFUR MARKET, BY PRODUCT, 2021-2030 (USD THOUSAND)
TABLE 430 EGYPT POWDER SULFUR MARKET, BY PRODUCT, 2021-2030 (TONS)
TABLE 431 EGYPT POWDER SULFUR MARKET, BY FINENESS, 2021-2030 (USD THOUSAND)
TABLE 432 EGYPT POWDER SULFUR MARKET, BY FINENESS, 2021-2030 (TONS)
TABLE 433 SOUTH AFRICA POWDER SULFUR MARKET, BY GRADE, 2021-2030 (USD THOUSAND)
TABLE 434 SOUTH AFRICA POWDER SULFUR MARKET, BY GRADE, 2021-2030 (TONS)
TABLE 435 SOUTH AFRICA AGRICULTURAL GRADE IN POWDER SULFUR MARKET, BY PRODUCT, 2021-2030 (USD THOUSAND)
TABLE 436 SOUTH AFRICA RUBBER GRADE IN POWDER SULFUR MARKET, BY PRODUCT, 2021-2030 (USD THOUSAND)
TABLE 437 SOUTH AFRICA RUBBER GRADE IN POWDER SULFUR MARKET, BY TYPE, 2021-2030 (USD THOUSAND)
TABLE 438 SOUTH AFRICA INDUSTRIAL GRADE IN POWDER SULFUR MARKET, BY PRODUCT, 2021-2030 (USD THOUSAND)
TABLE 439 SOUTH AFRICA PHARMA GRADE IN POWDER SULFUR MARKET, BY PRODUCT, 2021-2030 (USD THOUSAND)
TABLE 440 SOUTH AFRICA FOOD GRADE IN POWDER SULFUR MARKET, BY PRODUCT, 2021-2030 (USD THOUSAND)
TABLE 441 SOUTH AFRICA OTHERS IN POWDER SULFUR MARKET, BY PRODUCT, 2021-2030 (USD THOUSAND)
TABLE 442 SOUTH AFRICA POWDER SULFUR MARKET, BY PRODUCT, 2021-2030 (USD THOUSAND)
TABLE 443 SOUTH AFRICA POWDER SULFUR MARKET, BY PRODUCT, 2021-2030 (TONS)
TABLE 444 SOUTH AFRICA POWDER SULFUR MARKET, BY FINENESS, 2021-2030 (USD THOUSAND)
TABLE 445 SOUTH AFRICA POWDER SULFUR MARKET, BY FINENESS, 2021-2030 (TONS)
TABLE 446 ISRAEL POWDER SULFUR MARKET, BY GRADE, 2021-2030 (USD THOUSAND)
TABLE 447 ISRAEL POWDER SULFUR MARKET, BY GRADE, 2021-2030 (TONS)
TABLE 448 ISRAEL AGRICULTURAL GRADE IN POWDER SULFUR MARKET, BY PRODUCT, 2021-2030 (USD THOUSAND)
TABLE 449 ISRAEL RUBBER GRADE IN POWDER SULFUR MARKET, BY PRODUCT, 2021-2030 (USD THOUSAND)
TABLE 450 ISRAEL RUBBER GRADE IN POWDER SULFUR MARKET, BY TYPE, 2021-2030 (USD THOUSAND)
TABLE 451 ISRAEL INDUSTRIAL GRADE IN POWDER SULFUR MARKET, BY PRODUCT, 2021-2030 (USD THOUSAND)
TABLE 452 ISRAEL PHARMA GRADE IN POWDER SULFUR MARKET, BY PRODUCT, 2021-2030 (USD THOUSAND)
TABLE 453 ISRAEL FOOD GRADE IN POWDER SULFUR MARKET, BY PRODUCT, 2021-2030 (USD THOUSAND)
TABLE 454 ISRAEL OTHERS IN POWDER SULFUR MARKET, BY PRODUCT, 2021-2030 (USD THOUSAND)
TABLE 455 ISRAEL POWDER SULFUR MARKET, BY PRODUCT, 2021-2030 (USD THOUSAND)
TABLE 456 ISRAEL POWDER SULFUR MARKET, BY PRODUCT, 2021-2030 (TONS)
TABLE 457 ISRAEL POWDER SULFUR MARKET, BY FINENESS, 2021-2030 (USD THOUSAND)
TABLE 458 ISRAEL POWDER SULFUR MARKET, BY FINENESS, 2021-2030 (TONS)
TABLE 459 REST OF MIDDLE EAST AND AFRICA POWDER SULFUR MARKET, BY GRADE, 2021-2030 (USD THOUSAND)
TABLE 460 REST OF MIDDLE EAST AND AFRICA POWDER SULFUR MARKET, BY GRADE, 2021-2030 (TONS)
TABLE 461 SOUTH AMERICA POWDER SULFUR MARKET, BY COUNTRY, 2021-2030 (USD THOUSAND)
TABLE 462 SOUTH AMERICA POWDER SULFUR MARKET, BY COUNTRY, 2021-2030 (TONS)
TABLE 463 SOUTH AMERICA POWDER SULFUR MARKET, BY GRADE, 2021-2030 (USD THOUSAND)
TABLE 464 SOUTH AMERICA POWDER SULFUR MARKET, BY GRADE, 2021-2030 (TONS)
TABLE 465 SOUTH AMERICA AGRICULTURAL GRADE IN POWDER SULFUR MARKET, BY PRODUCT, 2021-2030 (USD THOUSAND)
TABLE 466 SOUTH AMERICA RUBBER GRADE IN POWDER SULFUR MARKET, BY PRODUCT, 2021-2030 (USD THOUSAND)
TABLE 467 SOUTH AMERICA RUBBER GRADE IN POWDER SULFUR MARKET, BY TYPE, 2021-2030 (USD THOUSAND)
TABLE 468 SOUTH AMERICA INDUSTRIAL GRADE IN POWDER SULFUR MARKET, BY PRODUCT, 2021-2030 (USD THOUSAND)
TABLE 469 SOUTH AMERICA PHARMA GRADE IN POWDER SULFUR MARKET, BY PRODUCT, 2021-2030 (USD THOUSAND)
TABLE 470 SOUTH AMERICA FOOD GRADE IN POWDER SULFUR MARKET, BY PRODUCT, 2021-2030 (USD THOUSAND)
TABLE 471 SOUTH AMERICA OTHERS IN POWDER SULFUR MARKET, BY PRODUCT, 2021-2030 (USD THOUSAND)
TABLE 472 SOUTH AMERICA POWDER SULFUR MARKET, BY PRODUCT, 2021-2030 (USD THOUSAND)
TABLE 473 SOUTH AMERICA POWDER SULFUR MARKET, BY PRODUCT, 2021-2030 (TONS)
TABLE 474 SOUTH AMERICA POWDER SULFUR MARKET, BY FINENESS, 2021-2030 (USD THOUSAND)
TABLE 475 SOUTH AMERICA POWDER SULFUR MARKET, BY FINENESS, 2021-2030 (TONS)
TABLE 476 BRAZIL POWDER SULFUR MARKET, BY GRADE, 2021-2030 (USD THOUSAND)
TABLE 477 BRAZIL POWDER SULFUR MARKET, BY GRADE, 2021-2030 (TONS)
TABLE 478 BRAZIL AGRICULTURAL GRADE IN POWDER SULFUR MARKET, BY PRODUCT, 2021-2030 (USD THOUSAND)
TABLE 479 BRAZIL RUBBER GRADE IN POWDER SULFUR MARKET, BY PRODUCT, 2021-2030 (USD THOUSAND)
TABLE 480 BRAZIL RUBBER GRADE IN POWDER SULFUR MARKET, BY TYPE, 2021-2030 (USD THOUSAND)
TABLE 481 BRAZIL INDUSTRIAL GRADE IN POWDER SULFUR MARKET, BY PRODUCT, 2021-2030 (USD THOUSAND)
TABLE 482 BRAZIL PHARMA GRADE IN POWDER SULFUR MARKET, BY PRODUCT, 2021-2030 (USD THOUSAND)
TABLE 483 BRAZIL FOOD GRADE IN POWDER SULFUR MARKET, BY PRODUCT, 2021-2030 (USD THOUSAND)
TABLE 484 BRAZIL OTHERS IN POWDER SULFUR MARKET, BY PRODUCT, 2021-2030 (USD THOUSAND)
TABLE 485 BRAZIL POWDER SULFUR MARKET, BY PRODUCT, 2021-2030 (USD THOUSAND)
TABLE 486 BRAZIL POWDER SULFUR MARKET, BY PRODUCT, 2021-2030 (TONS)
TABLE 487 BRAZIL POWDER SULFUR MARKET, BY FINENESS, 2021-2030 (USD THOUSAND)
TABLE 488 BRAZIL POWDER SULFUR MARKET, BY FINENESS, 2021-2030 (TONS)
TABLE 489 ARGENTINA POWDER SULFUR MARKET, BY GRADE, 2021-2030 (USD THOUSAND)
TABLE 490 ARGENTINA POWDER SULFUR MARKET, BY GRADE, 2021-2030 (TONS)
TABLE 491 ARGENTINA AGRICULTURAL GRADE IN POWDER SULFUR MARKET, BY PRODUCT, 2021-2030 (USD THOUSAND)
TABLE 492 ARGENTINA RUBBER GRADE IN POWDER SULFUR MARKET, BY PRODUCT, 2021-2030 (USD THOUSAND)
TABLE 493 ARGENTINA RUBBER GRADE IN POWDER SULFUR MARKET, BY TYPE, 2021-2030 (USD THOUSAND)
TABLE 494 ARGENTINA INDUSTRIAL GRADE IN POWDER SULFUR MARKET, BY PRODUCT, 2021-2030 (USD THOUSAND)
TABLE 495 ARGENTINA PHARMA GRADE IN POWDER SULFUR MARKET, BY PRODUCT, 2021-2030 (USD THOUSAND)
TABLE 496 ARGENTINA FOOD GRADE IN POWDER SULFUR MARKET, BY PRODUCT, 2021-2030 (USD THOUSAND)
TABLE 497 ARGENTINA OTHERS IN POWDER SULFUR MARKET, BY PRODUCT, 2021-2030 (USD THOUSAND)
TABLE 498 ARGENTINA POWDER SULFUR MARKET, BY PRODUCT, 2021-2030 (USD THOUSAND)
TABLE 499 ARGENTINA POWDER SULFUR MARKET, BY PRODUCT, 2021-2030 (TONS)
TABLE 500 ARGENTINA POWDER SULFUR MARKET, BY FINENESS, 2021-2030 (USD THOUSAND)
TABLE 501 ARGENTINA POWDER SULFUR MARKET, BY FINENESS, 2021-2030 (TONS)
TABLE 502 REST OF SOUTH AMERICA POWDER SULFUR MARKET, BY GRADE, 2021-2030 (USD THOUSAND)
TABLE 503 REST OF SOUTH AMERICA POWDER SULFUR MARKET, BY GRADE, 2021-2030 (TONS)
Lista de Figura
FIGURE 1 GLOBAL POWDER SULFUR MARKET
FIGURE 2 GLOBAL POWDER SULFUR MARKET: DATA TRIANGULATION
FIGURE 3 GLOBAL POWDER SULFUR MARKET: DROC ANALYSIS
FIGURE 4 GLOBAL POWDER SULFUR MARKET: GLOBAL VS REGIONAL MARKET ANALYSIS
FIGURE 5 GLOBAL POWDER SULFUR MARKET: COMPANY RESEARCH ANALYSIS
FIGURE 6 GLOBAL POWDER SULFUR MARKET: THE PRODUCT LIFELINE CURVE
FIGURE 7 GLOBAL POWDER SULFUR MARKET: MULTIVARIATE MODELLING
FIGURE 8 GLOBAL POWDER SULFUR MARKET: INTERVIEW DEMOGRAPHICS
FIGURE 9 GLOBAL POWDER SULFUR MARKET: DBMR MARKET POSITION GRID
FIGURE 10 GLOBAL POWDER SULFUR MARKET: THE MARKET CHALLENGE MATRIX
FIGURE 11 GLOBAL POWDER SULFUR MARKET: VENDOR SHARE ANALYSIS
FIGURE 12 GLOBAL POWDER SULFUR MARKET: SEGMENTATION
FIGURE 13 ASIA-PACIFIC IS EXPECTED TO DOMINATE THE GLOBAL POWDER SULFUR MARKET AND IT IS EXPECTED TO GROW WITH THE HIGHEST CAGR IN THE FORECAST PERIOD
FIGURE 14 A POSITIVE OUTLOOK TOWARDS THE BUILDING AND CONSTRUCTION SECTOR IS EXPECTED TO DRIVE THE GLOBAL POWDER SULFUR MARKET IN THE FORECAST PERIOD
FIGURE 15 THE AGRICULTURAL GRADE SEGMENT IS EXPECTED TO ACCOUNT FOR THE LARGEST SHARE OF THE GLOBAL POWDER SULFUR MARKET IN 2023 AND 2030
FIGURE 16 ASIA-PACIFIC IS THE FASTEST-GROWING MARKET FOR POWDER SULFUR MARKET MANUFACTURERS IN THE FORECAST PERIOD
FIGURE 17 IMPORT-EXPORT SCENARIO (USD THOUSAND)
FIGURE 18 PRICE ANALYSIS FOR GLOBAL POWDER SULFUR MARKET (USD/TON)
FIGURE 19 VENDOR SELECTION CRITERIA
FIGURE 20 DRIVERS, RESTRAINTS, OPPORTUNITIES, AND CHALLENGES OF THE GLOBAL SULFUR POWDER MARKET
FIGURE 21 GLOBAL POWDER SULFUR MARKET: SNAPSHOT (2022)
FIGURE 22 GLOBAL POWDER SULFUR MARKET: BY REGION (2022)
FIGURE 23 GLOBAL POWDER SULFUR MARKET: BY REGION (2023 & 2030)
FIGURE 24 GLOBAL POWDER SULFUR MARKET: BY REGION (2022 & 2030)
FIGURE 25 GLOBAL POWDER SULFUR MARKET: BY GRADE (2023-2030)
FIGURE 26 ASIA-PACIFIC POWDER SULFUR MARKET: SNAPSHOT (2022)
FIGURE 27 ASIA-PACIFIC POWDER SULFUR MARKET: BY COUNTRY (2022)
FIGURE 28 ASIA-PACIFIC POWDER SULFUR MARKET: BY COUNTRY (2023 & 2030)
FIGURE 29 ASIA-PACIFIC POWDER SULFUR MARKET: BY COUNTRY (2022 & 2030)
FIGURE 30 ASIA-PACIFIC POWDER SULFUR MARKET: BY GRADE (2023 - 2030)
FIGURE 31 EUROPE POWDER SULFUR MARKET: SNAPSHOT (2022)
FIGURE 32 EUROPE POWDER SULFUR MARKET: BY COUNTRY (2022)
FIGURE 33 EUROPE POWDER SULFUR MARKET: BY COUNTRY (2023 & 2030)
FIGURE 34 EUROPE POWDER SULFUR MARKET: BY COUNTRY (2022 & 2030)
FIGURE 35 EUROPE POWDER SULFUR MARKET: BY GRADE (2023 - 2030)
FIGURE 36 NORTH AMERICA POWDER SULFUR MARKET: SNAPSHOT (2022)
FIGURE 37 NORTH AMERICA POWDER SULFUR MARKET: BY COUNTRY (2022)
FIGURE 38 NORTH AMERICA POWDER SULFUR MARKET: BY COUNTRY (2023 & 2030)
FIGURE 39 NORTH AMERICA POWDER SULFUR MARKET: BY COUNTRY (2022 & 2030)
FIGURE 40 NORTH AMERICA POWDER SULFUR MARKET: BY GRADE (2023 - 2030)
FIGURE 41 MIDDLE EAST AND AFRICA POWDER SULFUR MARKET: SNAPSHOT (2022)
FIGURE 42 MIDDLE EAST AND AFRICA POWDER SULFUR MARKET: BY COUNTRY (2022)
FIGURE 43 MIDDLE EAST AND AFRICA POWDER SULFUR MARKET: BY COUNTRY (2023 & 2030)
FIGURE 44 MIDDLE EAST AND AFRICA POWDER SULFUR MARKET: BY COUNTRY (2022 & 2030)
FIGURE 45 MIDDLE EAST AND AFRICA POWDER SULFUR MARKET: BY GRADE (2023 - 2030)
FIGURE 46 SOUTH AMERICA POWDER SULFUR MARKET: SNAPSHOT (2022)
FIGURE 47 SOUTH AMERICA POWDER SULFUR MARKET: BY COUNTRY (2022)
FIGURE 48 SOUTH AMERICA POWDER SULFUR MARKET: BY COUNTRY (2023 & 2030)
FIGURE 49 SOUTH AMERICA POWDER SULFUR MARKET: BY COUNTRY (2022 & 2030)
FIGURE 50 SOUTH AMERICA POWDER SULFUR MARKET: BY GRADE (2023 - 2030)
FIGURE 51 GLOBAL POWDER SULFUR MARKET: COMPANY SHARE 2022 (%)
FIGURE 52 NORTH AMERICA POWDER SULFUR MARKET: COMPANY SHARE 2022 (%)
FIGURE 53 EUROPE POWDER SULFUR MARKET: COMPANY SHARE 2022 (%)
FIGURE 54 ASIA-PACIFIC POWDER SULFUR MARKET: COMPANY SHARE 2022 (%)
Metodologia de Investigação
A recolha de dados e a análise do ano base são feitas através de módulos de recolha de dados com amostras grandes. A etapa inclui a obtenção de informações de mercado ou dados relacionados através de diversas fontes e estratégias. Inclui examinar e planear antecipadamente todos os dados adquiridos no passado. Da mesma forma, envolve o exame de inconsistências de informação observadas em diferentes fontes de informação. Os dados de mercado são analisados e estimados utilizando modelos estatísticos e coerentes de mercado. Além disso, a análise da quota de mercado e a análise das principais tendências são os principais fatores de sucesso no relatório de mercado. Para saber mais, solicite uma chamada de analista ou abra a sua consulta.
A principal metodologia de investigação utilizada pela equipa de investigação do DBMR é a triangulação de dados que envolve a mineração de dados, a análise do impacto das variáveis de dados no mercado e a validação primária (especialista do setor). Os modelos de dados incluem grelha de posicionamento de fornecedores, análise da linha de tempo do mercado, visão geral e guia de mercado, grelha de posicionamento da empresa, análise de patentes, análise de preços, análise da quota de mercado da empresa, normas de medição, análise global versus regional e de participação dos fornecedores. Para saber mais sobre a metodologia de investigação, faça uma consulta para falar com os nossos especialistas do setor.
Personalização disponível
A Data Bridge Market Research é líder em investigação formativa avançada. Orgulhamo-nos de servir os nossos clientes novos e existentes com dados e análises que correspondem e atendem aos seus objetivos. O relatório pode ser personalizado para incluir análise de tendências de preços de marcas-alvo, compreensão do mercado para países adicionais (solicite a lista de países), dados de resultados de ensaios clínicos, revisão de literatura, mercado remodelado e análise de base de produtos . A análise de mercado dos concorrentes-alvo pode ser analisada desde análises baseadas em tecnologia até estratégias de carteira de mercado. Podemos adicionar quantos concorrentes necessitar de dados no formato e estilo de dados que procura. A nossa equipa de analistas também pode fornecer dados em tabelas dinâmicas de ficheiros Excel em bruto (livro de factos) ou pode ajudá-lo a criar apresentações a partir dos conjuntos de dados disponíveis no relatório.

