

Global Plastic Compounding Market
Tamanho do mercado em biliões de dólares
CAGR :
% 
 USD
226.24 Billion
USD
333.65 Billion
2024
2032
USD
226.24 Billion
USD
333.65 Billion
2024
2032
| 2025 –2032 | |
| USD 226.24 Billion | |
| USD 333.65 Billion | |
| % | |
|
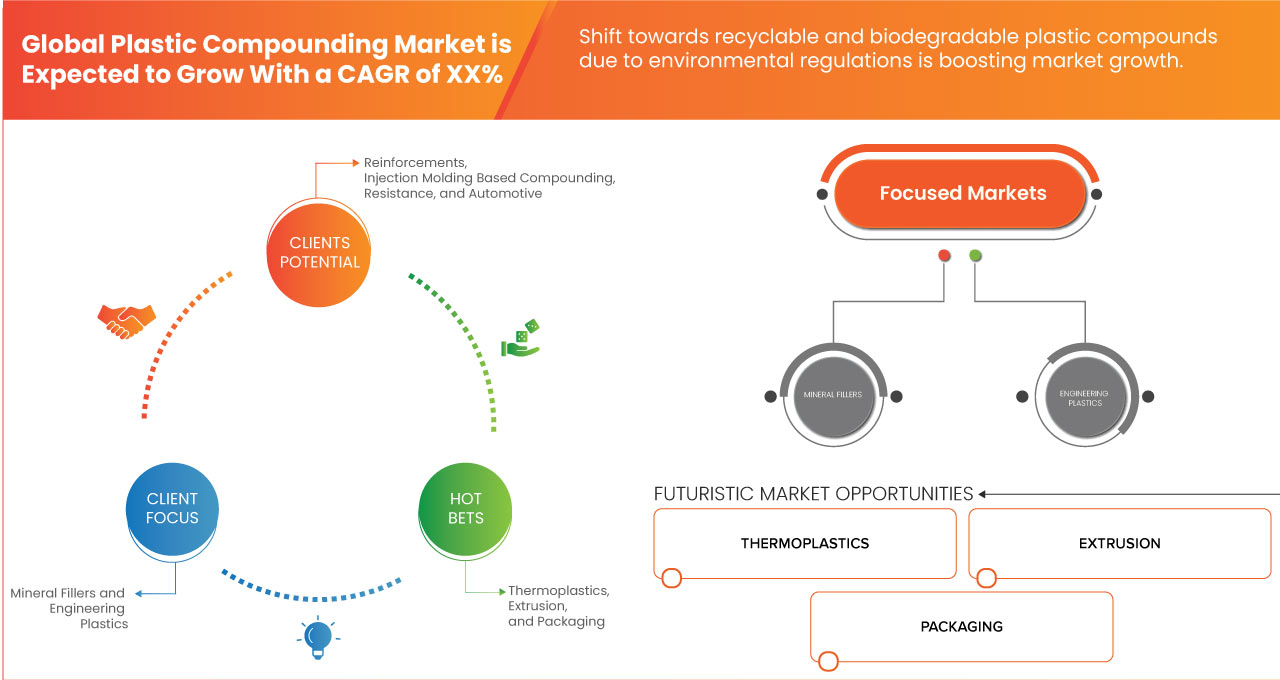
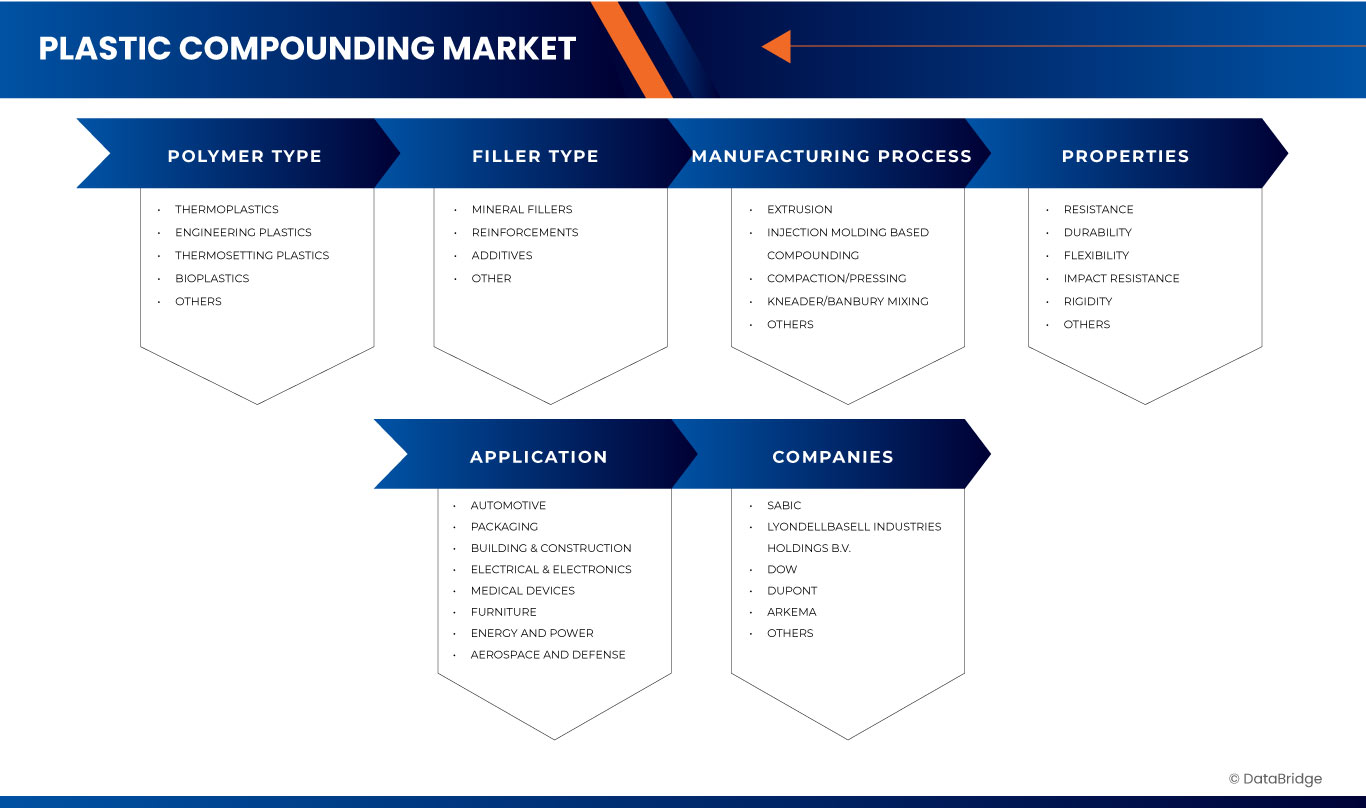
Segmentação do mercado global de compostos plásticos, por tipo de polímero (termoplásticos, plásticos termoendurecíveis, plásticos de engenharia, bioplásticos e outros), tipo de enchimento (enchimentos minerais, reforços, aditivos e outros), processo de fabricação (extrusão, compactação/prensagem, amassadeira/mistura Banbury, compostos baseados em moldagem por injeção e outros), propriedades (resistência, durabilidade, flexibilidade, resistência ao impacto, rigidez e outros), aplicação (aeroespacial e defesa, embalagens, elétrica e eletrônica, energia e eletricidade, construção civil, automotiva, dispositivos médicos, móveis e outros) - tendências do setor e previsão para 2032
Tamanho do mercado de compostos plásticos
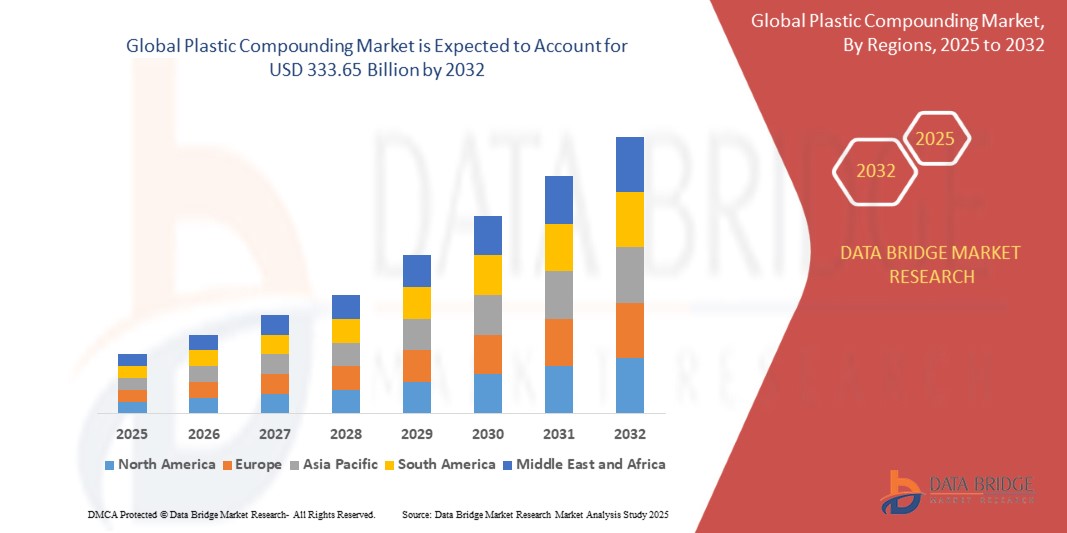
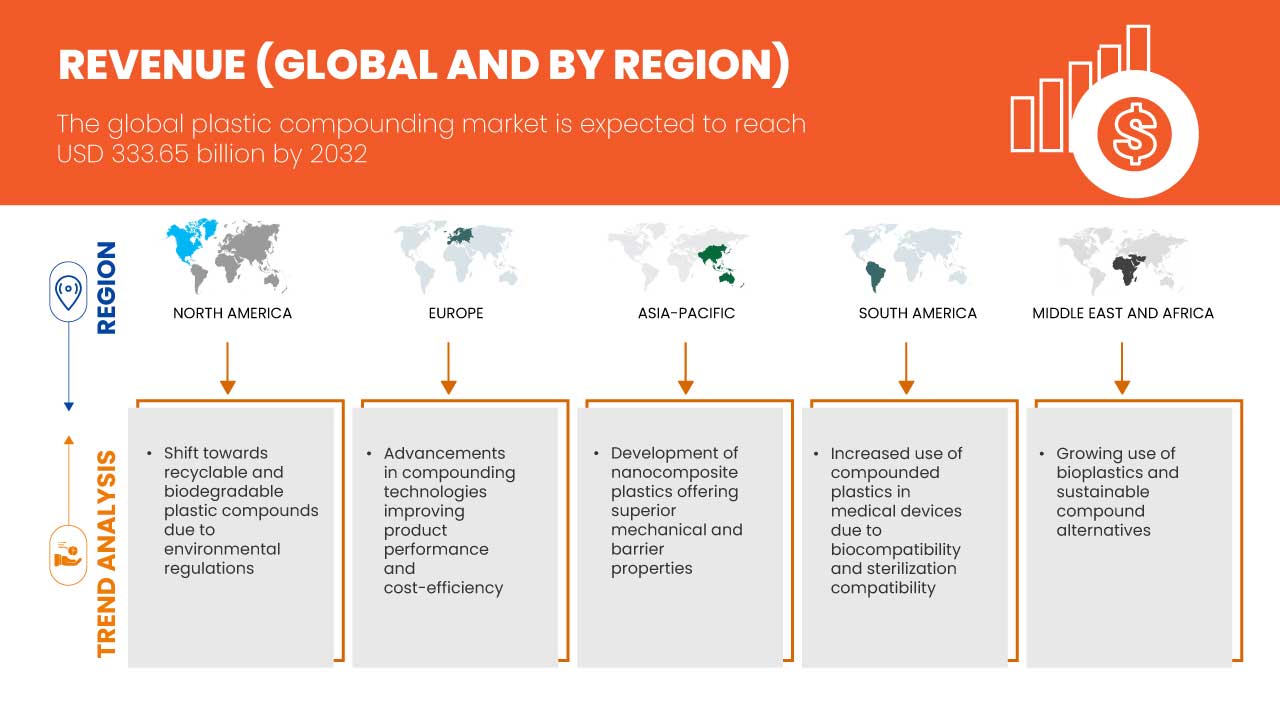
- O tamanho do mercado global de compostos plásticos foi avaliado em US$ 226,24 bilhões em 2024 e deve atingir US$ 333,65 bilhões até 2032 , com um CAGR de 5,02% durante o período previsto, devido à mudança para compostos plásticos recicláveis e biodegradáveis devido a regulamentações ambientais, avanços em tecnologias de compostos que melhoram o desempenho do produto e a relação custo-benefício, e políticas e iniciativas governamentais de apoio à promoção do uso de plásticos em vários setores.
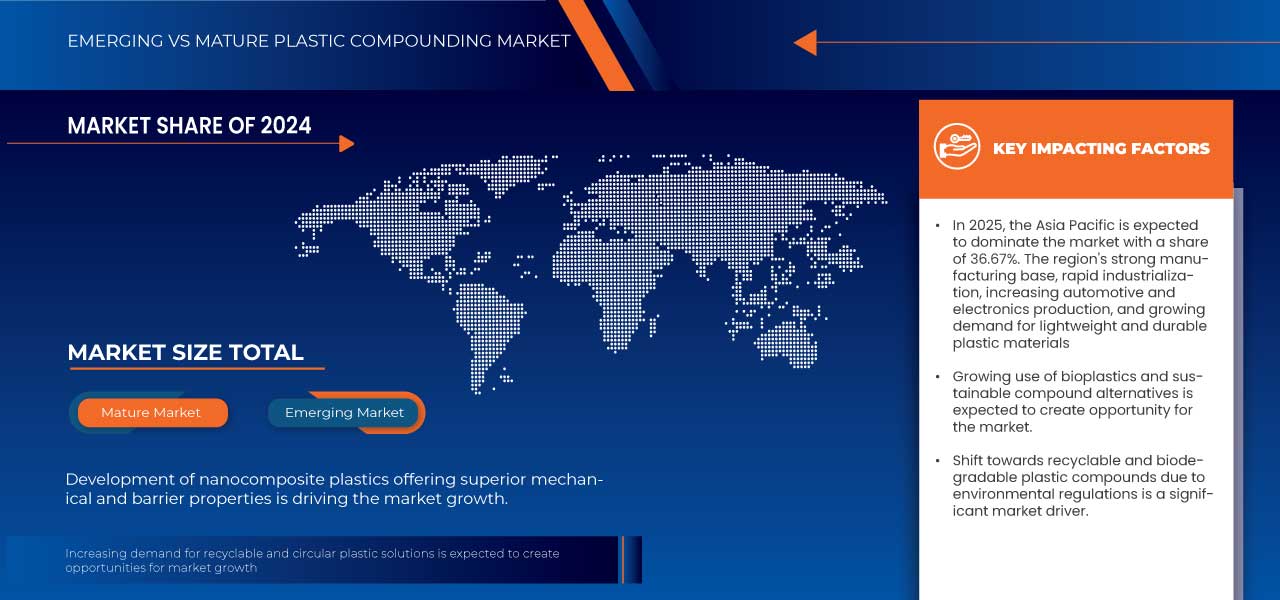
- Além disso, espera-se que o mercado aumente o uso de bioplásticos e alternativas de compostos sustentáveis, aumente a adoção de veículos elétricos que exigem polímeros avançados e aumente a demanda por soluções plásticas recicláveis e circulares.
Análise de Mercado de Compostos Plásticos
- O aumento global na mudança para compostos plásticos recicláveis e biodegradáveis devido às regulamentações ambientais, avanços nas tecnologias de composição que melhoram o desempenho do produto e a eficiência de custos
- Os principais fatores incluem o aumento global na mudança para compostos plásticos recicláveis e biodegradáveis devido às regulamentações ambientais, avanços nas tecnologias de compostos que melhoram o desempenho do produto e a eficiência de custos, a crescente demanda dos setores de transmissão de energia e o aumento dos investimentos na modernização da rede e na infraestrutura transfronteiriça.
- A Ásia-Pacífico domina o mercado global de compostos plásticos com uma participação de 36,53% em 2024, impulsionada pela rápida industrialização, expansão dos setores automotivo e de construção e políticas governamentais de apoio que promovem o crescimento da manufatura.
- A Ásia-Pacífico é a região de crescimento mais rápido no mercado global de compostos plásticos, impulsionada pela crescente demanda do consumidor, avanços tecnológicos no processamento de materiais e aumento do investimento estrangeiro em importantes indústrias de uso final.
- O segmento de termoplásticos domina o mercado com uma participação de 63,17%, crescendo a um CAGR de 4,6% de 2025 a 2032, devido à sua superior resistência mecânica, resistência ao calor e uso crescente na fabricação de equipamentos automotivos, eletrônicos e industriais.
Escopo do Relatório e Segmentação do Mercado de Compostos Plásticos
|
Atributos |
Principais insights do mercado de compostos plásticos |
|
Segmentos abrangidos |
|
|
Países abrangidos |
América do Norte
Europa
Ásia-Pacífico
Ámérica do Sul
Oriente Médio e África
|
|
Principais participantes do mercado |
|
|
Oportunidades de mercado |
|
|
Conjuntos de informações de dados de valor agregado |
Além dos insights sobre cenários de mercado, como valor de mercado, taxa de crescimento, segmentação, cobertura geográfica e principais participantes, os relatórios de mercado selecionados pela Data Bridge Market Research também incluem análise de importação e exportação, visão geral da capacidade de produção, análise de consumo de produção, análise de tendência de preço, cenário de mudança climática, análise da cadeia de suprimentos, análise da cadeia de valor, visão geral de matéria-prima/consumíveis, critérios de seleção de fornecedores, análise PESTLE, análise de Porter e estrutura regulatória. |
Tendências do mercado de compostos plásticos
Aumento da demanda por plásticos de alto desempenho
- A demanda por compostos plásticos de alto desempenho está crescendo rapidamente, impulsionada pela crescente urbanização, pela atividade industrial e pelo uso crescente de veículos elétricos e infraestrutura inteligente. Compostos plásticos avançados enfrentam esses desafios, oferecendo maior durabilidade, eficiência energética e desempenho aprimorado do produto.
- À medida que os países se concentram na redução das emissões de carbono e no aprimoramento da estabilidade da rede, observa-se uma crescente mudança em direção à modernização da infraestrutura elétrica, com o uso de compostos plásticos inovadores. Essa transição é crucial para atender à crescente demanda por eletricidade, ao mesmo tempo em que apoia sistemas de transmissão mais limpos e eficientes.
- Grandes players da indústria, como Covestro, LyondellBasell e BASF, estão aumentando significativamente seus esforços de P&D para desenvolver compostos plásticos de última geração que sejam mais sustentáveis, flexíveis e de alto desempenho, impulsionando ainda mais a inovação e o crescimento do mercado.
- Os avanços na tecnologia de compostos plásticos — caracterizados por maior estabilidade térmica, isolamento elétrico e resistência mecânica — estão impulsionando o crescimento do mercado. Os principais fabricantes estão desenvolvendo ativamente compostos especializados para apoiar a integração de energia renovável em larga escala e aprimorar a infraestrutura energética inter-regional, impulsionando a expansão do mercado global de compostos plásticos.
Dinâmica do mercado de compostos plásticos
Motorista
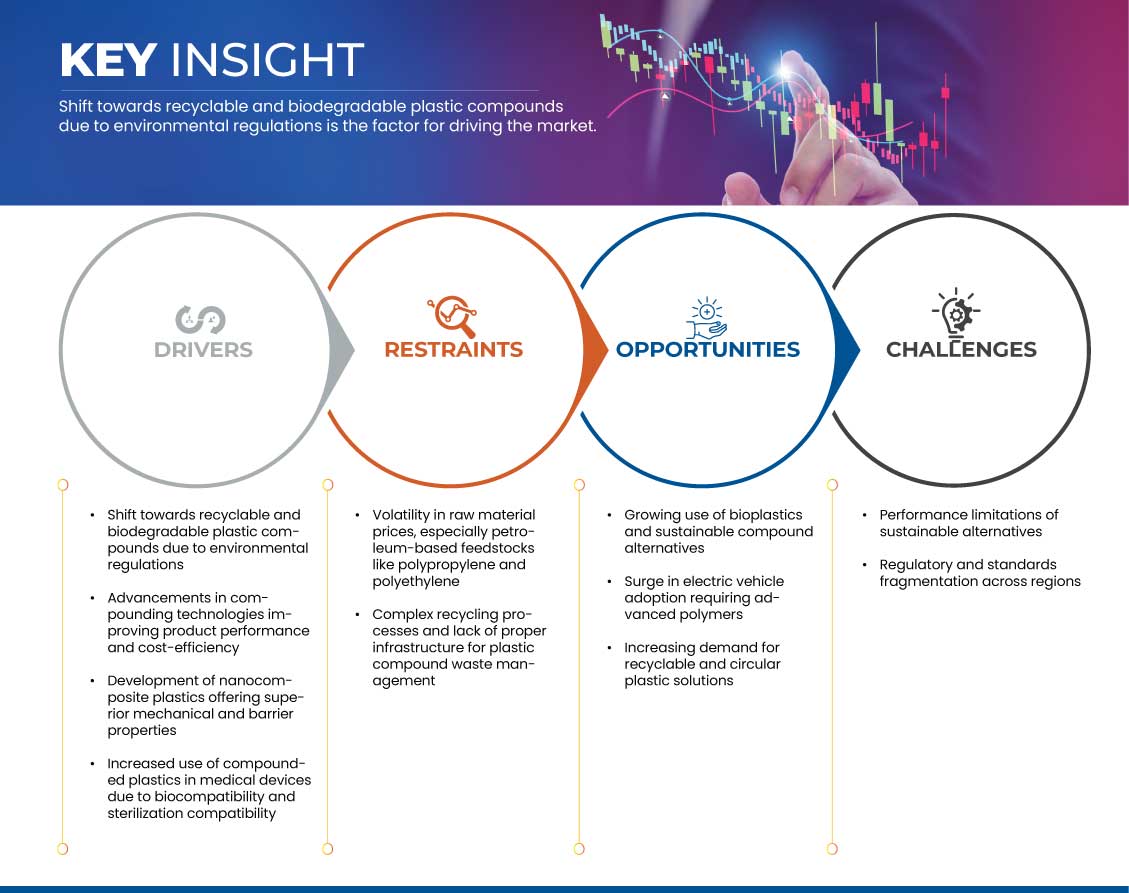
Mudança para compostos plásticos recicláveis e biodegradáveis devido às regulamentações ambientais
- A crescente demanda global por materiais sustentáveis — impulsionada por regulamentações ambientais rigorosas, aumento da conscientização do consumidor e metas corporativas de sustentabilidade — está exercendo imensa pressão sobre os métodos tradicionais de produção de plástico. Para enfrentar esse desafio, muitos fabricantes estão acelerando os investimentos em compostos plásticos recicláveis e biodegradáveis para reduzir o impacto ambiental e apoiar iniciativas de economia circular. Esses desenvolvimentos estão criando soluções de materiais mais sustentáveis, eficientes e preparadas para o futuro, de forma semelhante à forma como as tecnologias de eficiência energética otimizam o uso de recursos.
- Por exemplo, em 2024, diversas grandes empresas químicas anunciaram projetos de grande escala focados na expansão da capacidade de compostos plásticos biodegradáveis, visando atender à crescente demanda dos setores de embalagens, automotivo e bens de consumo. Essas iniciativas visam reduzir o desperdício de plástico, aumentar a reciclabilidade e cumprir com marcos regulatórios globais, como o Plano de Ação para a Economia Circular da UE.
- Esses investimentos não estão apenas transformando as formulações dos materiais, mas também permitindo uma adoção mais ampla de plásticos sustentáveis em todos os setores. Empresas líderes como BASF, Covestro e LyondellBasell estão investindo fortemente em P&D para desenvolver compostos plásticos de base biológica e recicláveis de última geração, garantindo melhor desempenho e conformidade ambiental.
- Além disso, o compromisso contínuo de governos, empresas privadas e órgãos reguladores desempenha um papel fundamental na promoção de plásticos recicláveis e biodegradáveis como um componente essencial dos esforços globais de sustentabilidade. Essas iniciativas estão consolidando os compostos plásticos ecológicos como um facilitador essencial da economia circular e um importante impulsionador do crescimento do mercado global de compostos plásticos.
Restrição/Desafio
Volatilidade nos preços das matérias-primas, especialmente matérias-primas derivadas do petróleo, como polipropileno e polietileno
- A volatilidade dos preços das matérias-primas, especialmente de matérias-primas à base de petróleo, como polipropileno e polietileno, continua sendo uma restrição significativa ao mercado de compostos plásticos. A flutuação dos preços impacta os custos de produção e a lucratividade, gerando incerteza tanto para fabricantes quanto para usuários finais.
- Além disso, a dependência dos mercados de petróleo bruto expõe a indústria de compostos a tensões geopolíticas, interrupções na cadeia de abastecimento e mudanças nas políticas comerciais, o que pode levar a picos repentinos de preços ou escassez.
- Por exemplo, no início de 2025, as flutuações globais do preço do petróleo bruto fizeram com que os preços do polipropileno variassem mais de 20% em poucos meses, afetando diretamente os custos de insumos dos fabricantes de compostos plásticos e forçando ajustes nas estratégias de preços.
- Além disso, matérias-primas alternativas, como matérias-primas de base biológica, embora promissoras, são atualmente limitadas por custos mais elevados e desafios de escalabilidade, impedindo a mitigação total da volatilidade do preço do petróleo.
- Essa instabilidade de preços representa desafios para o planejamento e o investimento de longo prazo no setor de compostos plásticos, especialmente para fabricantes menores e regiões com menor resiliência financeira. Apesar dos esforços para diversificar as fontes de matéria-prima e melhorar a flexibilidade da cadeia de suprimentos, a volatilidade nos preços da matéria-prima continua sendo um obstáculo fundamental para o crescimento estável.
Escopo de mercado de compostos plásticos
O mercado é segmentado com base no tipo de polímero, tipo de enchimento, processo de fabricação, propriedades e aplicação.
- Tipo de polímero
Com base no tipo de polímero, o mercado é segmentado em termoplásticos, plásticos termofixos, plásticos de engenharia, bioplásticos e outros. Em 2025, espera-se que o segmento de termoplásticos domine o mercado, com uma participação de mercado de 62,93%, crescendo com um CAGR de 4,62% no período previsto de 2025 a 2032, impulsionado pela crescente demanda por materiais leves e duráveis em todos os setores e pelo foco crescente em compostos plásticos recicláveis e sustentáveis.
- Tipo de enchimento
Com base no tipo de carga, o mercado é segmentado em cargas minerais, reforços, aditivos e outros. Em 2025, espera-se que o segmento de cargas minerais domine o mercado, com uma participação de mercado de 49,89%, crescendo com um CAGR de 5,70% no período previsto de 2025 a 2032, impulsionado pela crescente demanda por materiais com propriedades aprimoradas, custo-benefício e adoção crescente em diversas aplicações industriais.
- Processo de fabricação
Com base no processo de fabricação, o mercado é segmentado em extrusão, compactação/prensagem, amassadeira/mistura Banbury, compostos à base de moldagem por injeção, entre outros. Em 2025, espera-se que o segmento de extrusão domine o mercado, com uma participação de mercado de 46,26%, crescendo com um CAGR de 5,34% no período previsto de 2025 a 2032, impulsionado por sua ampla adoção para compostos eficientes e contínuos e pela crescente demanda por compostos plásticos de alta qualidade em diversos setores.
- Propriedades
Com base nas propriedades, o mercado é segmentado em resistência, durabilidade, flexibilidade, resistência ao impacto, rigidez, entre outras. Em 2025, espera-se que o segmento de resistência domine o mercado, com uma participação de mercado de 30,83%, crescendo com um CAGR de 5,57% no período previsto de 2025 a 2032, impulsionado pela crescente demanda por compostos plásticos de alta durabilidade e alto desempenho nos setores automotivo, de construção e de bens de consumo.
- Aplicativo
Com base na aplicação, o mercado é segmentado em aeroespacial e defesa, embalagens, elétrica e eletrônica, energia e eletricidade, construção civil, automotivo, dispositivos médicos, móveis e outros. Em 2025, espera-se que o segmento automotivo domine o mercado, com uma participação de mercado de 29,60%, crescendo com um CAGR de 4,03% no período previsto de 2025 a 2032, impulsionado pela crescente demanda por compostos plásticos leves, duráveis e recicláveis para melhorar a eficiência de combustível e atender às rigorosas regulamentações ambientais.
Análise regional do mercado de compostos plásticos
- Espera-se que o mercado de compostos plásticos da Ásia-Pacífico atinja 125,54 bilhões de dólares até 2032, ante 82,65 bilhões de dólares em 2024, crescendo a uma taxa composta de crescimento anual (CAGR) de 5,41% no período previsto de 2025 a 2032.
- A região da Ásia-Pacífico destina uma parcela significativa de seu PIB à manufatura e ao desenvolvimento industrial, garantindo financiamento robusto para materiais avançados e tecnologias inovadoras de compostos plásticos. Em contrapartida, os mercados emergentes estão aumentando seus investimentos em compostos plásticos, impulsionados pela crescente industrialização, urbanização e demanda crescente por materiais sustentáveis e de alto desempenho. A disponibilidade de financiamento, tanto do setor público quanto do privado, desempenha um papel crucial na expansão das capacidades de produção e na adoção de compostos plásticos avançados em todo o mundo.
- Na região da Ásia-Pacífico, tecnologias avançadas de compostos plásticos são amplamente adotadas e integradas a diversas aplicações industriais, apoiando setores como o automotivo, aeroespacial e eletrônico. Em contrapartida, mercados emergentes com infraestrutura de manufatura em desenvolvimento estão vivenciando um rápido crescimento na demanda por compostos plásticos especializados, impulsionado pela expansão das bases industriais e pelo aumento das necessidades nos setores de saúde, automotivo e embalagens. À medida que esses sistemas de saúde e industriais se tornam mais centralizados ou privatizados, isso frequentemente leva a um aumento no investimento em tecnologias de ponta em compostos plásticos, o que promove o crescimento e a acessibilidade do mercado.
Visão geral do mercado de compostos plásticos na Europa
Espera-se que a Europa registre um CAGR de 4,90% entre 2025 e 2032, impulsionado por regulamentações ambientais rigorosas, avanços em plásticos sustentáveis e crescente demanda nos setores automotivo e de construção.
Visão do mercado de compostos plásticos na Alemanha
Espera-se que a Alemanha registre um CAGR de 5,55% de 2025 a 2032, apoiado por forte inovação industrial, alta demanda nas indústrias automotiva e elétrica e ênfase em materiais ecológicos.
Visão geral do mercado de compostos plásticos na Itália
Espera-se que a Itália registre um CAGR de 5,32% entre 2025 e 2032, impulsionado pelo crescimento nos setores de embalagens e bens de consumo, maior uso de plásticos biodegradáveis e investimentos em infraestrutura de reciclagem.
Visão geral do mercado de compostos plásticos na América do Norte
Espera-se que a América do Norte registre um CAGR de 4,75% entre 2025 e 2032, impulsionado por avanços tecnológicos na ciência de polímeros, crescente produção de veículos elétricos e incentivos governamentais para materiais sustentáveis.
Visão geral do mercado de compostos plásticos do Canadá
Espera-se que o Canadá registre um CAGR de 4,44% de 2025 a 2032, impulsionado pela crescente demanda nos setores de saúde e construção, foco na redução de resíduos plásticos e desenvolvimento de compostos plásticos de alto desempenho.
Visão geral do mercado de compostos plásticos no Oriente Médio e África
Espera-se que o Oriente Médio e a África registrem um CAGR de 4,61% entre 2025 e 2032, impulsionado pelo desenvolvimento de infraestrutura, pela crescente fabricação de eletrônicos e pela crescente demanda por soluções plásticas inovadoras.
Visão do mercado de compostos plásticos da Arábia Saudita
Espera-se que a Arábia Saudita registre um CAGR de 5,86% entre 2025 e 2032, impulsionado por investimentos em indústrias petroquímicas, iniciativas governamentais para diversificação industrial e crescente adoção de plásticos avançados.
Visão geral do mercado de compostos plásticos do Egito
Espera-se que o Egito registre um CAGR de 4,51% de 2025 a 2032, apoiado pela crescente demanda por embalagens, expansão das atividades de construção e foco crescente em alternativas plásticas ecológicas.
Participação no mercado de compostos plásticos
O mercado global de compostos plásticos é liderado principalmente por empresas bem estabelecidas, incluindo:
- LyondellBasell Industries Holdings BV (EUA)
- BASF (Alemanha)
- LG Chem (Coreia do Sul)
- Dow (EUA)
- SABIC (Arábia Saudita)
- Covestro AG (Alemanha)
- Teknor Apex (EUA)
- LANXESS (Alemanha)
- Celanese Corporation (EUA)
- Borealis GmbH (Áustria)
- Asahi Kasei Corp. (Japão)
- Mitsubishi Chemical Group Corporation (Japão)
- DuPont (EUA)
- Avient Corporation (EUA)
- CHIMEI (Taiwan)
- INEOS (Reino Unido)
- Kingfa Sci. e tecnologia. Co., Ltd (China)
- Washington Penn (EUA)
- Empresa RTP (EUA)
- Syensqo (Bélgica)
- Envalior (Alemanha)
- Arkema (França)
- Trinseo (EUA)
- Daicel Corporation (Japão)
- KANEKA CORPORATION (Japão)
- TORAY INDUSTRIES, INC. (Japão)
- Mitsui Chemicals, Inc. (Japão)
- Ensinger (Alemanha)
- SCG (Tailândia)
- CLARIANT (Suíça)
Últimos desenvolvimentos no mercado de compostos plásticos
- Em junho de 2025, a Envalior, em colaboração com a SENTImotion e o Frencken Group, anunciou uma inovação de produto envolvendo um novo conceito de caixa de engrenagens para braços robóticos utilizando plástico de engenharia Stanyl PA46. Este desenvolvimento permite caixas de engrenagens 50% mais leves e 50% mais econômicas em comparação com alternativas metálicas, possibilitando a produção em larga escala de robôs leves e energeticamente eficientes. A inovação beneficia significativamente a Envalior, expandindo sua presença nos setores de robótica e mobilidade, abrindo novas oportunidades de crescimento nos setores de automação industrial e de consumo.
- Em maio de 2024, a Envalior anunciou sua participação na conferência SKZ “Plastics in E&E Applications”, onde apresentou inovações de produtos, incluindo compostos sustentáveis de poliamida 6 e um novo PBT retardante de chamas sem halogênio (por exemplo, Pocan BFN4221Z). Este desenvolvimento visa expandir o portfólio de plásticos de engenharia da Envalior com uma proporção maior de matérias-primas sustentáveis, permitindo que os clientes reduzam sua pegada de carbono e a dependência de insumos fósseis. Os materiais em destaque oferecem desempenho mecânico e retardamento de chama aprimorados, posicionando a Envalior para melhor atender à crescente demanda em setores de E&E, como eletromobilidade, 5G e sistemas autônomos, ao mesmo tempo em que reforça sua liderança em termoplásticos sustentáveis.
- Em julho de 2025, a Arkema lançou Zenimid, uma nova marca para sua linha de poliimida de ultra-alto desempenho, marcando um desenvolvimento estratégico de produto. Essa inovação aprimora o portfólio de materiais especiais da Arkema, atendendo a setores de alta demanda, como aeroespacial, eletrônico e automotivo. Com excepcional resistência térmica, mecânica e química, Zenimid impulsiona o crescimento da empresa em aplicações avançadas. O lançamento reforça a posição da Arkema no mercado de polímeros de alto desempenho.
- Em junho de 2025, a Trinseo apresentou o LIGOS A9615, um novo adesivo acrílico desenvolvido especialmente para o segmento de Etiquetas de Uso Geral (GPL), lançado em 9 de junho de 2025, voltado para etiquetas de filme no mercado do Sudeste Asiático. Este desenvolvimento representa um lançamento estratégico de produto que reforça a força da Trinseo em inovação em adesivos. Os principais benefícios do produto incluem excelente resistência ao envelhecimento, remoção limpa com capacidade de reposicionamento e resistência a plastificantes, permitindo adesão confiável mesmo em superfícies curvas de PVC comuns em aplicações de bens de consumo e embalagens.
- Em fevereiro de 2025, a Trinseo anunciou o lançamento do primeiro produto de resina de poliestireno reciclado por dissolução (rPS) transparente na Europa, aprovado especificamente para contato direto com alimentos, oficialmente em conformidade com o Regulamento (UE) 2022/1616. Este marco regulatório ocorreu após extensos testes, incluindo um "Teste de Desafio" conduzido com o Instituto Fraunhofer para validar a eficácia da descontaminação e a conformidade com a segurança alimentar da resina final. Produzida na unidade da Trinseo em Schkopau e contendo aproximadamente 30% de conteúdo reciclado, a nova resina rPS oferece uma redução de pegada de carbono de cerca de 18% em comparação com o poliestireno virgem. Para a Trinseo, este desenvolvimento representa um avanço estratégico em sustentabilidade, permitindo à empresa atender à crescente demanda por soluções de materiais circulares e apoiar as metas de conteúdo reciclado de seus clientes.
SKU-
Obtenha acesso online ao relatório sobre a primeira nuvem de inteligência de mercado do mundo

- Painel interativo de análise de dados
- Painel de análise da empresa para oportunidades de elevado potencial de crescimento
- Acesso de analista de pesquisa para personalização e customização. consultas
- Análise da concorrência com painel interativo
- Últimas notícias, atualizações e atualizações Análise de tendências
- Aproveite o poder da análise de benchmark para um rastreio abrangente da concorrência
Índice
1 INTRODUCTION
1.1 OBJECTIVES OF THE STUDY
1.2 MARKET DEFINITION
1.3 OVERVIEW
1.4 LIMITATIONS
1.5 MARKETS COVERED
2 MARKET SEGMENTATION
2.1 MARKETS COVERED
2.2 GEOGRAPHICAL SCOPE
2.3 YEARS CONSIDERED FOR THE STUDY
2.4 CURRENCY AND PRICING
2.5 DBMR TRIPOD DATA VALIDATION MODEL
2.6 MULTIVARIATE MODELING
2.7 PRIMARY INTERVIEWS WITH KEY OPINION LEADERS
2.8 DBMR MARKET POSITION GRID
2.9 MARKET APPLICATION COVERAGE GRID
2.1 SECONDARY SOURCES
2.11 ASSUMPTIONS
3 EXECUTIVE SUMMARY
4 PREMIUM INSIGHTS
4.1 PORTER’S FIVE FORCES ANALYSIS
4.1.1 THREAT OF NEW ENTRANTS
4.1.2 BARGAINING POWER OF SUPPLIERS
4.1.3 BARGAINING POWER OF BUYERS
4.1.4 THREAT OF SUBSTITUTES
4.1.5 INTERNAL COMPETITION
4.2 INNOVATION TRACKER AND STRATEGIC ANALYSIS
4.2.1 MAJOR DEALS AND STRATEGIC ALLIANCES ANALYSIS
4.2.1.1 JOINT VENTURES
4.2.1.2 MERGERS AND ACQUISITIONS
4.2.1.3 LICENSING AND PARTNERSHIP
4.2.1.4 TECHNOLOGY COLLABORATIONS
4.2.1.5 STRATEGIC DIVESTMENTS
4.2.2 NUMBER OF PRODUCTS IN DEVELOPMENT
4.2.3 STAGE OF DEVELOPMENT
4.2.4 TIMELINES AND MILESTONES
4.2.5 INNOVATION STRATEGIES AND METHODOLOGIES
4.2.6 RISK ASSESSMENT AND MITIGATION
4.2.7 FUTURE OUTLOOK
4.3 VALUE CHAIN ANALYSIS
4.4 IMPORT EXPORT SCENARIO
4.5 PRODUCTION CAPACITY FOR TOP MANUFACTURERS
4.6 BRAND OUTLOOK
4.7 CONSUMER BUYING BEHAVIOUR
4.8 DATA BASE OF COMPOUNDERS & THE EQUIPMENT THEY HAVE IN USE
4.9 PATENT ANALYSIS
4.9.1 PATENT QUALITY AND STRENGTH
4.9.2 PATENT FAMILIES
4.9.3 LICENSING AND COLLABORATIONS
4.9.4 REGION PATENT LANDSCAPE
4.9.5 IP STRATEGY AND MANAGEMENT
4.1 RAW MATERIAL COVERAGE
4.11 SUPPLY CHAIN ANALYSIS OF THE GLOBAL PLASTIC COMPOUNDING MARKET
4.11.1 OVERVIEW
4.11.2 LOGISTIC COST SCENARIOS
4.11.3 IMPORTANCE OF LOGISTICS SERVICE PROVIDERS (LSPS)
4.12 TECHNOLOGICAL ADVANCEMENTS IN THE GLOBAL PLASTIC COMPOUNDING MARKET
4.12.1 AI AND DIGITAL PROCESS OPTIMIZATION
4.12.2 ADVANCED EXTRUSION AND MATERIAL HANDLING TECHNOLOGIES
4.12.3 BIO-BASED AND FUNCTIONALIZED POLYMER COMPOUNDS
4.12.4 SMART AND RESPONSIVE COMPOUNDING SOLUTIONS
4.12.5 AUTOMATION AND INDUSTRY 4.0 IN COMPOUNDING OPERATIONS
4.12.6 SUSTAINABILITY AND CIRCULAR ECONOMY INNOVATIONS
4.12.7 DIGITAL CUSTOMER ENGAGEMENT AND FORMULATION PLATFORMS
4.13 VENDOR SELECTION CRITERIA
4.14 COMPANY EVALUATION QUADRANT
4.15 PRICING ANALYSIS
5 ROLE OF TARIFFS IN THE GLOBAL PLASTIC COMPOUNDING MARKET
5.1 TARIFF LANDSCAPE: DUTIES ON POLYMERS, ADDITIVES, AND MACHINERY
5.2 IMPACT OF TARIFFS ON COST STRUCTURES AND SUPPLY CHAIN DYNAMICS
5.3 INFLUENCE OF TRADE AGREEMENTS AND REGULATORY POLICIES
5.4 MARKET TRENDS AMPLIFYING TARIFF IMPACTS
5.5 COMPETITIVE IMPLICATIONS FOR INDUSTRY PARTICIPANTS
5.6 CHALLENGES AND OPPORTUNITIES ARISING FROM TARIFFS
5.7 KEY COMPANIES AND TARIFF STRATEGY SNAPSHOT
6 REGULATION COVERAGE: GLOBAL PLASTIC COMPOUNDING MARKET
7 MARKET OVERVIEW
7.1 DRIVERS
7.1.1 SHIFT TOWARDS RECYCLABLE AND BIODEGRADABLE PLASTIC COMPOUNDS DUE TO ENVIRONMENTAL REGULATIONS
7.1.2 ADVANCEMENTS IN COMPOUNDING TECHNOLOGIES IMPROVING PRODUCT PERFORMANCE AND COST-EFFICIENCY
7.1.3 DEVELOPMENT OF NANOCOMPOSITE PLASTICS OFFERING SUPERIOR MECHANICAL AND BARRIER PROPERTIES
7.1.4 INCREASED USE OF COMPOUNDED PLASTICS IN MEDICAL DEVICES DUE TO BIOCOMPATIBILITY AND STERILIZATION COMPATIBILITY
7.2 RESTRAINTS
7.2.1 VOLATILITY IN RAW MATERIAL PRICES, ESPECIALLY PETROLEUM-BASED FEEDSTOCKS LIKE POLYPROPYLENE AND POLYETHYLENE
7.2.2 COMPLEX RECYCLING PROCESSES AND LACK OF PROPER INFRASTRUCTURE FOR PLASTIC COMPOUND WASTE MANAGEMENT
7.3 OPPORTUNITIES
7.3.1 GROWING USE OF BIOPLASTICS AND SUSTAINABLE COMPOUND ALTERNATIVES
7.3.2 SURGE IN ELECTRIC VEHICLE ADOPTION REQUIRING ADVANCED POLYMERS
7.3.3 INCREASING DEMAND FOR RECYCLABLE AND CIRCULAR PLASTIC SOLUTIONS
7.4 CHALLENGES
7.4.1 PERFORMANCE LIMITATIONS OF SUSTAINABLE ALTERNATIVES
7.4.2 REGULATORY AND STANDARDS FRAGMENTATION ACROSS REGIONS
8 GLOBAL PLASTIC COMPOUNDING MARKET, BY POLYMER TYPE
8.1 OVERVIEW
8.2 THERMOPLASTICS
8.2.1 THERMOPLASTICS, BY TYPE
8.2.2 POLYETHYLENE (PE), BY TYPE
8.3 ENGINEERING PLASTICS
8.3.1 ENGINEERING PLASTICS, BY TYPE
8.4 THERMOSETTING PLASTICS
8.4.1 THERMOSETTING PLASTICS, BY TYPE
8.5 BIOPLASTICS
8.5.1 BIOPLASTICS, BY TYPE
8.6 OTHERS
9 GLOBAL PLASTIC COMPOUNDING MARKET, BY FILLER TYPE
9.1 OVERVIEW
9.2 MINERAL FILLERS
9.2.1 MINERAL FILLERS, BY TYPE
9.3 REINFORCEMENTS
9.3.1 REINFORCEMENTS, BY TYPE
9.4 ADDITIVES
9.4.1 ADDITIVES, BY TYPE
9.5 OTHERS
10 GLOBAL PLASTIC COMPOUNDING MARKET, BY MANUFACTURING PROCESS
10.1 OVERVIEW
10.2 EXTRUSION
10.2.1 EXTRUSION, BY TYPE
10.2.2 EXTRUSION, BY PELLETIZING SYSTEM
10.3 INJECTION MOLDING BASED COMPOUNDING
10.3.1 INJECTION MOLDING BASED COMPOUNDING, BY PELLETIZING SYSTEM
10.4 COMPACTION/PRESSING
10.4.1 COMPACTION/PRESSING, BY PELLETIZING SYSTEM
10.5 KNEADER/BANBURY MIXING
10.5.1 KNEADER/BANBURY MIXING, BY PELLETIZING SYSTEM
10.6 OTHERS
11 GLOBAL PLASTIC COMPOUNDING MARKET, BY PROPERTIES
11.1 OVERVIEW
11.2 RESISTANCE
11.3 DURABILITY
11.4 FLEXIBILITY
11.5 IMPACT RESISTANCE
11.6 RIGIDITY
11.7 OTHERS
12 GLOBAL PLASTIC COMPOUNDING MARKET, BY APPLICATION
12.1 OVERVIEW
12.2 AUTOMOTIVE
12.2.1 AUTOMOTIVE, BY CATEGORY
12.2.1.1 INTERIOR COMPONENTS, BY TYPE
12.2.1.2 EXTERIOR BODY PARTS, BY TYPE
12.2.1.3 UNDER-THE-HOOD APPLICATIONS, BY TYPE
12.3 PACKAGING
12.3.1 PACKAGING, BY CATEGORY
12.3.1.1 FOOD & BEVERAGE PACKAGING, BY TYPE
12.3.1.2 INDUSTRIAL PACKAGING, BY TYPE
12.3.1.3 CONSUMER GOODS PACKAGING, BY TYPE
12.4 BUILDING & CONSTRUCTION
12.4.1 BUILDING & CONSTRUCTION, BY CATEGORY
12.5 ELECTRICAL & ELECTRONICS
12.5.1 ELECTRICAL & ELECTRONICS, BY CATEGORY
12.6 MEDICAL DEVICES
12.6.1 MEDICAL DEVICES, BY CATEGORY
12.7 FURNITURE
12.7.1 FURNITURE, BY CATEGORY
12.8 ENERGY AND POWER
12.8.1 ENERGY & POWER, BY CATEGORY
12.9 AEROSPACE AND DEFENSE
12.9.1 AEROSPACE AND DEFENSE, BY CATEGORY
12.1 OTHERS
13 GLOBAL PLASTIC COMPOUNDING MARKET BY COUNTRIES
13.1 OVERVIEW
13.2 NORTH AMERICA
13.2.1 U.S.
13.2.2 CANADA
13.2.3 MEXICO
13.3 EUROPE
13.3.1 GERMANY
13.3.2 ITALY
13.3.3 FRANCE
13.3.4 U.K.
13.3.5 SPAIN
13.3.6 RUSSIA
13.3.7 SWITZERLAND
13.3.8 TURKEY
13.3.9 BELGIUM
13.3.10 NETHERLANDS
13.3.11 NORWAY
13.3.12 FINLAND
13.3.13 DENMARK
13.3.14 SWEDEN
13.3.15 REST OF EUROPE
13.4 ASIA-PACIFIC
13.4.1 CHINA
13.4.2 INDIA
13.4.3 JAPAN
13.4.4 SOUTH KOREA
13.4.5 THAILAND
13.4.6 SINGAPORE
13.4.7 INDONESIA
13.4.8 AUSTRALIA
13.4.9 NEW ZEALAND
13.4.10 PHILIPPINES
13.4.11 MALAYSIA
13.4.12 TAIWAN
13.4.13 HONG KONG
13.4.14 REST OF ASIA-PACIFIC
13.5 MIDDLE EAST AND AFRICA
13.5.1 SAUDI ARABIA
13.5.2 EGYPT
13.5.3 U.A.E.
13.5.4 SOUTH AFRICA
13.5.5 ISRAEL
13.5.6 KUWAIT
13.5.7 OMAN
13.5.8 QATAR
13.5.9 BAHRAIN
13.5.10 REST OF MIDDLE EAST AND AFRICA
13.6 SOUTH AMERICA
13.6.1 BRAZIL
13.6.2 ARGENTINA
13.6.3 COLOMBIA
13.6.4 CHILE
13.6.5 PERU
13.6.6 ECUADOR
13.6.7 VENEZUELA
13.6.8 BOLIVIA
13.6.9 PARAGUAY
13.6.10 URUGUAY
13.6.11 REST OF SOUTH AMERICA
14 GLOBAL PLASTIC COMPOUNDING MARKET: COMPANY LANDSCAPE
14.1 COMPANY SHARE ANALYSIS: GLOBAL
14.2 COMPANY SHARE ANALYSIS: NORTH AMERICA
14.3 COMPANY SHARE ANALYSIS: EUROPE
14.4 COMPANY SHARE ANALYSIS: ASIA-PACIFIC
15 SWOT ANALYSIS
16 COMPANY PROFILES
16.1 SABIC
16.1.1 COMPANY SNAPSHOT
16.1.2 REVENUE ANALYSIS
16.1.3 COMPANY SHARE ANALYSIS
16.1.4 PRODUCT PORTFOLIO
16.1.5 RECENT DEVELOPMENT
16.2 LYONDELLBASELL INDUSTRIES HOLDINGS B.V.
16.2.1 COMPANY SNAPSHOT
16.2.2 REVENUE ANALYSIS
16.2.3 COMPANY SHARE ANALYSIS
16.2.4 PRODUCT PORTFOLIO
16.2.5 RECENT DEVELOPMENTS/NEWS
16.3 DOW
16.3.1 COMPANY SNAPSHOT
16.3.2 REVENUE ANALYSIS
16.3.3 COMPANY SHARE ANALYSIS
16.3.4 PRODUCT PORTFOLIO
16.3.5 RECENT DEVELOPMENT
16.4 DUPONT
16.4.1 COMPANY SNAPSHOT
16.4.2 REVENUE ANALYSIS
16.4.3 COMPANY SHARE ANALYSIS
16.4.4 PRODUCT PORTFOLIO
16.4.5 RECENT DEVELOPMENT
16.5 ARKEMA
16.5.1 COMPANY SNAPSHOT
16.5.2 REVENUE ANALYSIS
16.5.3 COMPANY SHARE ANALYSIS
16.5.4 PRODUCT PORTFOLIO
16.5.5 RECENT DEVELOPMENTS
16.6 ASAHI KASEI CORP.
16.6.1 COMPANY SNAPSHOT
16.6.2 REVENUE ANALYSIS
16.6.3 PRODUCT PORTFOLIO
16.6.4 RECENT DEVELOPMENT
16.7 AVIENT CORPORATION
16.7.1 COMPANY SNAPSHOT
16.7.2 REVENUE ANALYSIS
16.7.3 PRODUCT PORTFOLIO
16.7.4 RECENT DEVELOPMENT
16.8 BOREALIS GMBH
16.8.1 COMPANY SNAPSHOT
16.8.2 PRODUCT PORTFOLIO
16.8.3 RECENT DEVELOPMENT
16.9 BASF
16.9.1 COMPANY SNAPSHOT
16.9.2 REVENUE ANALYSIS
16.9.3 PRODUCT PORTFOLIO
16.9.4 RECENT DEVELOPMENT
16.1 CLEANESE CORPORATION
16.10.1 COMPANY SNAPSHOT
16.10.2 REVENUE ANALYSIS
16.10.3 PRODUCT PORTFOLIO
16.10.4 RECENT DEVELOPMENT
16.11 CHIMEI
16.11.1 COMPANY SNAPSHOT
16.11.2 REVENUE ANALYSIS
16.11.3 PRODUCT PORTFOLIO
16.11.4 RECENT DEVELOPMENT
16.12 CLARIANT
16.12.1 COMPANY SNAPSHOT
16.12.2 REVENUE ANALYSIS
16.12.3 PRODUCT PORTFOLIO
16.12.4 RECENT DEVELOPMENT
16.13 COVESTRO AG
16.13.1 COMPANY SNAPSHOT
16.13.2 REVENUE ANALYSIS
16.13.3 PRODUCT PORTFOLIO
16.13.4 RECENT DEVELOPMENT
16.14 DAICEL CORPORATION
16.14.1 COMPANY SNAPSHOT
16.14.2 REVENUE ANALYSIS
16.14.3 PRODUCT PORTFOLIO
16.14.4 RECENT DEVELOPMENTS
16.15 ENSINGER GMBH
16.15.1 COMPANY SNAPSHOT
16.15.2 PRODUCT PORTFOLIO
16.15.3 RECENT DEVELOPMENT
16.16 ENVALIOR
16.16.1 COMPANY SNAPSHOT
16.16.2 PRODUCT PORTFOLIO
16.16.3 RECENT DEVELOPMENTS
16.17 INEOS
16.17.1 COMPANY SNAPSHOT
16.17.2 PRODUCT PORTFOLIO
16.17.3 RECENT DEVELOPMENT
16.18 KANEKA CORPORATION
16.18.1 COMPANY SNAPSHOT
16.18.2 REVENUE ANALYSIS
16.18.3 PRODUCT PORTFOLIO
16.18.4 RECENT DEVELOPMENT
16.19 KINGFA SCI.&TECH. CO.,LTD.
16.19.1 COMPANY SNAPSHOT
16.19.2 REVENUE ANALYSIS
16.19.3 PRODUCT PORTFOLIO
16.19.4 RECENT DEVELOPMENT
16.2 LANXESS
16.20.1 COMPANY SNAPSHOT
16.20.2 REVENUE ANALYSIS
16.20.3 BUSINESS PORTFOLIO
16.20.4 RECENT DEVELOPMENT
16.21 LG CHEM
16.21.1 COMPANY SNAPSHOT
16.21.2 REVENUE ANALYSIS
16.21.3 PRODUCT PORTFOLIO
16.21.4 RECENT DEVELOPMENT
16.22 MITSUBISHI CHEMICAL GROUP CORPORATION.
16.22.1 COMPANY SNAPSHOT
16.22.2 REVENUE ANALYSIS
16.22.3 PRODUCT PORTFOLIO
16.22.4 RECENT DEVELOPMENT
16.23 MITSUI CHEMICALS, INC
16.23.1 COMPANY SNAPSHOT
16.23.2 REVENUE ANALYSIS
16.23.3 PRODUCT PORTFOLIO
16.23.4 RECENT DEVELOPMENT
16.24 RTP COMPANY
16.24.1 COMPANY SNAPSHOT
16.24.2 PRODUCT PORTFOLIO
16.24.3 RECENT DEVELOPMENT
16.25 SCG
16.25.1 COMPANY SNAPSHOT
16.25.2 REVENUE ANALYSIS
16.25.3 PRODUCT PORTFOLIO
16.25.4 RECENT DEVELOPMENT
16.26 SYENSQO
16.26.1 COMPANY SNAPSHOT
16.26.2 REVENUE ANALYSIS
16.26.3 PRODUCT PORTFOLIO
16.26.4 RECENT DEVELOPMENTS
16.27 TEKNOR APEX
16.27.1 COMPANY SNAPSHOT
16.27.2 PRODUCT PORTFOLIO
16.27.3 RECENT DEVELOPMENT
16.28 TORAY INDUSTRIES, INC.
16.28.1 COMPANY SNAPSHOT
16.28.2 REVENUE ANALYSIS
16.28.3 PRODUCT PORTFOLIO
16.28.4 RECENT DEVELOPMENT
16.29 TRINSEO
16.29.1 COMPANY SNAPSHOT
16.29.2 REVENUE ANALYSIS
16.29.3 SOLUTION PORTFOLIO
16.29.4 RECENT DEVELOPMENTS
16.3 WASHINGTON PENN
16.30.1 COMPANY SNAPSHOT
16.30.2 PRODUCT PORTFOLIO
16.30.3 RECENT DEVELOPMENT
17 QUESTIONNAIRE
18 RELATED REPORTS
Lista de Tabela
TABLE 1 STAGES OF VALUE CHAIN
TABLE 2 BRAND OUTLOOK: GLOBAL PLASTIC COMPOUNDING MARKET
TABLE 3 CONSUMER BUYING BEHAVIOUR
TABLE 4 GLOBAL PLAYERS IN PLASTIC COMPOUNDING
TABLE 5 NUMBER OF PATENTS PER YEAR
TABLE 6 NUMBER OF PATENTS PER REGION/COUNTRY
TABLE 7 TOP PATENT APPLICANTS
TABLE 8 TARIFF EXPOSURE AND STRATEGIC RESPONSE BY COMPANY TYPE
TABLE 9 TARIFF EXPOSURE AND STRATEGIC RESPONSE OF KEY PLAYERS
TABLE 10 GLOBAL PLASTIC COMPOUNDING MARKET, BY POLYMER TYPE, 2018-2032 (USD THOUSAND)
TABLE 11 GLOBAL PLASTIC COMPOUNDING MARKET, BY POLYMER TYPE, 2018-2032 (KILO TONS)
TABLE 12 GLOBAL THERMOPLASTICS IN PLASTIC COMPOUNDING MARKET, BY REGION, 2018-2032 (USD THOUSAND)
TABLE 13 GLOBAL THERMOPLASTICS IN PLASTIC COMPOUNDING MARKET, BY REGION, 2018-2032 (KILO TONS)
TABLE 14 GLOBAL THERMOPLASTICS IN PLASTIC COMPOUNDING MARKET, BY TYPE, 2018-2032 (USD THOUSAND)
TABLE 15 GLOBAL POLYETHYLENE (PE) IN PLASTIC COMPOUNDING MARKET, BY TYPE, 2018-2032 (USD THOUSAND)
TABLE 16 GLOBAL ENGINEERING PLASTICS IN PLASTIC COMPOUNDING MARKET, BY REGION, 2018-2032 (USD THOUSAND )
TABLE 17 GLOBAL ENGINEERING PLASTICS IN PLASTIC COMPOUNDING MARKET, BY REGION, 2018-2032 (KILO TONS)
TABLE 18 GLOBAL ENGINEERING PLASTICS IN PLASTIC COMPOUNDING MARKET, BY TYPE, 2018-2032 (USD THOUSAND)
TABLE 19 GLOBAL THERMOSETTING PLASTICS IN PLASTIC COMPOUNDING MARKET, BY REGION, 2018-2032 (USD THOUSAND)
TABLE 20 GLOBAL THERMOSETTING PLASTICS IN PLASTIC COMPOUNDING MARKET, BY REGION, 2018-2032 (KILO TONS)
TABLE 21 GLOBAL THERMOSETTING PLASTICS IN PLASTIC COMPOUNDING MARKET, BY TYPE, 2018-2032 (USD THOUSAND)
TABLE 22 GLOBAL BIOPLASTICS IN PLASTIC COMPOUNDING MARKET, BY REGION, 2018-2032 (USD THOUSAND)
TABLE 23 GLOBAL BIOPLASTICS IN PLASTIC COMPOUNDING MARKET, BY REGION, 2018-2032 (KILO TONS)
TABLE 24 GLOBAL BIOPLASTICS IN PLASTIC COMPOUNDING MARKET, BY TYPE, 2018-2032 (USD THOUSAND)
TABLE 25 GLOBAL OTHERS IN PLASTIC COMPOUNDING MARKET, BY REGION, 2018-2032 (USD THOUSAND)
TABLE 26 GLOBAL OTHERS IN PLASTIC COMPOUNDING MARKET, BY REGION, 2018-2032 (KILO TONS)
TABLE 27 GLOBAL PLASTIC COMPOUNDING MARKET, BY FILTER TYPE, 2018-2032 (USD THOUSAND)
TABLE 28 GLOBAL MINERAL FILLERS IN PLASTIC COMPOUNDING MARKET, BY REGION, 2018-2032 (USD THOUSAND)
TABLE 29 GLOBAL MINERAL FILLERS IN PLASTIC COMPOUNDING MARKET, BY TYPE, 2018-2032 (USD THOUSAND)
TABLE 30 GLOBAL REINFORCEMENTS IN PLASTIC COMPOUNDING MARKET, BY REGION, 2018-2032 (USD THOUSAND)
TABLE 31 GLOBAL REINFORCEMENTS IN PLASTIC COMPOUNDING MARKET, BY TYPE, 2018-2032 (USD THOUSAND)
TABLE 32 GLOBAL ADDITIVES IN PLASTIC COMPOUNDING MARKET, BY REGION, 2018-2032 (USD THOUSAND)
TABLE 33 GLOBAL ADDITIVES IN PLASTIC COMPOUNDING MARKET, BY TYPE, 2018-2032 (USD THOUSAND)
TABLE 34 GLOBAL OTHERS IN PLASTIC COMPOUNDING MARKET, BY REGION, 2018-2032 (USD THOUSAND)
TABLE 35 GLOBAL PLASTIC COMPOUNDING MARKET, BY MANUFACTURING PROCESS, 2018-2032 (USD THOUSAND)
TABLE 36 GLOBAL PLASTIC COMPOUNDING MARKET, BY MANUFACTURING PROCESS, 2018-2032 (KILO TONS)
TABLE 37 GLOBAL EXTRUSION IN PLASTIC COMPOUNDING MARKET, BY REGION, 2018-2032 (USD THOUSAND)
TABLE 38 GLOBAL EXTRUSION IN PLASTIC COMPOUNDING MARKET, BY REGION, 2018-2032 (KILO TONS)
TABLE 39 GLOBAL EXTRUSION IN PLASTIC COMPOUNDING MARKET, BY TYPE, 2018-2032 (USD THOUSAND)
TABLE 40 GLOBAL EXTRUSION IN PLASTIC COMPOUNDING MARKET, BY PELLETIZING SYSTEM, 2018-2032 (USD THOUSAND)
TABLE 41 GLOBAL INJECTION MOLDING BASED COMPOUNDING IN PLASTIC COMPOUNDING MARKET, BY REGION, 2018-2032 (USD THOUSAND)
TABLE 42 GLOBAL INJECTION MOLDING BASED COMPOUNDING IN PLASTIC COMPOUNDING MARKET, BY REGION, 2018-2032 (KILO TONS)
TABLE 43 GLOBAL INJECTION MOLDING BASED COMPOUNDING IN PLASTIC COMPOUNDING MARKET, BY PELLETIZING SYSTEM, 2018-2032 (USD THOUSAND)
TABLE 44 GLOBAL COMPACTION/PRESSING IN PLASTIC COMPOUNDING MARKET, BY REGION, 2018-2032 (USD THOUSAND)
TABLE 45 GLOBAL COMPACTION/PRESSING IN PLASTIC COMPOUNDING MARKET, BY REGION, 2018-2032 (KILO TONS)
TABLE 46 GLOBAL COMPACTION/PRESSING IN PLASTIC COMPOUNDING MARKET, BY PELLETIZING SYSTEM, 2018-2032 (USD THOUSAND)
TABLE 47 GLOBAL KNEADER/BANBURY MIXING IN PLASTIC COMPOUNDING MARKET, BY REGION, 2018-2032 (USD THOUSAND)
TABLE 48 GLOBAL KNEADER/BANBURY MIXING IN PLASTIC COMPOUNDING MARKET, BY REGION, 2018-2032 (KILO TONS)
TABLE 49 GLOBAL KNEADER/BANBURY MIXING IN PLASTIC COMPOUNDING MARKET, BY PELLETIZING SYSTEM, 2018-2032 (USD THOUSAND)
TABLE 50 GLOBAL OTHERS IN PLASTIC COMPOUNDING MARKET, BY REGION, 2018-2032 (USD THOUSAND)
TABLE 51 GLOBAL OTHERS IN PLASTIC COMPOUNDING MARKET, BY REGION, 2018-2032 (KILO TONS)
TABLE 52 GLOBAL PLASTIC COMPOUNDING MARKET, BY PROPERTIES, 2018-2032 (USD THOUSAND)
TABLE 53 GLOBAL RESISTANCE IN PLASTIC COMPOUNDING MARKET, BY REGION, 2018-2032 (USD THOUSAND)
TABLE 54 GLOBAL DURABILITY IN PLASTIC COMPOUNDING MARKET, BY REGION, 2018-2032 (USD THOUSAND)
TABLE 55 GLOBAL FLEXIBILITY IN PLASTIC COMPOUNDING MARKET, BY REGION, 2018-2032 (USD THOUSAND)
TABLE 56 GLOBAL IMPACT RESISTANCE IN PLASTIC COMPOUNDING MARKET, BY REGION, 2018-2032 (USD THOUSAND)
TABLE 57 GLOBAL RIGIDITY IN PLASTIC COMPOUNDING MARKET, BY REGION, 2018-2032 (USD THOUSAND)
TABLE 58 GLOBAL OTHERS IN PLASTIC COMPOUNDING MARKET, BY REGION, 2018-2032 (USD THOUSAND)
TABLE 59 GLOBAL PLASTIC COMPOUNDING MARKET, BY APPLICATION, 2018-2032 (USD THOUSAND)
TABLE 60 GLOBAL PLASTIC COMPOUNDING MARKET, BY APPLICATION, 2018-2032 (KILO TONS)
TABLE 61 GLOBAL AUTOMOTIVE IN PLASTIC COMPOUNDING MARKET, BY REGION, 2018-2032 (USD THOUSAND)
TABLE 62 GLOBAL AUTOMOTIVE IN PLASTIC COMPOUNDING MARKET, BY REGION, 2018-2032 (KILO TONS)
TABLE 63 GLOBAL AUTOMOTIVE IN PLASTIC COMPOUNDING MARKET, BY CATEGORY, 2018-2032 (USD THOUSAND)
TABLE 64 GLOBAL INTERIOR COMPONENTS IN PLASTIC COMPOUNDING MARKET, BY TYPE, 2018-2032 (USD THOUSAND)
TABLE 65 GLOBAL EXTERIOR BODY PARTS IN PLASTIC COMPOUNDING MARKET, BY TYPE, 2018-2032 (USD THOUSAND)
TABLE 66 GLOBAL UNDER-THE-HOOD APPLICATIONS IN PLASTIC COMPOUNDING MARKET, BY TYPE, 2018-2032 (USD THOUSAND)
TABLE 67 GLOBAL PACKAGING IN PLASTIC COMPOUNDING MARKET, BY REGION, 2018-2032 (USD THOUSAND)
TABLE 68 GLOBAL PACKAGING IN PLASTIC COMPOUNDING MARKET, BY REGION, 2018-2032 (KILO TONS)
TABLE 69 GLOBAL PACKAGING IN PLASTIC COMPOUNDING MARKET, BY CATEGORY, 2018-2032 (USD THOUSAND)
TABLE 70 GLOBAL FOOD & BEVERAGE PACKAGING IN PLASTIC COMPOUNDING MARKET, BY TYPE, 2018-2032 (USD THOUSAND)
TABLE 71 GLOBAL INDUSTRIAL PACKAGING IN PLASTIC COMPOUNDING MARKET, BY TYPE, 2018-2032 (USD THOUSAND)
TABLE 72 GLOBAL CONSUMER GOODS PACKAGING IN PLASTIC COMPOUNDING MARKET, BY TYPE, 2018-2032 (USD THOUSAND)
TABLE 73 GLOBAL BUILDING & CONSTRUCTION IN PLASTIC COMPOUNDING MARKET, BY REGION, 2018-2032 (USD THOUSAND)
TABLE 74 GLOBAL BUILDING & CONSTRUCTION IN PLASTIC COMPOUNDING MARKET, BY REGION, 2018-2032 (KILO TONS)
TABLE 75 GLOBAL BUILDING & CONSTRUCTION IN PLASTIC COMPOUNDING MARKET, BY CATEGORY, 2018-2032 (USD THOUSAND)
TABLE 76 GLOBAL ELECTRICAL & ELECTRONICS IN PLASTIC COMPOUNDING MARKET, BY REGION, 2018-2032 (USD THOUSAND)
TABLE 77 GLOBAL ELECTRICAL & ELECTRONICS IN PLASTIC COMPOUNDING MARKET, BY REGION, 2018-2032 (KILO TONS)
TABLE 78 GLOBAL ELECTRICAL & ELECTRONICS IN PLASTIC COMPOUNDING MARKET, BY CATEGORY, 2018-2032 (USD THOUSAND)
TABLE 79 GLOBAL MEDICAL DEVICES IN PLASTIC COMPOUNDING MARKET, BY REGION, 2018-2032 (USD THOUSAND)
TABLE 80 GLOBAL MEDICAL DEVICES IN PLASTIC COMPOUNDING MARKET, BY REGION, 2018-2032 (KILO TONS)
TABLE 81 GLOBAL MEDICAL DEVICES IN PLASTIC COMPOUNDING MARKET, BY CATEGORY, 2018-2032 (USD THOUSAND)
TABLE 82 GLOBAL FURNITURE IN PLASTIC COMPOUNDING MARKET, BY REGION, 2018-2032 (USD THOUSAND)
TABLE 83 GLOBAL FURNITURE IN PLASTIC COMPOUNDING MARKET, BY REGION, 2018-2032 (KILO TONS)
TABLE 84 GLOBAL FURNITURE IN PLASTIC COMPOUNDING MARKET, BY CATEGORY, 2018-2032 (USD THOUSAND)
TABLE 85 GLOBAL ENERGY AND POWER IN PLASTIC COMPOUNDING MARKET, BY REGION, 2018-2032 (USD THOUSAND)
TABLE 86 GLOBAL ENERGY AND POWER IN PLASTIC COMPOUNDING MARKET, BY REGION, 2018-2032 (KILO TONS)
TABLE 87 GLOBAL ENERGY AND POWER IN PLASTIC COMPOUNDING MARKET, BY CATEGORY, 2018-2032 (USD THOUSAND)
TABLE 88 GLOBAL AEROSPACE AND DEFENSE IN PLASTIC COMPOUNDING MARKET, BY REGION, 2018-2032 (USD THOUSAND)
TABLE 89 GLOBAL AEROSPACE AND DEFENSE IN PLASTIC COMPOUNDING MARKET, BY REGION, 2018-2032 (KILO TONS)
TABLE 90 GLOBAL AEROSPACE AND DEFENSE IN PLASTIC COMPOUNDING MARKET, BY CATEGORY, 2018-2032 (USD THOUSAND)
TABLE 91 GLOBAL OTHERS IN PLASTIC COMPOUNDING MARKET, BY REGION, 2018-2032 (USD THOUSAND)
TABLE 92 GLOBAL OTHERS IN PLASTIC COMPOUNDING MARKET, BY REGION, 2018-2032 (KILO TONS)
TABLE 93 GLOBAL PLASTIC COMPOUNDING MARKET, BY REGION, 2018-2032 (USD THOUSAND)
TABLE 94 GLOBAL PLASTIC COMPOUNDING MARKET, BY REGION, 2018-2032 (KILO TONS)
TABLE 95 NORTH AMERICA PLASTIC COMPOUNDING MARKET, BY COUNTRY, 2018-2032 (USD THOUSAND)
TABLE 96 NORTH AMERICA PLASTIC COMPOUNDING MARKET, BY COUNTRY, 2018-2032 (KILO TONS)
TABLE 97 NORTH AMERICA PLASTIC COMPOUNDING MARKET, BY POLYMER TYPE, 2018-2032 (USD THOUSAND)
TABLE 98 NORTH AMERICA PLASTIC COMPOUNDING MARKET, BY POLYMER TYPE, 2018-2032 (KILO TONS)
TABLE 99 NORTH AMERICA THERMOPLASTICS IN PLASTIC COMPOUNDING MARKET, BY TYPE, 2018-2032 (USD THOUSAND)
TABLE 100 NORTH AMERICA POLYETHYLENE (PE) IN PLASTIC COMPOUNDING MARKET, BY TYPE, 2018-2032 (USD THOUSAND)
TABLE 101 NORTH AMERICA ENGINEERING PLASTICS IN PLASTIC COMPOUNDING MARKET, BY TYPE, 2018-2032 (USD THOUSAND)
TABLE 102 NORTH AMERICA THERMOSETTING PLASTICS IN PLASTIC COMPOUNDING MARKET, BY TYPE, 2018-2032 (USD THOUSAND)
TABLE 103 NORTH AMERICA BIOPLASTICS IN PLASTIC COMPOUNDING MARKET, BY TYPE, 2018-2032 (USD THOUSAND)
TABLE 104 NORTH AMERICA PLASTIC COMPOUNDING MARKET, BY FILLER TYPE, 2018-2032 (USD THOUSAND)
TABLE 105 NORTH AMERICA MINERAL FILLERS IN PLASTIC COMPOUNDING MARKET, BY TYPE, 2018-2032 (USD THOUSAND)
TABLE 106 NORTH AMERICA REINFORCEMENTS IN PLASTIC COMPOUNDING MARKET, BY TYPE, 2018-2032 (USD THOUSAND)
TABLE 107 NORTH AMERICA ADDITIVES IN PLASTIC COMPOUNDING MARKET, BY TYPE, 2018-2032 (USD THOUSAND)
TABLE 108 NORTH AMERICA PLASTIC COMPOUNDING MARKET, BY MANUFACTURING PROCESS, 2018-2032 (USD THOUSAND)
TABLE 109 NORTH AMERICA PLASTIC COMPOUNDING MARKET, BY MANUFACTURING PROCESS, 2018-2032 (KILO TONS)
TABLE 110 NORTH AMERICA EXTRUSION IN PLASTIC COMPOUNDING MARKET, BY TYPE, 2018-2032 (USD THOUSAND)
TABLE 111 NORTH AMERICA EXTRUSION IN PLASTIC COMPOUNDING MARKET, BY PELLETIZING SYSTEM, 2018-2032 (USD THOUSAND)
TABLE 112 NORTH AMERICA INJECTION MOLDING BASED COMPOUNDING IN PLASTIC COMPOUNDING MARKET, BY PELLETIZING SYSTEM, 2018-2032 (USD THOUSAND)
TABLE 113 NORTH AMERICA COMPACTION/PRESSING IN PLASTIC COMPOUNDING MARKET, BY PELLETIZING SYSTEM, 2018-2032 (USD THOUSAND)
TABLE 114 NORTH AMERICA KNEADER/BANBURY MIXING IN PLASTIC COMPOUNDING MARKET, BY PELLETIZING SYSTEM, 2018-2032 (USD THOUSAND)
TABLE 115 NORTH AMERICA PLASTIC COMPOUNDING MARKET, BY PROPERTIES, 2018-2032 (USD THOUSAND)
TABLE 116 NORTH AMERICA PLASTIC COMPOUNDING MARKET, BY APPLICATION, 2018-2032 (USD THOUSAND)
TABLE 117 NORTH AMERICA PLASTIC COMPOUNDING MARKET, BY APPLICATION, 2018-2032 (KILO TONS)
TABLE 118 NORTH AMERICA AUTOMOTIVE IN PLASTIC COMPOUNDING MARKET, BY CATEGORY, 2018-2032 (USD THOUSAND)
TABLE 119 NORTH AMERICA INTERIOR COMPONENTS IN PLASTIC COMPOUNDING MARKET, BY TYPE, 2018-2032 (USD THOUSAND)
TABLE 120 NORTH AMERICA EXTERIOR BODY PARTS IN PLASTIC COMPOUNDING MARKET, BY TYPE, 2018-2032 (USD THOUSAND)
TABLE 121 NORTH AMERICA UNDER-THE-HOOD APPLICATIONS IN PLASTIC COMPOUNDING MARKET, BY TYPE, 2018-2032 (USD THOUSAND)
TABLE 122 NORTH AMERICA PACKAGING IN PLASTIC COMPOUNDING MARKET, BY CATEGORY, 2018-2032 (USD THOUSAND)
TABLE 123 NORTH AMERICA FOOD & BEVERAGE PACKAGING IN PLASTIC COMPOUNDING MARKET, BY TYPE, 2018-2032 (USD THOUSAND)
TABLE 124 NORTH AMERICA INDUSTRIAL PACKAGING IN PLASTIC COMPOUNDING MARKET, BY TYPE, 2018-2032 (USD THOUSAND)
TABLE 125 NORTH AMERICA CONSUMER GOODS PACKAGING IN PLASTIC COMPOUNDING MARKET, BY TYPE, 2018-2032 (USD THOUSAND)
TABLE 126 NORTH AMERICA BUILDING & CONSTRUCTION IN PLASTIC COMPOUNDING MARKET, BY CATEGORY, 2018-2032 (USD THOUSAND)
TABLE 127 NORTH AMERICA ELECTRICAL & ELECTRONICS IN PLASTIC COMPOUNDING MARKET, BY CATEGORY, 2018-2032 (USD THOUSAND)
TABLE 128 NORTH AMERICA MEDICAL DEVICES IN PLASTIC COMPOUNDING MARKET, BY CATEGORY, 2018-2032 (USD THOUSAND)
TABLE 129 NORTH AMERICA FURNITURE IN PLASTIC COMPOUNDING MARKET, BY CATEGORY, 2018-2032 (USD THOUSAND)
TABLE 130 NORTH AMERICA ENERGY AND POWER IN PLASTIC COMPOUNDING MARKET, BY CATEGORY, 2018-2032 (USD THOUSAND)
TABLE 131 NORTH AMERICA AEROSPACE AND DEFENSE IN PLASTIC COMPOUNDING MARKET, BY CATEGORY, 2018-2032 (USD THOUSAND)
TABLE 132 U.S. PLASTIC COMPOUNDING MARKET, BY POLYMER TYPE, 2018-2032 (USD THOUSAND)
TABLE 133 U.S. PLASTIC COMPOUNDING MARKET, BY POLYMER TYPE, 2018-2032 (KILO TONS)
TABLE 134 U.S. THERMOPLASTICS IN PLASTIC COMPOUNDING MARKET, BY TYPE, 2018-2032 (USD THOUSAND)
TABLE 135 U.S. POLYETHYLENE (PE) IN PLASTIC COMPOUNDING MARKET, BY TYPE, 2018-2032 (USD THOUSAND)
TABLE 136 U.S. ENGINEERING PLASTICS IN PLASTIC COMPOUNDING MARKET, BY TYPE, 2018-2032 (USD THOUSAND)
TABLE 137 U.S. THERMOSETTING PLASTICS IN PLASTIC COMPOUNDING MARKET, BY TYPE, 2018-2032 (USD THOUSAND)
TABLE 138 U.S. BIOPLASTICS IN PLASTIC COMPOUNDING MARKET, BY TYPE, 2018-2032 (USD THOUSAND)
TABLE 139 U.S. PLASTIC COMPOUNDING MARKET, BY FILLER TYPE, 2018-2032 (USD THOUSAND)
TABLE 140 U.S. MINERAL FILLERS IN PLASTIC COMPOUNDING MARKET, BY TYPE, 2018-2032 (USD THOUSAND)
TABLE 141 U.S. REINFORCEMENTS IN PLASTIC COMPOUNDING MARKET, BY TYPE, 2018-2032 (USD THOUSAND)
TABLE 142 U.S. ADDITIVES IN PLASTIC COMPOUNDING MARKET, BY TYPE, 2018-2032 (USD THOUSAND)
TABLE 143 U.S. PLASTIC COMPOUNDING MARKET, BY MANUFACTURING PROCESS, 2018-2032 (USD THOUSAND)
TABLE 144 U.S. PLASTIC COMPOUNDING MARKET, BY MANUFACTURING PROCESS, 2018-2032 (KILO TONS)
TABLE 145 U.S. EXTRUSION IN PLASTIC COMPOUNDING MARKET, BY TYPE, 2018-2032 (USD THOUSAND)
TABLE 146 U.S. EXTRUSION IN PLASTIC COMPOUNDING MARKET, BY PELLETIZING SYSTEM, 2018-2032 (USD THOUSAND)
TABLE 147 U.S. INJECTION MOLDING BASED COMPOUNDING IN PLASTIC COMPOUNDING MARKET, BY PELLETIZING SYSTEM, 2018-2032 (USD THOUSAND)
TABLE 148 U.S. COMPACTION/PRESSING IN PLASTIC COMPOUNDING MARKET, BY PELLETIZING SYSTEM, 2018-2032 (USD THOUSAND)
TABLE 149 U.S. KNEADER/BANBURY MIXING IN PLASTIC COMPOUNDING MARKET, BY PELLETIZING SYSTEM, 2018-2032 (USD THOUSAND)
TABLE 150 U.S. PLASTIC COMPOUNDING MARKET, BY PROPERTIES, 2018-2032 (USD THOUSAND)
TABLE 151 U.S. PLASTIC COMPOUNDING MARKET, BY APPLICATION, 2018-2032 (USD THOUSAND)
TABLE 152 U.S. PLASTIC COMPOUNDING MARKET, BY APPLICATION, 2018-2032 (KILO TONS)
TABLE 153 U.S. AUTOMOTIVE IN PLASTIC COMPOUNDING MARKET, BY CATEGORY, 2018-2032 (USD THOUSAND)
TABLE 154 U.S. INTERIOR COMPONENTS IN PLASTIC COMPOUNDING MARKET, BY TYPE, 2018-2032 (USD THOUSAND)
TABLE 155 U.S. EXTERIOR BODY PARTS IN PLASTIC COMPOUNDING MARKET, BY TYPE, 2018-2032 (USD THOUSAND)
TABLE 156 U.S. UNDER-THE-HOOD APPLICATIONS IN PLASTIC COMPOUNDING MARKET, BY TYPE, 2018-2032 (USD THOUSAND)
TABLE 157 U.S. PACKAGING IN PLASTIC COMPOUNDING MARKET, BY CATEGORY, 2018-2032 (USD THOUSAND)
TABLE 158 U.S. FOOD & BEVERAGE PACKAGING IN PLASTIC COMPOUNDING MARKET, BY TYPE, 2018-2032 (USD THOUSAND)
TABLE 159 U.S. INDUSTRIAL PACKAGING IN PLASTIC COMPOUNDING MARKET, BY TYPE, 2018-2032 (USD THOUSAND)
TABLE 160 U.S. CONSUMER GOODS PACKAGING IN PLASTIC COMPOUNDING MARKET, BY TYPE, 2018-2032 (USD THOUSAND)
TABLE 161 U.S. BUILDING & CONSTRUCTION IN PLASTIC COMPOUNDING MARKET, BY CATEGORY, 2018-2032 (USD THOUSAND)
TABLE 162 U.S. ELECTRICAL & ELECTRONICS IN PLASTIC COMPOUNDING MARKET, BY CATEGORY, 2018-2032 (USD THOUSAND)
TABLE 163 U.S. MEDICAL DEVICES IN PLASTIC COMPOUNDING MARKET, BY CATEGORY, 2018-2032 (USD THOUSAND)
TABLE 164 U.S. FURNITURE IN PLASTIC COMPOUNDING MARKET, BY CATEGORY, 2018-2032 (USD THOUSAND)
TABLE 165 U.S. ENERGY AND POWER IN PLASTIC COMPOUNDING MARKET, BY CATEGORY, 2018-2032 (USD THOUSAND)
TABLE 166 U.S. AEROSPACE AND DEFENSE IN PLASTIC COMPOUNDING MARKET, BY CATEGORY, 2018-2032 (USD THOUSAND)
TABLE 167 CANADA PLASTIC COMPOUNDING MARKET, BY POLYMER TYPE, 2018-2032 (USD THOUSAND)
TABLE 168 CANADA PLASTIC COMPOUNDING MARKET, BY POLYMER TYPE, 2018-2032 (KILO TONS)
TABLE 169 CANADA THERMOPLASTICS IN PLASTIC COMPOUNDING MARKET, BY TYPE, 2018-2032 (USD THOUSAND)
TABLE 170 CANADA POLYETHYLENE (PE) IN PLASTIC COMPOUNDING MARKET, BY TYPE, 2018-2032 (USD THOUSAND)
TABLE 171 CANADA ENGINEERING PLASTICS IN PLASTIC COMPOUNDING MARKET, BY TYPE, 2018-2032 (USD THOUSAND)
TABLE 172 CANADA THERMOSETTING PLASTICS IN PLASTIC COMPOUNDING MARKET, BY TYPE, 2018-2032 (USD THOUSAND)
TABLE 173 CANADA BIOPLASTICS IN PLASTIC COMPOUNDING MARKET, BY TYPE, 2018-2032 (USD THOUSAND)
TABLE 174 CANADA PLASTIC COMPOUNDING MARKET, BY FILLER TYPE, 2018-2032 (USD THOUSAND)
TABLE 175 CANADA MINERAL FILLERS IN PLASTIC COMPOUNDING MARKET, BY TYPE, 2018-2032 (USD THOUSAND)
TABLE 176 CANADA REINFORCEMENTS IN PLASTIC COMPOUNDING MARKET, BY TYPE, 2018-2032 (USD THOUSAND)
TABLE 177 CANADA ADDITIVES IN PLASTIC COMPOUNDING MARKET, BY TYPE, 2018-2032 (USD THOUSAND)
TABLE 178 CANADA PLASTIC COMPOUNDING MARKET, BY MANUFACTURING PROCESS, 2018-2032 (USD THOUSAND)
TABLE 179 CANADA PLASTIC COMPOUNDING MARKET, BY MANUFACTURING PROCESS, 2018-2032 (KILO TONS)
TABLE 180 CANADA EXTRUSION IN PLASTIC COMPOUNDING MARKET, BY TYPE, 2018-2032 (USD THOUSAND)
TABLE 181 CANADA EXTRUSION IN PLASTIC COMPOUNDING MARKET, BY PELLETIZING SYSTEM, 2018-2032 (USD THOUSAND)
TABLE 182 CANADA INJECTION MOLDING BASED COMPOUNDING IN PLASTIC COMPOUNDING MARKET, BY PELLETIZING SYSTEM, 2018-2032 (USD THOUSAND)
TABLE 183 CANADA COMPACTION/PRESSING IN PLASTIC COMPOUNDING MARKET, BY PELLETIZING SYSTEM, 2018-2032 (USD THOUSAND)
TABLE 184 CANADA KNEADER/BANBURY MIXING IN PLASTIC COMPOUNDING MARKET, BY PELLETIZING SYSTEM, 2018-2032 (USD THOUSAND)
TABLE 185 CANADA PLASTIC COMPOUNDING MARKET, BY PROPERTIES, 2018-2032 (USD THOUSAND)
TABLE 186 CANADA PLASTIC COMPOUNDING MARKET, BY APPLICATION, 2018-2032 (USD THOUSAND)
TABLE 187 CANADA PLASTIC COMPOUNDING MARKET, BY APPLICATION, 2018-2032 (KILO TONS)
TABLE 188 CANADA AUTOMOTIVE IN PLASTIC COMPOUNDING MARKET, BY CATEGORY, 2018-2032 (USD THOUSAND)
TABLE 189 CANADA INTERIOR COMPONENTS IN PLASTIC COMPOUNDING MARKET, BY TYPE, 2018-2032 (USD THOUSAND)
TABLE 190 CANADA EXTERIOR BODY PARTS IN PLASTIC COMPOUNDING MARKET, BY TYPE, 2018-2032 (USD THOUSAND)
TABLE 191 CANADA UNDER-THE-HOOD APPLICATIONS IN PLASTIC COMPOUNDING MARKET, BY TYPE, 2018-2032 (USD THOUSAND)
TABLE 192 CANADA PACKAGING IN PLASTIC COMPOUNDING MARKET, BY CATEGORY, 2018-2032 (USD THOUSAND)
TABLE 193 CANADA FOOD & BEVERAGE PACKAGING IN PLASTIC COMPOUNDING MARKET, BY TYPE, 2018-2032 (USD THOUSAND)
TABLE 194 CANADA INDUSTRIAL PACKAGING IN PLASTIC COMPOUNDING MARKET, BY TYPE, 2018-2032 (USD THOUSAND)
TABLE 195 CANADA CONSUMER GOODS PACKAGING IN PLASTIC COMPOUNDING MARKET, BY TYPE, 2018-2032 (USD THOUSAND)
TABLE 196 CANADA BUILDING & CONSTRUCTION IN PLASTIC COMPOUNDING MARKET, BY CATEGORY, 2018-2032 (USD THOUSAND)
TABLE 197 CANADA ELECTRICAL & ELECTRONICS IN PLASTIC COMPOUNDING MARKET, BY CATEGORY, 2018-2032 (USD THOUSAND)
TABLE 198 CANADA MEDICAL DEVICES IN PLASTIC COMPOUNDING MARKET, BY CATEGORY, 2018-2032 (USD THOUSAND)
TABLE 199 CANADA FURNITURE IN PLASTIC COMPOUNDING MARKET, BY CATEGORY, 2018-2032 (USD THOUSAND)
TABLE 200 CANADA ENERGY AND POWER IN PLASTIC COMPOUNDING MARKET, BY CATEGORY, 2018-2032 (USD THOUSAND)
TABLE 201 CANADA AEROSPACE AND DEFENSE IN PLASTIC COMPOUNDING MARKET, BY CATEGORY, 2018-2032 (USD THOUSAND)
TABLE 202 MEXICO PLASTIC COMPOUNDING MARKET, BY POLYMER TYPE, 2018-2032 (USD THOUSAND)
TABLE 203 MEXICO PLASTIC COMPOUNDING MARKET, BY POLYMER TYPE, 2018-2032 (KILO TONS)
TABLE 204 MEXICO THERMOPLASTICS IN PLASTIC COMPOUNDING MARKET, BY TYPE, 2018-2032 (USD THOUSAND)
TABLE 205 MEXICO POLYETHYLENE (PE) IN PLASTIC COMPOUNDING MARKET, BY TYPE, 2018-2032 (USD THOUSAND)
TABLE 206 MEXICO ENGINEERING PLASTICS IN PLASTIC COMPOUNDING MARKET, BY TYPE, 2018-2032 (USD THOUSAND)
TABLE 207 MEXICO THERMOSETTING PLASTICS IN PLASTIC COMPOUNDING MARKET, BY TYPE, 2018-2032 (USD THOUSAND)
TABLE 208 MEXICO BIOPLASTICS IN PLASTIC COMPOUNDING MARKET, BY TYPE, 2018-2032 (USD THOUSAND)
TABLE 209 MEXICO PLASTIC COMPOUNDING MARKET, BY FILLER TYPE, 2018-2032 (USD THOUSAND)
TABLE 210 MEXICO MINERAL FILLERS IN PLASTIC COMPOUNDING MARKET, BY TYPE, 2018-2032 (USD THOUSAND)
TABLE 211 MEXICO REINFORCEMENTS IN PLASTIC COMPOUNDING MARKET, BY TYPE, 2018-2032 (USD THOUSAND)
TABLE 212 MEXICO ADDITIVES IN PLASTIC COMPOUNDING MARKET, BY TYPE, 2018-2032 (USD THOUSAND)
TABLE 213 MEXICO PLASTIC COMPOUNDING MARKET, BY MANUFACTURING PROCESS, 2018-2032 (USD THOUSAND)
TABLE 214 MEXICO PLASTIC COMPOUNDING MARKET, BY MANUFACTURING PROCESS, 2018-2032 (KILO TONS)
TABLE 215 MEXICO EXTRUSION IN PLASTIC COMPOUNDING MARKET, BY TYPE, 2018-2032 (USD THOUSAND)
TABLE 216 MEXICO EXTRUSION IN PLASTIC COMPOUNDING MARKET, BY PELLETIZING SYSTEM, 2018-2032 (USD THOUSAND)
TABLE 217 MEXICO INJECTION MOLDING BASED COMPOUNDING IN PLASTIC COMPOUNDING MARKET, BY PELLETIZING SYSTEM, 2018-2032 (USD THOUSAND)
TABLE 218 MEXICO COMPACTION/PRESSING IN PLASTIC COMPOUNDING MARKET, BY PELLETIZING SYSTEM, 2018-2032 (USD THOUSAND)
TABLE 219 MEXICO KNEADER/BANBURY MIXING IN PLASTIC COMPOUNDING MARKET, BY PELLETIZING SYSTEM, 2018-2032 (USD THOUSAND)
TABLE 220 MEXICO PLASTIC COMPOUNDING MARKET, BY PROPERTIES, 2018-2032 (USD THOUSAND)
TABLE 221 MEXICO PLASTIC COMPOUNDING MARKET, BY APPLICATION, 2018-2032 (USD THOUSAND)
TABLE 222 MEXICO PLASTIC COMPOUNDING MARKET, BY APPLICATION, 2018-2032 (KILO TONS)
TABLE 223 MEXICO AUTOMOTIVE IN PLASTIC COMPOUNDING MARKET, BY CATEGORY, 2018-2032 (USD THOUSAND)
TABLE 224 MEXICO INTERIOR COMPONENTS IN PLASTIC COMPOUNDING MARKET, BY TYPE, 2018-2032 (USD THOUSAND)
TABLE 225 MEXICO EXTERIOR BODY PARTS IN PLASTIC COMPOUNDING MARKET, BY TYPE, 2018-2032 (USD THOUSAND)
TABLE 226 MEXICO UNDER-THE-HOOD APPLICATIONS IN PLASTIC COMPOUNDING MARKET, BY TYPE, 2018-2032 (USD THOUSAND)
TABLE 227 MEXICO PACKAGING IN PLASTIC COMPOUNDING MARKET, BY CATEGORY, 2018-2032 (USD THOUSAND)
TABLE 228 MEXICO FOOD & BEVERAGE PACKAGING IN PLASTIC COMPOUNDING MARKET, BY TYPE, 2018-2032 (USD THOUSAND)
TABLE 229 MEXICO INDUSTRIAL PACKAGING IN PLASTIC COMPOUNDING MARKET, BY TYPE, 2018-2032 (USD THOUSAND)
TABLE 230 MEXICO CONSUMER GOODS PACKAGING IN PLASTIC COMPOUNDING MARKET, BY TYPE, 2018-2032 (USD THOUSAND)
TABLE 231 MEXICO BUILDING & CONSTRUCTION IN PLASTIC COMPOUNDING MARKET, BY CATEGORY, 2018-2032 (USD THOUSAND)
TABLE 232 MEXICO ELECTRICAL & ELECTRONICS IN PLASTIC COMPOUNDING MARKET, BY CATEGORY, 2018-2032 (USD THOUSAND)
TABLE 233 MEXICO MEDICAL DEVICES IN PLASTIC COMPOUNDING MARKET, BY CATEGORY, 2018-2032 (USD THOUSAND)
TABLE 234 MEXICO FURNITURE IN PLASTIC COMPOUNDING MARKET, BY CATEGORY, 2018-2032 (USD THOUSAND)
TABLE 235 MEXICO ENERGY AND POWER IN PLASTIC COMPOUNDING MARKET, BY CATEGORY, 2018-2032 (USD THOUSAND)
TABLE 236 MEXICO AEROSPACE AND DEFENSE IN PLASTIC COMPOUNDING MARKET, BY CATEGORY, 2018-2032 (USD THOUSAND)
TABLE 237 EUROPE PLASTIC COMPOUNDING MARKET, BY COUNTRY, 2018-2032 (USD THOUSAND)
TABLE 238 EUROPE PLASTIC COMPOUNDING MARKET, BY COUNTRY, 2018-2032 (KILO TONS)
TABLE 239 EUROPE PLASTIC COMPOUNDING MARKET, BY POLYMER TYPE, 2018-2032 (USD THOUSAND)
TABLE 240 EUROPE PLASTIC COMPOUNDING MARKET, BY POLYMER TYPE, 2018-2032 (KILO TONS)
TABLE 241 EUROPE THERMOPLASTICS IN PLASTIC COMPOUNDING MARKET, BY TYPE, 2018-2032 (USD THOUSAND)
TABLE 242 EUROPE POLYETHYLENE (PE) IN PLASTIC COMPOUNDING MARKET, BY TYPE, 2018-2032 (USD THOUSAND)
TABLE 243 EUROPE ENGINEERING PLASTICS IN PLASTIC COMPOUNDING MARKET, BY TYPE, 2018-2032 (USD THOUSAND)
TABLE 244 EUROPE THERMOSETTING PLASTICS IN PLASTIC COMPOUNDING MARKET, BY TYPE, 2018-2032 (USD THOUSAND)
TABLE 245 EUROPE BIOPLASTICS IN PLASTIC COMPOUNDING MARKET, BY TYPE, 2018-2032 (USD THOUSAND)
TABLE 246 EUROPE PLASTIC COMPOUNDING MARKET, BY FILLER TYPE, 2018-2032 (USD THOUSAND)
TABLE 247 EUROPE MINERAL FILLERS IN PLASTIC COMPOUNDING MARKET, BY TYPE, 2018-2032 (USD THOUSAND)
TABLE 248 EUROPE REINFORCEMENTS IN PLASTIC COMPOUNDING MARKET, BY TYPE, 2018-2032 (USD THOUSAND)
TABLE 249 EUROPE ADDITIVES IN PLASTIC COMPOUNDING MARKET, BY TYPE, 2018-2032 (USD THOUSAND)
TABLE 250 EUROPE PLASTIC COMPOUNDING MARKET, BY MANUFACTURING PROCESS, 2018-2032 (USD THOUSAND)
TABLE 251 EUROPE PLASTIC COMPOUNDING MARKET, BY MANUFACTURING PROCESS, 2018-2032 (KILO TONS)
TABLE 252 EUROPE EXTRUSION IN PLASTIC COMPOUNDING MARKET, BY TYPE, 2018-2032 (USD THOUSAND)
TABLE 253 EUROPE EXTRUSION IN PLASTIC COMPOUNDING MARKET, BY PELLETIZING SYSTEM, 2018-2032 (USD THOUSAND)
TABLE 254 EUROPE INJECTION MOLDING BASED COMPOUNDING IN PLASTIC COMPOUNDING MARKET, BY PELLETIZING SYSTEM, 2018-2032 (USD THOUSAND)
TABLE 255 EUROPE COMPACTION/PRESSING IN PLASTIC COMPOUNDING MARKET, BY PELLETIZING SYSTEM, 2018-2032 (USD THOUSAND)
TABLE 256 EUROPE KNEADER/BANBURY MIXING IN PLASTIC COMPOUNDING MARKET, BY PELLETIZING SYSTEM, 2018-2032 (USD THOUSAND)
TABLE 257 EUROPE PLASTIC COMPOUNDING MARKET, BY PROPERTIES, 2018-2032 (USD THOUSAND)
TABLE 258 EUROPE PLASTIC COMPOUNDING MARKET, BY APPLICATION, 2018-2032 (USD THOUSAND)
TABLE 259 EUROPE PLASTIC COMPOUNDING MARKET, BY APPLICATION, 2018-2032 (KILO TONS)
TABLE 260 EUROPE AUTOMOTIVE IN PLASTIC COMPOUNDING MARKET, BY CATEGORY, 2018-2032 (USD THOUSAND)
TABLE 261 EUROPE INTERIOR COMPONENTS IN PLASTIC COMPOUNDING MARKET, BY TYPE, 2018-2032 (USD THOUSAND)
TABLE 262 EUROPE EXTERIOR BODY PARTS IN PLASTIC COMPOUNDING MARKET, BY TYPE, 2018-2032 (USD THOUSAND)
TABLE 263 EUROPE UNDER-THE-HOOD APPLICATIONS IN PLASTIC COMPOUNDING MARKET, BY TYPE, 2018-2032 (USD THOUSAND)
TABLE 264 EUROPE PACKAGING IN PLASTIC COMPOUNDING MARKET, BY CATEGORY, 2018-2032 (USD THOUSAND)
TABLE 265 EUROPE FOOD & BEVERAGE PACKAGING IN PLASTIC COMPOUNDING MARKET, BY TYPE, 2018-2032 (USD THOUSAND)
TABLE 266 EUROPE INDUSTRIAL PACKAGING IN PLASTIC COMPOUNDING MARKET, BY TYPE, 2018-2032 (USD THOUSAND)
TABLE 267 EUROPE CONSUMER GOODS PACKAGING IN PLASTIC COMPOUNDING MARKET, BY TYPE, 2018-2032 (USD THOUSAND)
TABLE 268 EUROPE BUILDING & CONSTRUCTION IN PLASTIC COMPOUNDING MARKET, BY CATEGORY, 2018-2032 (USD THOUSAND)
TABLE 269 EUROPE ELECTRICAL & ELECTRONICS IN PLASTIC COMPOUNDING MARKET, BY CATEGORY, 2018-2032 (USD THOUSAND)
TABLE 270 EUROPE MEDICAL DEVICES IN PLASTIC COMPOUNDING MARKET, BY CATEGORY, 2018-2032 (USD THOUSAND)
TABLE 271 EUROPE FURNITURE IN PLASTIC COMPOUNDING MARKET, BY CATEGORY, 2018-2032 (USD THOUSAND)
TABLE 272 EUROPE ENERGY AND POWER IN PLASTIC COMPOUNDING MARKET, BY CATEGORY, 2018-2032 (USD THOUSAND)
TABLE 273 EUROPE AEROSPACE AND DEFENSE IN PLASTIC COMPOUNDING MARKET, BY CATEGORY, 2018-2032 (USD THOUSAND)
TABLE 274 GERMANY PLASTIC COMPOUNDING MARKET, BY POLYMER TYPE, 2018-2032 (USD THOUSAND)
TABLE 275 GERMANY PLASTIC COMPOUNDING MARKET, BY POLYMER TYPE, 2018-2032 (KILO TONS)
TABLE 276 GERMANY THERMOPLASTICS IN PLASTIC COMPOUNDING MARKET, BY TYPE, 2018-2032 (USD THOUSAND)
TABLE 277 GERMANY POLYETHYLENE (PE) IN PLASTIC COMPOUNDING MARKET, BY TYPE, 2018-2032 (USD THOUSAND)
TABLE 278 GERMANY ENGINEERING PLASTICS IN PLASTIC COMPOUNDING MARKET, BY TYPE, 2018-2032 (USD THOUSAND)
TABLE 279 GERMANY THERMOSETTING PLASTICS IN PLASTIC COMPOUNDING MARKET, BY TYPE, 2018-2032 (USD THOUSAND)
TABLE 280 GERMANY BIOPLASTICS IN PLASTIC COMPOUNDING MARKET, BY TYPE, 2018-2032 (USD THOUSAND)
TABLE 281 GERMANY PLASTIC COMPOUNDING MARKET, BY FILLER TYPE, 2018-2032 (USD THOUSAND)
TABLE 282 GERMANY MINERAL FILLERS IN PLASTIC COMPOUNDING MARKET, BY TYPE, 2018-2032 (USD THOUSAND)
TABLE 283 GERMANY REINFORCEMENTS IN PLASTIC COMPOUNDING MARKET, BY TYPE, 2018-2032 (USD THOUSAND)
TABLE 284 GERMANY ADDITIVES IN PLASTIC COMPOUNDING MARKET, BY TYPE, 2018-2032 (USD THOUSAND)
TABLE 285 GERMANY PLASTIC COMPOUNDING MARKET, BY MANUFACTURING PROCESS, 2018-2032 (USD THOUSAND)
TABLE 286 GERMANY PLASTIC COMPOUNDING MARKET, BY MANUFACTURING PROCESS, 2018-2032 (KILO TONS)
TABLE 287 GERMANY EXTRUSION IN PLASTIC COMPOUNDING MARKET, BY TYPE, 2018-2032 (USD THOUSAND)
TABLE 288 GERMANY EXTRUSION IN PLASTIC COMPOUNDING MARKET, BY PELLETIZING SYSTEM, 2018-2032 (USD THOUSAND)
TABLE 289 GERMANY INJECTION MOLDING BASED COMPOUNDING IN PLASTIC COMPOUNDING MARKET, BY PELLETIZING SYSTEM, 2018-2032 (USD THOUSAND)
TABLE 290 GERMANY COMPACTION/PRESSING IN PLASTIC COMPOUNDING MARKET, BY PELLETIZING SYSTEM, 2018-2032 (USD THOUSAND)
TABLE 291 GERMANY KNEADER/BANBURY MIXING IN PLASTIC COMPOUNDING MARKET, BY PELLETIZING SYSTEM, 2018-2032 (USD THOUSAND)
TABLE 292 GERMANY PLASTIC COMPOUNDING MARKET, BY PROPERTIES, 2018-2032 (USD THOUSAND)
TABLE 293 GERMANY PLASTIC COMPOUNDING MARKET, BY APPLICATION, 2018-2032 (USD THOUSAND)
TABLE 294 GERMANY PLASTIC COMPOUNDING MARKET, BY APPLICATION, 2018-2032 (KILO TONS)
TABLE 295 GERMANY AUTOMOTIVE IN PLASTIC COMPOUNDING MARKET, BY CATEGORY, 2018-2032 (USD THOUSAND)
TABLE 296 GERMANY INTERIOR COMPONENTS IN PLASTIC COMPOUNDING MARKET, BY TYPE, 2018-2032 (USD THOUSAND)
TABLE 297 GERMANY EXTERIOR BODY PARTS IN PLASTIC COMPOUNDING MARKET, BY TYPE, 2018-2032 (USD THOUSAND)
TABLE 298 GERMANY UNDER-THE-HOOD APPLICATIONS IN PLASTIC COMPOUNDING MARKET, BY TYPE, 2018-2032 (USD THOUSAND)
TABLE 299 GERMANY PACKAGING IN PLASTIC COMPOUNDING MARKET, BY CATEGORY, 2018-2032 (USD THOUSAND)
TABLE 300 GERMANY FOOD & BEVERAGE PACKAGING IN PLASTIC COMPOUNDING MARKET, BY TYPE, 2018-2032 (USD THOUSAND)
TABLE 301 GERMANY INDUSTRIAL PACKAGING IN PLASTIC COMPOUNDING MARKET, BY TYPE, 2018-2032 (USD THOUSAND)
TABLE 302 GERMANY CONSUMER GOODS PACKAGING IN PLASTIC COMPOUNDING MARKET, BY TYPE, 2018-2032 (USD THOUSAND)
TABLE 303 GERMANY BUILDING & CONSTRUCTION IN PLASTIC COMPOUNDING MARKET, BY CATEGORY, 2018-2032 (USD THOUSAND)
TABLE 304 GERMANY ELECTRICAL & ELECTRONICS IN PLASTIC COMPOUNDING MARKET, BY CATEGORY, 2018-2032 (USD THOUSAND)
TABLE 305 GERMANY MEDICAL DEVICES IN PLASTIC COMPOUNDING MARKET, BY CATEGORY, 2018-2032 (USD THOUSAND)
TABLE 306 GERMANY FURNITURE IN PLASTIC COMPOUNDING MARKET, BY CATEGORY, 2018-2032 (USD THOUSAND)
TABLE 307 GERMANY ENERGY AND POWER IN PLASTIC COMPOUNDING MARKET, BY CATEGORY, 2018-2032 (USD THOUSAND)
TABLE 308 GERMANY AEROSPACE AND DEFENSE IN PLASTIC COMPOUNDING MARKET, BY CATEGORY, 2018-2032 (USD THOUSAND)
TABLE 309 ITALY PLASTIC COMPOUNDING MARKET, BY POLYMER TYPE, 2018-2032 (USD THOUSAND)
TABLE 310 ITALY PLASTIC COMPOUNDING MARKET, BY POLYMER TYPE, 2018-2032 (KILO TONS)
TABLE 311 ITALY THERMOPLASTICS IN PLASTIC COMPOUNDING MARKET, BY TYPE, 2018-2032 (USD THOUSAND)
TABLE 312 ITALY POLYETHYLENE (PE) IN PLASTIC COMPOUNDING MARKET, BY TYPE, 2018-2032 (USD THOUSAND)
TABLE 313 ITALY ENGINEERING PLASTICS IN PLASTIC COMPOUNDING MARKET, BY TYPE, 2018-2032 (USD THOUSAND)
TABLE 314 ITALY THERMOSETTING PLASTICS IN PLASTIC COMPOUNDING MARKET, BY TYPE, 2018-2032 (USD THOUSAND)
TABLE 315 ITALY BIOPLASTICS IN PLASTIC COMPOUNDING MARKET, BY TYPE, 2018-2032 (USD THOUSAND)
TABLE 316 ITALY PLASTIC COMPOUNDING MARKET, BY FILLER TYPE, 2018-2032 (USD THOUSAND)
TABLE 317 ITALY MINERAL FILLERS IN PLASTIC COMPOUNDING MARKET, BY TYPE, 2018-2032 (USD THOUSAND)
TABLE 318 ITALY REINFORCEMENTS IN PLASTIC COMPOUNDING MARKET, BY TYPE, 2018-2032 (USD THOUSAND)
TABLE 319 ITALY ADDITIVES IN PLASTIC COMPOUNDING MARKET, BY TYPE, 2018-2032 (USD THOUSAND)
TABLE 320 ITALY PLASTIC COMPOUNDING MARKET, BY MANUFACTURING PROCESS, 2018-2032 (USD THOUSAND)
TABLE 321 ITALY PLASTIC COMPOUNDING MARKET, BY MANUFACTURING PROCESS, 2018-2032 (KILO TONS)
TABLE 322 ITALY EXTRUSION IN PLASTIC COMPOUNDING MARKET, BY TYPE, 2018-2032 (USD THOUSAND)
TABLE 323 ITALY EXTRUSION IN PLASTIC COMPOUNDING MARKET, BY PELLETIZING SYSTEM, 2018-2032 (USD THOUSAND)
TABLE 324 ITALY INJECTION MOLDING BASED COMPOUNDING IN PLASTIC COMPOUNDING MARKET, BY PELLETIZING SYSTEM, 2018-2032 (USD THOUSAND)
TABLE 325 ITALY COMPACTION/PRESSING IN PLASTIC COMPOUNDING MARKET, BY PELLETIZING SYSTEM, 2018-2032 (USD THOUSAND)
TABLE 326 ITALY KNEADER/BANBURY MIXING IN PLASTIC COMPOUNDING MARKET, BY PELLETIZING SYSTEM, 2018-2032 (USD THOUSAND)
TABLE 327 ITALY PLASTIC COMPOUNDING MARKET, BY PROPERTIES, 2018-2032 (USD THOUSAND)
TABLE 328 ITALY PLASTIC COMPOUNDING MARKET, BY APPLICATION, 2018-2032 (USD THOUSAND)
TABLE 329 ITALY PLASTIC COMPOUNDING MARKET, BY APPLICATION, 2018-2032 (KILO TONS)
TABLE 330 ITALY AUTOMOTIVE IN PLASTIC COMPOUNDING MARKET, BY CATEGORY, 2018-2032 (USD THOUSAND)
TABLE 331 ITALY INTERIOR COMPONENTS IN PLASTIC COMPOUNDING MARKET, BY TYPE, 2018-2032 (USD THOUSAND)
TABLE 332 ITALY EXTERIOR BODY PARTS IN PLASTIC COMPOUNDING MARKET, BY TYPE, 2018-2032 (USD THOUSAND)
TABLE 333 ITALY UNDER-THE-HOOD APPLICATIONS IN PLASTIC COMPOUNDING MARKET, BY TYPE, 2018-2032 (USD THOUSAND)
TABLE 334 ITALY PACKAGING IN PLASTIC COMPOUNDING MARKET, BY CATEGORY, 2018-2032 (USD THOUSAND)
TABLE 335 ITALY FOOD & BEVERAGE PACKAGING IN PLASTIC COMPOUNDING MARKET, BY TYPE, 2018-2032 (USD THOUSAND)
TABLE 336 ITALY INDUSTRIAL PACKAGING IN PLASTIC COMPOUNDING MARKET, BY TYPE, 2018-2032 (USD THOUSAND)
TABLE 337 ITALY CONSUMER GOODS PACKAGING IN PLASTIC COMPOUNDING MARKET, BY TYPE, 2018-2032 (USD THOUSAND)
TABLE 338 ITALY BUILDING & CONSTRUCTION IN PLASTIC COMPOUNDING MARKET, BY CATEGORY, 2018-2032 (USD THOUSAND)
TABLE 339 ITALY ELECTRICAL & ELECTRONICS IN PLASTIC COMPOUNDING MARKET, BY CATEGORY, 2018-2032 (USD THOUSAND)
TABLE 340 ITALY MEDICAL DEVICES IN PLASTIC COMPOUNDING MARKET, BY CATEGORY, 2018-2032 (USD THOUSAND)
TABLE 341 ITALY FURNITURE IN PLASTIC COMPOUNDING MARKET, BY CATEGORY, 2018-2032 (USD THOUSAND)
TABLE 342 ITALY ENERGY AND POWER IN PLASTIC COMPOUNDING MARKET, BY CATEGORY, 2018-2032 (USD THOUSAND)
TABLE 343 ITALY AEROSPACE AND DEFENSE IN PLASTIC COMPOUNDING MARKET, BY CATEGORY, 2018-2032 (USD THOUSAND)
TABLE 344 FRANCE PLASTIC COMPOUNDING MARKET, BY POLYMER TYPE, 2018-2032 (USD THOUSAND)
TABLE 345 FRANCE PLASTIC COMPOUNDING MARKET, BY POLYMER TYPE, 2018-2032 (KILO TONS)
TABLE 346 FRANCE THERMOPLASTICS IN PLASTIC COMPOUNDING MARKET, BY TYPE, 2018-2032 (USD THOUSAND)
TABLE 347 FRANCE POLYETHYLENE (PE) IN PLASTIC COMPOUNDING MARKET, BY TYPE, 2018-2032 (USD THOUSAND)
TABLE 348 FRANCE ENGINEERING PLASTICS IN PLASTIC COMPOUNDING MARKET, BY TYPE, 2018-2032 (USD THOUSAND)
TABLE 349 FRANCE THERMOSETTING PLASTICS IN PLASTIC COMPOUNDING MARKET, BY TYPE, 2018-2032 (USD THOUSAND)
TABLE 350 FRANCE BIOPLASTICS IN PLASTIC COMPOUNDING MARKET, BY TYPE, 2018-2032 (USD THOUSAND)
TABLE 351 FRANCE PLASTIC COMPOUNDING MARKET, BY FILLER TYPE, 2018-2032 (USD THOUSAND)
TABLE 352 FRANCE MINERAL FILLERS IN PLASTIC COMPOUNDING MARKET, BY TYPE, 2018-2032 (USD THOUSAND)
TABLE 353 FRANCE REINFORCEMENTS IN PLASTIC COMPOUNDING MARKET, BY TYPE, 2018-2032 (USD THOUSAND)
TABLE 354 FRANCE ADDITIVES IN PLASTIC COMPOUNDING MARKET, BY TYPE, 2018-2032 (USD THOUSAND)
TABLE 355 FRANCE PLASTIC COMPOUNDING MARKET, BY MANUFACTURING PROCESS, 2018-2032 (USD THOUSAND)
TABLE 356 FRANCE PLASTIC COMPOUNDING MARKET, BY MANUFACTURING PROCESS, 2018-2032 (KILO TONS)
TABLE 357 FRANCE EXTRUSION IN PLASTIC COMPOUNDING MARKET, BY TYPE, 2018-2032 (USD THOUSAND)
TABLE 358 FRANCE EXTRUSION IN PLASTIC COMPOUNDING MARKET, BY PELLETIZING SYSTEM, 2018-2032 (USD THOUSAND)
TABLE 359 FRANCE INJECTION MOLDING BASED COMPOUNDING IN PLASTIC COMPOUNDING MARKET, BY PELLETIZING SYSTEM, 2018-2032 (USD THOUSAND)
TABLE 360 FRANCE COMPACTION/PRESSING IN PLASTIC COMPOUNDING MARKET, BY PELLETIZING SYSTEM, 2018-2032 (USD THOUSAND)
TABLE 361 FRANCE KNEADER/BANBURY MIXING IN PLASTIC COMPOUNDING MARKET, BY PELLETIZING SYSTEM, 2018-2032 (USD THOUSAND)
TABLE 362 FRANCE PLASTIC COMPOUNDING MARKET, BY PROPERTIES, 2018-2032 (USD THOUSAND)
TABLE 363 FRANCE PLASTIC COMPOUNDING MARKET, BY APPLICATION, 2018-2032 (USD THOUSAND)
TABLE 364 FRANCE PLASTIC COMPOUNDING MARKET, BY APPLICATION, 2018-2032 (KILO TONS)
TABLE 365 FRANCE AUTOMOTIVE IN PLASTIC COMPOUNDING MARKET, BY CATEGORY, 2018-2032 (USD THOUSAND)
TABLE 366 FRANCE INTERIOR COMPONENTS IN PLASTIC COMPOUNDING MARKET, BY TYPE, 2018-2032 (USD THOUSAND)
TABLE 367 FRANCE EXTERIOR BODY PARTS IN PLASTIC COMPOUNDING MARKET, BY TYPE, 2018-2032 (USD THOUSAND)
TABLE 368 FRANCE UNDER-THE-HOOD APPLICATIONS IN PLASTIC COMPOUNDING MARKET, BY TYPE, 2018-2032 (USD THOUSAND)
TABLE 369 FRANCE PACKAGING IN PLASTIC COMPOUNDING MARKET, BY CATEGORY, 2018-2032 (USD THOUSAND)
TABLE 370 FRANCE FOOD & BEVERAGE PACKAGING IN PLASTIC COMPOUNDING MARKET, BY TYPE, 2018-2032 (USD THOUSAND)
TABLE 371 FRANCE INDUSTRIAL PACKAGING IN PLASTIC COMPOUNDING MARKET, BY TYPE, 2018-2032 (USD THOUSAND)
TABLE 372 FRANCE CONSUMER GOODS PACKAGING IN PLASTIC COMPOUNDING MARKET, BY TYPE, 2018-2032 (USD THOUSAND)
TABLE 373 FRANCE BUILDING & CONSTRUCTION IN PLASTIC COMPOUNDING MARKET, BY CATEGORY, 2018-2032 (USD THOUSAND)
TABLE 374 FRANCE ELECTRICAL & ELECTRONICS IN PLASTIC COMPOUNDING MARKET, BY CATEGORY, 2018-2032 (USD THOUSAND)
TABLE 375 FRANCE MEDICAL DEVICES IN PLASTIC COMPOUNDING MARKET, BY CATEGORY, 2018-2032 (USD THOUSAND)
TABLE 376 FRANCE FURNITURE IN PLASTIC COMPOUNDING MARKET, BY CATEGORY, 2018-2032 (USD THOUSAND)
TABLE 377 FRANCE ENERGY AND POWER IN PLASTIC COMPOUNDING MARKET, BY CATEGORY, 2018-2032 (USD THOUSAND)
TABLE 378 FRANCE AEROSPACE AND DEFENSE IN PLASTIC COMPOUNDING MARKET, BY CATEGORY, 2018-2032 (USD THOUSAND)
TABLE 379 U.K. PLASTIC COMPOUNDING MARKET, BY POLYMER TYPE, 2018-2032 (USD THOUSAND)
TABLE 380 U.K. PLASTIC COMPOUNDING MARKET, BY POLYMER TYPE, 2018-2032 (KILO TONS)
TABLE 381 U.K. THERMOPLASTICS IN PLASTIC COMPOUNDING MARKET, BY TYPE, 2018-2032 (USD THOUSAND)
TABLE 382 U.K. POLYETHYLENE (PE) IN PLASTIC COMPOUNDING MARKET, BY TYPE, 2018-2032 (USD THOUSAND)
TABLE 383 U.K. ENGINEERING PLASTICS IN PLASTIC COMPOUNDING MARKET, BY TYPE, 2018-2032 (USD THOUSAND)
TABLE 384 U.K. THERMOSETTING PLASTICS IN PLASTIC COMPOUNDING MARKET, BY TYPE, 2018-2032 (USD THOUSAND)
TABLE 385 U.K. BIOPLASTICS IN PLASTIC COMPOUNDING MARKET, BY TYPE, 2018-2032 (USD THOUSAND)
TABLE 386 U.K. PLASTIC COMPOUNDING MARKET, BY FILLER TYPE, 2018-2032 (USD THOUSAND)
TABLE 387 U.K. MINERAL FILLERS IN PLASTIC COMPOUNDING MARKET, BY TYPE, 2018-2032 (USD THOUSAND)
TABLE 388 U.K. REINFORCEMENTS IN PLASTIC COMPOUNDING MARKET, BY TYPE, 2018-2032 (USD THOUSAND)
TABLE 389 U.K. ADDITIVES IN PLASTIC COMPOUNDING MARKET, BY TYPE, 2018-2032 (USD THOUSAND)
TABLE 390 U.K. PLASTIC COMPOUNDING MARKET, BY MANUFACTURING PROCESS, 2018-2032 (USD THOUSAND)
TABLE 391 U.K. PLASTIC COMPOUNDING MARKET, BY MANUFACTURING PROCESS, 2018-2032 (KILO TONS)
TABLE 392 U.K. EXTRUSION IN PLASTIC COMPOUNDING MARKET, BY TYPE, 2018-2032 (USD THOUSAND)
TABLE 393 U.K. EXTRUSION IN PLASTIC COMPOUNDING MARKET, BY PELLETIZING SYSTEM, 2018-2032 (USD THOUSAND)
TABLE 394 U.K. INJECTION MOLDING BASED COMPOUNDING IN PLASTIC COMPOUNDING MARKET, BY PELLETIZING SYSTEM, 2018-2032 (USD THOUSAND)
TABLE 395 U.K. COMPACTION/PRESSING IN PLASTIC COMPOUNDING MARKET, BY PELLETIZING SYSTEM, 2018-2032 (USD THOUSAND)
TABLE 396 U.K. KNEADER/BANBURY MIXING IN PLASTIC COMPOUNDING MARKET, BY PELLETIZING SYSTEM, 2018-2032 (USD THOUSAND)
TABLE 397 U.K. PLASTIC COMPOUNDING MARKET, BY PROPERTIES, 2018-2032 (USD THOUSAND)
TABLE 398 U.K. PLASTIC COMPOUNDING MARKET, BY APPLICATION, 2018-2032 (USD THOUSAND)
TABLE 399 U.K. PLASTIC COMPOUNDING MARKET, BY APPLICATION, 2018-2032 (KILO TONS)
TABLE 400 U.K. AUTOMOTIVE IN PLASTIC COMPOUNDING MARKET, BY CATEGORY, 2018-2032 (USD THOUSAND)
TABLE 401 U.K. INTERIOR COMPONENTS IN PLASTIC COMPOUNDING MARKET, BY TYPE, 2018-2032 (USD THOUSAND)
TABLE 402 U.K. EXTERIOR BODY PARTS IN PLASTIC COMPOUNDING MARKET, BY TYPE, 2018-2032 (USD THOUSAND)
TABLE 403 U.K. UNDER-THE-HOOD APPLICATIONS IN PLASTIC COMPOUNDING MARKET, BY TYPE, 2018-2032 (USD THOUSAND)
TABLE 404 U.K. PACKAGING IN PLASTIC COMPOUNDING MARKET, BY CATEGORY, 2018-2032 (USD THOUSAND)
TABLE 405 U.K. FOOD & BEVERAGE PACKAGING IN PLASTIC COMPOUNDING MARKET, BY TYPE, 2018-2032 (USD THOUSAND)
TABLE 406 U.K. INDUSTRIAL PACKAGING IN PLASTIC COMPOUNDING MARKET, BY TYPE, 2018-2032 (USD THOUSAND)
TABLE 407 U.K. CONSUMER GOODS PACKAGING IN PLASTIC COMPOUNDING MARKET, BY TYPE, 2018-2032 (USD THOUSAND)
TABLE 408 U.K. BUILDING & CONSTRUCTION IN PLASTIC COMPOUNDING MARKET, BY CATEGORY, 2018-2032 (USD THOUSAND)
TABLE 409 U.K. ELECTRICAL & ELECTRONICS IN PLASTIC COMPOUNDING MARKET, BY CATEGORY, 2018-2032 (USD THOUSAND)
TABLE 410 U.K. MEDICAL DEVICES IN PLASTIC COMPOUNDING MARKET, BY CATEGORY, 2018-2032 (USD THOUSAND)
TABLE 411 U.K. FURNITURE IN PLASTIC COMPOUNDING MARKET, BY CATEGORY, 2018-2032 (USD THOUSAND)
TABLE 412 U.K. ENERGY AND POWER IN PLASTIC COMPOUNDING MARKET, BY CATEGORY, 2018-2032 (USD THOUSAND)
TABLE 413 U.K. AEROSPACE AND DEFENSE IN PLASTIC COMPOUNDING MARKET, BY CATEGORY, 2018-2032 (USD THOUSAND)
TABLE 414 SPAIN PLASTIC COMPOUNDING MARKET, BY POLYMER TYPE, 2018-2032 (USD THOUSAND)
TABLE 415 SPAIN PLASTIC COMPOUNDING MARKET, BY POLYMER TYPE, 2018-2032 (KILO TONS)
TABLE 416 SPAIN THERMOPLASTICS IN PLASTIC COMPOUNDING MARKET, BY TYPE, 2018-2032 (USD THOUSAND)
TABLE 417 SPAIN POLYETHYLENE (PE) IN PLASTIC COMPOUNDING MARKET, BY TYPE, 2018-2032 (USD THOUSAND)
TABLE 418 SPAIN ENGINEERING PLASTICS IN PLASTIC COMPOUNDING MARKET, BY TYPE, 2018-2032 (USD THOUSAND)
TABLE 419 SPAIN THERMOSETTING PLASTICS IN PLASTIC COMPOUNDING MARKET, BY TYPE, 2018-2032 (USD THOUSAND)
TABLE 420 SPAIN BIOPLASTICS IN PLASTIC COMPOUNDING MARKET, BY TYPE, 2018-2032 (USD THOUSAND)
TABLE 421 SPAIN PLASTIC COMPOUNDING MARKET, BY FILLER TYPE, 2018-2032 (USD THOUSAND)
TABLE 422 SPAIN MINERAL FILLERS IN PLASTIC COMPOUNDING MARKET, BY TYPE, 2018-2032 (USD THOUSAND)
TABLE 423 SPAIN REINFORCEMENTS IN PLASTIC COMPOUNDING MARKET, BY TYPE, 2018-2032 (USD THOUSAND)
TABLE 424 SPAIN ADDITIVES IN PLASTIC COMPOUNDING MARKET, BY TYPE, 2018-2032 (USD THOUSAND)
TABLE 425 SPAIN PLASTIC COMPOUNDING MARKET, BY MANUFACTURING PROCESS, 2018-2032 (USD THOUSAND)
TABLE 426 SPAIN PLASTIC COMPOUNDING MARKET, BY MANUFACTURING PROCESS, 2018-2032 (KILO TONS)
TABLE 427 SPAIN EXTRUSION IN PLASTIC COMPOUNDING MARKET, BY TYPE, 2018-2032 (USD THOUSAND)
TABLE 428 SPAIN EXTRUSION IN PLASTIC COMPOUNDING MARKET, BY PELLETIZING SYSTEM, 2018-2032 (USD THOUSAND)
TABLE 429 SPAIN INJECTION MOLDING BASED COMPOUNDING IN PLASTIC COMPOUNDING MARKET, BY PELLETIZING SYSTEM, 2018-2032 (USD THOUSAND)
TABLE 430 SPAIN COMPACTION/PRESSING IN PLASTIC COMPOUNDING MARKET, BY PELLETIZING SYSTEM, 2018-2032 (USD THOUSAND)
TABLE 431 SPAIN KNEADER/BANBURY MIXING IN PLASTIC COMPOUNDING MARKET, BY PELLETIZING SYSTEM, 2018-2032 (USD THOUSAND)
TABLE 432 SPAIN PLASTIC COMPOUNDING MARKET, BY PROPERTIES, 2018-2032 (USD THOUSAND)
TABLE 433 SPAIN PLASTIC COMPOUNDING MARKET, BY APPLICATION, 2018-2032 (USD THOUSAND)
TABLE 434 SPAIN PLASTIC COMPOUNDING MARKET, BY APPLICATION, 2018-2032 (KILO TONS)
TABLE 435 SPAIN AUTOMOTIVE IN PLASTIC COMPOUNDING MARKET, BY CATEGORY, 2018-2032 (USD THOUSAND)
TABLE 436 SPAIN INTERIOR COMPONENTS IN PLASTIC COMPOUNDING MARKET, BY TYPE, 2018-2032 (USD THOUSAND)
TABLE 437 SPAIN EXTERIOR BODY PARTS IN PLASTIC COMPOUNDING MARKET, BY TYPE, 2018-2032 (USD THOUSAND)
TABLE 438 SPAIN UNDER-THE-HOOD APPLICATIONS IN PLASTIC COMPOUNDING MARKET, BY TYPE, 2018-2032 (USD THOUSAND)
TABLE 439 SPAIN PACKAGING IN PLASTIC COMPOUNDING MARKET, BY CATEGORY, 2018-2032 (USD THOUSAND)
TABLE 440 SPAIN FOOD & BEVERAGE PACKAGING IN PLASTIC COMPOUNDING MARKET, BY TYPE, 2018-2032 (USD THOUSAND)
TABLE 441 SPAIN INDUSTRIAL PACKAGING IN PLASTIC COMPOUNDING MARKET, BY TYPE, 2018-2032 (USD THOUSAND)
TABLE 442 SPAIN CONSUMER GOODS PACKAGING IN PLASTIC COMPOUNDING MARKET, BY TYPE, 2018-2032 (USD THOUSAND)
TABLE 443 SPAIN BUILDING & CONSTRUCTION IN PLASTIC COMPOUNDING MARKET, BY CATEGORY, 2018-2032 (USD THOUSAND)
TABLE 444 SPAIN ELECTRICAL & ELECTRONICS IN PLASTIC COMPOUNDING MARKET, BY CATEGORY, 2018-2032 (USD THOUSAND)
TABLE 445 SPAIN MEDICAL DEVICES IN PLASTIC COMPOUNDING MARKET, BY CATEGORY, 2018-2032 (USD THOUSAND)
TABLE 446 SPAIN FURNITURE IN PLASTIC COMPOUNDING MARKET, BY CATEGORY, 2018-2032 (USD THOUSAND)
TABLE 447 SPAIN ENERGY AND POWER IN PLASTIC COMPOUNDING MARKET, BY CATEGORY, 2018-2032 (USD THOUSAND)
TABLE 448 SPAIN AEROSPACE AND DEFENSE IN PLASTIC COMPOUNDING MARKET, BY CATEGORY, 2018-2032 (USD THOUSAND)
TABLE 449 RUSSIA PLASTIC COMPOUNDING MARKET, BY POLYMER TYPE, 2018-2032 (USD THOUSAND)
TABLE 450 RUSSIA PLASTIC COMPOUNDING MARKET, BY POLYMER TYPE, 2018-2032 (KILO TONS)
TABLE 451 RUSSIA THERMOPLASTICS IN PLASTIC COMPOUNDING MARKET, BY TYPE, 2018-2032 (USD THOUSAND)
TABLE 452 RUSSIA POLYETHYLENE (PE) IN PLASTIC COMPOUNDING MARKET, BY TYPE, 2018-2032 (USD THOUSAND)
TABLE 453 RUSSIA ENGINEERING PLASTICS IN PLASTIC COMPOUNDING MARKET, BY TYPE, 2018-2032 (USD THOUSAND)
TABLE 454 RUSSIA THERMOSETTING PLASTICS IN PLASTIC COMPOUNDING MARKET, BY TYPE, 2018-2032 (USD THOUSAND)
TABLE 455 RUSSIA BIOPLASTICS IN PLASTIC COMPOUNDING MARKET, BY TYPE, 2018-2032 (USD THOUSAND)
TABLE 456 RUSSIA PLASTIC COMPOUNDING MARKET, BY FILLER TYPE, 2018-2032 (USD THOUSAND)
TABLE 457 RUSSIA MINERAL FILLERS IN PLASTIC COMPOUNDING MARKET, BY TYPE, 2018-2032 (USD THOUSAND)
TABLE 458 RUSSIA REINFORCEMENTS IN PLASTIC COMPOUNDING MARKET, BY TYPE, 2018-2032 (USD THOUSAND)
TABLE 459 RUSSIA ADDITIVES IN PLASTIC COMPOUNDING MARKET, BY TYPE, 2018-2032 (USD THOUSAND)
TABLE 460 RUSSIA PLASTIC COMPOUNDING MARKET, BY MANUFACTURING PROCESS, 2018-2032 (USD THOUSAND)
TABLE 461 RUSSIA PLASTIC COMPOUNDING MARKET, BY MANUFACTURING PROCESS, 2018-2032 (KILO TONS)
TABLE 462 RUSSIA EXTRUSION IN PLASTIC COMPOUNDING MARKET, BY TYPE, 2018-2032 (USD THOUSAND)
TABLE 463 RUSSIA EXTRUSION IN PLASTIC COMPOUNDING MARKET, BY PELLETIZING SYSTEM, 2018-2032 (USD THOUSAND)
TABLE 464 RUSSIA INJECTION MOLDING BASED COMPOUNDING IN PLASTIC COMPOUNDING MARKET, BY PELLETIZING SYSTEM, 2018-2032 (USD THOUSAND)
TABLE 465 RUSSIA COMPACTION/PRESSING IN PLASTIC COMPOUNDING MARKET, BY PELLETIZING SYSTEM, 2018-2032 (USD THOUSAND)
TABLE 466 RUSSIA KNEADER/BANBURY MIXING IN PLASTIC COMPOUNDING MARKET, BY PELLETIZING SYSTEM, 2018-2032 (USD THOUSAND)
TABLE 467 RUSSIA PLASTIC COMPOUNDING MARKET, BY PROPERTIES, 2018-2032 (USD THOUSAND)
TABLE 468 RUSSIA PLASTIC COMPOUNDING MARKET, BY APPLICATION, 2018-2032 (USD THOUSAND)
TABLE 469 RUSSIA PLASTIC COMPOUNDING MARKET, BY APPLICATION, 2018-2032 (KILO TONS)..
TABLE 470 RUSSIA AUTOMOTIVE IN PLASTIC COMPOUNDING MARKET, BY CATEGORY, 2018-2032 (USD THOUSAND)
TABLE 471 RUSSIA INTERIOR COMPONENTS IN PLASTIC COMPOUNDING MARKET, BY TYPE, 2018-2032 (USD THOUSAND)
TABLE 472 RUSSIA EXTERIOR BODY PARTS IN PLASTIC COMPOUNDING MARKET, BY TYPE, 2018-2032 (USD THOUSAND)
TABLE 473 RUSSIA UNDER-THE-HOOD APPLICATIONS IN PLASTIC COMPOUNDING MARKET, BY TYPE, 2018-2032 (USD THOUSAND)
TABLE 474 RUSSIA PACKAGING IN PLASTIC COMPOUNDING MARKET, BY CATEGORY, 2018-2032 (USD THOUSAND)
TABLE 475 RUSSIA FOOD & BEVERAGE PACKAGING IN PLASTIC COMPOUNDING MARKET, BY TYPE, 2018-2032 (USD THOUSAND)
TABLE 476 RUSSIA INDUSTRIAL PACKAGING IN PLASTIC COMPOUNDING MARKET, BY TYPE, 2018-2032 (USD THOUSAND)
TABLE 477 RUSSIA CONSUMER GOODS PACKAGING IN PLASTIC COMPOUNDING MARKET, BY TYPE, 2018-2032 (USD THOUSAND)
TABLE 478 RUSSIA BUILDING & CONSTRUCTION IN PLASTIC COMPOUNDING MARKET, BY CATEGORY, 2018-2032 (USD THOUSAND)
TABLE 479 RUSSIA ELECTRICAL & ELECTRONICS IN PLASTIC COMPOUNDING MARKET, BY CATEGORY, 2018-2032 (USD THOUSAND)
TABLE 480 RUSSIA MEDICAL DEVICES IN PLASTIC COMPOUNDING MARKET, BY CATEGORY, 2018-2032 (USD THOUSAND)
TABLE 481 RUSSIA FURNITURE IN PLASTIC COMPOUNDING MARKET, BY CATEGORY, 2018-2032 (USD THOUSAND)
TABLE 482 RUSSIA ENERGY AND POWER IN PLASTIC COMPOUNDING MARKET, BY CATEGORY, 2018-2032 (USD THOUSAND)
TABLE 483 RUSSIA AEROSPACE AND DEFENSE IN PLASTIC COMPOUNDING MARKET, BY CATEGORY, 2018-2032 (USD THOUSAND)
TABLE 484 SWITZERLAND PLASTIC COMPOUNDING MARKET, BY POLYMER TYPE, 2018-2032 (USD THOUSAND)
TABLE 485 SWITZERLAND PLASTIC COMPOUNDING MARKET, BY POLYMER TYPE, 2018-2032 (KILO TONS)
TABLE 486 SWITZERLAND THERMOPLASTICS IN PLASTIC COMPOUNDING MARKET, BY TYPE, 2018-2032 (USD THOUSAND)
TABLE 487 SWITZERLAND POLYETHYLENE (PE) IN PLASTIC COMPOUNDING MARKET, BY TYPE, 2018-2032 (USD THOUSAND)
TABLE 488 SWITZERLAND ENGINEERING PLASTICS IN PLASTIC COMPOUNDING MARKET, BY TYPE, 2018-2032 (USD THOUSAND)
TABLE 489 SWITZERLAND THERMOSETTING PLASTICS IN PLASTIC COMPOUNDING MARKET, BY TYPE, 2018-2032 (USD THOUSAND)
TABLE 490 SWITZERLAND BIOPLASTICS IN PLASTIC COMPOUNDING MARKET, BY TYPE, 2018-2032 (USD THOUSAND)
TABLE 491 SWITZERLAND PLASTIC COMPOUNDING MARKET, BY FILLER TYPE, 2018-2032 (USD THOUSAND)
TABLE 492 SWITZERLAND MINERAL FILLERS IN PLASTIC COMPOUNDING MARKET, BY TYPE, 2018-2032 (USD THOUSAND)
TABLE 493 SWITZERLAND REINFORCEMENTS IN PLASTIC COMPOUNDING MARKET, BY TYPE, 2018-2032 (USD THOUSAND)
TABLE 494 SWITZERLAND ADDITIVES IN PLASTIC COMPOUNDING MARKET, BY TYPE, 2018-2032 (USD THOUSAND)
TABLE 495 SWITZERLAND PLASTIC COMPOUNDING MARKET, BY MANUFACTURING PROCESS, 2018-2032 (USD THOUSAND)
TABLE 496 SWITZERLAND PLASTIC COMPOUNDING MARKET, BY MANUFACTURING PROCESS, 2018-2032 (KILO TONS)
TABLE 497 SWITZERLAND EXTRUSION IN PLASTIC COMPOUNDING MARKET, BY TYPE, 2018-2032 (USD THOUSAND)
TABLE 498 SWITZERLAND EXTRUSION IN PLASTIC COMPOUNDING MARKET, BY PELLETIZING SYSTEM, 2018-2032 (USD THOUSAND)
TABLE 499 SWITZERLAND INJECTION MOLDING BASED COMPOUNDING IN PLASTIC COMPOUNDING MARKET, BY PELLETIZING SYSTEM, 2018-2032 (USD THOUSAND)
TABLE 500 SWITZERLAND COMPACTION/PRESSING IN PLASTIC COMPOUNDING MARKET, BY PELLETIZING SYSTEM, 2018-2032 (USD THOUSAND)
TABLE 501 SWITZERLAND KNEADER/BANBURY MIXING IN PLASTIC COMPOUNDING MARKET, BY PELLETIZING SYSTEM, 2018-2032 (USD THOUSAND)
TABLE 502 SWITZERLAND PLASTIC COMPOUNDING MARKET, BY PROPERTIES, 2018-2032 (USD THOUSAND)
TABLE 503 SWITZERLAND PLASTIC COMPOUNDING MARKET, BY APPLICATION, 2018-2032 (USD THOUSAND)
TABLE 504 SWITZERLAND PLASTIC COMPOUNDING MARKET, BY APPLICATION, 2018-2032 (KILO TONS)
TABLE 505 SWITZERLAND AUTOMOTIVE IN PLASTIC COMPOUNDING MARKET, BY CATEGORY, 2018-2032 (USD THOUSAND)
TABLE 506 SWITZERLAND INTERIOR COMPONENTS IN PLASTIC COMPOUNDING MARKET, BY TYPE, 2018-2032 (USD THOUSAND)
TABLE 507 SWITZERLAND EXTERIOR BODY PARTS IN PLASTIC COMPOUNDING MARKET, BY TYPE, 2018-2032 (USD THOUSAND)
TABLE 508 SWITZERLAND UNDER-THE-HOOD APPLICATIONS IN PLASTIC COMPOUNDING MARKET, BY TYPE, 2018-2032 (USD THOUSAND)
TABLE 509 SWITZERLAND PACKAGING IN PLASTIC COMPOUNDING MARKET, BY CATEGORY, 2018-2032 (USD THOUSAND)
TABLE 510 SWITZERLAND FOOD & BEVERAGE PACKAGING IN PLASTIC COMPOUNDING MARKET, BY TYPE, 2018-2032 (USD THOUSAND)
TABLE 511 SWITZERLAND INDUSTRIAL PACKAGING IN PLASTIC COMPOUNDING MARKET, BY TYPE, 2018-2032 (USD THOUSAND)
TABLE 512 SWITZERLAND CONSUMER GOODS PACKAGING IN PLASTIC COMPOUNDING MARKET, BY TYPE, 2018-2032 (USD THOUSAND)
TABLE 513 SWITZERLAND BUILDING & CONSTRUCTION IN PLASTIC COMPOUNDING MARKET, BY CATEGORY, 2018-2032 (USD THOUSAND)
TABLE 514 SWITZERLAND ELECTRICAL & ELECTRONICS IN PLASTIC COMPOUNDING MARKET, BY CATEGORY, 2018-2032 (USD THOUSAND)
TABLE 515 SWITZERLAND MEDICAL DEVICES IN PLASTIC COMPOUNDING MARKET, BY CATEGORY, 2018-2032 (USD THOUSAND)
TABLE 516 SWITZERLAND FURNITURE IN PLASTIC COMPOUNDING MARKET, BY CATEGORY, 2018-2032 (USD THOUSAND)
TABLE 517 SWITZERLAND ENERGY AND POWER IN PLASTIC COMPOUNDING MARKET, BY CATEGORY, 2018-2032 (USD THOUSAND)
TABLE 518 SWITZERLAND AEROSPACE AND DEFENSE IN PLASTIC COMPOUNDING MARKET, BY CATEGORY, 2018-2032 (USD THOUSAND)
TABLE 519 TURKEY PLASTIC COMPOUNDING MARKET, BY POLYMER TYPE, 2018-2032 (USD THOUSAND)
TABLE 520 TURKEY PLASTIC COMPOUNDING MARKET, BY POLYMER TYPE, 2018-2032 (KILO TONS)
TABLE 521 TURKEY THERMOPLASTICS IN PLASTIC COMPOUNDING MARKET, BY TYPE, 2018-2032 (USD THOUSAND)
TABLE 522 TURKEY POLYETHYLENE (PE) IN PLASTIC COMPOUNDING MARKET, BY TYPE, 2018-2032 (USD THOUSAND)
TABLE 523 TURKEY ENGINEERING PLASTICS IN PLASTIC COMPOUNDING MARKET, BY TYPE, 2018-2032 (USD THOUSAND)
TABLE 524 TURKEY THERMOSETTING PLASTICS IN PLASTIC COMPOUNDING MARKET, BY TYPE, 2018-2032 (USD THOUSAND)
TABLE 525 TURKEY BIOPLASTICS IN PLASTIC COMPOUNDING MARKET, BY TYPE, 2018-2032 (USD THOUSAND)
TABLE 526 TURKEY PLASTIC COMPOUNDING MARKET, BY FILLER TYPE, 2018-2032 (USD THOUSAND)
TABLE 527 TURKEY MINERAL FILLERS IN PLASTIC COMPOUNDING MARKET, BY TYPE, 2018-2032 (USD THOUSAND)
TABLE 528 TURKEY REINFORCEMENTS IN PLASTIC COMPOUNDING MARKET, BY TYPE, 2018-2032 (USD THOUSAND)
TABLE 529 TURKEY ADDITIVES IN PLASTIC COMPOUNDING MARKET, BY TYPE, 2018-2032 (USD THOUSAND)
TABLE 530 TURKEY PLASTIC COMPOUNDING MARKET, BY MANUFACTURING PROCESS, 2018-2032 (USD THOUSAND)
TABLE 531 TURKEY PLASTIC COMPOUNDING MARKET, BY MANUFACTURING PROCESS, 2018-2032 (KILO TONS)
TABLE 532 TURKEY EXTRUSION IN PLASTIC COMPOUNDING MARKET, BY TYPE, 2018-2032 (USD THOUSAND)
TABLE 533 TURKEY EXTRUSION IN PLASTIC COMPOUNDING MARKET, BY PELLETIZING SYSTEM, 2018-2032 (USD THOUSAND)
TABLE 534 TURKEY INJECTION MOLDING BASED COMPOUNDING IN PLASTIC COMPOUNDING MARKET, BY PELLETIZING SYSTEM, 2018-2032 (USD THOUSAND)
TABLE 535 TURKEY COMPACTION/PRESSING IN PLASTIC COMPOUNDING MARKET, BY PELLETIZING SYSTEM, 2018-2032 (USD THOUSAND)
TABLE 536 TURKEY KNEADER/BANBURY MIXING IN PLASTIC COMPOUNDING MARKET, BY PELLETIZING SYSTEM, 2018-2032 (USD THOUSAND)
TABLE 537 TURKEY PLASTIC COMPOUNDING MARKET, BY PROPERTIES, 2018-2032 (USD THOUSAND)
TABLE 538 TURKEY PLASTIC COMPOUNDING MARKET, BY APPLICATION, 2018-2032 (USD THOUSAND)
TABLE 539 TURKEY PLASTIC COMPOUNDING MARKET, BY APPLICATION, 2018-2032 (KILO TONS)
TABLE 540 TURKEY AUTOMOTIVE IN PLASTIC COMPOUNDING MARKET, BY CATEGORY, 2018-2032 (USD THOUSAND)
TABLE 541 TURKEY INTERIOR COMPONENTS IN PLASTIC COMPOUNDING MARKET, BY TYPE, 2018-2032 (USD THOUSAND)
TABLE 542 TURKEY EXTERIOR BODY PARTS IN PLASTIC COMPOUNDING MARKET, BY TYPE, 2018-2032 (USD THOUSAND)
TABLE 543 TURKEY UNDER-THE-HOOD APPLICATIONS IN PLASTIC COMPOUNDING MARKET, BY TYPE, 2018-2032 (USD THOUSAND)
TABLE 544 TURKEY PACKAGING IN PLASTIC COMPOUNDING MARKET, BY CATEGORY, 2018-2032 (USD THOUSAND)
TABLE 545 TURKEY FOOD & BEVERAGE PACKAGING IN PLASTIC COMPOUNDING MARKET, BY TYPE, 2018-2032 (USD THOUSAND)
TABLE 546 TURKEY INDUSTRIAL PACKAGING IN PLASTIC COMPOUNDING MARKET, BY TYPE, 2018-2032 (USD THOUSAND)
TABLE 547 TURKEY CONSUMER GOODS PACKAGING IN PLASTIC COMPOUNDING MARKET, BY TYPE, 2018-2032 (USD THOUSAND)
TABLE 548 TURKEY BUILDING & CONSTRUCTION IN PLASTIC COMPOUNDING MARKET, BY CATEGORY, 2018-2032 (USD THOUSAND)
TABLE 549 TURKEY ELECTRICAL & ELECTRONICS IN PLASTIC COMPOUNDING MARKET, BY CATEGORY, 2018-2032 (USD THOUSAND)
TABLE 550 TURKEY MEDICAL DEVICES IN PLASTIC COMPOUNDING MARKET, BY CATEGORY, 2018-2032 (USD THOUSAND)
TABLE 551 TURKEY FURNITURE IN PLASTIC COMPOUNDING MARKET, BY CATEGORY, 2018-2032 (USD THOUSAND)
TABLE 552 TURKEY ENERGY AND POWER IN PLASTIC COMPOUNDING MARKET, BY CATEGORY, 2018-2032 (USD THOUSAND)
TABLE 553 TURKEY AEROSPACE AND DEFENSE IN PLASTIC COMPOUNDING MARKET, BY CATEGORY, 2018-2032 (USD THOUSAND)
TABLE 554 BELGIUM PLASTIC COMPOUNDING MARKET, BY POLYMER TYPE, 2018-2032 (USD THOUSAND)
TABLE 555 BELGIUM PLASTIC COMPOUNDING MARKET, BY POLYMER TYPE, 2018-2032 (KILO TONS)
TABLE 556 BELGIUM THERMOPLASTICS IN PLASTIC COMPOUNDING MARKET, BY TYPE, 2018-2032 (USD THOUSAND)
TABLE 557 BELGIUM POLYETHYLENE (PE) IN PLASTIC COMPOUNDING MARKET, BY TYPE, 2018-2032 (USD THOUSAND)
TABLE 558 BELGIUM ENGINEERING PLASTICS IN PLASTIC COMPOUNDING MARKET, BY TYPE, 2018-2032 (USD THOUSAND)
TABLE 559 BELGIUM THERMOSETTING PLASTICS IN PLASTIC COMPOUNDING MARKET, BY TYPE, 2018-2032 (USD THOUSAND)
TABLE 560 BELGIUM BIOPLASTICS IN PLASTIC COMPOUNDING MARKET, BY TYPE, 2018-2032 (USD THOUSAND)
TABLE 561 BELGIUM PLASTIC COMPOUNDING MARKET, BY FILLER TYPE, 2018-2032 (USD THOUSAND)
TABLE 562 BELGIUM MINERAL FILLERS IN PLASTIC COMPOUNDING MARKET, BY TYPE, 2018-2032 (USD THOUSAND)
TABLE 563 BELGIUM REINFORCEMENTS IN PLASTIC COMPOUNDING MARKET, BY TYPE, 2018-2032 (USD THOUSAND)
TABLE 564 BELGIUM ADDITIVES IN PLASTIC COMPOUNDING MARKET, BY TYPE, 2018-2032 (USD THOUSAND)
TABLE 565 BELGIUM PLASTIC COMPOUNDING MARKET, BY MANUFACTURING PROCESS, 2018-2032 (USD THOUSAND)
TABLE 566 BELGIUM PLASTIC COMPOUNDING MARKET, BY MANUFACTURING PROCESS, 2018-2032 (KILO TONS)
TABLE 567 BELGIUM EXTRUSION IN PLASTIC COMPOUNDING MARKET, BY TYPE, 2018-2032 (USD THOUSAND)
TABLE 568 BELGIUM EXTRUSION IN PLASTIC COMPOUNDING MARKET, BY PELLETIZING SYSTEM, 2018-2032 (USD THOUSAND)
TABLE 569 BELGIUM INJECTION MOLDING BASED COMPOUNDING IN PLASTIC COMPOUNDING MARKET, BY PELLETIZING SYSTEM, 2018-2032 (USD THOUSAND)
TABLE 570 BELGIUM COMPACTION/PRESSING IN PLASTIC COMPOUNDING MARKET, BY PELLETIZING SYSTEM, 2018-2032 (USD THOUSAND)
TABLE 571 BELGIUM KNEADER/BANBURY MIXING IN PLASTIC COMPOUNDING MARKET, BY PELLETIZING SYSTEM, 2018-2032 (USD THOUSAND)
TABLE 572 BELGIUM PLASTIC COMPOUNDING MARKET, BY PROPERTIES, 2018-2032 (USD THOUSAND)
TABLE 573 BELGIUM PLASTIC COMPOUNDING MARKET, BY APPLICATION, 2018-2032 (USD THOUSAND)
TABLE 574 BELGIUM PLASTIC COMPOUNDING MARKET, BY APPLICATION, 2018-2032 (KILO TONS)
TABLE 575 BELGIUM AUTOMOTIVE IN PLASTIC COMPOUNDING MARKET, BY CATEGORY, 2018-2032 (USD THOUSAND)
TABLE 576 BELGIUM INTERIOR COMPONENTS IN PLASTIC COMPOUNDING MARKET, BY TYPE, 2018-2032 (USD THOUSAND)
TABLE 577 BELGIUM EXTERIOR BODY PARTS IN PLASTIC COMPOUNDING MARKET, BY TYPE, 2018-2032 (USD THOUSAND)
TABLE 578 BELGIUM UNDER-THE-HOOD APPLICATIONS IN PLASTIC COMPOUNDING MARKET, BY TYPE, 2018-2032 (USD THOUSAND)
TABLE 579 BELGIUM PACKAGING IN PLASTIC COMPOUNDING MARKET, BY CATEGORY, 2018-2032 (USD THOUSAND)
TABLE 580 BELGIUM FOOD & BEVERAGE PACKAGING IN PLASTIC COMPOUNDING MARKET, BY TYPE, 2018-2032 (USD THOUSAND)
TABLE 581 BELGIUM INDUSTRIAL PACKAGING IN PLASTIC COMPOUNDING MARKET, BY TYPE, 2018-2032 (USD THOUSAND)
TABLE 582 BELGIUM CONSUMER GOODS PACKAGING IN PLASTIC COMPOUNDING MARKET, BY TYPE, 2018-2032 (USD THOUSAND)
TABLE 583 BELGIUM BUILDING & CONSTRUCTION IN PLASTIC COMPOUNDING MARKET, BY CATEGORY, 2018-2032 (USD THOUSAND)
TABLE 584 BELGIUM ELECTRICAL & ELECTRONICS IN PLASTIC COMPOUNDING MARKET, BY CATEGORY, 2018-2032 (USD THOUSAND)
TABLE 585 BELGIUM MEDICAL DEVICES IN PLASTIC COMPOUNDING MARKET, BY CATEGORY, 2018-2032 (USD THOUSAND)
TABLE 586 BELGIUM FURNITURE IN PLASTIC COMPOUNDING MARKET, BY CATEGORY, 2018-2032 (USD THOUSAND)
TABLE 587 BELGIUM ENERGY AND POWER IN PLASTIC COMPOUNDING MARKET, BY CATEGORY, 2018-2032 (USD THOUSAND)
TABLE 588 BELGIUM AEROSPACE AND DEFENSE IN PLASTIC COMPOUNDING MARKET, BY CATEGORY, 2018-2032 (USD THOUSAND)
TABLE 589 NETHERLANDS PLASTIC COMPOUNDING MARKET, BY POLYMER TYPE, 2018-2032 (USD THOUSAND)
TABLE 590 NETHERLANDS PLASTIC COMPOUNDING MARKET, BY POLYMER TYPE, 2018-2032 (KILO TONS)
TABLE 591 NETHERLANDS THERMOPLASTICS IN PLASTIC COMPOUNDING MARKET, BY TYPE, 2018-2032 (USD THOUSAND)
TABLE 592 NETHERLANDS POLYETHYLENE (PE) IN PLASTIC COMPOUNDING MARKET, BY TYPE, 2018-2032 (USD THOUSAND)
TABLE 593 NETHERLANDS ENGINEERING PLASTICS IN PLASTIC COMPOUNDING MARKET, BY TYPE, 2018-2032 (USD THOUSAND)
TABLE 594 NETHERLANDS THERMOSETTING PLASTICS IN PLASTIC COMPOUNDING MARKET, BY TYPE, 2018-2032 (USD THOUSAND)
TABLE 595 NETHERLANDS BIOPLASTICS IN PLASTIC COMPOUNDING MARKET, BY TYPE, 2018-2032 (USD THOUSAND)
TABLE 596 NETHERLANDS PLASTIC COMPOUNDING MARKET, BY FILLER TYPE, 2018-2032 (USD THOUSAND)
TABLE 597 NETHERLANDS MINERAL FILLERS IN PLASTIC COMPOUNDING MARKET, BY TYPE, 2018-2032 (USD THOUSAND)
TABLE 598 NETHERLANDS REINFORCEMENTS IN PLASTIC COMPOUNDING MARKET, BY TYPE, 2018-2032 (USD THOUSAND)
TABLE 599 NETHERLANDS ADDITIVES IN PLASTIC COMPOUNDING MARKET, BY TYPE, 2018-2032 (USD THOUSAND)
TABLE 600 NETHERLANDS PLASTIC COMPOUNDING MARKET, BY MANUFACTURING PROCESS, 2018-2032 (USD THOUSAND)
TABLE 601 NETHERLANDS PLASTIC COMPOUNDING MARKET, BY MANUFACTURING PROCESS, 2018-2032 (KILO TONS)
TABLE 602 NETHERLANDS EXTRUSION IN PLASTIC COMPOUNDING MARKET, BY TYPE, 2018-2032 (USD THOUSAND)
TABLE 603 NETHERLANDS EXTRUSION IN PLASTIC COMPOUNDING MARKET, BY PELLETIZING SYSTEM, 2018-2032 (USD THOUSAND)
TABLE 604 NETHERLANDS INJECTION MOLDING BASED COMPOUNDING IN PLASTIC COMPOUNDING MARKET, BY PELLETIZING SYSTEM, 2018-2032 (USD THOUSAND)
TABLE 605 NETHERLANDS COMPACTION/PRESSING IN PLASTIC COMPOUNDING MARKET, BY PELLETIZING SYSTEM, 2018-2032 (USD THOUSAND)
TABLE 606 NETHERLANDS KNEADER/BANBURY MIXING IN PLASTIC COMPOUNDING MARKET, BY PELLETIZING SYSTEM, 2018-2032 (USD THOUSAND)
TABLE 607 NETHERLANDS PLASTIC COMPOUNDING MARKET, BY PROPERTIES, 2018-2032 (USD THOUSAND)
TABLE 608 NETHERLANDS PLASTIC COMPOUNDING MARKET, BY APPLICATION, 2018-2032 (USD THOUSAND)
TABLE 609 NETHERLANDS PLASTIC COMPOUNDING MARKET, BY APPLICATION, 2018-2032 (KILO TONS)
TABLE 610 NETHERLANDS AUTOMOTIVE IN PLASTIC COMPOUNDING MARKET, BY CATEGORY, 2018-2032 (USD THOUSAND)
TABLE 611 NETHERLANDS INTERIOR COMPONENTS IN PLASTIC COMPOUNDING MARKET, BY TYPE, 2018-2032 (USD THOUSAND)
TABLE 612 NETHERLANDS EXTERIOR BODY PARTS IN PLASTIC COMPOUNDING MARKET, BY TYPE, 2018-2032 (USD THOUSAND)
TABLE 613 NETHERLANDS UNDER-THE-HOOD APPLICATIONS IN PLASTIC COMPOUNDING MARKET, BY TYPE, 2018-2032 (USD THOUSAND)
TABLE 614 NETHERLANDS PACKAGING IN PLASTIC COMPOUNDING MARKET, BY CATEGORY, 2018-2032 (USD THOUSAND)
TABLE 615 NETHERLANDS FOOD & BEVERAGE PACKAGING IN PLASTIC COMPOUNDING MARKET, BY TYPE, 2018-2032 (USD THOUSAND)
TABLE 616 NETHERLANDS INDUSTRIAL PACKAGING IN PLASTIC COMPOUNDING MARKET, BY TYPE, 2018-2032 (USD THOUSAND)
TABLE 617 NETHERLANDS CONSUMER GOODS PACKAGING IN PLASTIC COMPOUNDING MARKET, BY TYPE, 2018-2032 (USD THOUSAND)
TABLE 618 NETHERLANDS BUILDING & CONSTRUCTION IN PLASTIC COMPOUNDING MARKET, BY CATEGORY, 2018-2032 (USD THOUSAND)
TABLE 619 NETHERLANDS ELECTRICAL & ELECTRONICS IN PLASTIC COMPOUNDING MARKET, BY CATEGORY, 2018-2032 (USD THOUSAND)
TABLE 620 NETHERLANDS MEDICAL DEVICES IN PLASTIC COMPOUNDING MARKET, BY CATEGORY, 2018-2032 (USD THOUSAND)
TABLE 621 NETHERLANDS FURNITURE IN PLASTIC COMPOUNDING MARKET, BY CATEGORY, 2018-2032 (USD THOUSAND)
TABLE 622 NETHERLANDS ENERGY AND POWER IN PLASTIC COMPOUNDING MARKET, BY CATEGORY, 2018-2032 (USD THOUSAND)
TABLE 623 NETHERLANDS AEROSPACE AND DEFENSE IN PLASTIC COMPOUNDING MARKET, BY CATEGORY, 2018-2032 (USD THOUSAND)
TABLE 624 NORWAY PLASTIC COMPOUNDING MARKET, BY POLYMER TYPE, 2018-2032 (USD THOUSAND)
TABLE 625 NORWAY PLASTIC COMPOUNDING MARKET, BY POLYMER TYPE, 2018-2032 (KILO TONS)
TABLE 626 NORWAY THERMOPLASTICS IN PLASTIC COMPOUNDING MARKET, BY TYPE, 2018-2032 (USD THOUSAND)
TABLE 627 NORWAY POLYETHYLENE (PE) IN PLASTIC COMPOUNDING MARKET, BY TYPE, 2018-2032 (USD THOUSAND)
TABLE 628 NORWAY ENGINEERING PLASTICS IN PLASTIC COMPOUNDING MARKET, BY TYPE, 2018-2032 (USD THOUSAND)
TABLE 629 NORWAY THERMOSETTING PLASTICS IN PLASTIC COMPOUNDING MARKET, BY TYPE, 2018-2032 (USD THOUSAND)
TABLE 630 NORWAY BIOPLASTICS IN PLASTIC COMPOUNDING MARKET, BY TYPE, 2018-2032 (USD THOUSAND)
TABLE 631 NORWAY PLASTIC COMPOUNDING MARKET, BY FILLER TYPE, 2018-2032 (USD THOUSAND)
TABLE 632 NORWAY MINERAL FILLERS IN PLASTIC COMPOUNDING MARKET, BY TYPE, 2018-2032 (USD THOUSAND)
TABLE 633 NORWAY REINFORCEMENTS IN PLASTIC COMPOUNDING MARKET, BY TYPE, 2018-2032 (USD THOUSAND)
TABLE 634 NORWAY ADDITIVES IN PLASTIC COMPOUNDING MARKET, BY TYPE, 2018-2032 (USD THOUSAND)
TABLE 635 NORWAY PLASTIC COMPOUNDING MARKET, BY MANUFACTURING PROCESS, 2018-2032 (USD THOUSAND)
TABLE 636 NORWAY PLASTIC COMPOUNDING MARKET, BY MANUFACTURING PROCESS, 2018-2032 (KILO TONS)
TABLE 637 NORWAY EXTRUSION IN PLASTIC COMPOUNDING MARKET, BY TYPE, 2018-2032 (USD THOUSAND)
TABLE 638 NORWAY EXTRUSION IN PLASTIC COMPOUNDING MARKET, BY PELLETIZING SYSTEM, 2018-2032 (USD THOUSAND)
TABLE 639 NORWAY INJECTION MOLDING BASED COMPOUNDING IN PLASTIC COMPOUNDING MARKET, BY PELLETIZING SYSTEM, 2018-2032 (USD THOUSAND)
TABLE 640 NORWAY COMPACTION/PRESSING IN PLASTIC COMPOUNDING MARKET, BY PELLETIZING SYSTEM, 2018-2032 (USD THOUSAND)
TABLE 641 NORWAY KNEADER/BANBURY MIXING IN PLASTIC COMPOUNDING MARKET, BY PELLETIZING SYSTEM, 2018-2032 (USD THOUSAND)
TABLE 642 NORWAY PLASTIC COMPOUNDING MARKET, BY PROPERTIES, 2018-2032 (USD THOUSAND)
TABLE 643 NORWAY PLASTIC COMPOUNDING MARKET, BY APPLICATION, 2018-2032 (USD THOUSAND)
TABLE 644 NORWAY PLASTIC COMPOUNDING MARKET, BY APPLICATION, 2018-2032 (KILO TONS)
TABLE 645 NORWAY AUTOMOTIVE IN PLASTIC COMPOUNDING MARKET, BY CATEGORY, 2018-2032 (USD THOUSAND)
TABLE 646 NORWAY INTERIOR COMPONENTS IN PLASTIC COMPOUNDING MARKET, BY TYPE, 2018-2032 (USD THOUSAND)
TABLE 647 NORWAY EXTERIOR BODY PARTS IN PLASTIC COMPOUNDING MARKET, BY TYPE, 2018-2032 (USD THOUSAND)
TABLE 648 NORWAY UNDER-THE-HOOD APPLICATIONS IN PLASTIC COMPOUNDING MARKET, BY TYPE, 2018-2032 (USD THOUSAND)
TABLE 649 NORWAY PACKAGING IN PLASTIC COMPOUNDING MARKET, BY CATEGORY, 2018-2032 (USD THOUSAND)
TABLE 650 NORWAY FOOD & BEVERAGE PACKAGING IN PLASTIC COMPOUNDING MARKET, BY TYPE, 2018-2032 (USD THOUSAND)
TABLE 651 NORWAY INDUSTRIAL PACKAGING IN PLASTIC COMPOUNDING MARKET, BY TYPE, 2018-2032 (USD THOUSAND)
TABLE 652 NORWAY CONSUMER GOODS PACKAGING IN PLASTIC COMPOUNDING MARKET, BY TYPE, 2018-2032 (USD THOUSAND)
TABLE 653 NORWAY BUILDING & CONSTRUCTION IN PLASTIC COMPOUNDING MARKET, BY CATEGORY, 2018-2032 (USD THOUSAND)
TABLE 654 NORWAY ELECTRICAL & ELECTRONICS IN PLASTIC COMPOUNDING MARKET, BY CATEGORY, 2018-2032 (USD THOUSAND)
TABLE 655 NORWAY MEDICAL DEVICES IN PLASTIC COMPOUNDING MARKET, BY CATEGORY, 2018-2032 (USD THOUSAND)
TABLE 656 NORWAY FURNITURE IN PLASTIC COMPOUNDING MARKET, BY CATEGORY, 2018-2032 (USD THOUSAND)
TABLE 657 NORWAY ENERGY AND POWER IN PLASTIC COMPOUNDING MARKET, BY CATEGORY, 2018-2032 (USD THOUSAND)
TABLE 658 NORWAY AEROSPACE AND DEFENSE IN PLASTIC COMPOUNDING MARKET, BY CATEGORY, 2018-2032 (USD THOUSAND)
TABLE 659 FINLAND PLASTIC COMPOUNDING MARKET, BY POLYMER TYPE, 2018-2032 (USD THOUSAND)
TABLE 660 FINLAND PLASTIC COMPOUNDING MARKET, BY POLYMER TYPE, 2018-2032 (KILO TONS)
TABLE 661 FINLAND THERMOPLASTICS IN PLASTIC COMPOUNDING MARKET, BY TYPE, 2018-2032 (USD THOUSAND)
TABLE 662 FINLAND POLYETHYLENE (PE) IN PLASTIC COMPOUNDING MARKET, BY TYPE, 2018-2032 (USD THOUSAND)
TABLE 663 FINLAND ENGINEERING PLASTICS IN PLASTIC COMPOUNDING MARKET, BY TYPE, 2018-2032 (USD THOUSAND)
TABLE 664 FINLAND THERMOSETTING PLASTICS IN PLASTIC COMPOUNDING MARKET, BY TYPE, 2018-2032 (USD THOUSAND)
TABLE 665 FINLAND BIOPLASTICS IN PLASTIC COMPOUNDING MARKET, BY TYPE, 2018-2032 (USD THOUSAND)
TABLE 666 FINLAND PLASTIC COMPOUNDING MARKET, BY FILLER TYPE, 2018-2032 (USD THOUSAND)
TABLE 667 FINLAND MINERAL FILLERS IN PLASTIC COMPOUNDING MARKET, BY TYPE, 2018-2032 (USD THOUSAND)
TABLE 668 FINLAND REINFORCEMENTS IN PLASTIC COMPOUNDING MARKET, BY TYPE, 2018-2032 (USD THOUSAND)
TABLE 669 FINLAND ADDITIVES IN PLASTIC COMPOUNDING MARKET, BY TYPE, 2018-2032 (USD THOUSAND)
TABLE 670 FINLAND PLASTIC COMPOUNDING MARKET, BY MANUFACTURING PROCESS, 2018-2032 (USD THOUSAND)
TABLE 671 FINLAND PLASTIC COMPOUNDING MARKET, BY MANUFACTURING PROCESS, 2018-2032 (KILO TONS)
TABLE 672 FINLAND EXTRUSION IN PLASTIC COMPOUNDING MARKET, BY TYPE, 2018-2032 (USD THOUSAND)
TABLE 673 FINLAND EXTRUSION IN PLASTIC COMPOUNDING MARKET, BY PELLETIZING SYSTEM, 2018-2032 (USD THOUSAND)
TABLE 674 FINLAND INJECTION MOLDING BASED COMPOUNDING IN PLASTIC COMPOUNDING MARKET, BY PELLETIZING SYSTEM, 2018-2032 (USD THOUSAND)
TABLE 675 FINLAND COMPACTION/PRESSING IN PLASTIC COMPOUNDING MARKET, BY PELLETIZING SYSTEM, 2018-2032 (USD THOUSAND)
TABLE 676 FINLAND KNEADER/BANBURY MIXING IN PLASTIC COMPOUNDING MARKET, BY PELLETIZING SYSTEM, 2018-2032 (USD THOUSAND)
TABLE 677 FINLAND PLASTIC COMPOUNDING MARKET, BY PROPERTIES, 2018-2032 (USD THOUSAND)
TABLE 678 FINLAND PLASTIC COMPOUNDING MARKET, BY APPLICATION, 2018-2032 (USD THOUSAND)
TABLE 679 FINLAND PLASTIC COMPOUNDING MARKET, BY APPLICATION, 2018-2032 (KILO TONS)
TABLE 680 FINLAND AUTOMOTIVE IN PLASTIC COMPOUNDING MARKET, BY CATEGORY, 2018-2032 (USD THOUSAND)
TABLE 681 FINLAND INTERIOR COMPONENTS IN PLASTIC COMPOUNDING MARKET, BY TYPE, 2018-2032 (USD THOUSAND)
TABLE 682 FINLAND EXTERIOR BODY PARTS IN PLASTIC COMPOUNDING MARKET, BY TYPE, 2018-2032 (USD THOUSAND)
TABLE 683 FINLAND UNDER-THE-HOOD APPLICATIONS IN PLASTIC COMPOUNDING MARKET, BY TYPE, 2018-2032 (USD THOUSAND)
TABLE 684 FINLAND PACKAGING IN PLASTIC COMPOUNDING MARKET, BY CATEGORY, 2018-2032 (USD THOUSAND)
TABLE 685 FINLAND FOOD & BEVERAGE PACKAGING IN PLASTIC COMPOUNDING MARKET, BY TYPE, 2018-2032 (USD THOUSAND)
TABLE 686 FINLAND INDUSTRIAL PACKAGING IN PLASTIC COMPOUNDING MARKET, BY TYPE, 2018-2032 (USD THOUSAND)
TABLE 687 FINLAND CONSUMER GOODS PACKAGING IN PLASTIC COMPOUNDING MARKET, BY TYPE, 2018-2032 (USD THOUSAND)
TABLE 688 FINLAND BUILDING & CONSTRUCTION IN PLASTIC COMPOUNDING MARKET, BY CATEGORY, 2018-2032 (USD THOUSAND)
TABLE 689 FINLAND ELECTRICAL & ELECTRONICS IN PLASTIC COMPOUNDING MARKET, BY CATEGORY, 2018-2032 (USD THOUSAND)
TABLE 690 FINLAND MEDICAL DEVICES IN PLASTIC COMPOUNDING MARKET, BY CATEGORY, 2018-2032 (USD THOUSAND)
TABLE 691 FINLAND FURNITURE IN PLASTIC COMPOUNDING MARKET, BY CATEGORY, 2018-2032 (USD THOUSAND)
TABLE 692 FINLAND ENERGY AND POWER IN PLASTIC COMPOUNDING MARKET, BY CATEGORY, 2018-2032 (USD THOUSAND)
TABLE 693 FINLAND AEROSPACE AND DEFENSE IN PLASTIC COMPOUNDING MARKET, BY CATEGORY, 2018-2032 (USD THOUSAND)
TABLE 694 DENMARK PLASTIC COMPOUNDING MARKET, BY POLYMER TYPE, 2018-2032 (USD THOUSAND)
TABLE 695 DENMARK PLASTIC COMPOUNDING MARKET, BY POLYMER TYPE, 2018-2032 (KILO TONS)
TABLE 696 DENMARK THERMOPLASTICS IN PLASTIC COMPOUNDING MARKET, BY TYPE, 2018-2032 (USD THOUSAND)
TABLE 697 DENMARK POLYETHYLENE (PE) IN PLASTIC COMPOUNDING MARKET, BY TYPE, 2018-2032 (USD THOUSAND)
TABLE 698 DENMARK ENGINEERING PLASTICS IN PLASTIC COMPOUNDING MARKET, BY TYPE, 2018-2032 (USD THOUSAND)
TABLE 699 DENMARK THERMOSETTING PLASTICS IN PLASTIC COMPOUNDING MARKET, BY TYPE, 2018-2032 (USD THOUSAND)
TABLE 700 DENMARK BIOPLASTICS IN PLASTIC COMPOUNDING MARKET, BY TYPE, 2018-2032 (USD THOUSAND)
TABLE 701 DENMARK PLASTIC COMPOUNDING MARKET, BY FILLER TYPE, 2018-2032 (USD THOUSAND)
TABLE 702 DENMARK MINERAL FILLERS IN PLASTIC COMPOUNDING MARKET, BY TYPE, 2018-2032 (USD THOUSAND)
TABLE 703 DENMARK REINFORCEMENTS IN PLASTIC COMPOUNDING MARKET, BY TYPE, 2018-2032 (USD THOUSAND)
TABLE 704 DENMARK ADDITIVES IN PLASTIC COMPOUNDING MARKET, BY TYPE, 2018-2032 (USD THOUSAND)
TABLE 705 DENMARK PLASTIC COMPOUNDING MARKET, BY MANUFACTURING PROCESS, 2018-2032 (USD THOUSAND)
TABLE 706 DENMARK PLASTIC COMPOUNDING MARKET, BY MANUFACTURING PROCESS, 2018-2032 (KILO TONS)
TABLE 707 DENMARK EXTRUSION IN PLASTIC COMPOUNDING MARKET, BY TYPE, 2018-2032 (USD THOUSAND)
TABLE 708 DENMARK EXTRUSION IN PLASTIC COMPOUNDING MARKET, BY PELLETIZING SYSTEM, 2018-2032 (USD THOUSAND)
TABLE 709 DENMARK INJECTION MOLDING BASED COMPOUNDING IN PLASTIC COMPOUNDING MARKET, BY PELLETIZING SYSTEM, 2018-2032 (USD THOUSAND)
TABLE 710 DENMARK COMPACTION/PRESSING IN PLASTIC COMPOUNDING MARKET, BY PELLETIZING SYSTEM, 2018-2032 (USD THOUSAND)
TABLE 711 DENMARK KNEADER/BANBURY MIXING IN PLASTIC COMPOUNDING MARKET, BY PELLETIZING SYSTEM, 2018-2032 (USD THOUSAND)
TABLE 712 DENMARK PLASTIC COMPOUNDING MARKET, BY PROPERTIES, 2018-2032 (USD THOUSAND)
TABLE 713 DENMARK PLASTIC COMPOUNDING MARKET, BY APPLICATION, 2018-2032 (USD THOUSAND)
TABLE 714 DENMARK PLASTIC COMPOUNDING MARKET, BY APPLICATION, 2018-2032 (KILO TONS)
TABLE 715 DENMARK AUTOMOTIVE IN PLASTIC COMPOUNDING MARKET, BY CATEGORY, 2018-2032 (USD THOUSAND)
TABLE 716 DENMARK INTERIOR COMPONENTS IN PLASTIC COMPOUNDING MARKET, BY TYPE, 2018-2032 (USD THOUSAND)
TABLE 717 DENMARK EXTERIOR BODY PARTS IN PLASTIC COMPOUNDING MARKET, BY TYPE, 2018-2032 (USD THOUSAND)
TABLE 718 DENMARK UNDER-THE-HOOD APPLICATIONS IN PLASTIC COMPOUNDING MARKET, BY TYPE, 2018-2032 (USD THOUSAND)
TABLE 719 DENMARK PACKAGING IN PLASTIC COMPOUNDING MARKET, BY CATEGORY, 2018-2032 (USD THOUSAND)
TABLE 720 DENMARK FOOD & BEVERAGE PACKAGING IN PLASTIC COMPOUNDING MARKET, BY TYPE, 2018-2032 (USD THOUSAND)
TABLE 721 DENMARK INDUSTRIAL PACKAGING IN PLASTIC COMPOUNDING MARKET, BY TYPE, 2018-2032 (USD THOUSAND)
TABLE 722 DENMARK CONSUMER GOODS PACKAGING IN PLASTIC COMPOUNDING MARKET, BY TYPE, 2018-2032 (USD THOUSAND)
TABLE 723 DENMARK BUILDING & CONSTRUCTION IN PLASTIC COMPOUNDING MARKET, BY CATEGORY, 2018-2032 (USD THOUSAND)
TABLE 724 DENMARK ELECTRICAL & ELECTRONICS IN PLASTIC COMPOUNDING MARKET, BY CATEGORY, 2018-2032 (USD THOUSAND)
TABLE 725 DENMARK MEDICAL DEVICES IN PLASTIC COMPOUNDING MARKET, BY CATEGORY, 2018-2032 (USD THOUSAND)
TABLE 726 DENMARK FURNITURE IN PLASTIC COMPOUNDING MARKET, BY CATEGORY, 2018-2032 (USD THOUSAND)
TABLE 727 DENMARK ENERGY AND POWER IN PLASTIC COMPOUNDING MARKET, BY CATEGORY, 2018-2032 (USD THOUSAND)
TABLE 728 DENMARK AEROSPACE AND DEFENSE IN PLASTIC COMPOUNDING MARKET, BY CATEGORY, 2018-2032 (USD THOUSAND)
TABLE 729 SWEDEN PLASTIC COMPOUNDING MARKET, BY POLYMER TYPE, 2018-2032 (USD THOUSAND)
TABLE 730 SWEDEN PLASTIC COMPOUNDING MARKET, BY POLYMER TYPE, 2018-2032 (KILO TONS)
TABLE 731 SWEDEN THERMOPLASTICS IN PLASTIC COMPOUNDING MARKET, BY TYPE, 2018-2032 (USD THOUSAND)
TABLE 732 SWEDEN POLYETHYLENE (PE) IN PLASTIC COMPOUNDING MARKET, BY TYPE, 2018-2032 (USD THOUSAND)
TABLE 733 SWEDEN ENGINEERING PLASTICS IN PLASTIC COMPOUNDING MARKET, BY TYPE, 2018-2032 (USD THOUSAND)
TABLE 734 SWEDEN THERMOSETTING PLASTICS IN PLASTIC COMPOUNDING MARKET, BY TYPE, 2018-2032 (USD THOUSAND)
TABLE 735 SWEDEN BIOPLASTICS IN PLASTIC COMPOUNDING MARKET, BY TYPE, 2018-2032 (USD THOUSAND)
TABLE 736 SWEDEN PLASTIC COMPOUNDING MARKET, BY FILLER TYPE, 2018-2032 (USD THOUSAND)
TABLE 737 SWEDEN MINERAL FILLERS IN PLASTIC COMPOUNDING MARKET, BY TYPE, 2018-2032 (USD THOUSAND)
TABLE 738 SWEDEN REINFORCEMENTS IN PLASTIC COMPOUNDING MARKET, BY TYPE, 2018-2032 (USD THOUSAND)
TABLE 739 SWEDEN ADDITIVES IN PLASTIC COMPOUNDING MARKET, BY TYPE, 2018-2032 (USD THOUSAND)
TABLE 740 SWEDEN PLASTIC COMPOUNDING MARKET, BY MANUFACTURING PROCESS, 2018-2032 (USD THOUSAND)
TABLE 741 SWEDEN PLASTIC COMPOUNDING MARKET, BY MANUFACTURING PROCESS, 2018-2032 (KILO TONS)
TABLE 742 SWEDEN EXTRUSION IN PLASTIC COMPOUNDING MARKET, BY TYPE, 2018-2032 (USD THOUSAND)
TABLE 743 SWEDEN EXTRUSION IN PLASTIC COMPOUNDING MARKET, BY PELLETIZING SYSTEM, 2018-2032 (USD THOUSAND)
TABLE 744 SWEDEN INJECTION MOLDING BASED COMPOUNDING IN PLASTIC COMPOUNDING MARKET, BY PELLETIZING SYSTEM, 2018-2032 (USD THOUSAND)
TABLE 745 SWEDEN COMPACTION/PRESSING IN PLASTIC COMPOUNDING MARKET, BY PELLETIZING SYSTEM, 2018-2032 (USD THOUSAND)
TABLE 746 SWEDEN KNEADER/BANBURY MIXING IN PLASTIC COMPOUNDING MARKET, BY PELLETIZING SYSTEM, 2018-2032 (USD THOUSAND)
TABLE 747 SWEDEN PLASTIC COMPOUNDING MARKET, BY PROPERTIES, 2018-2032 (USD THOUSAND)
TABLE 748 SWEDEN PLASTIC COMPOUNDING MARKET, BY APPLICATION, 2018-2032 (USD THOUSAND)
TABLE 749 SWEDEN PLASTIC COMPOUNDING MARKET, BY APPLICATION, 2018-2032 (KILO TONS)
TABLE 750 SWEDEN AUTOMOTIVE IN PLASTIC COMPOUNDING MARKET, BY CATEGORY, 2018-2032 (USD THOUSAND)
TABLE 751 SWEDEN INTERIOR COMPONENTS IN PLASTIC COMPOUNDING MARKET, BY TYPE, 2018-2032 (USD THOUSAND)
TABLE 752 SWEDEN EXTERIOR BODY PARTS IN PLASTIC COMPOUNDING MARKET, BY TYPE, 2018-2032 (USD THOUSAND)
TABLE 753 SWEDEN UNDER-THE-HOOD APPLICATIONS IN PLASTIC COMPOUNDING MARKET, BY TYPE, 2018-2032 (USD THOUSAND)
TABLE 754 SWEDEN PACKAGING IN PLASTIC COMPOUNDING MARKET, BY CATEGORY, 2018-2032 (USD THOUSAND)
TABLE 755 SWEDEN FOOD & BEVERAGE PACKAGING IN PLASTIC COMPOUNDING MARKET, BY TYPE, 2018-2032 (USD THOUSAND)
TABLE 756 SWEDEN INDUSTRIAL PACKAGING IN PLASTIC COMPOUNDING MARKET, BY TYPE, 2018-2032 (USD THOUSAND)
TABLE 757 SWEDEN CONSUMER GOODS PACKAGING IN PLASTIC COMPOUNDING MARKET, BY TYPE, 2018-2032 (USD THOUSAND)
TABLE 758 SWEDEN BUILDING & CONSTRUCTION IN PLASTIC COMPOUNDING MARKET, BY CATEGORY, 2018-2032 (USD THOUSAND)
TABLE 759 SWEDEN ELECTRICAL & ELECTRONICS IN PLASTIC COMPOUNDING MARKET, BY CATEGORY, 2018-2032 (USD THOUSAND)
TABLE 760 SWEDEN MEDICAL DEVICES IN PLASTIC COMPOUNDING MARKET, BY CATEGORY, 2018-2032 (USD THOUSAND)
TABLE 761 SWEDEN FURNITURE IN PLASTIC COMPOUNDING MARKET, BY CATEGORY, 2018-2032 (USD THOUSAND)
TABLE 762 SWEDEN ENERGY AND POWER IN PLASTIC COMPOUNDING MARKET, BY CATEGORY, 2018-2032 (USD THOUSAND)
TABLE 763 SWEDEN AEROSPACE AND DEFENSE IN PLASTIC COMPOUNDING MARKET, BY CATEGORY, 2018-2032 (USD THOUSAND)
TABLE 764 REST OF EUROPE PLASTIC COMPOUNDING MARKET, BY POLYMER TYPE, 2018-2032 (USD THOUSAND)
TABLE 765 REST OF EUROPE PLASTIC COMPOUNDING MARKET, BY POLYMER TYPE, 2018-2032 (KILO TONS)
TABLE 766 ASIA-PACIFIC PLASTIC COMPOUNDING MARKET, BY COUNTRY, 2018-2032 (USD THOUSAND)
TABLE 767 ASIA-PACIFIC PLASTIC COMPOUNDING MARKET, BY COUNTRY, 2018-2032 (KILO TONS)
TABLE 768 ASIA-PACIFIC PLASTIC COMPOUNDING MARKET, BY POLYMER TYPE, 2018-2032 (USD THOUSAND)
TABLE 769 ASIA-PACIFIC PLASTIC COMPOUNDING MARKET, BY POLYMER TYPE, 2018-2032 (KILO TONS)
TABLE 770 ASIA-PACIFIC THERMOPLASTICS IN PLASTIC COMPOUNDING MARKET, BY TYPE, 2018-2032 (USD THOUSAND)
TABLE 771 ASIA-PACIFIC POLYETHYLENE (PE) IN PLASTIC COMPOUNDING MARKET, BY TYPE, 2018-2032 (USD THOUSAND)
TABLE 772 ASIA-PACIFIC ENGINEERING PLASTICS IN PLASTIC COMPOUNDING MARKET, BY TYPE, 2018-2032 (USD THOUSAND)
TABLE 773 ASIA-PACIFIC THERMOSETTING PLASTICS IN PLASTIC COMPOUNDING MARKET, BY TYPE, 2018-2032 (USD THOUSAND)
TABLE 774 ASIA-PACIFIC BIOPLASTICS IN PLASTIC COMPOUNDING MARKET, BY TYPE, 2018-2032 (USD THOUSAND)
TABLE 775 ASIA-PACIFIC PLASTIC COMPOUNDING MARKET, BY FILLER TYPE, 2018-2032 (USD THOUSAND)
TABLE 776 ASIA-PACIFIC MINERAL FILLERS IN PLASTIC COMPOUNDING MARKET, BY TYPE, 2018-2032 (USD THOUSAND)
TABLE 777 ASIA-PACIFIC REINFORCEMENTS IN PLASTIC COMPOUNDING MARKET, BY TYPE, 2018-2032 (USD THOUSAND)
TABLE 778 ASIA-PACIFIC ADDITIVES IN PLASTIC COMPOUNDING MARKET, BY TYPE, 2018-2032 (USD THOUSAND)
TABLE 779 ASIA-PACIFIC PLASTIC COMPOUNDING MARKET, BY MANUFACTURING PROCESS, 2018-2032 (USD THOUSAND)
TABLE 780 ASIA-PACIFIC PLASTIC COMPOUNDING MARKET, BY MANUFACTURING PROCESS, 2018-2032 (KILO TONS)
TABLE 781 ASIA-PACIFIC EXTRUSION IN PLASTIC COMPOUNDING MARKET, BY TYPE, 2018-2032 (USD THOUSAND)
TABLE 782 ASIA-PACIFIC EXTRUSION IN PLASTIC COMPOUNDING MARKET, BY PELLETIZING SYSTEM, 2018-2032 (USD THOUSAND)
TABLE 783 ASIA-PACIFIC INJECTION MOLDING BASED COMPOUNDING IN PLASTIC COMPOUNDING MARKET, BY PELLETIZING SYSTEM, 2018-2032 (USD THOUSAND)
TABLE 784 ASIA-PACIFIC COMPACTION/PRESSING IN PLASTIC COMPOUNDING MARKET, BY PELLETIZING SYSTEM, 2018-2032 (USD THOUSAND)
TABLE 785 ASIA-PACIFIC KNEADER/BANBURY MIXING IN PLASTIC COMPOUNDING MARKET, BY PELLETIZING SYSTEM, 2018-2032 (USD THOUSAND)
TABLE 786 ASIA-PACIFIC PLASTIC COMPOUNDING MARKET, BY PROPERTIES, 2018-2032 (USD THOUSAND)
TABLE 787 ASIA-PACIFIC PLASTIC COMPOUNDING MARKET, BY APPLICATION, 2018-2032 (USD THOUSAND)
TABLE 788 ASIA-PACIFIC PLASTIC COMPOUNDING MARKET, BY APPLICATION, 2018-2032 (KILO TONS)
TABLE 789 ASIA-PACIFIC AUTOMOTIVE IN PLASTIC COMPOUNDING MARKET, BY CATEGORY, 2018-2032 (USD THOUSAND)
TABLE 790 ASIA-PACIFIC INTERIOR COMPONENTS IN PLASTIC COMPOUNDING MARKET, BY TYPE, 2018-2032 (USD THOUSAND)
TABLE 791 ASIA-PACIFIC EXTERIOR BODY PARTS IN PLASTIC COMPOUNDING MARKET, BY TYPE, 2018-2032 (USD THOUSAND)
TABLE 792 ASIA-PACIFIC UNDER-THE-HOOD APPLICATIONS IN PLASTIC COMPOUNDING MARKET, BY TYPE, 2018-2032 (USD THOUSAND)
TABLE 793 ASIA-PACIFIC PACKAGING IN PLASTIC COMPOUNDING MARKET, BY CATEGORY, 2018-2032 (USD THOUSAND)
TABLE 794 ASIA-PACIFIC FOOD & BEVERAGE PACKAGING IN PLASTIC COMPOUNDING MARKET, BY TYPE, 2018-2032 (USD THOUSAND)
TABLE 795 ASIA-PACIFIC INDUSTRIAL PACKAGING IN PLASTIC COMPOUNDING MARKET, BY TYPE, 2018-2032 (USD THOUSAND)
TABLE 796 ASIA-PACIFIC CONSUMER GOODS PACKAGING IN PLASTIC COMPOUNDING MARKET, BY TYPE, 2018-2032 (USD THOUSAND)
TABLE 797 ASIA-PACIFIC BUILDING & CONSTRUCTION IN PLASTIC COMPOUNDING MARKET, BY CATEGORY, 2018-2032 (USD THOUSAND)
TABLE 798 ASIA-PACIFIC ELECTRICAL & ELECTRONICS IN PLASTIC COMPOUNDING MARKET, BY CATEGORY, 2018-2032 (USD THOUSAND)
TABLE 799 ASIA-PACIFIC MEDICAL DEVICES IN PLASTIC COMPOUNDING MARKET, BY CATEGORY, 2018-2032 (USD THOUSAND)
TABLE 800 ASIA-PACIFIC FURNITURE IN PLASTIC COMPOUNDING MARKET, BY CATEGORY, 2018-2032 (USD THOUSAND)
TABLE 801 ASIA-PACIFIC ENERGY AND POWER IN PLASTIC COMPOUNDING MARKET, BY CATEGORY, 2018-2032 (USD THOUSAND)
TABLE 802 ASIA-PACIFIC AEROSPACE AND DEFENSE IN PLASTIC COMPOUNDING MARKET, BY CATEGORY, 2018-2032 (USD THOUSAND)
TABLE 803 CHINA PLASTIC COMPOUNDING MARKET, BY POLYMER TYPE, 2018-2032 (USD THOUSAND)
TABLE 804 CHINA PLASTIC COMPOUNDING MARKET, BY POLYMER TYPE, 2018-2032 (KILO TONS)
TABLE 805 CHINA THERMOPLASTICS IN PLASTIC COMPOUNDING MARKET, BY TYPE, 2018-2032 (USD THOUSAND)
TABLE 806 CHINA POLYETHYLENE (PE) IN PLASTIC COMPOUNDING MARKET, BY TYPE, 2018-2032 (USD THOUSAND)
TABLE 807 CHINA ENGINEERING PLASTICS IN PLASTIC COMPOUNDING MARKET, BY TYPE, 2018-2032 (USD THOUSAND)
TABLE 808 CHINA THERMOSETTING PLASTICS IN PLASTIC COMPOUNDING MARKET, BY TYPE, 2018-2032 (USD THOUSAND)
TABLE 809 CHINA BIOPLASTICS IN PLASTIC COMPOUNDING MARKET, BY TYPE, 2018-2032 (USD THOUSAND)
TABLE 810 CHINA PLASTIC COMPOUNDING MARKET, BY FILLER TYPE, 2018-2032 (USD THOUSAND)
TABLE 811 CHINA MINERAL FILLERS IN PLASTIC COMPOUNDING MARKET, BY TYPE, 2018-2032 (USD THOUSAND)
TABLE 812 CHINA REINFORCEMENTS IN PLASTIC COMPOUNDING MARKET, BY TYPE, 2018-2032 (USD THOUSAND)
TABLE 813 CHINA ADDITIVES IN PLASTIC COMPOUNDING MARKET, BY TYPE, 2018-2032 (USD THOUSAND)
TABLE 814 CHINA PLASTIC COMPOUNDING MARKET, BY MANUFACTURING PROCESS, 2018-2032 (USD THOUSAND)
TABLE 815 CHINA PLASTIC COMPOUNDING MARKET, BY MANUFACTURING PROCESS, 2018-2032 (KILO TONS)
TABLE 816 CHINA EXTRUSION IN PLASTIC COMPOUNDING MARKET, BY TYPE, 2018-2032 (USD THOUSAND)
TABLE 817 CHINA EXTRUSION IN PLASTIC COMPOUNDING MARKET, BY PELLETIZING SYSTEM, 2018-2032 (USD THOUSAND)
TABLE 818 CHINA INJECTION MOLDING BASED COMPOUNDING IN PLASTIC COMPOUNDING MARKET, BY PELLETIZING SYSTEM, 2018-2032 (USD THOUSAND)
TABLE 819 CHINA COMPACTION/PRESSING IN PLASTIC COMPOUNDING MARKET, BY PELLETIZING SYSTEM, 2018-2032 (USD THOUSAND)
TABLE 820 CHINA KNEADER/BANBURY MIXING IN PLASTIC COMPOUNDING MARKET, BY PELLETIZING SYSTEM, 2018-2032 (USD THOUSAND)
TABLE 821 CHINA PLASTIC COMPOUNDING MARKET, BY PROPERTIES, 2018-2032 (USD THOUSAND)
TABLE 822 CHINA PLASTIC COMPOUNDING MARKET, BY APPLICATION, 2018-2032 (USD THOUSAND)
TABLE 823 CHINA PLASTIC COMPOUNDING MARKET, BY APPLICATION, 2018-2032 (KILO TONS)
TABLE 824 CHINA AUTOMOTIVE IN PLASTIC COMPOUNDING MARKET, BY CATEGORY, 2018-2032 (USD THOUSAND)
TABLE 825 CHINA INTERIOR COMPONENTS IN PLASTIC COMPOUNDING MARKET, BY TYPE, 2018-2032 (USD THOUSAND)
TABLE 826 CHINA EXTERIOR BODY PARTS IN PLASTIC COMPOUNDING MARKET, BY TYPE, 2018-2032 (USD THOUSAND)
TABLE 827 CHINA UNDER-THE-HOOD APPLICATIONS IN PLASTIC COMPOUNDING MARKET, BY TYPE, 2018-2032 (USD THOUSAND)
TABLE 828 CHINA PACKAGING IN PLASTIC COMPOUNDING MARKET, BY CATEGORY, 2018-2032 (USD THOUSAND)
TABLE 829 CHINA FOOD & BEVERAGE PACKAGING IN PLASTIC COMPOUNDING MARKET, BY TYPE, 2018-2032 (USD THOUSAND)
TABLE 830 CHINA INDUSTRIAL PACKAGING IN PLASTIC COMPOUNDING MARKET, BY TYPE, 2018-2032 (USD THOUSAND)
TABLE 831 CHINA CONSUMER GOODS PACKAGING IN PLASTIC COMPOUNDING MARKET, BY TYPE, 2018-2032 (USD THOUSAND)
TABLE 832 CHINA BUILDING & CONSTRUCTION IN PLASTIC COMPOUNDING MARKET, BY CATEGORY, 2018-2032 (USD THOUSAND)
TABLE 833 CHINA ELECTRICAL & ELECTRONICS IN PLASTIC COMPOUNDING MARKET, BY CATEGORY, 2018-2032 (USD THOUSAND)
TABLE 834 CHINA MEDICAL DEVICES IN PLASTIC COMPOUNDING MARKET, BY CATEGORY, 2018-2032 (USD THOUSAND)
TABLE 835 CHINA FURNITURE IN PLASTIC COMPOUNDING MARKET, BY CATEGORY, 2018-2032 (USD THOUSAND)
TABLE 836 CHINA ENERGY AND POWER IN PLASTIC COMPOUNDING MARKET, BY CATEGORY, 2018-2032 (USD THOUSAND)
TABLE 837 CHINA AEROSPACE AND DEFENSE IN PLASTIC COMPOUNDING MARKET, BY CATEGORY, 2018-2032 (USD THOUSAND)
TABLE 838 INDIA PLASTIC COMPOUNDING MARKET, BY POLYMER TYPE, 2018-2032 (USD THOUSAND)
TABLE 839 INDIA PLASTIC COMPOUNDING MARKET, BY POLYMER TYPE, 2018-2032 (KILO TONS)
TABLE 840 INDIA THERMOPLASTICS IN PLASTIC COMPOUNDING MARKET, BY TYPE, 2018-2032 (USD THOUSAND)
TABLE 841 INDIA POLYETHYLENE (PE) IN PLASTIC COMPOUNDING MARKET, BY TYPE, 2018-2032 (USD THOUSAND)
TABLE 842 INDIA ENGINEERING PLASTICS IN PLASTIC COMPOUNDING MARKET, BY TYPE, 2018-2032 (USD THOUSAND)
TABLE 843 INDIA THERMOSETTING PLASTICS IN PLASTIC COMPOUNDING MARKET, BY TYPE, 2018-2032 (USD THOUSAND)
TABLE 844 INDIA BIOPLASTICS IN PLASTIC COMPOUNDING MARKET, BY TYPE, 2018-2032 (USD THOUSAND)
TABLE 845 INDIA PLASTIC COMPOUNDING MARKET, BY FILLER TYPE, 2018-2032 (USD THOUSAND)
TABLE 846 INDIA MINERAL FILLERS IN PLASTIC COMPOUNDING MARKET, BY TYPE, 2018-2032 (USD THOUSAND)
TABLE 847 INDIA REINFORCEMENTS IN PLASTIC COMPOUNDING MARKET, BY TYPE, 2018-2032 (USD THOUSAND)
TABLE 848 INDIA ADDITIVES IN PLASTIC COMPOUNDING MARKET, BY TYPE, 2018-2032 (USD THOUSAND)
TABLE 849 INDIA PLASTIC COMPOUNDING MARKET, BY MANUFACTURING PROCESS, 2018-2032 (USD THOUSAND)
TABLE 850 INDIA PLASTIC COMPOUNDING MARKET, BY MANUFACTURING PROCESS, 2018-2032 (KILO TONS)
TABLE 851 INDIA EXTRUSION IN PLASTIC COMPOUNDING MARKET, BY TYPE, 2018-2032 (USD THOUSAND)
TABLE 852 INDIA EXTRUSION IN PLASTIC COMPOUNDING MARKET, BY PELLETIZING SYSTEM, 2018-2032 (USD THOUSAND)
TABLE 853 INDIA INJECTION MOLDING BASED COMPOUNDING IN PLASTIC COMPOUNDING MARKET, BY PELLETIZING SYSTEM, 2018-2032 (USD THOUSAND)
TABLE 854 INDIA COMPACTION/PRESSING IN PLASTIC COMPOUNDING MARKET, BY PELLETIZING SYSTEM, 2018-2032 (USD THOUSAND)
TABLE 855 INDIA KNEADER/BANBURY MIXING IN PLASTIC COMPOUNDING MARKET, BY PELLETIZING SYSTEM, 2018-2032 (USD THOUSAND)
TABLE 856 INDIA PLASTIC COMPOUNDING MARKET, BY PROPERTIES, 2018-2032 (USD THOUSAND)
TABLE 857 INDIA PLASTIC COMPOUNDING MARKET, BY APPLICATION, 2018-2032 (USD THOUSAND)
TABLE 858 INDIA PLASTIC COMPOUNDING MARKET, BY APPLICATION, 2018-2032 (KILO TONS)
TABLE 859 INDIA AUTOMOTIVE IN PLASTIC COMPOUNDING MARKET, BY CATEGORY, 2018-2032 (USD THOUSAND)
TABLE 860 INDIA INTERIOR COMPONENTS IN PLASTIC COMPOUNDING MARKET, BY TYPE, 2018-2032 (USD THOUSAND)
TABLE 861 INDIA EXTERIOR BODY PARTS IN PLASTIC COMPOUNDING MARKET, BY TYPE, 2018-2032 (USD THOUSAND)
TABLE 862 INDIA UNDER-THE-HOOD APPLICATIONS IN PLASTIC COMPOUNDING MARKET, BY TYPE, 2018-2032 (USD THOUSAND)
TABLE 863 INDIA PACKAGING IN PLASTIC COMPOUNDING MARKET, BY CATEGORY, 2018-2032 (USD THOUSAND)
TABLE 864 INDIA FOOD & BEVERAGE PACKAGING IN PLASTIC COMPOUNDING MARKET, BY TYPE, 2018-2032 (USD THOUSAND)
TABLE 865 INDIA INDUSTRIAL PACKAGING IN PLASTIC COMPOUNDING MARKET, BY TYPE, 2018-2032 (USD THOUSAND)
TABLE 866 INDIA CONSUMER GOODS PACKAGING IN PLASTIC COMPOUNDING MARKET, BY TYPE, 2018-2032 (USD THOUSAND)
TABLE 867 INDIA BUILDING & CONSTRUCTION IN PLASTIC COMPOUNDING MARKET, BY CATEGORY, 2018-2032 (USD THOUSAND)
TABLE 868 INDIA ELECTRICAL & ELECTRONICS IN PLASTIC COMPOUNDING MARKET, BY CATEGORY, 2018-2032 (USD THOUSAND)
TABLE 869 INDIA MEDICAL DEVICES IN PLASTIC COMPOUNDING MARKET, BY CATEGORY, 2018-2032 (USD THOUSAND)
TABLE 870 INDIA FURNITURE IN PLASTIC COMPOUNDING MARKET, BY CATEGORY, 2018-2032 (USD THOUSAND)
TABLE 871 INDIA ENERGY AND POWER IN PLASTIC COMPOUNDING MARKET, BY CATEGORY, 2018-2032 (USD THOUSAND)
TABLE 872 INDIA AEROSPACE AND DEFENSE IN PLASTIC COMPOUNDING MARKET, BY CATEGORY, 2018-2032 (USD THOUSAND)
TABLE 873 JAPAN PLASTIC COMPOUNDING MARKET, BY POLYMER TYPE, 2018-2032 (USD THOUSAND)
TABLE 874 JAPAN PLASTIC COMPOUNDING MARKET, BY POLYMER TYPE, 2018-2032 (KILO TONS)
TABLE 875 JAPAN THERMOPLASTICS IN PLASTIC COMPOUNDING MARKET, BY TYPE, 2018-2032 (USD THOUSAND)
TABLE 876 JAPAN POLYETHYLENE (PE) IN PLASTIC COMPOUNDING MARKET, BY TYPE, 2018-2032 (USD THOUSAND)
TABLE 877 JAPAN ENGINEERING PLASTICS IN PLASTIC COMPOUNDING MARKET, BY TYPE, 2018-2032 (USD THOUSAND)
TABLE 878 JAPAN THERMOSETTING PLASTICS IN PLASTIC COMPOUNDING MARKET, BY TYPE, 2018-2032 (USD THOUSAND)
TABLE 879 JAPAN BIOPLASTICS IN PLASTIC COMPOUNDING MARKET, BY TYPE, 2018-2032 (USD THOUSAND)
TABLE 880 JAPAN PLASTIC COMPOUNDING MARKET, BY FILLER TYPE, 2018-2032 (USD THOUSAND)
TABLE 881 JAPAN MINERAL FILLERS IN PLASTIC COMPOUNDING MARKET, BY TYPE, 2018-2032 (USD THOUSAND)
TABLE 882 JAPAN REINFORCEMENTS IN PLASTIC COMPOUNDING MARKET, BY TYPE, 2018-2032 (USD THOUSAND)
TABLE 883 JAPAN ADDITIVES IN PLASTIC COMPOUNDING MARKET, BY TYPE, 2018-2032 (USD THOUSAND)
TABLE 884 JAPAN PLASTIC COMPOUNDING MARKET, BY MANUFACTURING PROCESS, 2018-2032 (USD THOUSAND)
TABLE 885 JAPAN PLASTIC COMPOUNDING MARKET, BY MANUFACTURING PROCESS, 2018-2032 (KILO TONS)
TABLE 886 JAPAN EXTRUSION IN PLASTIC COMPOUNDING MARKET, BY TYPE, 2018-2032 (USD THOUSAND)
TABLE 887 JAPAN EXTRUSION IN PLASTIC COMPOUNDING MARKET, BY PELLETIZING SYSTEM, 2018-2032 (USD THOUSAND)
TABLE 888 JAPAN INJECTION MOLDING BASED COMPOUNDING IN PLASTIC COMPOUNDING MARKET, BY PELLETIZING SYSTEM, 2018-2032 (USD THOUSAND)
TABLE 889 JAPAN COMPACTION/PRESSING IN PLASTIC COMPOUNDING MARKET, BY PELLETIZING SYSTEM, 2018-2032 (USD THOUSAND)
TABLE 890 JAPAN KNEADER/BANBURY MIXING IN PLASTIC COMPOUNDING MARKET, BY PELLETIZING SYSTEM, 2018-2032 (USD THOUSAND)
TABLE 891 JAPAN PLASTIC COMPOUNDING MARKET, BY PROPERTIES, 2018-2032 (USD THOUSAND)
TABLE 892 JAPAN PLASTIC COMPOUNDING MARKET, BY APPLICATION, 2018-2032 (USD THOUSAND)
TABLE 893 JAPAN PLASTIC COMPOUNDING MARKET, BY APPLICATION, 2018-2032 (KILO TONS)
TABLE 894 JAPAN AUTOMOTIVE IN PLASTIC COMPOUNDING MARKET, BY CATEGORY, 2018-2032 (USD THOUSAND)
TABLE 895 JAPAN INTERIOR COMPONENTS IN PLASTIC COMPOUNDING MARKET, BY TYPE, 2018-2032 (USD THOUSAND)
TABLE 896 JAPAN EXTERIOR BODY PARTS IN PLASTIC COMPOUNDING MARKET, BY TYPE, 2018-2032 (USD THOUSAND)
TABLE 897 JAPAN UNDER-THE-HOOD APPLICATIONS IN PLASTIC COMPOUNDING MARKET, BY TYPE, 2018-2032 (USD THOUSAND)
TABLE 898 JAPAN PACKAGING IN PLASTIC COMPOUNDING MARKET, BY CATEGORY, 2018-2032 (USD THOUSAND)
TABLE 899 JAPAN FOOD & BEVERAGE PACKAGING IN PLASTIC COMPOUNDING MARKET, BY TYPE, 2018-2032 (USD THOUSAND)
TABLE 900 JAPAN INDUSTRIAL PACKAGING IN PLASTIC COMPOUNDING MARKET, BY TYPE, 2018-2032 (USD THOUSAND)
TABLE 901 JAPAN CONSUMER GOODS PACKAGING IN PLASTIC COMPOUNDING MARKET, BY TYPE, 2018-2032 (USD THOUSAND)
TABLE 902 JAPAN BUILDING & CONSTRUCTION IN PLASTIC COMPOUNDING MARKET, BY CATEGORY, 2018-2032 (USD THOUSAND)
TABLE 903 JAPAN ELECTRICAL & ELECTRONICS IN PLASTIC COMPOUNDING MARKET, BY CATEGORY, 2018-2032 (USD THOUSAND)
TABLE 904 JAPAN MEDICAL DEVICES IN PLASTIC COMPOUNDING MARKET, BY CATEGORY, 2018-2032 (USD THOUSAND)
TABLE 905 JAPAN FURNITURE IN PLASTIC COMPOUNDING MARKET, BY CATEGORY, 2018-2032 (USD THOUSAND)
TABLE 906 JAPAN ENERGY AND POWER IN PLASTIC COMPOUNDING MARKET, BY CATEGORY, 2018-2032 (USD THOUSAND)
TABLE 907 JAPAN AEROSPACE AND DEFENSE IN PLASTIC COMPOUNDING MARKET, BY CATEGORY, 2018-2032 (USD THOUSAND)
TABLE 908 SOUTH KOREA PLASTIC COMPOUNDING MARKET, BY POLYMER TYPE, 2018-2032 (USD THOUSAND)
TABLE 909 SOUTH KOREA PLASTIC COMPOUNDING MARKET, BY POLYMER TYPE, 2018-2032 (KILO TONS)
TABLE 910 SOUTH KOREA THERMOPLASTICS IN PLASTIC COMPOUNDING MARKET, BY TYPE, 2018-2032 (USD THOUSAND)
TABLE 911 SOUTH KOREA POLYETHYLENE (PE) IN PLASTIC COMPOUNDING MARKET, BY TYPE, 2018-2032 (USD THOUSAND)
TABLE 912 SOUTH KOREA ENGINEERING PLASTICS IN PLASTIC COMPOUNDING MARKET, BY TYPE, 2018-2032 (USD THOUSAND)
TABLE 913 SOUTH KOREA THERMOSETTING PLASTICS IN PLASTIC COMPOUNDING MARKET, BY TYPE, 2018-2032 (USD THOUSAND)
TABLE 914 SOUTH KOREA BIOPLASTICS IN PLASTIC COMPOUNDING MARKET, BY TYPE, 2018-2032 (USD THOUSAND)
TABLE 915 SOUTH KOREA PLASTIC COMPOUNDING MARKET, BY FILLER TYPE, 2018-2032 (USD THOUSAND)
TABLE 916 SOUTH KOREA MINERAL FILLERS IN PLASTIC COMPOUNDING MARKET, BY TYPE, 2018-2032 (USD THOUSAND)
TABLE 917 SOUTH KOREA REINFORCEMENTS IN PLASTIC COMPOUNDING MARKET, BY TYPE, 2018-2032 (USD THOUSAND)
TABLE 918 SOUTH KOREA ADDITIVES IN PLASTIC COMPOUNDING MARKET, BY TYPE, 2018-2032 (USD THOUSAND)
TABLE 919 SOUTH KOREA PLASTIC COMPOUNDING MARKET, BY MANUFACTURING PROCESS, 2018-2032 (USD THOUSAND)
TABLE 920 SOUTH KOREA PLASTIC COMPOUNDING MARKET, BY MANUFACTURING PROCESS, 2018-2032 (KILO TONS)
TABLE 921 SOUTH KOREA EXTRUSION IN PLASTIC COMPOUNDING MARKET, BY TYPE, 2018-2032 (USD THOUSAND)
TABLE 922 SOUTH KOREA EXTRUSION IN PLASTIC COMPOUNDING MARKET, BY PELLETIZING SYSTEM, 2018-2032 (USD THOUSAND)
TABLE 923 SOUTH KOREA INJECTION MOLDING BASED COMPOUNDING IN PLASTIC COMPOUNDING MARKET, BY PELLETIZING SYSTEM, 2018-2032 (USD THOUSAND)
TABLE 924 SOUTH KOREA COMPACTION/PRESSING IN PLASTIC COMPOUNDING MARKET, BY PELLETIZING SYSTEM, 2018-2032 (USD THOUSAND)
TABLE 925 SOUTH KOREA KNEADER/BANBURY MIXING IN PLASTIC COMPOUNDING MARKET, BY PELLETIZING SYSTEM, 2018-2032 (USD THOUSAND)
TABLE 926 SOUTH KOREA PLASTIC COMPOUNDING MARKET, BY PROPERTIES, 2018-2032 (USD THOUSAND)
TABLE 927 SOUTH KOREA PLASTIC COMPOUNDING MARKET, BY APPLICATION, 2018-2032 (USD THOUSAND)
TABLE 928 SOUTH KOREA PLASTIC COMPOUNDING MARKET, BY APPLICATION, 2018-2032 (KILO TONS)
TABLE 929 SOUTH KOREA AUTOMOTIVE IN PLASTIC COMPOUNDING MARKET, BY CATEGORY, 2018-2032 (USD THOUSAND)
TABLE 930 SOUTH KOREA INTERIOR COMPONENTS IN PLASTIC COMPOUNDING MARKET, BY TYPE, 2018-2032 (USD THOUSAND)
TABLE 931 SOUTH KOREA EXTERIOR BODY PARTS IN PLASTIC COMPOUNDING MARKET, BY TYPE, 2018-2032 (USD THOUSAND)
TABLE 932 SOUTH KOREA UNDER-THE-HOOD APPLICATIONS IN PLASTIC COMPOUNDING MARKET, BY TYPE, 2018-2032 (USD THOUSAND)
TABLE 933 SOUTH KOREA PACKAGING IN PLASTIC COMPOUNDING MARKET, BY CATEGORY, 2018-2032 (USD THOUSAND)
TABLE 934 SOUTH KOREA FOOD & BEVERAGE PACKAGING IN PLASTIC COMPOUNDING MARKET, BY TYPE, 2018-2032 (USD THOUSAND)
TABLE 935 SOUTH KOREA INDUSTRIAL PACKAGING IN PLASTIC COMPOUNDING MARKET, BY TYPE, 2018-2032 (USD THOUSAND)
TABLE 936 SOUTH KOREA CONSUMER GOODS PACKAGING IN PLASTIC COMPOUNDING MARKET, BY TYPE, 2018-2032 (USD THOUSAND)
TABLE 937 SOUTH KOREA BUILDING & CONSTRUCTION IN PLASTIC COMPOUNDING MARKET, BY CATEGORY, 2018-2032 (USD THOUSAND)
TABLE 938 SOUTH KOREA ELECTRICAL & ELECTRONICS IN PLASTIC COMPOUNDING MARKET, BY CATEGORY, 2018-2032 (USD THOUSAND)
TABLE 939 SOUTH KOREA MEDICAL DEVICES IN PLASTIC COMPOUNDING MARKET, BY CATEGORY, 2018-2032 (USD THOUSAND)
TABLE 940 SOUTH KOREA FURNITURE IN PLASTIC COMPOUNDING MARKET, BY CATEGORY, 2018-2032 (USD THOUSAND)
TABLE 941 SOUTH KOREA ENERGY AND POWER IN PLASTIC COMPOUNDING MARKET, BY CATEGORY, 2018-2032 (USD THOUSAND)
TABLE 942 SOUTH KOREA AEROSPACE AND DEFENSE IN PLASTIC COMPOUNDING MARKET, BY CATEGORY, 2018-2032 (USD THOUSAND)
TABLE 943 THAILAND PLASTIC COMPOUNDING MARKET, BY POLYMER TYPE, 2018-2032 (USD THOUSAND)
TABLE 944 THAILAND PLASTIC COMPOUNDING MARKET, BY POLYMER TYPE, 2018-2032 (KILO TONS)
TABLE 945 THAILAND THERMOPLASTICS IN PLASTIC COMPOUNDING MARKET, BY TYPE, 2018-2032 (USD THOUSAND)
TABLE 946 THAILAND POLYETHYLENE (PE) IN PLASTIC COMPOUNDING MARKET, BY TYPE, 2018-2032 (USD THOUSAND)
TABLE 947 THAILAND ENGINEERING PLASTICS IN PLASTIC COMPOUNDING MARKET, BY TYPE, 2018-2032 (USD THOUSAND)
TABLE 948 THAILAND THERMOSETTING PLASTICS IN PLASTIC COMPOUNDING MARKET, BY TYPE, 2018-2032 (USD THOUSAND)
TABLE 949 THAILAND BIOPLASTICS IN PLASTIC COMPOUNDING MARKET, BY TYPE, 2018-2032 (USD THOUSAND)
TABLE 950 THAILAND PLASTIC COMPOUNDING MARKET, BY FILLER TYPE, 2018-2032 (USD THOUSAND)
TABLE 951 THAILAND MINERAL FILLERS IN PLASTIC COMPOUNDING MARKET, BY TYPE, 2018-2032 (USD THOUSAND)
TABLE 952 THAILAND REINFORCEMENTS IN PLASTIC COMPOUNDING MARKET, BY TYPE, 2018-2032 (USD THOUSAND)
TABLE 953 THAILAND ADDITIVES IN PLASTIC COMPOUNDING MARKET, BY TYPE, 2018-2032 (USD THOUSAND)
TABLE 954 THAILAND PLASTIC COMPOUNDING MARKET, BY MANUFACTURING PROCESS, 2018-2032 (USD THOUSAND)
TABLE 955 THAILAND PLASTIC COMPOUNDING MARKET, BY MANUFACTURING PROCESS, 2018-2032 (KILO TONS)
TABLE 956 THAILAND EXTRUSION IN PLASTIC COMPOUNDING MARKET, BY TYPE, 2018-2032 (USD THOUSAND)
TABLE 957 THAILAND EXTRUSION IN PLASTIC COMPOUNDING MARKET, BY PELLETIZING SYSTEM, 2018-2032 (USD THOUSAND)
TABLE 958 THAILAND INJECTION MOLDING BASED COMPOUNDING IN PLASTIC COMPOUNDING MARKET, BY PELLETIZING SYSTEM, 2018-2032 (USD THOUSAND)
TABLE 959 THAILAND COMPACTION/PRESSING IN PLASTIC COMPOUNDING MARKET, BY PELLETIZING SYSTEM, 2018-2032 (USD THOUSAND)
TABLE 960 THAILAND KNEADER/BANBURY MIXING IN PLASTIC COMPOUNDING MARKET, BY PELLETIZING SYSTEM, 2018-2032 (USD THOUSAND)
TABLE 961 THAILAND PLASTIC COMPOUNDING MARKET, BY PROPERTIES, 2018-2032 (USD THOUSAND)
TABLE 962 THAILAND PLASTIC COMPOUNDING MARKET, BY APPLICATION, 2018-2032 (USD THOUSAND)
TABLE 963 THAILAND PLASTIC COMPOUNDING MARKET, BY APPLICATION, 2018-2032 (KILO TONS)
TABLE 964 THAILAND AUTOMOTIVE IN PLASTIC COMPOUNDING MARKET, BY CATEGORY, 2018-2032 (USD THOUSAND)
TABLE 965 THAILAND INTERIOR COMPONENTS IN PLASTIC COMPOUNDING MARKET, BY TYPE, 2018-2032 (USD THOUSAND)
TABLE 966 THAILAND EXTERIOR BODY PARTS IN PLASTIC COMPOUNDING MARKET, BY TYPE, 2018-2032 (USD THOUSAND)
TABLE 967 THAILAND UNDER-THE-HOOD APPLICATIONS IN PLASTIC COMPOUNDING MARKET, BY TYPE, 2018-2032 (USD THOUSAND)
TABLE 968 THAILAND PACKAGING IN PLASTIC COMPOUNDING MARKET, BY CATEGORY, 2018-2032 (USD THOUSAND)
TABLE 969 THAILAND FOOD & BEVERAGE PACKAGING IN PLASTIC COMPOUNDING MARKET, BY TYPE, 2018-2032 (USD THOUSAND)
TABLE 970 THAILAND INDUSTRIAL PACKAGING IN PLASTIC COMPOUNDING MARKET, BY TYPE, 2018-2032 (USD THOUSAND)
TABLE 971 THAILAND CONSUMER GOODS PACKAGING IN PLASTIC COMPOUNDING MARKET, BY TYPE, 2018-2032 (USD THOUSAND)
TABLE 972 THAILAND BUILDING & CONSTRUCTION IN PLASTIC COMPOUNDING MARKET, BY CATEGORY, 2018-2032 (USD THOUSAND)
TABLE 973 THAILAND ELECTRICAL & ELECTRONICS IN PLASTIC COMPOUNDING MARKET, BY CATEGORY, 2018-2032 (USD THOUSAND)
TABLE 974 THAILAND MEDICAL DEVICES IN PLASTIC COMPOUNDING MARKET, BY CATEGORY, 2018-2032 (USD THOUSAND)
TABLE 975 THAILAND FURNITURE IN PLASTIC COMPOUNDING MARKET, BY CATEGORY, 2018-2032 (USD THOUSAND)
TABLE 976 THAILAND ENERGY AND POWER IN PLASTIC COMPOUNDING MARKET, BY CATEGORY, 2018-2032 (USD THOUSAND)
TABLE 977 THAILAND AEROSPACE AND DEFENSE IN PLASTIC COMPOUNDING MARKET, BY CATEGORY, 2018-2032 (USD THOUSAND)
TABLE 978 SINGAPORE PLASTIC COMPOUNDING MARKET, BY POLYMER TYPE, 2018-2032 (USD THOUSAND)
TABLE 979 SINGAPORE PLASTIC COMPOUNDING MARKET, BY POLYMER TYPE, 2018-2032 (KILO TONS)
TABLE 980 SINGAPORE THERMOPLASTICS IN PLASTIC COMPOUNDING MARKET, BY TYPE, 2018-2032 (USD THOUSAND)
TABLE 981 SINGAPORE POLYETHYLENE (PE) IN PLASTIC COMPOUNDING MARKET, BY TYPE, 2018-2032 (USD THOUSAND)
TABLE 982 SINGAPORE ENGINEERING PLASTICS IN PLASTIC COMPOUNDING MARKET, BY TYPE, 2018-2032 (USD THOUSAND)
TABLE 983 SINGAPORE THERMOSETTING PLASTICS IN PLASTIC COMPOUNDING MARKET, BY TYPE, 2018-2032 (USD THOUSAND)
TABLE 984 SINGAPORE BIOPLASTICS IN PLASTIC COMPOUNDING MARKET, BY TYPE, 2018-2032 (USD THOUSAND)
TABLE 985 SINGAPORE PLASTIC COMPOUNDING MARKET, BY FILLER TYPE, 2018-2032 (USD THOUSAND)
TABLE 986 SINGAPORE MINERAL FILLERS IN PLASTIC COMPOUNDING MARKET, BY TYPE, 2018-2032 (USD THOUSAND)
TABLE 987 SINGAPORE REINFORCEMENTS IN PLASTIC COMPOUNDING MARKET, BY TYPE, 2018-2032 (USD THOUSAND)
TABLE 988 SINGAPORE ADDITIVES IN PLASTIC COMPOUNDING MARKET, BY TYPE, 2018-2032 (USD THOUSAND)
TABLE 989 SINGAPORE PLASTIC COMPOUNDING MARKET, BY MANUFACTURING PROCESS, 2018-2032 (USD THOUSAND)
TABLE 990 SINGAPORE PLASTIC COMPOUNDING MARKET, BY MANUFACTURING PROCESS, 2018-2032 (KILO TONS)
TABLE 991 SINGAPORE EXTRUSION IN PLASTIC COMPOUNDING MARKET, BY TYPE, 2018-2032 (USD THOUSAND)
TABLE 992 SINGAPORE EXTRUSION IN PLASTIC COMPOUNDING MARKET, BY PELLETIZING SYSTEM, 2018-2032 (USD THOUSAND)
TABLE 993 SINGAPORE INJECTION MOLDING BASED COMPOUNDING IN PLASTIC COMPOUNDING MARKET, BY PELLETIZING SYSTEM, 2018-2032 (USD THOUSAND)
TABLE 994 SINGAPORE COMPACTION/PRESSING IN PLASTIC COMPOUNDING MARKET, BY PELLETIZING SYSTEM, 2018-2032 (USD THOUSAND)
TABLE 995 SINGAPORE KNEADER/BANBURY MIXING IN PLASTIC COMPOUNDING MARKET, BY PELLETIZING SYSTEM, 2018-2032 (USD THOUSAND)
TABLE 996 SINGAPORE PLASTIC COMPOUNDING MARKET, BY PROPERTIES, 2018-2032 (USD THOUSAND)
TABLE 997 SINGAPORE PLASTIC COMPOUNDING MARKET, BY APPLICATION, 2018-2032 (USD THOUSAND)
TABLE 998 SINGAPORE PLASTIC COMPOUNDING MARKET, BY APPLICATION, 2018-2032 (KILO TONS)
TABLE 999 SINGAPORE AUTOMOTIVE IN PLASTIC COMPOUNDING MARKET, BY CATEGORY, 2018-2032 (USD THOUSAND)
TABLE 1000 SINGAPORE INTERIOR COMPONENTS IN PLASTIC COMPOUNDING MARKET, BY TYPE, 2018-2032 (USD THOUSAND)
TABLE 1001 SINGAPORE EXTERIOR BODY PARTS IN PLASTIC COMPOUNDING MARKET, BY TYPE, 2018-2032 (USD THOUSAND)
TABLE 1002 SINGAPORE UNDER-THE-HOOD APPLICATIONS IN PLASTIC COMPOUNDING MARKET, BY TYPE, 2018-2032 (USD THOUSAND)
TABLE 1003 SINGAPORE PACKAGING IN PLASTIC COMPOUNDING MARKET, BY CATEGORY, 2018-2032 (USD THOUSAND)
TABLE 1004 SINGAPORE FOOD & BEVERAGE PACKAGING IN PLASTIC COMPOUNDING MARKET, BY TYPE, 2018-2032 (USD THOUSAND)
TABLE 1005 SINGAPORE INDUSTRIAL PACKAGING IN PLASTIC COMPOUNDING MARKET, BY TYPE, 2018-2032 (USD THOUSAND)
TABLE 1006 SINGAPORE CONSUMER GOODS PACKAGING IN PLASTIC COMPOUNDING MARKET, BY TYPE, 2018-2032 (USD THOUSAND)
TABLE 1007 SINGAPORE BUILDING & CONSTRUCTION IN PLASTIC COMPOUNDING MARKET, BY CATEGORY, 2018-2032 (USD THOUSAND)
TABLE 1008 SINGAPORE ELECTRICAL & ELECTRONICS IN PLASTIC COMPOUNDING MARKET, BY CATEGORY, 2018-2032 (USD THOUSAND)
TABLE 1009 SINGAPORE MEDICAL DEVICES IN PLASTIC COMPOUNDING MARKET, BY CATEGORY, 2018-2032 (USD THOUSAND)
TABLE 1010 SINGAPORE FURNITURE IN PLASTIC COMPOUNDING MARKET, BY CATEGORY, 2018-2032 (USD THOUSAND)
TABLE 1011 SINGAPORE ENERGY AND POWER IN PLASTIC COMPOUNDING MARKET, BY CATEGORY, 2018-2032 (USD THOUSAND)
TABLE 1012 SINGAPORE AEROSPACE AND DEFENSE IN PLASTIC COMPOUNDING MARKET, BY CATEGORY, 2018-2032 (USD THOUSAND)
TABLE 1013 INDONESIA PLASTIC COMPOUNDING MARKET, BY POLYMER TYPE, 2018-2032 (USD THOUSAND)
TABLE 1014 INDONESIA PLASTIC COMPOUNDING MARKET, BY POLYMER TYPE, 2018-2032 (KILO TONS)
TABLE 1015 INDONESIA THERMOPLASTICS IN PLASTIC COMPOUNDING MARKET, BY TYPE, 2018-2032 (USD THOUSAND)
TABLE 1016 INDONESIA POLYETHYLENE (PE) IN PLASTIC COMPOUNDING MARKET, BY TYPE, 2018-2032 (USD THOUSAND)
TABLE 1017 INDONESIA ENGINEERING PLASTICS IN PLASTIC COMPOUNDING MARKET, BY TYPE, 2018-2032 (USD THOUSAND)
TABLE 1018 INDONESIA THERMOSETTING PLASTICS IN PLASTIC COMPOUNDING MARKET, BY TYPE, 2018-2032 (USD THOUSAND)
TABLE 1019 INDONESIA BIOPLASTICS IN PLASTIC COMPOUNDING MARKET, BY TYPE, 2018-2032 (USD THOUSAND)
TABLE 1020 INDONESIA PLASTIC COMPOUNDING MARKET, BY FILLER TYPE, 2018-2032 (USD THOUSAND)
TABLE 1021 INDONESIA MINERAL FILLERS IN PLASTIC COMPOUNDING MARKET, BY TYPE, 2018-2032 (USD THOUSAND)
TABLE 1022 INDONESIA REINFORCEMENTS IN PLASTIC COMPOUNDING MARKET, BY TYPE, 2018-2032 (USD THOUSAND)
TABLE 1023 INDONESIA ADDITIVES IN PLASTIC COMPOUNDING MARKET, BY TYPE, 2018-2032 (USD THOUSAND)
TABLE 1024 INDONESIA PLASTIC COMPOUNDING MARKET, BY MANUFACTURING PROCESS, 2018-2032 (USD THOUSAND)
TABLE 1025 INDONESIA PLASTIC COMPOUNDING MARKET, BY MANUFACTURING PROCESS, 2018-2032 (KILO TONS)
TABLE 1026 INDONESIA EXTRUSION IN PLASTIC COMPOUNDING MARKET, BY TYPE, 2018-2032 (USD THOUSAND)
TABLE 1027 INDONESIA EXTRUSION IN PLASTIC COMPOUNDING MARKET, BY PELLETIZING SYSTEM, 2018-2032 (USD THOUSAND)
TABLE 1028 INDONESIA INJECTION MOLDING BASED COMPOUNDING IN PLASTIC COMPOUNDING MARKET, BY PELLETIZING SYSTEM, 2018-2032 (USD THOUSAND)
TABLE 1029 INDONESIA COMPACTION/PRESSING IN PLASTIC COMPOUNDING MARKET, BY PELLETIZING SYSTEM, 2018-2032 (USD THOUSAND)
TABLE 1030 INDONESIA KNEADER/BANBURY MIXING IN PLASTIC COMPOUNDING MARKET, BY PELLETIZING SYSTEM, 2018-2032 (USD THOUSAND)
TABLE 1031 INDONESIA PLASTIC COMPOUNDING MARKET, BY PROPERTIES, 2018-2032 (USD THOUSAND)
TABLE 1032 INDONESIA PLASTIC COMPOUNDING MARKET, BY APPLICATION, 2018-2032 (USD THOUSAND)
TABLE 1033 INDONESIA PLASTIC COMPOUNDING MARKET, BY APPLICATION, 2018-2032 (KILO TONS)
TABLE 1034 INDONESIA AUTOMOTIVE IN PLASTIC COMPOUNDING MARKET, BY CATEGORY, 2018-2032 (USD THOUSAND)
TABLE 1035 INDONESIA INTERIOR COMPONENTS IN PLASTIC COMPOUNDING MARKET, BY TYPE, 2018-2032 (USD THOUSAND)
TABLE 1036 INDONESIA EXTERIOR BODY PARTS IN PLASTIC COMPOUNDING MARKET, BY TYPE, 2018-2032 (USD THOUSAND)
TABLE 1037 INDONESIA UNDER-THE-HOOD APPLICATIONS IN PLASTIC COMPOUNDING MARKET, BY TYPE, 2018-2032 (USD THOUSAND)
TABLE 1038 INDONESIA PACKAGING IN PLASTIC COMPOUNDING MARKET, BY CATEGORY, 2018-2032 (USD THOUSAND)
TABLE 1039 INDONESIA FOOD & BEVERAGE PACKAGING IN PLASTIC COMPOUNDING MARKET, BY TYPE, 2018-2032 (USD THOUSAND)
TABLE 1040 INDONESIA INDUSTRIAL PACKAGING IN PLASTIC COMPOUNDING MARKET, BY TYPE, 2018-2032 (USD THOUSAND)
TABLE 1041 INDONESIA CONSUMER GOODS PACKAGING IN PLASTIC COMPOUNDING MARKET, BY TYPE, 2018-2032 (USD THOUSAND)
TABLE 1042 INDONESIA BUILDING & CONSTRUCTION IN PLASTIC COMPOUNDING MARKET, BY CATEGORY, 2018-2032 (USD THOUSAND)
TABLE 1043 INDONESIA ELECTRICAL & ELECTRONICS IN PLASTIC COMPOUNDING MARKET, BY CATEGORY, 2018-2032 (USD THOUSAND)
TABLE 1044 INDONESIA MEDICAL DEVICES IN PLASTIC COMPOUNDING MARKET, BY CATEGORY, 2018-2032 (USD THOUSAND)
TABLE 1045 INDONESIA FURNITURE IN PLASTIC COMPOUNDING MARKET, BY CATEGORY, 2018-2032 (USD THOUSAND)
TABLE 1046 INDONESIA ENERGY AND POWER IN PLASTIC COMPOUNDING MARKET, BY CATEGORY, 2018-2032 (USD THOUSAND)
TABLE 1047 INDONESIA AEROSPACE AND DEFENSE IN PLASTIC COMPOUNDING MARKET, BY CATEGORY, 2018-2032 (USD THOUSAND)
TABLE 1048 AUSTRALIA PLASTIC COMPOUNDING MARKET, BY POLYMER TYPE, 2018-2032 (USD THOUSAND)
TABLE 1049 AUSTRALIA PLASTIC COMPOUNDING MARKET, BY POLYMER TYPE, 2018-2032 (KILO TONS)
TABLE 1050 AUSTRALIA THERMOPLASTICS IN PLASTIC COMPOUNDING MARKET, BY TYPE, 2018-2032 (USD THOUSAND)
TABLE 1051 AUSTRALIA POLYETHYLENE (PE) IN PLASTIC COMPOUNDING MARKET, BY TYPE, 2018-2032 (USD THOUSAND)
TABLE 1052 AUSTRALIA ENGINEERING PLASTICS IN PLASTIC COMPOUNDING MARKET, BY TYPE, 2018-2032 (USD THOUSAND)
TABLE 1053 AUSTRALIA THERMOSETTING PLASTICS IN PLASTIC COMPOUNDING MARKET, BY TYPE, 2018-2032 (USD THOUSAND)
TABLE 1054 AUSTRALIA BIOPLASTICS IN PLASTIC COMPOUNDING MARKET, BY TYPE, 2018-2032 (USD THOUSAND)
TABLE 1055 AUSTRALIA PLASTIC COMPOUNDING MARKET, BY FILLER TYPE, 2018-2032 (USD THOUSAND)
TABLE 1056 AUSTRALIA MINERAL FILLERS IN PLASTIC COMPOUNDING MARKET, BY TYPE, 2018-2032 (USD THOUSAND)
TABLE 1057 AUSTRALIA REINFORCEMENTS IN PLASTIC COMPOUNDING MARKET, BY TYPE, 2018-2032 (USD THOUSAND)
TABLE 1058 AUSTRALIA ADDITIVES IN PLASTIC COMPOUNDING MARKET, BY TYPE, 2018-2032 (USD THOUSAND)
TABLE 1059 AUSTRALIA PLASTIC COMPOUNDING MARKET, BY MANUFACTURING PROCESS, 2018-2032 (USD THOUSAND)
TABLE 1060 AUSTRALIA PLASTIC COMPOUNDING MARKET, BY MANUFACTURING PROCESS, 2018-2032 (KILO TONS)
TABLE 1061 AUSTRALIA EXTRUSION IN PLASTIC COMPOUNDING MARKET, BY TYPE, 2018-2032 (USD THOUSAND)
TABLE 1062 AUSTRALIA EXTRUSION IN PLASTIC COMPOUNDING MARKET, BY PELLETIZING SYSTEM, 2018-2032 (USD THOUSAND)
TABLE 1063 AUSTRALIA INJECTION MOLDING BASED COMPOUNDING IN PLASTIC COMPOUNDING MARKET, BY PELLETIZING SYSTEM, 2018-2032 (USD THOUSAND)
TABLE 1064 AUSTRALIA COMPACTION/PRESSING IN PLASTIC COMPOUNDING MARKET, BY PELLETIZING SYSTEM, 2018-2032 (USD THOUSAND)
TABLE 1065 AUSTRALIA KNEADER/BANBURY MIXING IN PLASTIC COMPOUNDING MARKET, BY PELLETIZING SYSTEM, 2018-2032 (USD THOUSAND)
TABLE 1066 AUSTRALIA PLASTIC COMPOUNDING MARKET, BY PROPERTIES, 2018-2032 (USD THOUSAND)
TABLE 1067 AUSTRALIA PLASTIC COMPOUNDING MARKET, BY APPLICATION, 2018-2032 (USD THOUSAND)
TABLE 1068 AUSTRALIA PLASTIC COMPOUNDING MARKET, BY APPLICATION, 2018-2032 (KILO TONS)
TABLE 1069 AUSTRALIA AUTOMOTIVE IN PLASTIC COMPOUNDING MARKET, BY CATEGORY, 2018-2032 (USD THOUSAND)
TABLE 1070 AUSTRALIA INTERIOR COMPONENTS IN PLASTIC COMPOUNDING MARKET, BY TYPE, 2018-2032 (USD THOUSAND)
TABLE 1071 AUSTRALIA EXTERIOR BODY PARTS IN PLASTIC COMPOUNDING MARKET, BY TYPE, 2018-2032 (USD THOUSAND)
TABLE 1072 AUSTRALIA UNDER-THE-HOOD APPLICATIONS IN PLASTIC COMPOUNDING MARKET, BY TYPE, 2018-2032 (USD THOUSAND)
TABLE 1073 AUSTRALIA PACKAGING IN PLASTIC COMPOUNDING MARKET, BY CATEGORY, 2018-2032 (USD THOUSAND)
TABLE 1074 AUSTRALIA FOOD & BEVERAGE PACKAGING IN PLASTIC COMPOUNDING MARKET, BY TYPE, 2018-2032 (USD THOUSAND)
TABLE 1075 AUSTRALIA INDUSTRIAL PACKAGING IN PLASTIC COMPOUNDING MARKET, BY TYPE, 2018-2032 (USD THOUSAND)
TABLE 1076 AUSTRALIA CONSUMER GOODS PACKAGING IN PLASTIC COMPOUNDING MARKET, BY TYPE, 2018-2032 (USD THOUSAND)
TABLE 1077 AUSTRALIA BUILDING & CONSTRUCTION IN PLASTIC COMPOUNDING MARKET, BY CATEGORY, 2018-2032 (USD THOUSAND)
TABLE 1078 AUSTRALIA ELECTRICAL & ELECTRONICS IN PLASTIC COMPOUNDING MARKET, BY CATEGORY, 2018-2032 (USD THOUSAND)
TABLE 1079 AUSTRALIA MEDICAL DEVICES IN PLASTIC COMPOUNDING MARKET, BY CATEGORY, 2018-2032 (USD THOUSAND)
TABLE 1080 AUSTRALIA FURNITURE IN PLASTIC COMPOUNDING MARKET, BY CATEGORY, 2018-2032 (USD THOUSAND)
TABLE 1081 AUSTRALIA ENERGY AND POWER IN PLASTIC COMPOUNDING MARKET, BY CATEGORY, 2018-2032 (USD THOUSAND)
TABLE 1082 AUSTRALIA AEROSPACE AND DEFENSE IN PLASTIC COMPOUNDING MARKET, BY CATEGORY, 2018-2032 (USD THOUSAND)
TABLE 1083 NEW ZEALAND PLASTIC COMPOUNDING MARKET, BY POLYMER TYPE, 2018-2032 (USD THOUSAND)
TABLE 1084 NEW ZEALAND PLASTIC COMPOUNDING MARKET, BY POLYMER TYPE, 2018-2032 (KILO TONS)
TABLE 1085 NEW ZEALAND THERMOPLASTICS IN PLASTIC COMPOUNDING MARKET, BY TYPE, 2018-2032 (USD THOUSAND)
TABLE 1086 NEW ZEALAND POLYETHYLENE (PE) IN PLASTIC COMPOUNDING MARKET, BY TYPE, 2018-2032 (USD THOUSAND)
TABLE 1087 NEW ZEALAND ENGINEERING PLASTICS IN PLASTIC COMPOUNDING MARKET, BY TYPE, 2018-2032 (USD THOUSAND)
TABLE 1088 NEW ZEALAND THERMOSETTING PLASTICS IN PLASTIC COMPOUNDING MARKET, BY TYPE, 2018-2032 (USD THOUSAND)
TABLE 1089 NEW ZEALAND BIOPLASTICS IN PLASTIC COMPOUNDING MARKET, BY TYPE, 2018-2032 (USD THOUSAND)
TABLE 1090 NEW ZEALAND PLASTIC COMPOUNDING MARKET, BY FILLER TYPE, 2018-2032 (USD THOUSAND)
TABLE 1091 NEW ZEALAND MINERAL FILLERS IN PLASTIC COMPOUNDING MARKET, BY TYPE, 2018-2032 (USD THOUSAND)
TABLE 1092 NEW ZEALAND REINFORCEMENTS IN PLASTIC COMPOUNDING MARKET, BY TYPE, 2018-2032 (USD THOUSAND)
TABLE 1093 NEW ZEALAND ADDITIVES IN PLASTIC COMPOUNDING MARKET, BY TYPE, 2018-2032 (USD THOUSAND)
TABLE 1094 NEW ZEALAND PLASTIC COMPOUNDING MARKET, BY MANUFACTURING PROCESS, 2018-2032 (USD THOUSAND)
TABLE 1095 NEW ZEALAND PLASTIC COMPOUNDING MARKET, BY MANUFACTURING PROCESS, 2018-2032 (KILO TONS)
TABLE 1096 NEW ZEALAND EXTRUSION IN PLASTIC COMPOUNDING MARKET, BY TYPE, 2018-2032 (USD THOUSAND)
TABLE 1097 NEW ZEALAND EXTRUSION IN PLASTIC COMPOUNDING MARKET, BY PELLETIZING SYSTEM, 2018-2032 (USD THOUSAND)
TABLE 1098 NEW ZEALAND INJECTION MOLDING BASED COMPOUNDING IN PLASTIC COMPOUNDING MARKET, BY PELLETIZING SYSTEM, 2018-2032 (USD THOUSAND)
TABLE 1099 NEW ZEALAND COMPACTION/PRESSING IN PLASTIC COMPOUNDING MARKET, BY PELLETIZING SYSTEM, 2018-2032 (USD THOUSAND)
TABLE 1100 NEW ZEALAND KNEADER/BANBURY MIXING IN PLASTIC COMPOUNDING MARKET, BY PELLETIZING SYSTEM, 2018-2032 (USD THOUSAND)
TABLE 1101 NEW ZEALAND PLASTIC COMPOUNDING MARKET, BY PROPERTIES, 2018-2032 (USD THOUSAND)
TABLE 1102 NEW ZEALAND PLASTIC COMPOUNDING MARKET, BY APPLICATION, 2018-2032 (USD THOUSAND)
TABLE 1103 NEW ZEALAND PLASTIC COMPOUNDING MARKET, BY APPLICATION, 2018-2032 (KILO TONS)
TABLE 1104 NEW ZEALAND AUTOMOTIVE IN PLASTIC COMPOUNDING MARKET, BY CATEGORY, 2018-2032 (USD THOUSAND)
TABLE 1105 NEW ZEALAND INTERIOR COMPONENTS IN PLASTIC COMPOUNDING MARKET, BY TYPE, 2018-2032 (USD THOUSAND)
TABLE 1106 NEW ZEALAND EXTERIOR BODY PARTS IN PLASTIC COMPOUNDING MARKET, BY TYPE, 2018-2032 (USD THOUSAND)
TABLE 1107 NEW ZEALAND UNDER-THE-HOOD APPLICATIONS IN PLASTIC COMPOUNDING MARKET, BY TYPE, 2018-2032 (USD THOUSAND)
TABLE 1108 NEW ZEALAND PACKAGING IN PLASTIC COMPOUNDING MARKET, BY CATEGORY, 2018-2032 (USD THOUSAND)
TABLE 1109 NEW ZEALAND FOOD & BEVERAGE PACKAGING IN PLASTIC COMPOUNDING MARKET, BY TYPE, 2018-2032 (USD THOUSAND)
TABLE 1110 NEW ZEALAND INDUSTRIAL PACKAGING IN PLASTIC COMPOUNDING MARKET, BY TYPE, 2018-2032 (USD THOUSAND)
TABLE 1111 NEW ZEALAND CONSUMER GOODS PACKAGING IN PLASTIC COMPOUNDING MARKET, BY TYPE, 2018-2032 (USD THOUSAND)
TABLE 1112 NEW ZEALAND BUILDING & CONSTRUCTION IN PLASTIC COMPOUNDING MARKET, BY CATEGORY, 2018-2032 (USD THOUSAND)
TABLE 1113 NEW ZEALAND ELECTRICAL & ELECTRONICS IN PLASTIC COMPOUNDING MARKET, BY CATEGORY, 2018-2032 (USD THOUSAND)
TABLE 1114 NEW ZEALAND MEDICAL DEVICES IN PLASTIC COMPOUNDING MARKET, BY CATEGORY, 2018-2032 (USD THOUSAND)
TABLE 1115 NEW ZEALAND FURNITURE IN PLASTIC COMPOUNDING MARKET, BY CATEGORY, 2018-2032 (USD THOUSAND)
TABLE 1116 NEW ZEALAND ENERGY AND POWER IN PLASTIC COMPOUNDING MARKET, BY CATEGORY, 2018-2032 (USD THOUSAND)
TABLE 1117 NEW ZEALAND AEROSPACE AND DEFENSE IN PLASTIC COMPOUNDING MARKET, BY CATEGORY, 2018-2032 (USD THOUSAND)
TABLE 1118 PHILIPPINES PLASTIC COMPOUNDING MARKET, BY POLYMER TYPE, 2018-2032 (USD THOUSAND)
TABLE 1119 PHILIPPINES PLASTIC COMPOUNDING MARKET, BY POLYMER TYPE, 2018-2032 (KILO TONS)
TABLE 1120 PHILIPPINES THERMOPLASTICS IN PLASTIC COMPOUNDING MARKET, BY TYPE, 2018-2032 (USD THOUSAND)
TABLE 1121 PHILIPPINES POLYETHYLENE (PE) IN PLASTIC COMPOUNDING MARKET, BY TYPE, 2018-2032 (USD THOUSAND)
TABLE 1122 PHILIPPINES ENGINEERING PLASTICS IN PLASTIC COMPOUNDING MARKET, BY TYPE, 2018-2032 (USD THOUSAND)
TABLE 1123 PHILIPPINES THERMOSETTING PLASTICS IN PLASTIC COMPOUNDING MARKET, BY TYPE, 2018-2032 (USD THOUSAND)
TABLE 1124 PHILIPPINES BIOPLASTICS IN PLASTIC COMPOUNDING MARKET, BY TYPE, 2018-2032 (USD THOUSAND)
TABLE 1125 PHILIPPINES PLASTIC COMPOUNDING MARKET, BY FILLER TYPE, 2018-2032 (USD THOUSAND)
TABLE 1126 PHILIPPINES MINERAL FILLERS IN PLASTIC COMPOUNDING MARKET, BY TYPE, 2018-2032 (USD THOUSAND)
TABLE 1127 PHILIPPINES REINFORCEMENTS IN PLASTIC COMPOUNDING MARKET, BY TYPE, 2018-2032 (USD THOUSAND)
TABLE 1128 PHILIPPINES ADDITIVES IN PLASTIC COMPOUNDING MARKET, BY TYPE, 2018-2032 (USD THOUSAND)
TABLE 1129 PHILIPPINES PLASTIC COMPOUNDING MARKET, BY MANUFACTURING PROCESS, 2018-2032 (USD THOUSAND)
TABLE 1130 PHILIPPINES PLASTIC COMPOUNDING MARKET, BY MANUFACTURING PROCESS, 2018-2032 (KILO TONS)
TABLE 1131 PHILIPPINES EXTRUSION IN PLASTIC COMPOUNDING MARKET, BY TYPE, 2018-2032 (USD THOUSAND)
TABLE 1132 PHILIPPINES EXTRUSION IN PLASTIC COMPOUNDING MARKET, BY PELLETIZING SYSTEM, 2018-2032 (USD THOUSAND)
TABLE 1133 PHILIPPINES INJECTION MOLDING BASED COMPOUNDING IN PLASTIC COMPOUNDING MARKET, BY PELLETIZING SYSTEM, 2018-2032 (USD THOUSAND)
TABLE 1134 PHILIPPINES COMPACTION/PRESSING IN PLASTIC COMPOUNDING MARKET, BY PELLETIZING SYSTEM, 2018-2032 (USD THOUSAND)
TABLE 1135 PHILIPPINES KNEADER/BANBURY MIXING IN PLASTIC COMPOUNDING MARKET, BY PELLETIZING SYSTEM, 2018-2032 (USD THOUSAND)
TABLE 1136 PHILIPPINES PLASTIC COMPOUNDING MARKET, BY PROPERTIES, 2018-2032 (USD THOUSAND)
TABLE 1137 PHILIPPINES PLASTIC COMPOUNDING MARKET, BY APPLICATION, 2018-2032 (USD THOUSAND)
TABLE 1138 PHILIPPINES PLASTIC COMPOUNDING MARKET, BY APPLICATION, 2018-2032 (KILO TONS)
TABLE 1139 PHILIPPINES AUTOMOTIVE IN PLASTIC COMPOUNDING MARKET, BY CATEGORY, 2018-2032 (USD THOUSAND)
TABLE 1140 PHILIPPINES INTERIOR COMPONENTS IN PLASTIC COMPOUNDING MARKET, BY TYPE, 2018-2032 (USD THOUSAND)
TABLE 1141 PHILIPPINES EXTERIOR BODY PARTS IN PLASTIC COMPOUNDING MARKET, BY TYPE, 2018-2032 (USD THOUSAND)
TABLE 1142 PHILIPPINES UNDER-THE-HOOD APPLICATIONS IN PLASTIC COMPOUNDING MARKET, BY TYPE, 2018-2032 (USD THOUSAND)
TABLE 1143 PHILIPPINES PACKAGING IN PLASTIC COMPOUNDING MARKET, BY CATEGORY, 2018-2032 (USD THOUSAND)
TABLE 1144 PHILIPPINES FOOD & BEVERAGE PACKAGING IN PLASTIC COMPOUNDING MARKET, BY TYPE, 2018-2032 (USD THOUSAND)
TABLE 1145 PHILIPPINES INDUSTRIAL PACKAGING IN PLASTIC COMPOUNDING MARKET, BY TYPE, 2018-2032 (USD THOUSAND)
TABLE 1146 PHILIPPINES CONSUMER GOODS PACKAGING IN PLASTIC COMPOUNDING MARKET, BY TYPE, 2018-2032 (USD THOUSAND)
TABLE 1147 PHILIPPINES BUILDING & CONSTRUCTION IN PLASTIC COMPOUNDING MARKET, BY CATEGORY, 2018-2032 (USD THOUSAND)
TABLE 1148 PHILIPPINES ELECTRICAL & ELECTRONICS IN PLASTIC COMPOUNDING MARKET, BY CATEGORY, 2018-2032 (USD THOUSAND)
TABLE 1149 PHILIPPINES MEDICAL DEVICES IN PLASTIC COMPOUNDING MARKET, BY CATEGORY, 2018-2032 (USD THOUSAND)
TABLE 1150 PHILIPPINES FURNITURE IN PLASTIC COMPOUNDING MARKET, BY CATEGORY, 2018-2032 (USD THOUSAND)
TABLE 1151 PHILIPPINES ENERGY AND POWER IN PLASTIC COMPOUNDING MARKET, BY CATEGORY, 2018-2032 (USD THOUSAND)
TABLE 1152 PHILIPPINES AEROSPACE AND DEFENSE IN PLASTIC COMPOUNDING MARKET, BY CATEGORY, 2018-2032 (USD THOUSAND)
TABLE 1153 MALAYSIA PLASTIC COMPOUNDING MARKET, BY POLYMER TYPE, 2018-2032 (USD THOUSAND)
TABLE 1154 MALAYSIA PLASTIC COMPOUNDING MARKET, BY POLYMER TYPE, 2018-2032 (KILO TONS)
TABLE 1155 MALAYSIA THERMOPLASTICS IN PLASTIC COMPOUNDING MARKET, BY TYPE, 2018-2032 (USD THOUSAND)
TABLE 1156 MALAYSIA POLYETHYLENE (PE) IN PLASTIC COMPOUNDING MARKET, BY TYPE, 2018-2032 (USD THOUSAND)
TABLE 1157 MALAYSIA ENGINEERING PLASTICS IN PLASTIC COMPOUNDING MARKET, BY TYPE, 2018-2032 (USD THOUSAND)
TABLE 1158 MALAYSIA THERMOSETTING PLASTICS IN PLASTIC COMPOUNDING MARKET, BY TYPE, 2018-2032 (USD THOUSAND)
TABLE 1159 MALAYSIA BIOPLASTICS IN PLASTIC COMPOUNDING MARKET, BY TYPE, 2018-2032 (USD THOUSAND)
TABLE 1160 MALAYSIA PLASTIC COMPOUNDING MARKET, BY FILLER TYPE, 2018-2032 (USD THOUSAND)
TABLE 1161 MALAYSIA MINERAL FILLERS IN PLASTIC COMPOUNDING MARKET, BY TYPE, 2018-2032 (USD THOUSAND)
TABLE 1162 MALAYSIA REINFORCEMENTS IN PLASTIC COMPOUNDING MARKET, BY TYPE, 2018-2032 (USD THOUSAND)
TABLE 1163 MALAYSIA ADDITIVES IN PLASTIC COMPOUNDING MARKET, BY TYPE, 2018-2032 (USD THOUSAND)
TABLE 1164 MALAYSIA PLASTIC COMPOUNDING MARKET, BY MANUFACTURING PROCESS, 2018-2032 (USD THOUSAND)
TABLE 1165 MALAYSIA PLASTIC COMPOUNDING MARKET, BY MANUFACTURING PROCESS, 2018-2032 (KILO TONS)
TABLE 1166 MALAYSIA EXTRUSION IN PLASTIC COMPOUNDING MARKET, BY TYPE, 2018-2032 (USD THOUSAND)
TABLE 1167 MALAYSIA EXTRUSION IN PLASTIC COMPOUNDING MARKET, BY PELLETIZING SYSTEM, 2018-2032 (USD THOUSAND)
TABLE 1168 MALAYSIA INJECTION MOLDING BASED COMPOUNDING IN PLASTIC COMPOUNDING MARKET, BY PELLETIZING SYSTEM, 2018-2032 (USD THOUSAND)
TABLE 1169 MALAYSIA COMPACTION/PRESSING IN PLASTIC COMPOUNDING MARKET, BY PELLETIZING SYSTEM, 2018-2032 (USD THOUSAND)
TABLE 1170 MALAYSIA KNEADER/BANBURY MIXING IN PLASTIC COMPOUNDING MARKET, BY PELLETIZING SYSTEM, 2018-2032 (USD THOUSAND)
TABLE 1171 MALAYSIA PLASTIC COMPOUNDING MARKET, BY PROPERTIES, 2018-2032 (USD THOUSAND)
TABLE 1172 MALAYSIA PLASTIC COMPOUNDING MARKET, BY APPLICATION, 2018-2032 (USD THOUSAND)
TABLE 1173 MALAYSIA PLASTIC COMPOUNDING MARKET, BY APPLICATION, 2018-2032 (KILO TONS)
TABLE 1174 MALAYSIA AUTOMOTIVE IN PLASTIC COMPOUNDING MARKET, BY CATEGORY, 2018-2032 (USD THOUSAND)
TABLE 1175 MALAYSIA INTERIOR COMPONENTS IN PLASTIC COMPOUNDING MARKET, BY TYPE, 2018-2032 (USD THOUSAND)
TABLE 1176 MALAYSIA EXTERIOR BODY PARTS IN PLASTIC COMPOUNDING MARKET, BY TYPE, 2018-2032 (USD THOUSAND)
TABLE 1177 MALAYSIA UNDER-THE-HOOD APPLICATIONS IN PLASTIC COMPOUNDING MARKET, BY TYPE, 2018-2032 (USD THOUSAND)
TABLE 1178 MALAYSIA PACKAGING IN PLASTIC COMPOUNDING MARKET, BY CATEGORY, 2018-2032 (USD THOUSAND)
TABLE 1179 MALAYSIA FOOD & BEVERAGE PACKAGING IN PLASTIC COMPOUNDING MARKET, BY TYPE, 2018-2032 (USD THOUSAND)
TABLE 1180 MALAYSIA INDUSTRIAL PACKAGING IN PLASTIC COMPOUNDING MARKET, BY TYPE, 2018-2032 (USD THOUSAND)
TABLE 1181 MALAYSIA CONSUMER GOODS PACKAGING IN PLASTIC COMPOUNDING MARKET, BY TYPE, 2018-2032 (USD THOUSAND)
TABLE 1182 MALAYSIA BUILDING & CONSTRUCTION IN PLASTIC COMPOUNDING MARKET, BY CATEGORY, 2018-2032 (USD THOUSAND)
TABLE 1183 MALAYSIA ELECTRICAL & ELECTRONICS IN PLASTIC COMPOUNDING MARKET, BY CATEGORY, 2018-2032 (USD THOUSAND)
TABLE 1184 MALAYSIA MEDICAL DEVICES IN PLASTIC COMPOUNDING MARKET, BY CATEGORY, 2018-2032 (USD THOUSAND)
TABLE 1185 MALAYSIA FURNITURE IN PLASTIC COMPOUNDING MARKET, BY CATEGORY, 2018-2032 (USD THOUSAND)
TABLE 1186 MALAYSIA ENERGY AND POWER IN PLASTIC COMPOUNDING MARKET, BY CATEGORY, 2018-2032 (USD THOUSAND)
TABLE 1187 MALAYSIA AEROSPACE AND DEFENSE IN PLASTIC COMPOUNDING MARKET, BY CATEGORY, 2018-2032 (USD THOUSAND)
TABLE 1188 TAIWAN PLASTIC COMPOUNDING MARKET, BY POLYMER TYPE, 2018-2032 (USD THOUSAND)
TABLE 1189 TAIWAN PLASTIC COMPOUNDING MARKET, BY POLYMER TYPE, 2018-2032 (KILO TONS)
TABLE 1190 TAIWAN THERMOPLASTICS IN PLASTIC COMPOUNDING MARKET, BY TYPE, 2018-2032 (USD THOUSAND)
TABLE 1191 TAIWAN POLYETHYLENE (PE) IN PLASTIC COMPOUNDING MARKET, BY TYPE, 2018-2032 (USD THOUSAND)
TABLE 1192 TAIWAN ENGINEERING PLASTICS IN PLASTIC COMPOUNDING MARKET, BY TYPE, 2018-2032 (USD THOUSAND)
TABLE 1193 TAIWAN THERMOSETTING PLASTICS IN PLASTIC COMPOUNDING MARKET, BY TYPE, 2018-2032 (USD THOUSAND)
TABLE 1194 TAIWAN BIOPLASTICS IN PLASTIC COMPOUNDING MARKET, BY TYPE, 2018-2032 (USD THOUSAND)
TABLE 1195 TAIWAN PLASTIC COMPOUNDING MARKET, BY FILLER TYPE, 2018-2032 (USD THOUSAND)
TABLE 1196 TAIWAN MINERAL FILLERS IN PLASTIC COMPOUNDING MARKET, BY TYPE, 2018-2032 (USD THOUSAND)
TABLE 1197 TAIWAN REINFORCEMENTS IN PLASTIC COMPOUNDING MARKET, BY TYPE, 2018-2032 (USD THOUSAND)
TABLE 1198 TAIWAN ADDITIVES IN PLASTIC COMPOUNDING MARKET, BY TYPE, 2018-2032 (USD THOUSAND)
TABLE 1199 TAIWAN PLASTIC COMPOUNDING MARKET, BY MANUFACTURING PROCESS, 2018-2032 (USD THOUSAND)
TABLE 1200 TAIWAN PLASTIC COMPOUNDING MARKET, BY MANUFACTURING PROCESS, 2018-2032 (KILO TONS)
TABLE 1201 TAIWAN EXTRUSION IN PLASTIC COMPOUNDING MARKET, BY TYPE, 2018-2032 (USD THOUSAND)
TABLE 1202 TAIWAN EXTRUSION IN PLASTIC COMPOUNDING MARKET, BY PELLETIZING SYSTEM, 2018-2032 (USD THOUSAND)
TABLE 1203 TAIWAN INJECTION MOLDING BASED COMPOUNDING IN PLASTIC COMPOUNDING MARKET, BY PELLETIZING SYSTEM, 2018-2032 (USD THOUSAND)
TABLE 1204 TAIWAN COMPACTION/PRESSING IN PLASTIC COMPOUNDING MARKET, BY PELLETIZING SYSTEM, 2018-2032 (USD THOUSAND)
TABLE 1205 TAIWAN KNEADER/BANBURY MIXING IN PLASTIC COMPOUNDING MARKET, BY PELLETIZING SYSTEM, 2018-2032 (USD THOUSAND)
TABLE 1206 TAIWAN PLASTIC COMPOUNDING MARKET, BY PROPERTIES, 2018-2032 (USD THOUSAND)
TABLE 1207 TAIWAN PLASTIC COMPOUNDING MARKET, BY APPLICATION, 2018-2032 (USD THOUSAND)
TABLE 1208 TAIWAN PLASTIC COMPOUNDING MARKET, BY APPLICATION, 2018-2032 (KILO TONS)
TABLE 1209 TAIWAN AUTOMOTIVE IN PLASTIC COMPOUNDING MARKET, BY CATEGORY, 2018-2032 (USD THOUSAND)
TABLE 1210 TAIWAN INTERIOR COMPONENTS IN PLASTIC COMPOUNDING MARKET, BY TYPE, 2018-2032 (USD THOUSAND)
TABLE 1211 TAIWAN EXTERIOR BODY PARTS IN PLASTIC COMPOUNDING MARKET, BY TYPE, 2018-2032 (USD THOUSAND)
TABLE 1212 TAIWAN UNDER-THE-HOOD APPLICATIONS IN PLASTIC COMPOUNDING MARKET, BY TYPE, 2018-2032 (USD THOUSAND)
TABLE 1213 TAIWAN PACKAGING IN PLASTIC COMPOUNDING MARKET, BY CATEGORY, 2018-2032 (USD THOUSAND)
TABLE 1214 TAIWAN FOOD & BEVERAGE PACKAGING IN PLASTIC COMPOUNDING MARKET, BY TYPE, 2018-2032 (USD THOUSAND)
TABLE 1215 TAIWAN INDUSTRIAL PACKAGING IN PLASTIC COMPOUNDING MARKET, BY TYPE, 2018-2032 (USD THOUSAND)
TABLE 1216 TAIWAN CONSUMER GOODS PACKAGING IN PLASTIC COMPOUNDING MARKET, BY TYPE, 2018-2032 (USD THOUSAND)
TABLE 1217 TAIWAN BUILDING & CONSTRUCTION IN PLASTIC COMPOUNDING MARKET, BY CATEGORY, 2018-2032 (USD THOUSAND)
TABLE 1218 TAIWAN ELECTRICAL & ELECTRONICS IN PLASTIC COMPOUNDING MARKET, BY CATEGORY, 2018-2032 (USD THOUSAND)
TABLE 1219 TAIWAN MEDICAL DEVICES IN PLASTIC COMPOUNDING MARKET, BY CATEGORY, 2018-2032 (USD THOUSAND)
TABLE 1220 TAIWAN FURNITURE IN PLASTIC COMPOUNDING MARKET, BY CATEGORY, 2018-2032 (USD THOUSAND)
TABLE 1221 TAIWAN ENERGY AND POWER IN PLASTIC COMPOUNDING MARKET, BY CATEGORY, 2018-2032 (USD THOUSAND)
TABLE 1222 TAIWAN AEROSPACE AND DEFENSE IN PLASTIC COMPOUNDING MARKET, BY CATEGORY, 2018-2032 (USD THOUSAND)
TABLE 1223 HONG KONG PLASTIC COMPOUNDING MARKET, BY POLYMER TYPE, 2018-2032 (USD THOUSAND)
TABLE 1224 HONG KONG PLASTIC COMPOUNDING MARKET, BY POLYMER TYPE, 2018-2032 (KILO TONS)
TABLE 1225 HONG KONG THERMOPLASTICS IN PLASTIC COMPOUNDING MARKET, BY TYPE, 2018-2032 (USD THOUSAND)
TABLE 1226 HONG KONG POLYETHYLENE (PE) IN PLASTIC COMPOUNDING MARKET, BY TYPE, 2018-2032 (USD THOUSAND)
TABLE 1227 HONG KONG ENGINEERING PLASTICS IN PLASTIC COMPOUNDING MARKET, BY TYPE, 2018-2032 (USD THOUSAND)
TABLE 1228 HONG KONG THERMOSETTING PLASTICS IN PLASTIC COMPOUNDING MARKET, BY TYPE, 2018-2032 (USD THOUSAND)
TABLE 1229 HONG KONG BIOPLASTICS IN PLASTIC COMPOUNDING MARKET, BY TYPE, 2018-2032 (USD THOUSAND)
TABLE 1230 HONG KONG PLASTIC COMPOUNDING MARKET, BY FILLER TYPE, 2018-2032 (USD THOUSAND)
TABLE 1231 HONG KONG MINERAL FILLERS IN PLASTIC COMPOUNDING MARKET, BY TYPE, 2018-2032 (USD THOUSAND)
TABLE 1232 HONG KONG REINFORCEMENTS IN PLASTIC COMPOUNDING MARKET, BY TYPE, 2018-2032 (USD THOUSAND)
TABLE 1233 HONG KONG ADDITIVES IN PLASTIC COMPOUNDING MARKET, BY TYPE, 2018-2032 (USD THOUSAND)
TABLE 1234 HONG KONG PLASTIC COMPOUNDING MARKET, BY MANUFACTURING PROCESS, 2018-2032 (USD THOUSAND)
TABLE 1235 HONG KONG PLASTIC COMPOUNDING MARKET, BY MANUFACTURING PROCESS, 2018-2032 (KILO TONS)
TABLE 1236 HONG KONG EXTRUSION IN PLASTIC COMPOUNDING MARKET, BY TYPE, 2018-2032 (USD THOUSAND)
TABLE 1237 HONG KONG EXTRUSION IN PLASTIC COMPOUNDING MARKET, BY PELLETIZING SYSTEM, 2018-2032 (USD THOUSAND)
TABLE 1238 HONG KONG INJECTION MOLDING BASED COMPOUNDING IN PLASTIC COMPOUNDING MARKET, BY PELLETIZING SYSTEM, 2018-2032 (USD THOUSAND)
TABLE 1239 HONG KONG COMPACTION/PRESSING IN PLASTIC COMPOUNDING MARKET, BY PELLETIZING SYSTEM, 2018-2032 (USD THOUSAND)
TABLE 1240 HONG KONG KNEADER/BANBURY MIXING IN PLASTIC COMPOUNDING MARKET, BY PELLETIZING SYSTEM, 2018-2032 (USD THOUSAND)
TABLE 1241 HONG KONG PLASTIC COMPOUNDING MARKET, BY PROPERTIES, 2018-2032 (USD THOUSAND)
TABLE 1242 HONG KONG PLASTIC COMPOUNDING MARKET, BY APPLICATION, 2018-2032 (USD THOUSAND)
TABLE 1243 HONG KONG PLASTIC COMPOUNDING MARKET, BY APPLICATION, 2018-2032 (KILO TONS)
TABLE 1244 HONG KONG AUTOMOTIVE IN PLASTIC COMPOUNDING MARKET, BY CATEGORY, 2018-2032 (USD THOUSAND)
TABLE 1245 HONG KONG INTERIOR COMPONENTS IN PLASTIC COMPOUNDING MARKET, BY TYPE, 2018-2032 (USD THOUSAND)
TABLE 1246 HONG KONG EXTERIOR BODY PARTS IN PLASTIC COMPOUNDING MARKET, BY TYPE, 2018-2032 (USD THOUSAND)
TABLE 1247 HONG KONG UNDER-THE-HOOD APPLICATIONS IN PLASTIC COMPOUNDING MARKET, BY TYPE, 2018-2032 (USD THOUSAND)
TABLE 1248 HONG KONG PACKAGING IN PLASTIC COMPOUNDING MARKET, BY CATEGORY, 2018-2032 (USD THOUSAND)
TABLE 1249 HONG KONG FOOD & BEVERAGE PACKAGING IN PLASTIC COMPOUNDING MARKET, BY TYPE, 2018-2032 (USD THOUSAND)
TABLE 1250 HONG KONG INDUSTRIAL PACKAGING IN PLASTIC COMPOUNDING MARKET, BY TYPE, 2018-2032 (USD THOUSAND)
TABLE 1251 HONG KONG CONSUMER GOODS PACKAGING IN PLASTIC COMPOUNDING MARKET, BY TYPE, 2018-2032 (USD THOUSAND)
TABLE 1252 HONG KONG BUILDING & CONSTRUCTION IN PLASTIC COMPOUNDING MARKET, BY CATEGORY, 2018-2032 (USD THOUSAND)
TABLE 1253 HONG KONG ELECTRICAL & ELECTRONICS IN PLASTIC COMPOUNDING MARKET, BY CATEGORY, 2018-2032 (USD THOUSAND)
TABLE 1254 HONG KONG MEDICAL DEVICES IN PLASTIC COMPOUNDING MARKET, BY CATEGORY, 2018-2032 (USD THOUSAND)
TABLE 1255 HONG KONG FURNITURE IN PLASTIC COMPOUNDING MARKET, BY CATEGORY, 2018-2032 (USD THOUSAND)
TABLE 1256 HONG KONG ENERGY AND POWER IN PLASTIC COMPOUNDING MARKET, BY CATEGORY, 2018-2032 (USD THOUSAND)
TABLE 1257 HONG KONG AEROSPACE AND DEFENSE IN PLASTIC COMPOUNDING MARKET, BY CATEGORY, 2018-2032 (USD THOUSAND)
TABLE 1258 REST OF ASIA-PACIFIC PLASTIC COMPOUNDING MARKET, BY POLYMER TYPE, 2018-2032 (USD THOUSAND)
TABLE 1259 REST OF ASIA-PACIFIC PLASTIC COMPOUNDING MARKET, BY POLYMER TYPE, 2018-2032 (KILO TONS)
TABLE 1260 MIDDLE EAST AND AFRICA PLASTIC COMPOUNDING MARKET, BY COUNTRY, 2018-2032 (USD THOUSAND)
TABLE 1261 MIDDLE EAST AND AFRICA PLASTIC COMPOUNDING MARKET, BY COUNTRY, 2018-2032 (KILO TONS)
TABLE 1262 MIDDLE EAST AND AFRICA PLASTIC COMPOUNDING MARKET, BY POLYMER TYPE, 2018-2032 (USD THOUSAND)
TABLE 1263 MIDDLE EAST AND AFRICA PLASTIC COMPOUNDING MARKET, BY POLYMER TYPE, 2018-2032 (KILO TONS)
TABLE 1264 MIDDLE EAST AND AFRICA THERMOPLASTICS IN PLASTIC COMPOUNDING MARKET, BY TYPE, 2018-2032 (USD THOUSAND)
TABLE 1265 MIDDLE EAST AND AFRICA POLYETHYLENE (PE) IN PLASTIC COMPOUNDING MARKET, BY TYPE, 2018-2032 (USD THOUSAND)
TABLE 1266 MIDDLE EAST AND AFRICA ENGINEERING PLASTICS IN PLASTIC COMPOUNDING MARKET, BY TYPE, 2018-2032 (USD THOUSAND)
TABLE 1267 MIDDLE EAST AND AFRICA THERMOSETTING PLASTICS IN PLASTIC COMPOUNDING MARKET, BY TYPE, 2018-2032 (USD THOUSAND)
TABLE 1268 MIDDLE EAST AND AFRICA BIOPLASTICS IN PLASTIC COMPOUNDING MARKET, BY TYPE, 2018-2032 (USD THOUSAND)
TABLE 1269 MIDDLE EAST AND AFRICA PLASTIC COMPOUNDING MARKET, BY FILLER TYPE, 2018-2032 (USD THOUSAND)
TABLE 1270 MIDDLE EAST AND AFRICA MINERAL FILLERS IN PLASTIC COMPOUNDING MARKET, BY TYPE, 2018-2032 (USD THOUSAND)
TABLE 1271 MIDDLE EAST AND AFRICA REINFORCEMENTS IN PLASTIC COMPOUNDING MARKET, BY TYPE, 2018-2032 (USD THOUSAND)
TABLE 1272 MIDDLE EAST AND AFRICA ADDITIVES IN PLASTIC COMPOUNDING MARKET, BY TYPE, 2018-2032 (USD THOUSAND)
TABLE 1273 MIDDLE EAST AND AFRICA PLASTIC COMPOUNDING MARKET, BY MANUFACTURING PROCESS, 2018-2032 (USD THOUSAND)
TABLE 1274 MIDDLE EAST AND AFRICA PLASTIC COMPOUNDING MARKET, BY MANUFACTURING PROCESS, 2018-2032 (KILO TONS)
TABLE 1275 MIDDLE EAST AND AFRICA EXTRUSION IN PLASTIC COMPOUNDING MARKET, BY TYPE, 2018-2032 (USD THOUSAND)
TABLE 1276 MIDDLE EAST AND AFRICA EXTRUSION IN PLASTIC COMPOUNDING MARKET, BY PELLETIZING SYSTEM, 2018-2032 (USD THOUSAND)
TABLE 1277 MIDDLE EAST AND AFRICA INJECTION MOLDING BASED COMPOUNDING IN PLASTIC COMPOUNDING MARKET, BY PELLETIZING SYSTEM, 2018-2032 (USD THOUSAND)
TABLE 1278 MIDDLE EAST AND AFRICA COMPACTION/PRESSING IN PLASTIC COMPOUNDING MARKET, BY PELLETIZING SYSTEM, 2018-2032 (USD THOUSAND)
TABLE 1279 MIDDLE EAST AND AFRICA KNEADER/BANBURY MIXING IN PLASTIC COMPOUNDING MARKET, BY PELLETIZING SYSTEM, 2018-2032 (USD THOUSAND)
TABLE 1280 MIDDLE EAST AND AFRICA PLASTIC COMPOUNDING MARKET, BY PROPERTIES, 2018-2032 (USD THOUSAND)
TABLE 1281 MIDDLE EAST AND AFRICA PLASTIC COMPOUNDING MARKET, BY APPLICATION, 2018-2032 (USD THOUSAND)
TABLE 1282 MIDDLE EAST AND AFRICA PLASTIC COMPOUNDING MARKET, BY APPLICATION, 2018-2032 (KILO TONS)
TABLE 1283 MIDDLE EAST AND AFRICA AUTOMOTIVE IN PLASTIC COMPOUNDING MARKET, BY CATEGORY, 2018-2032 (USD THOUSAND)
TABLE 1284 MIDDLE EAST AND AFRICA INTERIOR COMPONENTS IN PLASTIC COMPOUNDING MARKET, BY TYPE, 2018-2032 (USD THOUSAND)
TABLE 1285 MIDDLE EAST AND AFRICA EXTERIOR BODY PARTS IN PLASTIC COMPOUNDING MARKET, BY TYPE, 2018-2032 (USD THOUSAND)
TABLE 1286 MIDDLE EAST AND AFRICA UNDER-THE-HOOD APPLICATIONS IN PLASTIC COMPOUNDING MARKET, BY TYPE, 2018-2032 (USD THOUSAND)
TABLE 1287 MIDDLE EAST AND AFRICA PACKAGING IN PLASTIC COMPOUNDING MARKET, BY CATEGORY, 2018-2032 (USD THOUSAND)
TABLE 1288 MIDDLE EAST AND AFRICA FOOD & BEVERAGE PACKAGING IN PLASTIC COMPOUNDING MARKET, BY TYPE, 2018-2032 (USD THOUSAND)
TABLE 1289 MIDDLE EAST AND AFRICA INDUSTRIAL PACKAGING IN PLASTIC COMPOUNDING MARKET, BY TYPE, 2018-2032 (USD THOUSAND)
TABLE 1290 MIDDLE EAST AND AFRICA CONSUMER GOODS PACKAGING IN PLASTIC COMPOUNDING MARKET, BY TYPE, 2018-2032 (USD THOUSAND)
TABLE 1291 MIDDLE EAST AND AFRICA BUILDING & CONSTRUCTION IN PLASTIC COMPOUNDING MARKET, BY CATEGORY, 2018-2032 (USD THOUSAND)
TABLE 1292 MIDDLE EAST AND AFRICA ELECTRICAL & ELECTRONICS IN PLASTIC COMPOUNDING MARKET, BY CATEGORY, 2018-2032 (USD THOUSAND)
TABLE 1293 MIDDLE EAST AND AFRICA MEDICAL DEVICES IN PLASTIC COMPOUNDING MARKET, BY CATEGORY, 2018-2032 (USD THOUSAND)
TABLE 1294 MIDDLE EAST AND AFRICA FURNITURE IN PLASTIC COMPOUNDING MARKET, BY CATEGORY, 2018-2032 (USD THOUSAND)
TABLE 1295 MIDDLE EAST AND AFRICA ENERGY AND POWER IN PLASTIC COMPOUNDING MARKET, BY CATEGORY, 2018-2032 (USD THOUSAND)
TABLE 1296 MIDDLE EAST AND AFRICA AEROSPACE AND DEFENSE IN PLASTIC COMPOUNDING MARKET, BY CATEGORY, 2018-2032 (USD THOUSAND)
TABLE 1297 SAUDI ARABIA PLASTIC COMPOUNDING MARKET, BY POLYMER TYPE, 2018-2032 (USD THOUSAND)
TABLE 1298 SAUDI ARABIA PLASTIC COMPOUNDING MARKET, BY POLYMER TYPE, 2018-2032 (KILO TONS)
TABLE 1299 SAUDI ARABIA THERMOPLASTICS IN PLASTIC COMPOUNDING MARKET, BY TYPE, 2018-2032 (USD THOUSAND)
TABLE 1300 SAUDI ARABIA POLYETHYLENE (PE) IN PLASTIC COMPOUNDING MARKET, BY TYPE, 2018-2032 (USD THOUSAND)
TABLE 1301 SAUDI ARABIA ENGINEERING PLASTICS IN PLASTIC COMPOUNDING MARKET, BY TYPE, 2018-2032 (USD THOUSAND)
TABLE 1302 SAUDI ARABIA THERMOSETTING PLASTICS IN PLASTIC COMPOUNDING MARKET, BY TYPE, 2018-2032 (USD THOUSAND)
TABLE 1303 SAUDI ARABIA BIOPLASTICS IN PLASTIC COMPOUNDING MARKET, BY TYPE, 2018-2032 (USD THOUSAND)
TABLE 1304 SAUDI ARABIA PLASTIC COMPOUNDING MARKET, BY FILLER TYPE, 2018-2032 (USD THOUSAND)
TABLE 1305 SAUDI ARABIA MINERAL FILLERS IN PLASTIC COMPOUNDING MARKET, BY TYPE, 2018-2032 (USD THOUSAND)
TABLE 1306 SAUDI ARABIA REINFORCEMENTS IN PLASTIC COMPOUNDING MARKET, BY TYPE, 2018-2032 (USD THOUSAND)
TABLE 1307 SAUDI ARABIA ADDITIVES IN PLASTIC COMPOUNDING MARKET, BY TYPE, 2018-2032 (USD THOUSAND)
TABLE 1308 SAUDI ARABIA PLASTIC COMPOUNDING MARKET, BY MANUFACTURING PROCESS, 2018-2032 (USD THOUSAND)
TABLE 1309 SAUDI ARABIA PLASTIC COMPOUNDING MARKET, BY MANUFACTURING PROCESS, 2018-2032 (KILO TONS)
TABLE 1310 SAUDI ARABIA EXTRUSION IN PLASTIC COMPOUNDING MARKET, BY TYPE, 2018-2032 (USD THOUSAND)
TABLE 1311 SAUDI ARABIA EXTRUSION IN PLASTIC COMPOUNDING MARKET, BY PELLETIZING SYSTEM, 2018-2032 (USD THOUSAND)
TABLE 1312 SAUDI ARABIA INJECTION MOLDING BASED COMPOUNDING IN PLASTIC COMPOUNDING MARKET, BY PELLETIZING SYSTEM, 2018-2032 (USD THOUSAND)
TABLE 1313 SAUDI ARABIA COMPACTION/PRESSING IN PLASTIC COMPOUNDING MARKET, BY PELLETIZING SYSTEM, 2018-2032 (USD THOUSAND)
TABLE 1314 SAUDI ARABIA KNEADER/BANBURY MIXING IN PLASTIC COMPOUNDING MARKET, BY PELLETIZING SYSTEM, 2018-2032 (USD THOUSAND)
TABLE 1315 SAUDI ARABIA PLASTIC COMPOUNDING MARKET, BY PROPERTIES, 2018-2032 (USD THOUSAND)
TABLE 1316 SAUDI ARABIA PLASTIC COMPOUNDING MARKET, BY APPLICATION, 2018-2032 (USD THOUSAND)
TABLE 1317 SAUDI ARABIA PLASTIC COMPOUNDING MARKET, BY APPLICATION, 2018-2032 (KILO TONS)
TABLE 1318 SAUDI ARABIA AUTOMOTIVE IN PLASTIC COMPOUNDING MARKET, BY CATEGORY, 2018-2032 (USD THOUSAND)
TABLE 1319 SAUDI ARABIA INTERIOR COMPONENTS IN PLASTIC COMPOUNDING MARKET, BY TYPE, 2018-2032 (USD THOUSAND)
TABLE 1320 SAUDI ARABIA EXTERIOR BODY PARTS IN PLASTIC COMPOUNDING MARKET, BY TYPE, 2018-2032 (USD THOUSAND)
TABLE 1321 SAUDI ARABIA UNDER-THE-HOOD APPLICATIONS IN PLASTIC COMPOUNDING MARKET, BY TYPE, 2018-2032 (USD THOUSAND)
TABLE 1322 SAUDI ARABIA PACKAGING IN PLASTIC COMPOUNDING MARKET, BY CATEGORY, 2018-2032 (USD THOUSAND)
TABLE 1323 SAUDI ARABIA FOOD & BEVERAGE PACKAGING IN PLASTIC COMPOUNDING MARKET, BY TYPE, 2018-2032 (USD THOUSAND)
TABLE 1324 SAUDI ARABIA INDUSTRIAL PACKAGING IN PLASTIC COMPOUNDING MARKET, BY TYPE, 2018-2032 (USD THOUSAND)
TABLE 1325 SAUDI ARABIA CONSUMER GOODS PACKAGING IN PLASTIC COMPOUNDING MARKET, BY TYPE, 2018-2032 (USD THOUSAND)
TABLE 1326 SAUDI ARABIA BUILDING & CONSTRUCTION IN PLASTIC COMPOUNDING MARKET, BY CATEGORY, 2018-2032 (USD THOUSAND)
TABLE 1327 SAUDI ARABIA ELECTRICAL & ELECTRONICS IN PLASTIC COMPOUNDING MARKET, BY CATEGORY, 2018-2032 (USD THOUSAND)
TABLE 1328 SAUDI ARABIA MEDICAL DEVICES IN PLASTIC COMPOUNDING MARKET, BY CATEGORY, 2018-2032 (USD THOUSAND)
TABLE 1329 SAUDI ARABIA FURNITURE IN PLASTIC COMPOUNDING MARKET, BY CATEGORY, 2018-2032 (USD THOUSAND)
TABLE 1330 SAUDI ARABIA ENERGY AND POWER IN PLASTIC COMPOUNDING MARKET, BY CATEGORY, 2018-2032 (USD THOUSAND)
TABLE 1331 SAUDI ARABIA AEROSPACE AND DEFENSE IN PLASTIC COMPOUNDING MARKET, BY CATEGORY, 2018-2032 (USD THOUSAND)
TABLE 1332 EGYPT PLASTIC COMPOUNDING MARKET, BY POLYMER TYPE, 2018-2032 (USD THOUSAND)
TABLE 1333 EGYPT PLASTIC COMPOUNDING MARKET, BY POLYMER TYPE, 2018-2032 (KILO TONS)
TABLE 1334 EGYPT THERMOPLASTICS IN PLASTIC COMPOUNDING MARKET, BY TYPE, 2018-2032 (USD THOUSAND)
TABLE 1335 EGYPT POLYETHYLENE (PE) IN PLASTIC COMPOUNDING MARKET, BY TYPE, 2018-2032 (USD THOUSAND)
TABLE 1336 EGYPT ENGINEERING PLASTICS IN PLASTIC COMPOUNDING MARKET, BY TYPE, 2018-2032 (USD THOUSAND)
TABLE 1337 EGYPT THERMOSETTING PLASTICS IN PLASTIC COMPOUNDING MARKET, BY TYPE, 2018-2032 (USD THOUSAND)
TABLE 1338 EGYPT BIOPLASTICS IN PLASTIC COMPOUNDING MARKET, BY TYPE, 2018-2032 (USD THOUSAND)
TABLE 1339 EGYPT PLASTIC COMPOUNDING MARKET, BY FILLER TYPE, 2018-2032 (USD THOUSAND)
TABLE 1340 EGYPT MINERAL FILLERS IN PLASTIC COMPOUNDING MARKET, BY TYPE, 2018-2032 (USD THOUSAND)
TABLE 1341 EGYPT REINFORCEMENTS IN PLASTIC COMPOUNDING MARKET, BY TYPE, 2018-2032 (USD THOUSAND)
TABLE 1342 EGYPT ADDITIVES IN PLASTIC COMPOUNDING MARKET, BY TYPE, 2018-2032 (USD THOUSAND)
TABLE 1343 EGYPT PLASTIC COMPOUNDING MARKET, BY MANUFACTURING PROCESS, 2018-2032 (USD THOUSAND)
TABLE 1344 EGYPT PLASTIC COMPOUNDING MARKET, BY MANUFACTURING PROCESS, 2018-2032 (KILO TONS)
TABLE 1345 EGYPT EXTRUSION IN PLASTIC COMPOUNDING MARKET, BY TYPE, 2018-2032 (USD THOUSAND)
TABLE 1346 EGYPT EXTRUSION IN PLASTIC COMPOUNDING MARKET, BY PELLETIZING SYSTEM, 2018-2032 (USD THOUSAND)
TABLE 1347 EGYPT INJECTION MOLDING BASED COMPOUNDING IN PLASTIC COMPOUNDING MARKET, BY PELLETIZING SYSTEM, 2018-2032 (USD THOUSAND)
TABLE 1348 EGYPT COMPACTION/PRESSING IN PLASTIC COMPOUNDING MARKET, BY PELLETIZING SYSTEM, 2018-2032 (USD THOUSAND)
TABLE 1349 EGYPT KNEADER/BANBURY MIXING IN PLASTIC COMPOUNDING MARKET, BY PELLETIZING SYSTEM, 2018-2032 (USD THOUSAND)
TABLE 1350 EGYPT PLASTIC COMPOUNDING MARKET, BY PROPERTIES, 2018-2032 (USD THOUSAND)
TABLE 1351 EGYPT PLASTIC COMPOUNDING MARKET, BY APPLICATION, 2018-2032 (USD THOUSAND)
TABLE 1352 EGYPT PLASTIC COMPOUNDING MARKET, BY APPLICATION, 2018-2032 (KILO TONS)
TABLE 1353 EGYPT AUTOMOTIVE IN PLASTIC COMPOUNDING MARKET, BY CATEGORY, 2018-2032 (USD THOUSAND)
TABLE 1354 EGYPT INTERIOR COMPONENTS IN PLASTIC COMPOUNDING MARKET, BY TYPE, 2018-2032 (USD THOUSAND)
TABLE 1355 EGYPT EXTERIOR BODY PARTS IN PLASTIC COMPOUNDING MARKET, BY TYPE, 2018-2032 (USD THOUSAND)
TABLE 1356 EGYPT UNDER-THE-HOOD APPLICATIONS IN PLASTIC COMPOUNDING MARKET, BY TYPE, 2018-2032 (USD THOUSAND)
TABLE 1357 EGYPT PACKAGING IN PLASTIC COMPOUNDING MARKET, BY CATEGORY, 2018-2032 (USD THOUSAND)
TABLE 1358 EGYPT FOOD & BEVERAGE PACKAGING IN PLASTIC COMPOUNDING MARKET, BY TYPE, 2018-2032 (USD THOUSAND)
TABLE 1359 EGYPT INDUSTRIAL PACKAGING IN PLASTIC COMPOUNDING MARKET, BY TYPE, 2018-2032 (USD THOUSAND)
TABLE 1360 EGYPT CONSUMER GOODS PACKAGING IN PLASTIC COMPOUNDING MARKET, BY TYPE, 2018-2032 (USD THOUSAND)
TABLE 1361 EGYPT BUILDING & CONSTRUCTION IN PLASTIC COMPOUNDING MARKET, BY CATEGORY, 2018-2032 (USD THOUSAND)
TABLE 1362 EGYPT ELECTRICAL & ELECTRONICS IN PLASTIC COMPOUNDING MARKET, BY CATEGORY, 2018-2032 (USD THOUSAND)
TABLE 1363 EGYPT MEDICAL DEVICES IN PLASTIC COMPOUNDING MARKET, BY CATEGORY, 2018-2032 (USD THOUSAND)
TABLE 1364 EGYPT FURNITURE IN PLASTIC COMPOUNDING MARKET, BY CATEGORY, 2018-2032 (USD THOUSAND)
TABLE 1365 EGYPT ENERGY AND POWER IN PLASTIC COMPOUNDING MARKET, BY CATEGORY, 2018-2032 (USD THOUSAND)
TABLE 1366 EGYPT AEROSPACE AND DEFENSE IN PLASTIC COMPOUNDING MARKET, BY CATEGORY, 2018-2032 (USD THOUSAND)
TABLE 1367 U.A.E. PLASTIC COMPOUNDING MARKET, BY POLYMER TYPE, 2018-2032 (USD THOUSAND)
TABLE 1368 U.A.E. PLASTIC COMPOUNDING MARKET, BY POLYMER TYPE, 2018-2032 (KILO TONS)
TABLE 1369 U.A.E. THERMOPLASTICS IN PLASTIC COMPOUNDING MARKET, BY TYPE, 2018-2032 (USD THOUSAND)
TABLE 1370 U.A.E. POLYETHYLENE (PE) IN PLASTIC COMPOUNDING MARKET, BY TYPE, 2018-2032 (USD THOUSAND)
TABLE 1371 U.A.E. ENGINEERING PLASTICS IN PLASTIC COMPOUNDING MARKET, BY TYPE, 2018-2032 (USD THOUSAND)
TABLE 1372 U.A.E. THERMOSETTING PLASTICS IN PLASTIC COMPOUNDING MARKET, BY TYPE, 2018-2032 (USD THOUSAND)
TABLE 1373 U.A.E. BIOPLASTICS IN PLASTIC COMPOUNDING MARKET, BY TYPE, 2018-2032 (USD THOUSAND)
TABLE 1374 U.A.E. PLASTIC COMPOUNDING MARKET, BY FILLER TYPE, 2018-2032 (USD THOUSAND)
TABLE 1375 U.A.E. MINERAL FILLERS IN PLASTIC COMPOUNDING MARKET, BY TYPE, 2018-2032 (USD THOUSAND)
TABLE 1376 U.A.E. REINFORCEMENTS IN PLASTIC COMPOUNDING MARKET, BY TYPE, 2018-2032 (USD THOUSAND)
TABLE 1377 U.A.E. ADDITIVES IN PLASTIC COMPOUNDING MARKET, BY TYPE, 2018-2032 (USD THOUSAND)
TABLE 1378 U.A.E. PLASTIC COMPOUNDING MARKET, BY MANUFACTURING PROCESS, 2018-2032 (USD THOUSAND)
TABLE 1379 U.A.E. PLASTIC COMPOUNDING MARKET, BY MANUFACTURING PROCESS, 2018-2032 (KILO TONS)
TABLE 1380 U.A.E. EXTRUSION IN PLASTIC COMPOUNDING MARKET, BY TYPE, 2018-2032 (USD THOUSAND)
TABLE 1381 U.A.E. EXTRUSION IN PLASTIC COMPOUNDING MARKET, BY PELLETIZING SYSTEM, 2018-2032 (USD THOUSAND)
TABLE 1382 U.A.E. INJECTION MOLDING BASED COMPOUNDING IN PLASTIC COMPOUNDING MARKET, BY PELLETIZING SYSTEM, 2018-2032 (USD THOUSAND)
TABLE 1383 U.A.E. COMPACTION/PRESSING IN PLASTIC COMPOUNDING MARKET, BY PELLETIZING SYSTEM, 2018-2032 (USD THOUSAND)
TABLE 1384 U.A.E. KNEADER/BANBURY MIXING IN PLASTIC COMPOUNDING MARKET, BY PELLETIZING SYSTEM, 2018-2032 (USD THOUSAND)
TABLE 1385 U.A.E. PLASTIC COMPOUNDING MARKET, BY PROPERTIES, 2018-2032 (USD THOUSAND)
TABLE 1386 U.A.E. PLASTIC COMPOUNDING MARKET, BY APPLICATION, 2018-2032 (USD THOUSAND)
TABLE 1387 U.A.E. PLASTIC COMPOUNDING MARKET, BY APPLICATION, 2018-2032 (KILO TONS)
TABLE 1388 U.A.E. AUTOMOTIVE IN PLASTIC COMPOUNDING MARKET, BY CATEGORY, 2018-2032 (USD THOUSAND)
TABLE 1389 U.A.E. INTERIOR COMPONENTS IN PLASTIC COMPOUNDING MARKET, BY TYPE, 2018-2032 (USD THOUSAND)
TABLE 1390 U.A.E. EXTERIOR BODY PARTS IN PLASTIC COMPOUNDING MARKET, BY TYPE, 2018-2032 (USD THOUSAND)
TABLE 1391 U.A.E. UNDER-THE-HOOD APPLICATIONS IN PLASTIC COMPOUNDING MARKET, BY TYPE, 2018-2032 (USD THOUSAND)
TABLE 1392 U.A.E. PACKAGING IN PLASTIC COMPOUNDING MARKET, BY CATEGORY, 2018-2032 (USD THOUSAND)
TABLE 1393 U.A.E. FOOD & BEVERAGE PACKAGING IN PLASTIC COMPOUNDING MARKET, BY TYPE, 2018-2032 (USD THOUSAND)
TABLE 1394 U.A.E. INDUSTRIAL PACKAGING IN PLASTIC COMPOUNDING MARKET, BY TYPE, 2018-2032 (USD THOUSAND)
TABLE 1395 U.A.E. CONSUMER GOODS PACKAGING IN PLASTIC COMPOUNDING MARKET, BY TYPE, 2018-2032 (USD THOUSAND)
TABLE 1396 U.A.E. BUILDING & CONSTRUCTION IN PLASTIC COMPOUNDING MARKET, BY CATEGORY, 2018-2032 (USD THOUSAND)
TABLE 1397 U.A.E. ELECTRICAL & ELECTRONICS IN PLASTIC COMPOUNDING MARKET, BY CATEGORY, 2018-2032 (USD THOUSAND)
TABLE 1398 U.A.E. MEDICAL DEVICES IN PLASTIC COMPOUNDING MARKET, BY CATEGORY, 2018-2032 (USD THOUSAND)
TABLE 1399 U.A.E. FURNITURE IN PLASTIC COMPOUNDING MARKET, BY CATEGORY, 2018-2032 (USD THOUSAND)
TABLE 1400 U.A.E. ENERGY AND POWER IN PLASTIC COMPOUNDING MARKET, BY CATEGORY, 2018-2032 (USD THOUSAND)
TABLE 1401 U.A.E. AEROSPACE AND DEFENSE IN PLASTIC COMPOUNDING MARKET, BY CATEGORY, 2018-2032 (USD THOUSAND)
TABLE 1402 SOUTH AFRICA PLASTIC COMPOUNDING MARKET, BY POLYMER TYPE, 2018-2032 (USD THOUSAND)
TABLE 1403 SOUTH AFRICA PLASTIC COMPOUNDING MARKET, BY POLYMER TYPE, 2018-2032 (KILO TONS)
TABLE 1404 SOUTH AFRICA THERMOPLASTICS IN PLASTIC COMPOUNDING MARKET, BY TYPE, 2018-2032 (USD THOUSAND)
TABLE 1405 SOUTH AFRICA POLYETHYLENE (PE) IN PLASTIC COMPOUNDING MARKET, BY TYPE, 2018-2032 (USD THOUSAND)
TABLE 1406 SOUTH AFRICA ENGINEERING PLASTICS IN PLASTIC COMPOUNDING MARKET, BY TYPE, 2018-2032 (USD THOUSAND)
TABLE 1407 SOUTH AFRICA THERMOSETTING PLASTICS IN PLASTIC COMPOUNDING MARKET, BY TYPE, 2018-2032 (USD THOUSAND)
TABLE 1408 SOUTH AFRICA BIOPLASTICS IN PLASTIC COMPOUNDING MARKET, BY TYPE, 2018-2032 (USD THOUSAND)
TABLE 1409 SOUTH AFRICA PLASTIC COMPOUNDING MARKET, BY FILLER TYPE, 2018-2032 (USD THOUSAND)
TABLE 1410 SOUTH AFRICA MINERAL FILLERS IN PLASTIC COMPOUNDING MARKET, BY TYPE, 2018-2032 (USD THOUSAND)
TABLE 1411 SOUTH AFRICA REINFORCEMENTS IN PLASTIC COMPOUNDING MARKET, BY TYPE, 2018-2032 (USD THOUSAND)
TABLE 1412 SOUTH AFRICA ADDITIVES IN PLASTIC COMPOUNDING MARKET, BY TYPE, 2018-2032 (USD THOUSAND)
TABLE 1413 SOUTH AFRICA PLASTIC COMPOUNDING MARKET, BY MANUFACTURING PROCESS, 2018-2032 (USD THOUSAND)
TABLE 1414 SOUTH AFRICA PLASTIC COMPOUNDING MARKET, BY MANUFACTURING PROCESS, 2018-2032 (KILO TONS)
TABLE 1415 SOUTH AFRICA EXTRUSION IN PLASTIC COMPOUNDING MARKET, BY TYPE, 2018-2032 (USD THOUSAND)
TABLE 1416 SOUTH AFRICA EXTRUSION IN PLASTIC COMPOUNDING MARKET, BY PELLETIZING SYSTEM, 2018-2032 (USD THOUSAND)
TABLE 1417 SOUTH AFRICA INJECTION MOLDING BASED COMPOUNDING IN PLASTIC COMPOUNDING MARKET, BY PELLETIZING SYSTEM, 2018-2032 (USD THOUSAND)
TABLE 1418 SOUTH AFRICA COMPACTION/PRESSING IN PLASTIC COMPOUNDING MARKET, BY PELLETIZING SYSTEM, 2018-2032 (USD THOUSAND)
TABLE 1419 SOUTH AFRICA KNEADER/BANBURY MIXING IN PLASTIC COMPOUNDING MARKET, BY PELLETIZING SYSTEM, 2018-2032 (USD THOUSAND)
TABLE 1420 SOUTH AFRICA PLASTIC COMPOUNDING MARKET, BY PROPERTIES, 2018-2032 (USD THOUSAND)
TABLE 1421 SOUTH AFRICA PLASTIC COMPOUNDING MARKET, BY APPLICATION, 2018-2032 (USD THOUSAND)
TABLE 1422 SOUTH AFRICA PLASTIC COMPOUNDING MARKET, BY APPLICATION, 2018-2032 (KILO TONS)
TABLE 1423 SOUTH AFRICA AUTOMOTIVE IN PLASTIC COMPOUNDING MARKET, BY CATEGORY, 2018-2032 (USD THOUSAND)
TABLE 1424 SOUTH AFRICA INTERIOR COMPONENTS IN PLASTIC COMPOUNDING MARKET, BY TYPE, 2018-2032 (USD THOUSAND)
TABLE 1425 SOUTH AFRICA EXTERIOR BODY PARTS IN PLASTIC COMPOUNDING MARKET, BY TYPE, 2018-2032 (USD THOUSAND)
TABLE 1426 SOUTH AFRICA UNDER-THE-HOOD APPLICATIONS IN PLASTIC COMPOUNDING MARKET, BY TYPE, 2018-2032 (USD THOUSAND)
TABLE 1427 SOUTH AFRICA PACKAGING IN PLASTIC COMPOUNDING MARKET, BY CATEGORY, 2018-2032 (USD THOUSAND)
TABLE 1428 SOUTH AFRICA FOOD & BEVERAGE PACKAGING IN PLASTIC COMPOUNDING MARKET, BY TYPE, 2018-2032 (USD THOUSAND)
TABLE 1429 SOUTH AFRICA INDUSTRIAL PACKAGING IN PLASTIC COMPOUNDING MARKET, BY TYPE, 2018-2032 (USD THOUSAND)
TABLE 1430 SOUTH AFRICA CONSUMER GOODS PACKAGING IN PLASTIC COMPOUNDING MARKET, BY TYPE, 2018-2032 (USD THOUSAND)
TABLE 1431 SOUTH AFRICA BUILDING & CONSTRUCTION IN PLASTIC COMPOUNDING MARKET, BY CATEGORY, 2018-2032 (USD THOUSAND)
TABLE 1432 SOUTH AFRICA ELECTRICAL & ELECTRONICS IN PLASTIC COMPOUNDING MARKET, BY CATEGORY, 2018-2032 (USD THOUSAND)
TABLE 1433 SOUTH AFRICA MEDICAL DEVICES IN PLASTIC COMPOUNDING MARKET, BY CATEGORY, 2018-2032 (USD THOUSAND)
TABLE 1434 SOUTH AFRICA FURNITURE IN PLASTIC COMPOUNDING MARKET, BY CATEGORY, 2018-2032 (USD THOUSAND)
TABLE 1435 SOUTH AFRICA ENERGY AND POWER IN PLASTIC COMPOUNDING MARKET, BY CATEGORY, 2018-2032 (USD THOUSAND)
TABLE 1436 SOUTH AFRICA AEROSPACE AND DEFENSE IN PLASTIC COMPOUNDING MARKET, BY CATEGORY, 2018-2032 (USD THOUSAND)
TABLE 1437 ISRAEL PLASTIC COMPOUNDING MARKET, BY POLYMER TYPE, 2018-2032 (USD THOUSAND)
TABLE 1438 ISRAEL PLASTIC COMPOUNDING MARKET, BY POLYMER TYPE, 2018-2032 (KILO TONS)
TABLE 1439 ISRAEL THERMOPLASTICS IN PLASTIC COMPOUNDING MARKET, BY TYPE, 2018-2032 (USD THOUSAND)
TABLE 1440 ISRAEL POLYETHYLENE (PE) IN PLASTIC COMPOUNDING MARKET, BY TYPE, 2018-2032 (USD THOUSAND)
TABLE 1441 ISRAEL ENGINEERING PLASTICS IN PLASTIC COMPOUNDING MARKET, BY TYPE, 2018-2032 (USD THOUSAND)
TABLE 1442 ISRAEL THERMOSETTING PLASTICS IN PLASTIC COMPOUNDING MARKET, BY TYPE, 2018-2032 (USD THOUSAND)
TABLE 1443 ISRAEL BIOPLASTICS IN PLASTIC COMPOUNDING MARKET, BY TYPE, 2018-2032 (USD THOUSAND)
TABLE 1444 ISRAEL PLASTIC COMPOUNDING MARKET, BY FILLER TYPE, 2018-2032 (USD THOUSAND)
TABLE 1445 ISRAEL MINERAL FILLERS IN PLASTIC COMPOUNDING MARKET, BY TYPE, 2018-2032 (USD THOUSAND)
TABLE 1446 ISRAEL REINFORCEMENTS IN PLASTIC COMPOUNDING MARKET, BY TYPE, 2018-2032 (USD THOUSAND)
TABLE 1447 ISRAEL ADDITIVES IN PLASTIC COMPOUNDING MARKET, BY TYPE, 2018-2032 (USD THOUSAND)
TABLE 1448 ISRAEL PLASTIC COMPOUNDING MARKET, BY MANUFACTURING PROCESS, 2018-2032 (USD THOUSAND)
TABLE 1449 ISRAEL PLASTIC COMPOUNDING MARKET, BY MANUFACTURING PROCESS, 2018-2032 (KILO TONS)
TABLE 1450 ISRAEL EXTRUSION IN PLASTIC COMPOUNDING MARKET, BY TYPE, 2018-2032 (USD THOUSAND)
TABLE 1451 ISRAEL EXTRUSION IN PLASTIC COMPOUNDING MARKET, BY PELLETIZING SYSTEM, 2018-2032 (USD THOUSAND)
TABLE 1452 ISRAEL INJECTION MOLDING BASED COMPOUNDING IN PLASTIC COMPOUNDING MARKET, BY PELLETIZING SYSTEM, 2018-2032 (USD THOUSAND)
TABLE 1453 ISRAEL COMPACTION/PRESSING IN PLASTIC COMPOUNDING MARKET, BY PELLETIZING SYSTEM, 2018-2032 (USD THOUSAND)
TABLE 1454 ISRAEL KNEADER/BANBURY MIXING IN PLASTIC COMPOUNDING MARKET, BY PELLETIZING SYSTEM, 2018-2032 (USD THOUSAND)
TABLE 1455 ISRAEL PLASTIC COMPOUNDING MARKET, BY PROPERTIES, 2018-2032 (USD THOUSAND)
TABLE 1456 ISRAEL PLASTIC COMPOUNDING MARKET, BY APPLICATION, 2018-2032 (USD THOUSAND)
TABLE 1457 ISRAEL PLASTIC COMPOUNDING MARKET, BY APPLICATION, 2018-2032 (KILO TONS)..
TABLE 1458 ISRAEL AUTOMOTIVE IN PLASTIC COMPOUNDING MARKET, BY CATEGORY, 2018-2032 (USD THOUSAND)
TABLE 1459 ISRAEL INTERIOR COMPONENTS IN PLASTIC COMPOUNDING MARKET, BY TYPE, 2018-2032 (USD THOUSAND)
TABLE 1460 ISRAEL EXTERIOR BODY PARTS IN PLASTIC COMPOUNDING MARKET, BY TYPE, 2018-2032 (USD THOUSAND)
TABLE 1461 ISRAEL UNDER-THE-HOOD APPLICATIONS IN PLASTIC COMPOUNDING MARKET, BY TYPE, 2018-2032 (USD THOUSAND)
TABLE 1462 ISRAEL PACKAGING IN PLASTIC COMPOUNDING MARKET, BY CATEGORY, 2018-2032 (USD THOUSAND)
TABLE 1463 ISRAEL FOOD & BEVERAGE PACKAGING IN PLASTIC COMPOUNDING MARKET, BY TYPE, 2018-2032 (USD THOUSAND)
TABLE 1464 ISRAEL INDUSTRIAL PACKAGING IN PLASTIC COMPOUNDING MARKET, BY TYPE, 2018-2032 (USD THOUSAND)
TABLE 1465 ISRAEL CONSUMER GOODS PACKAGING IN PLASTIC COMPOUNDING MARKET, BY TYPE, 2018-2032 (USD THOUSAND)
TABLE 1466 ISRAEL BUILDING & CONSTRUCTION IN PLASTIC COMPOUNDING MARKET, BY CATEGORY, 2018-2032 (USD THOUSAND)
TABLE 1467 ISRAEL ELECTRICAL & ELECTRONICS IN PLASTIC COMPOUNDING MARKET, BY CATEGORY, 2018-2032 (USD THOUSAND)
TABLE 1468 ISRAEL MEDICAL DEVICES IN PLASTIC COMPOUNDING MARKET, BY CATEGORY, 2018-2032 (USD THOUSAND)
TABLE 1469 ISRAEL FURNITURE IN PLASTIC COMPOUNDING MARKET, BY CATEGORY, 2018-2032 (USD THOUSAND)
TABLE 1470 ISRAEL ENERGY AND POWER IN PLASTIC COMPOUNDING MARKET, BY CATEGORY, 2018-2032 (USD THOUSAND)
TABLE 1471 ISRAEL AEROSPACE AND DEFENSE IN PLASTIC COMPOUNDING MARKET, BY CATEGORY, 2018-2032 (USD THOUSAND)
TABLE 1472 KUWAIT PLASTIC COMPOUNDING MARKET, BY POLYMER TYPE, 2018-2032 (USD THOUSAND)
TABLE 1473 KUWAIT PLASTIC COMPOUNDING MARKET, BY POLYMER TYPE, 2018-2032 (KILO TONS)
TABLE 1474 KUWAIT THERMOPLASTICS IN PLASTIC COMPOUNDING MARKET, BY TYPE, 2018-2032 (USD THOUSAND)
TABLE 1475 KUWAIT POLYETHYLENE (PE) IN PLASTIC COMPOUNDING MARKET, BY TYPE, 2018-2032 (USD THOUSAND)
TABLE 1476 KUWAIT ENGINEERING PLASTICS IN PLASTIC COMPOUNDING MARKET, BY TYPE, 2018-2032 (USD THOUSAND)
TABLE 1477 KUWAIT THERMOSETTING PLASTICS IN PLASTIC COMPOUNDING MARKET, BY TYPE, 2018-2032 (USD THOUSAND)
TABLE 1478 KUWAIT BIOPLASTICS IN PLASTIC COMPOUNDING MARKET, BY TYPE, 2018-2032 (USD THOUSAND)
TABLE 1479 KUWAIT PLASTIC COMPOUNDING MARKET, BY FILLER TYPE, 2018-2032 (USD THOUSAND)
TABLE 1480 KUWAIT MINERAL FILLERS IN PLASTIC COMPOUNDING MARKET, BY TYPE, 2018-2032 (USD THOUSAND)
TABLE 1481 KUWAIT REINFORCEMENTS IN PLASTIC COMPOUNDING MARKET, BY TYPE, 2018-2032 (USD THOUSAND)
TABLE 1482 KUWAIT ADDITIVES IN PLASTIC COMPOUNDING MARKET, BY TYPE, 2018-2032 (USD THOUSAND)
TABLE 1483 KUWAIT PLASTIC COMPOUNDING MARKET, BY MANUFACTURING PROCESS, 2018-2032 (USD THOUSAND)
TABLE 1484 KUWAIT PLASTIC COMPOUNDING MARKET, BY MANUFACTURING PROCESS, 2018-2032 (KILO TONS)
TABLE 1485 KUWAIT EXTRUSION IN PLASTIC COMPOUNDING MARKET, BY TYPE, 2018-2032 (USD THOUSAND)
TABLE 1486 KUWAIT EXTRUSION IN PLASTIC COMPOUNDING MARKET, BY PELLETIZING SYSTEM, 2018-2032 (USD THOUSAND)
TABLE 1487 KUWAIT INJECTION MOLDING BASED COMPOUNDING IN PLASTIC COMPOUNDING MARKET, BY PELLETIZING SYSTEM, 2018-2032 (USD THOUSAND)
TABLE 1488 KUWAIT COMPACTION/PRESSING IN PLASTIC COMPOUNDING MARKET, BY PELLETIZING SYSTEM, 2018-2032 (USD THOUSAND)
TABLE 1489 KUWAIT KNEADER/BANBURY MIXING IN PLASTIC COMPOUNDING MARKET, BY PELLETIZING SYSTEM, 2018-2032 (USD THOUSAND)
TABLE 1490 KUWAIT PLASTIC COMPOUNDING MARKET, BY PROPERTIES, 2018-2032 (USD THOUSAND)
TABLE 1491 KUWAIT PLASTIC COMPOUNDING MARKET, BY APPLICATION, 2018-2032 (USD THOUSAND)
TABLE 1492 KUWAIT PLASTIC COMPOUNDING MARKET, BY APPLICATION, 2018-2032 (KILO TONS)
TABLE 1493 KUWAIT AUTOMOTIVE IN PLASTIC COMPOUNDING MARKET, BY CATEGORY, 2018-2032 (USD THOUSAND)
TABLE 1494 KUWAIT INTERIOR COMPONENTS IN PLASTIC COMPOUNDING MARKET, BY TYPE, 2018-2032 (USD THOUSAND)
TABLE 1495 KUWAIT EXTERIOR BODY PARTS IN PLASTIC COMPOUNDING MARKET, BY TYPE, 2018-2032 (USD THOUSAND)
TABLE 1496 KUWAIT UNDER-THE-HOOD APPLICATIONS IN PLASTIC COMPOUNDING MARKET, BY TYPE, 2018-2032 (USD THOUSAND)
TABLE 1497 KUWAIT PACKAGING IN PLASTIC COMPOUNDING MARKET, BY CATEGORY, 2018-2032 (USD THOUSAND)
TABLE 1498 KUWAIT FOOD & BEVERAGE PACKAGING IN PLASTIC COMPOUNDING MARKET, BY TYPE, 2018-2032 (USD THOUSAND)
TABLE 1499 KUWAIT INDUSTRIAL PACKAGING IN PLASTIC COMPOUNDING MARKET, BY TYPE, 2018-2032 (USD THOUSAND)
TABLE 1500 KUWAIT CONSUMER GOODS PACKAGING IN PLASTIC COMPOUNDING MARKET, BY TYPE, 2018-2032 (USD THOUSAND)
TABLE 1501 KUWAIT BUILDING & CONSTRUCTION IN PLASTIC COMPOUNDING MARKET, BY CATEGORY, 2018-2032 (USD THOUSAND)
TABLE 1502 KUWAIT ELECTRICAL & ELECTRONICS IN PLASTIC COMPOUNDING MARKET, BY CATEGORY, 2018-2032 (USD THOUSAND)
TABLE 1503 KUWAIT MEDICAL DEVICES IN PLASTIC COMPOUNDING MARKET, BY CATEGORY, 2018-2032 (USD THOUSAND)
TABLE 1504 KUWAIT FURNITURE IN PLASTIC COMPOUNDING MARKET, BY CATEGORY, 2018-2032 (USD THOUSAND)
TABLE 1505 KUWAIT ENERGY AND POWER IN PLASTIC COMPOUNDING MARKET, BY CATEGORY, 2018-2032 (USD THOUSAND)
TABLE 1506 KUWAIT AEROSPACE AND DEFENSE IN PLASTIC COMPOUNDING MARKET, BY CATEGORY, 2018-2032 (USD THOUSAND)
TABLE 1507 OMAN PLASTIC COMPOUNDING MARKET, BY POLYMER TYPE, 2018-2032 (USD THOUSAND)
TABLE 1508 OMAN PLASTIC COMPOUNDING MARKET, BY POLYMER TYPE, 2018-2032 (KILO TONS)
TABLE 1509 OMAN THERMOPLASTICS IN PLASTIC COMPOUNDING MARKET, BY TYPE, 2018-2032 (USD THOUSAND)
TABLE 1510 OMAN POLYETHYLENE (PE) IN PLASTIC COMPOUNDING MARKET, BY TYPE, 2018-2032 (USD THOUSAND)
TABLE 1511 OMAN ENGINEERING PLASTICS IN PLASTIC COMPOUNDING MARKET, BY TYPE, 2018-2032 (USD THOUSAND)
TABLE 1512 OMAN THERMOSETTING PLASTICS IN PLASTIC COMPOUNDING MARKET, BY TYPE, 2018-2032 (USD THOUSAND)
TABLE 1513 OMAN BIOPLASTICS IN PLASTIC COMPOUNDING MARKET, BY TYPE, 2018-2032 (USD THOUSAND)
TABLE 1514 OMAN PLASTIC COMPOUNDING MARKET, BY FILLER TYPE, 2018-2032 (USD THOUSAND)
TABLE 1515 OMAN MINERAL FILLERS IN PLASTIC COMPOUNDING MARKET, BY TYPE, 2018-2032 (USD THOUSAND)
TABLE 1516 OMAN REINFORCEMENTS IN PLASTIC COMPOUNDING MARKET, BY TYPE, 2018-2032 (USD THOUSAND)
TABLE 1517 OMAN ADDITIVES IN PLASTIC COMPOUNDING MARKET, BY TYPE, 2018-2032 (USD THOUSAND)
TABLE 1518 OMAN PLASTIC COMPOUNDING MARKET, BY MANUFACTURING PROCESS, 2018-2032 (USD THOUSAND)
TABLE 1519 OMAN PLASTIC COMPOUNDING MARKET, BY MANUFACTURING PROCESS, 2018-2032 (KILO TONS)
TABLE 1520 OMAN EXTRUSION IN PLASTIC COMPOUNDING MARKET, BY TYPE, 2018-2032 (USD THOUSAND)
TABLE 1521 OMAN EXTRUSION IN PLASTIC COMPOUNDING MARKET, BY PELLETIZING SYSTEM, 2018-2032 (USD THOUSAND)
TABLE 1522 OMAN INJECTION MOLDING BASED COMPOUNDING IN PLASTIC COMPOUNDING MARKET, BY PELLETIZING SYSTEM, 2018-2032 (USD THOUSAND)
TABLE 1523 OMAN COMPACTION/PRESSING IN PLASTIC COMPOUNDING MARKET, BY PELLETIZING SYSTEM, 2018-2032 (USD THOUSAND)
TABLE 1524 OMAN KNEADER/BANBURY MIXING IN PLASTIC COMPOUNDING MARKET, BY PELLETIZING SYSTEM, 2018-2032 (USD THOUSAND)
TABLE 1525 OMAN PLASTIC COMPOUNDING MARKET, BY PROPERTIES, 2018-2032 (USD THOUSAND)
TABLE 1526 OMAN PLASTIC COMPOUNDING MARKET, BY APPLICATION, 2018-2032 (USD THOUSAND)
TABLE 1527 OMAN PLASTIC COMPOUNDING MARKET, BY APPLICATION, 2018-2032 (KILO TONS)
TABLE 1528 OMAN AUTOMOTIVE IN PLASTIC COMPOUNDING MARKET, BY CATEGORY, 2018-2032 (USD THOUSAND)
TABLE 1529 OMAN INTERIOR COMPONENTS IN PLASTIC COMPOUNDING MARKET, BY TYPE, 2018-2032 (USD THOUSAND)
TABLE 1530 OMAN EXTERIOR BODY PARTS IN PLASTIC COMPOUNDING MARKET, BY TYPE, 2018-2032 (USD THOUSAND)
TABLE 1531 OMAN UNDER-THE-HOOD APPLICATIONS IN PLASTIC COMPOUNDING MARKET, BY TYPE, 2018-2032 (USD THOUSAND)
TABLE 1532 OMAN PACKAGING IN PLASTIC COMPOUNDING MARKET, BY CATEGORY, 2018-2032 (USD THOUSAND)
TABLE 1533 OMAN FOOD & BEVERAGE PACKAGING IN PLASTIC COMPOUNDING MARKET, BY TYPE, 2018-2032 (USD THOUSAND)
TABLE 1534 OMAN INDUSTRIAL PACKAGING IN PLASTIC COMPOUNDING MARKET, BY TYPE, 2018-2032 (USD THOUSAND)
TABLE 1535 OMAN CONSUMER GOODS PACKAGING IN PLASTIC COMPOUNDING MARKET, BY TYPE, 2018-2032 (USD THOUSAND)
TABLE 1536 OMAN BUILDING & CONSTRUCTION IN PLASTIC COMPOUNDING MARKET, BY CATEGORY, 2018-2032 (USD THOUSAND)
TABLE 1537 OMAN ELECTRICAL & ELECTRONICS IN PLASTIC COMPOUNDING MARKET, BY CATEGORY, 2018-2032 (USD THOUSAND)
TABLE 1538 OMAN MEDICAL DEVICES IN PLASTIC COMPOUNDING MARKET, BY CATEGORY, 2018-2032 (USD THOUSAND)
TABLE 1539 OMAN FURNITURE IN PLASTIC COMPOUNDING MARKET, BY CATEGORY, 2018-2032 (USD THOUSAND)
TABLE 1540 OMAN ENERGY AND POWER IN PLASTIC COMPOUNDING MARKET, BY CATEGORY, 2018-2032 (USD THOUSAND)
TABLE 1541 OMAN AEROSPACE AND DEFENSE IN PLASTIC COMPOUNDING MARKET, BY CATEGORY, 2018-2032 (USD THOUSAND)
TABLE 1542 QATAR PLASTIC COMPOUNDING MARKET, BY POLYMER TYPE, 2018-2032 (USD THOUSAND)
TABLE 1543 QATAR PLASTIC COMPOUNDING MARKET, BY POLYMER TYPE, 2018-2032 (KILO TONS)
TABLE 1544 ATAR THERMOPLASTICS IN PLASTIC COMPOUNDING MARKET, BY TYPE, 2018-2032 (USD THOUSAND)
TABLE 1545 QATAR POLYETHYLENE (PE) IN PLASTIC COMPOUNDING MARKET, BY TYPE, 2018-2032 (USD THOUSAND)
TABLE 1546 QATAR ENGINEERING PLASTICS IN PLASTIC COMPOUNDING MARKET, BY TYPE, 2018-2032 (USD THOUSAND)
TABLE 1547 QATAR THERMOSETTING PLASTICS IN PLASTIC COMPOUNDING MARKET, BY TYPE, 2018-2032 (USD THOUSAND)
TABLE 1548 QATAR BIOPLASTICS IN PLASTIC COMPOUNDING MARKET, BY TYPE, 2018-2032 (USD THOUSAND)
TABLE 1549 QATAR PLASTIC COMPOUNDING MARKET, BY FILLER TYPE, 2018-2032 (USD THOUSAND)
TABLE 1550 QATAR MINERAL FILLERS IN PLASTIC COMPOUNDING MARKET, BY TYPE, 2018-2032 (USD THOUSAND)
TABLE 1551 QATAR REINFORCEMENTS IN PLASTIC COMPOUNDING MARKET, BY TYPE, 2018-2032 (USD THOUSAND)
TABLE 1552 QATAR ADDITIVES IN PLASTIC COMPOUNDING MARKET, BY TYPE, 2018-2032 (USD THOUSAND)
TABLE 1553 QATAR PLASTIC COMPOUNDING MARKET, BY MANUFACTURING PROCESS, 2018-2032 (USD THOUSAND)
TABLE 1554 QATAR PLASTIC COMPOUNDING MARKET, BY MANUFACTURING PROCESS, 2018-2032 (KILO TONS)
TABLE 1555 QATAR EXTRUSION IN PLASTIC COMPOUNDING MARKET, BY TYPE, 2018-2032 (USD THOUSAND)
TABLE 1556 QATAR EXTRUSION IN PLASTIC COMPOUNDING MARKET, BY PELLETIZING SYSTEM, 2018-2032 (USD THOUSAND)
TABLE 1557 QATAR INJECTION MOLDING BASED COMPOUNDING IN PLASTIC COMPOUNDING MARKET, BY PELLETIZING SYSTEM, 2018-2032 (USD THOUSAND)
TABLE 1558 QATAR COMPACTION/PRESSING IN PLASTIC COMPOUNDING MARKET, BY PELLETIZING SYSTEM, 2018-2032 (USD THOUSAND)
TABLE 1559 QATAR KNEADER/BANBURY MIXING IN PLASTIC COMPOUNDING MARKET, BY PELLETIZING SYSTEM, 2018-2032 (USD THOUSAND)
TABLE 1560 QATAR PLASTIC COMPOUNDING MARKET, BY PROPERTIES, 2018-2032 (USD THOUSAND)
TABLE 1561 QATAR PLASTIC COMPOUNDING MARKET, BY APPLICATION, 2018-2032 (USD THOUSAND)
TABLE 1562 QATAR PLASTIC COMPOUNDING MARKET, BY APPLICATION, 2018-2032 (KILO TONS)..
TABLE 1563 QATAR AUTOMOTIVE IN PLASTIC COMPOUNDING MARKET, BY CATEGORY, 2018-2032 (USD THOUSAND)
TABLE 1564 QATAR INTERIOR COMPONENTS IN PLASTIC COMPOUNDING MARKET, BY TYPE, 2018-2032 (USD THOUSAND)
TABLE 1565 QATAR EXTERIOR BODY PARTS IN PLASTIC COMPOUNDING MARKET, BY TYPE, 2018-2032 (USD THOUSAND)
TABLE 1566 QATAR UNDER-THE-HOOD APPLICATIONS IN PLASTIC COMPOUNDING MARKET, BY TYPE, 2018-2032 (USD THOUSAND)
TABLE 1567 QATAR PACKAGING IN PLASTIC COMPOUNDING MARKET, BY CATEGORY, 2018-2032 (USD THOUSAND)
TABLE 1568 QATAR FOOD & BEVERAGE PACKAGING IN PLASTIC COMPOUNDING MARKET, BY TYPE, 2018-2032 (USD THOUSAND)
TABLE 1569 QATAR INDUSTRIAL PACKAGING IN PLASTIC COMPOUNDING MARKET, BY TYPE, 2018-2032 (USD THOUSAND)
TABLE 1570 QATAR CONSUMER GOODS PACKAGING IN PLASTIC COMPOUNDING MARKET, BY TYPE, 2018-2032 (USD THOUSAND)
TABLE 1571 QATAR BUILDING & CONSTRUCTION IN PLASTIC COMPOUNDING MARKET, BY CATEGORY, 2018-2032 (USD THOUSAND)
TABLE 1572 QATAR ELECTRICAL & ELECTRONICS IN PLASTIC COMPOUNDING MARKET, BY CATEGORY, 2018-2032 (USD THOUSAND)
TABLE 1573 QATAR MEDICAL DEVICES IN PLASTIC COMPOUNDING MARKET, BY CATEGORY, 2018-2032 (USD THOUSAND)
TABLE 1574 QATAR FURNITURE IN PLASTIC COMPOUNDING MARKET, BY CATEGORY, 2018-2032 (USD THOUSAND)
TABLE 1575 QATAR ENERGY AND POWER IN PLASTIC COMPOUNDING MARKET, BY CATEGORY, 2018-2032 (USD THOUSAND)
TABLE 1576 QATAR AEROSPACE AND DEFENSE IN PLASTIC COMPOUNDING MARKET, BY CATEGORY, 2018-2032 (USD THOUSAND)
TABLE 1577 BAHRAIN PLASTIC COMPOUNDING MARKET, BY POLYMER TYPE, 2018-2032 (USD THOUSAND)
TABLE 1578 BAHRAIN PLASTIC COMPOUNDING MARKET, BY POLYMER TYPE, 2018-2032 (KILO TONS)
TABLE 1579 BAHRAIN THERMOPLASTICS IN PLASTIC COMPOUNDING MARKET, BY TYPE, 2018-2032 (USD THOUSAND)
TABLE 1580 BAHRAIN POLYETHYLENE (PE) IN PLASTIC COMPOUNDING MARKET, BY TYPE, 2018-2032 (USD THOUSAND)
TABLE 1581 BAHRAIN ENGINEERING PLASTICS IN PLASTIC COMPOUNDING MARKET, BY TYPE, 2018-2032 (USD THOUSAND)
TABLE 1582 BAHRAIN THERMOSETTING PLASTICS IN PLASTIC COMPOUNDING MARKET, BY TYPE, 2018-2032 (USD THOUSAND)
TABLE 1583 BAHRAIN BIOPLASTICS IN PLASTIC COMPOUNDING MARKET, BY TYPE, 2018-2032 (USD THOUSAND)
TABLE 1584 BAHRAIN PLASTIC COMPOUNDING MARKET, BY FILLER TYPE, 2018-2032 (USD THOUSAND)
TABLE 1585 BAHRAIN MINERAL FILLERS IN PLASTIC COMPOUNDING MARKET, BY TYPE, 2018-2032 (USD THOUSAND)
TABLE 1586 BAHRAIN REINFORCEMENTS IN PLASTIC COMPOUNDING MARKET, BY TYPE, 2018-2032 (USD THOUSAND)
TABLE 1587 BAHRAIN ADDITIVES IN PLASTIC COMPOUNDING MARKET, BY TYPE, 2018-2032 (USD THOUSAND)
TABLE 1588 BAHRAIN PLASTIC COMPOUNDING MARKET, BY MANUFACTURING PROCESS, 2018-2032 (USD THOUSAND)
TABLE 1589 BAHRAIN PLASTIC COMPOUNDING MARKET, BY MANUFACTURING PROCESS, 2018-2032 (KILO TONS)
TABLE 1590 BAHRAIN EXTRUSION IN PLASTIC COMPOUNDING MARKET, BY TYPE, 2018-2032 (USD THOUSAND)
TABLE 1591 BAHRAIN EXTRUSION IN PLASTIC COMPOUNDING MARKET, BY PELLETIZING SYSTEM, 2018-2032 (USD THOUSAND)
TABLE 1592 BAHRAIN INJECTION MOLDING BASED COMPOUNDING IN PLASTIC COMPOUNDING MARKET, BY PELLETIZING SYSTEM, 2018-2032 (USD THOUSAND)
TABLE 1593 BAHRAIN COMPACTION/PRESSING IN PLASTIC COMPOUNDING MARKET, BY PELLETIZING SYSTEM, 2018-2032 (USD THOUSAND)
TABLE 1594 BAHRAIN KNEADER/BANBURY MIXING IN PLASTIC COMPOUNDING MARKET, BY PELLETIZING SYSTEM, 2018-2032 (USD THOUSAND)
TABLE 1595 BAHRAIN PLASTIC COMPOUNDING MARKET, BY PROPERTIES, 2018-2032 (USD THOUSAND)
TABLE 1596 BAHRAIN PLASTIC COMPOUNDING MARKET, BY APPLICATION, 2018-2032 (USD THOUSAND)
TABLE 1597 BAHRAIN PLASTIC COMPOUNDING MARKET, BY APPLICATION, 2018-2032 (KILO TONS)
TABLE 1598 BAHRAIN AUTOMOTIVE IN PLASTIC COMPOUNDING MARKET, BY CATEGORY, 2018-2032 (USD THOUSAND)
TABLE 1599 BAHRAIN INTERIOR COMPONENTS IN PLASTIC COMPOUNDING MARKET, BY TYPE, 2018-2032 (USD THOUSAND)
TABLE 1600 BAHRAIN EXTERIOR BODY PARTS IN PLASTIC COMPOUNDING MARKET, BY TYPE, 2018-2032 (USD THOUSAND)
TABLE 1601 BAHRAIN UNDER-THE-HOOD APPLICATIONS IN PLASTIC COMPOUNDING MARKET, BY TYPE, 2018-2032 (USD THOUSAND)
TABLE 1602 BAHRAIN PACKAGING IN PLASTIC COMPOUNDING MARKET, BY CATEGORY, 2018-2032 (USD THOUSAND)
TABLE 1603 BAHRAIN FOOD & BEVERAGE PACKAGING IN PLASTIC COMPOUNDING MARKET, BY TYPE, 2018-2032 (USD THOUSAND)
TABLE 1604 BAHRAIN INDUSTRIAL PACKAGING IN PLASTIC COMPOUNDING MARKET, BY TYPE, 2018-2032 (USD THOUSAND)
TABLE 1605 BAHRAIN CONSUMER GOODS PACKAGING IN PLASTIC COMPOUNDING MARKET, BY TYPE, 2018-2032 (USD THOUSAND)
TABLE 1606 BAHRAIN BUILDING & CONSTRUCTION IN PLASTIC COMPOUNDING MARKET, BY CATEGORY, 2018-2032 (USD THOUSAND)
TABLE 1607 BAHRAIN ELECTRICAL & ELECTRONICS IN PLASTIC COMPOUNDING MARKET, BY CATEGORY, 2018-2032 (USD THOUSAND)
TABLE 1608 BAHRAIN MEDICAL DEVICES IN PLASTIC COMPOUNDING MARKET, BY CATEGORY, 2018-2032 (USD THOUSAND)
TABLE 1609 BAHRAIN FURNITURE IN PLASTIC COMPOUNDING MARKET, BY CATEGORY, 2018-2032 (USD THOUSAND)
TABLE 1610 BAHRAIN ENERGY AND POWER IN PLASTIC COMPOUNDING MARKET, BY CATEGORY, 2018-2032 (USD THOUSAND)
TABLE 1611 BAHRAIN AEROSPACE AND DEFENSE IN PLASTIC COMPOUNDING MARKET, BY CATEGORY, 2018-2032 (USD THOUSAND)
TABLE 1612 REST OF MIDDLE EAST AND AFRICA PLASTIC COMPOUNDING MARKET, BY POLYMER TYPE, 2018-2032 (USD THOUSAND)
TABLE 1613 REST OF MIDDLE EAST AND AFRICA PLASTIC COMPOUNDING MARKET, BY POLYMER TYPE, 2018-2032 (KILO TONS)
TABLE 1614 SOUTH AMERICA PLASTIC COMPOUNDING MARKET, BY COUNTRY, 2018-2032 (USD THOUSAND)
TABLE 1615 SOUTH AMERICA PLASTIC COMPOUNDING MARKET, BY COUNTRY, 2018-2032 (KILO TONS)
TABLE 1616 SOUTH AMERICA PLASTIC COMPOUNDING MARKET, BY POLYMER TYPE, 2018-2032 (USD THOUSAND)
TABLE 1617 SOUTH AMERICA PLASTIC COMPOUNDING MARKET, BY POLYMER TYPE, 2018-2032 (KILO TONS)
TABLE 1618 SOUTH AMERICA THERMOPLASTICS IN PLASTIC COMPOUNDING MARKET, BY TYPE, 2018-2032 (USD THOUSAND)
TABLE 1619 SOUTH AMERICA POLYETHYLENE (PE) IN PLASTIC COMPOUNDING MARKET, BY TYPE, 2018-2032 (USD THOUSAND)
TABLE 1620 SOUTH AMERICA ENGINEERING PLASTICS IN PLASTIC COMPOUNDING MARKET, BY TYPE, 2018-2032 (USD THOUSAND)
TABLE 1621 SOUTH AMERICA THERMOSETTING PLASTICS IN PLASTIC COMPOUNDING MARKET, BY TYPE, 2018-2032 (USD THOUSAND)
TABLE 1622 SOUTH AMERICA BIOPLASTICS IN PLASTIC COMPOUNDING MARKET, BY TYPE, 2018-2032 (USD THOUSAND)
TABLE 1623 SOUTH AMERICA PLASTIC COMPOUNDING MARKET, BY FILLER TYPE, 2018-2032 (USD THOUSAND)
TABLE 1624 SOUTH AMERICA MINERAL FILLERS IN PLASTIC COMPOUNDING MARKET, BY TYPE, 2018-2032 (USD THOUSAND)
TABLE 1625 SOUTH AMERICA REINFORCEMENTS IN PLASTIC COMPOUNDING MARKET, BY TYPE, 2018-2032 (USD THOUSAND)
TABLE 1626 SOUTH AMERICA ADDITIVES IN PLASTIC COMPOUNDING MARKET, BY TYPE, 2018-2032 (USD THOUSAND)
TABLE 1627 SOUTH AMERICA PLASTIC COMPOUNDING MARKET, BY MANUFACTURING PROCESS, 2018-2032 (USD THOUSAND)
TABLE 1628 SOUTH AMERICA PLASTIC COMPOUNDING MARKET, BY MANUFACTURING PROCESS, 2018-2032 (KILO TONS)
TABLE 1629 SOUTH AMERICA EXTRUSION IN PLASTIC COMPOUNDING MARKET, BY TYPE, 2018-2032 (USD THOUSAND)
TABLE 1630 SOUTH AMERICA EXTRUSION IN PLASTIC COMPOUNDING MARKET, BY PELLETIZING SYSTEM, 2018-2032 (USD THOUSAND)
TABLE 1631 SOUTH AMERICA INJECTION MOLDING BASED COMPOUNDING IN PLASTIC COMPOUNDING MARKET, BY PELLETIZING SYSTEM, 2018-2032 (USD THOUSAND)
TABLE 1632 SOUTH AMERICA COMPACTION/PRESSING IN PLASTIC COMPOUNDING MARKET, BY PELLETIZING SYSTEM, 2018-2032 (USD THOUSAND)
TABLE 1633 SOUTH AMERICA KNEADER/BANBURY MIXING IN PLASTIC COMPOUNDING MARKET, BY PELLETIZING SYSTEM, 2018-2032 (USD THOUSAND)
TABLE 1634 SOUTH AMERICA PLASTIC COMPOUNDING MARKET, BY PROPERTIES, 2018-2032 (USD THOUSAND)
TABLE 1635 SOUTH AMERICA PLASTIC COMPOUNDING MARKET, BY APPLICATION, 2018-2032 (USD THOUSAND)
TABLE 1636 SOUTH AMERICA PLASTIC COMPOUNDING MARKET, BY APPLICATION, 2018-2032 (KILO TONS)
TABLE 1637 SOUTH AMERICA AUTOMOTIVE IN PLASTIC COMPOUNDING MARKET, BY CATEGORY, 2018-2032 (USD THOUSAND)
TABLE 1638 SOUTH AMERICA INTERIOR COMPONENTS IN PLASTIC COMPOUNDING MARKET, BY TYPE, 2018-2032 (USD THOUSAND)
TABLE 1639 SOUTH AMERICA EXTERIOR BODY PARTS IN PLASTIC COMPOUNDING MARKET, BY TYPE, 2018-2032 (USD THOUSAND)
TABLE 1640 SOUTH AMERICA UNDER-THE-HOOD APPLICATIONS IN PLASTIC COMPOUNDING MARKET, BY TYPE, 2018-2032 (USD THOUSAND)
TABLE 1641 SOUTH AMERICA PACKAGING IN PLASTIC COMPOUNDING MARKET, BY CATEGORY, 2018-2032 (USD THOUSAND)
TABLE 1642 SOUTH AMERICA FOOD & BEVERAGE PACKAGING IN PLASTIC COMPOUNDING MARKET, BY TYPE, 2018-2032 (USD THOUSAND)
TABLE 1643 SOUTH AMERICA INDUSTRIAL PACKAGING IN PLASTIC COMPOUNDING MARKET, BY TYPE, 2018-2032 (USD THOUSAND)
TABLE 1644 SOUTH AMERICA CONSUMER GOODS PACKAGING IN PLASTIC COMPOUNDING MARKET, BY TYPE, 2018-2032 (USD THOUSAND)
TABLE 1645 SOUTH AMERICA BUILDING & CONSTRUCTION IN PLASTIC COMPOUNDING MARKET, BY CATEGORY, 2018-2032 (USD THOUSAND)
TABLE 1646 SOUTH AMERICA ELECTRICAL & ELECTRONICS IN PLASTIC COMPOUNDING MARKET, BY CATEGORY, 2018-2032 (USD THOUSAND)
TABLE 1647 SOUTH AMERICA MEDICAL DEVICES IN PLASTIC COMPOUNDING MARKET, BY CATEGORY, 2018-2032 (USD THOUSAND)
TABLE 1648 SOUTH AMERICA FURNITURE IN PLASTIC COMPOUNDING MARKET, BY CATEGORY, 2018-2032 (USD THOUSAND)
TABLE 1649 SOUTH AMERICA ENERGY AND POWER IN PLASTIC COMPOUNDING MARKET, BY CATEGORY, 2018-2032 (USD THOUSAND)
TABLE 1650 SOUTH AMERICA AEROSPACE AND DEFENSE IN PLASTIC COMPOUNDING MARKET, BY CATEGORY, 2018-2032 (USD THOUSAND)
TABLE 1651 BRAZIL PLASTIC COMPOUNDING MARKET, BY POLYMER TYPE, 2018-2032 (USD THOUSAND)
TABLE 1652 BRAZIL PLASTIC COMPOUNDING MARKET, BY POLYMER TYPE, 2018-2032 (KILO TONS)
TABLE 1653 BRAZIL THERMOPLASTICS IN PLASTIC COMPOUNDING MARKET, BY TYPE, 2018-2032 (USD THOUSAND)
TABLE 1654 BRAZIL POLYETHYLENE (PE) IN PLASTIC COMPOUNDING MARKET, BY TYPE, 2018-2032 (USD THOUSAND)
TABLE 1655 BRAZIL ENGINEERING PLASTICS IN PLASTIC COMPOUNDING MARKET, BY TYPE, 2018-2032 (USD THOUSAND)
TABLE 1656 BRAZIL THERMOSETTING PLASTICS IN PLASTIC COMPOUNDING MARKET, BY TYPE, 2018-2032 (USD THOUSAND)
TABLE 1657 BRAZIL BIOPLASTICS IN PLASTIC COMPOUNDING MARKET, BY TYPE, 2018-2032 (USD THOUSAND)
TABLE 1658 BRAZIL PLASTIC COMPOUNDING MARKET, BY FILLER TYPE, 2018-2032 (USD THOUSAND)
TABLE 1659 BRAZIL MINERAL FILLERS IN PLASTIC COMPOUNDING MARKET, BY TYPE, 2018-2032 (USD THOUSAND)
TABLE 1660 BRAZIL REINFORCEMENTS IN PLASTIC COMPOUNDING MARKET, BY TYPE, 2018-2032 (USD THOUSAND)
TABLE 1661 BRAZIL ADDITIVES IN PLASTIC COMPOUNDING MARKET, BY TYPE, 2018-2032 (USD THOUSAND)
TABLE 1662 BRAZIL PLASTIC COMPOUNDING MARKET, BY MANUFACTURING PROCESS, 2018-2032 (USD THOUSAND)
TABLE 1663 BRAZIL PLASTIC COMPOUNDING MARKET, BY MANUFACTURING PROCESS, 2018-2032 (KILO TONS)
TABLE 1664 BRAZIL EXTRUSION IN PLASTIC COMPOUNDING MARKET, BY TYPE, 2018-2032 (USD THOUSAND)
TABLE 1665 BRAZIL EXTRUSION IN PLASTIC COMPOUNDING MARKET, BY PELLETIZING SYSTEM, 2018-2032 (USD THOUSAND)
TABLE 1666 BRAZIL INJECTION MOLDING BASED COMPOUNDING IN PLASTIC COMPOUNDING MARKET, BY PELLETIZING SYSTEM, 2018-2032 (USD THOUSAND)
TABLE 1667 BRAZIL COMPACTION/PRESSING IN PLASTIC COMPOUNDING MARKET, BY PELLETIZING SYSTEM, 2018-2032 (USD THOUSAND)
TABLE 1668 BRAZIL KNEADER/BANBURY MIXING IN PLASTIC COMPOUNDING MARKET, BY PELLETIZING SYSTEM, 2018-2032 (USD THOUSAND)
TABLE 1669 BRAZIL PLASTIC COMPOUNDING MARKET, BY PROPERTIES, 2018-2032 (USD THOUSAND)
TABLE 1670 BRAZIL PLASTIC COMPOUNDING MARKET, BY APPLICATION, 2018-2032 (USD THOUSAND)
TABLE 1671 BRAZIL PLASTIC COMPOUNDING MARKET, BY APPLICATION, 2018-2032 (KILO TONS)..
TABLE 1672 BRAZIL AUTOMOTIVE IN PLASTIC COMPOUNDING MARKET, BY CATEGORY, 2018-2032 (USD THOUSAND)
TABLE 1673 BRAZIL INTERIOR COMPONENTS IN PLASTIC COMPOUNDING MARKET, BY TYPE, 2018-2032 (USD THOUSAND)
TABLE 1674 BRAZIL EXTERIOR BODY PARTS IN PLASTIC COMPOUNDING MARKET, BY TYPE, 2018-2032 (USD THOUSAND)
TABLE 1675 BRAZIL UNDER-THE-HOOD APPLICATIONS IN PLASTIC COMPOUNDING MARKET, BY TYPE, 2018-2032 (USD THOUSAND)
TABLE 1676 BRAZIL PACKAGING IN PLASTIC COMPOUNDING MARKET, BY CATEGORY, 2018-2032 (USD THOUSAND)
TABLE 1677 BRAZIL FOOD & BEVERAGE PACKAGING IN PLASTIC COMPOUNDING MARKET, BY TYPE, 2018-2032 (USD THOUSAND)
TABLE 1678 BRAZIL INDUSTRIAL PACKAGING IN PLASTIC COMPOUNDING MARKET, BY TYPE, 2018-2032 (USD THOUSAND)
TABLE 1679 BRAZIL CONSUMER GOODS PACKAGING IN PLASTIC COMPOUNDING MARKET, BY TYPE, 2018-2032 (USD THOUSAND)
TABLE 1680 BRAZIL BUILDING & CONSTRUCTION IN PLASTIC COMPOUNDING MARKET, BY CATEGORY, 2018-2032 (USD THOUSAND)
TABLE 1681 BRAZIL ELECTRICAL & ELECTRONICS IN PLASTIC COMPOUNDING MARKET, BY CATEGORY, 2018-2032 (USD THOUSAND)
TABLE 1682 BRAZIL MEDICAL DEVICES IN PLASTIC COMPOUNDING MARKET, BY CATEGORY, 2018-2032 (USD THOUSAND)
TABLE 1683 BRAZIL FURNITURE IN PLASTIC COMPOUNDING MARKET, BY CATEGORY, 2018-2032 (USD THOUSAND)
TABLE 1684 BRAZIL ENERGY AND POWER IN PLASTIC COMPOUNDING MARKET, BY CATEGORY, 2018-2032 (USD THOUSAND)
TABLE 1685 BRAZIL AEROSPACE AND DEFENSE IN PLASTIC COMPOUNDING MARKET, BY CATEGORY, 2018-2032 (USD THOUSAND)
TABLE 1686 ARGENTINA PLASTIC COMPOUNDING MARKET, BY POLYMER TYPE, 2018-2032 (USD THOUSAND)
TABLE 1687 ARGENTINA PLASTIC COMPOUNDING MARKET, BY POLYMER TYPE, 2018-2032 (KILO TONS)
TABLE 1688 ARGENTINA THERMOPLASTICS IN PLASTIC COMPOUNDING MARKET, BY TYPE, 2018-2032 (USD THOUSAND)
TABLE 1689 ARGENTINA POLYETHYLENE (PE) IN PLASTIC COMPOUNDING MARKET, BY TYPE, 2018-2032 (USD THOUSAND)
TABLE 1690 ARGENTINA ENGINEERING PLASTICS IN PLASTIC COMPOUNDING MARKET, BY TYPE, 2018-2032 (USD THOUSAND)
TABLE 1691 ARGENTINA THERMOSETTING PLASTICS IN PLASTIC COMPOUNDING MARKET, BY TYPE, 2018-2032 (USD THOUSAND)
TABLE 1692 ARGENTINA BIOPLASTICS IN PLASTIC COMPOUNDING MARKET, BY TYPE, 2018-2032 (USD THOUSAND)
TABLE 1693 ARGENTINA PLASTIC COMPOUNDING MARKET, BY FILLER TYPE, 2018-2032 (USD THOUSAND)
TABLE 1694 ARGENTINA MINERAL FILLERS IN PLASTIC COMPOUNDING MARKET, BY TYPE, 2018-2032 (USD THOUSAND)
TABLE 1695 ARGENTINA REINFORCEMENTS IN PLASTIC COMPOUNDING MARKET, BY TYPE, 2018-2032 (USD THOUSAND)
TABLE 1696 ARGENTINA ADDITIVES IN PLASTIC COMPOUNDING MARKET, BY TYPE, 2018-2032 (USD THOUSAND)
TABLE 1697 ARGENTINA PLASTIC COMPOUNDING MARKET, BY MANUFACTURING PROCESS, 2018-2032 (USD THOUSAND)
TABLE 1698 ARGENTINA PLASTIC COMPOUNDING MARKET, BY MANUFACTURING PROCESS, 2018-2032 (KILO TONS)
TABLE 1699 ARGENTINA EXTRUSION IN PLASTIC COMPOUNDING MARKET, BY TYPE, 2018-2032 (USD THOUSAND)
TABLE 1700 ARGENTINA EXTRUSION IN PLASTIC COMPOUNDING MARKET, BY PELLETIZING SYSTEM, 2018-2032 (USD THOUSAND)
TABLE 1701 ARGENTINA INJECTION MOLDING BASED COMPOUNDING IN PLASTIC COMPOUNDING MARKET, BY PELLETIZING SYSTEM, 2018-2032 (USD THOUSAND)
TABLE 1702 ARGENTINA COMPACTION/PRESSING IN PLASTIC COMPOUNDING MARKET, BY PELLETIZING SYSTEM, 2018-2032 (USD THOUSAND)
TABLE 1703 ARGENTINA KNEADER/BANBURY MIXING IN PLASTIC COMPOUNDING MARKET, BY PELLETIZING SYSTEM, 2018-2032 (USD THOUSAND)
TABLE 1704 ARGENTINA PLASTIC COMPOUNDING MARKET, BY PROPERTIES, 2018-2032 (USD THOUSAND)
TABLE 1705 ARGENTINA PLASTIC COMPOUNDING MARKET, BY APPLICATION, 2018-2032 (USD THOUSAND)
TABLE 1706 ARGENTINA PLASTIC COMPOUNDING MARKET, BY APPLICATION, 2018-2032 (KILO TONS)
TABLE 1707 ARGENTINA AUTOMOTIVE IN PLASTIC COMPOUNDING MARKET, BY CATEGORY, 2018-2032 (USD THOUSAND)
TABLE 1708 ARGENTINA INTERIOR COMPONENTS IN PLASTIC COMPOUNDING MARKET, BY TYPE, 2018-2032 (USD THOUSAND)
TABLE 1709 ARGENTINA EXTERIOR BODY PARTS IN PLASTIC COMPOUNDING MARKET, BY TYPE, 2018-2032 (USD THOUSAND)
TABLE 1710 ARGENTINA UNDER-THE-HOOD APPLICATIONS IN PLASTIC COMPOUNDING MARKET, BY TYPE, 2018-2032 (USD THOUSAND)
TABLE 1711 ARGENTINA PACKAGING IN PLASTIC COMPOUNDING MARKET, BY CATEGORY, 2018-2032 (USD THOUSAND)
TABLE 1712 ARGENTINA FOOD & BEVERAGE PACKAGING IN PLASTIC COMPOUNDING MARKET, BY TYPE, 2018-2032 (USD THOUSAND)
TABLE 1713 ARGENTINA INDUSTRIAL PACKAGING IN PLASTIC COMPOUNDING MARKET, BY TYPE, 2018-2032 (USD THOUSAND)
TABLE 1714 ARGENTINA CONSUMER GOODS PACKAGING IN PLASTIC COMPOUNDING MARKET, BY TYPE, 2018-2032 (USD THOUSAND)
TABLE 1715 ARGENTINA BUILDING & CONSTRUCTION IN PLASTIC COMPOUNDING MARKET, BY CATEGORY, 2018-2032 (USD THOUSAND)
TABLE 1716 ARGENTINA ELECTRICAL & ELECTRONICS IN PLASTIC COMPOUNDING MARKET, BY CATEGORY, 2018-2032 (USD THOUSAND)
TABLE 1717 ARGENTINA MEDICAL DEVICES IN PLASTIC COMPOUNDING MARKET, BY CATEGORY, 2018-2032 (USD THOUSAND)
TABLE 1718 ARGENTINA FURNITURE IN PLASTIC COMPOUNDING MARKET, BY CATEGORY, 2018-2032 (USD THOUSAND)
TABLE 1719 ARGENTINA ENERGY AND POWER IN PLASTIC COMPOUNDING MARKET, BY CATEGORY, 2018-2032 (USD THOUSAND)
TABLE 1720 ARGENTINA AEROSPACE AND DEFENSE IN PLASTIC COMPOUNDING MARKET, BY CATEGORY, 2018-2032 (USD THOUSAND)
TABLE 1721 COLOMBIA PLASTIC COMPOUNDING MARKET, BY POLYMER TYPE, 2018-2032 (USD THOUSAND)
TABLE 1722 COLOMBIA PLASTIC COMPOUNDING MARKET, BY POLYMER TYPE, 2018-2032 (KILO TONS)
TABLE 1723 COLOMBIA THERMOPLASTICS IN PLASTIC COMPOUNDING MARKET, BY TYPE, 2018-2032 (USD THOUSAND)
TABLE 1724 COLOMBIA POLYETHYLENE (PE) IN PLASTIC COMPOUNDING MARKET, BY TYPE, 2018-2032 (USD THOUSAND)
TABLE 1725 COLOMBIA ENGINEERING PLASTICS IN PLASTIC COMPOUNDING MARKET, BY TYPE, 2018-2032 (USD THOUSAND)
TABLE 1726 COLOMBIA THERMOSETTING PLASTICS IN PLASTIC COMPOUNDING MARKET, BY TYPE, 2018-2032 (USD THOUSAND)
TABLE 1727 COLOMBIA BIOPLASTICS IN PLASTIC COMPOUNDING MARKET, BY TYPE, 2018-2032 (USD THOUSAND)
TABLE 1728 COLOMBIA PLASTIC COMPOUNDING MARKET, BY FILLER TYPE, 2018-2032 (USD THOUSAND)
TABLE 1729 COLOMBIA MINERAL FILLERS IN PLASTIC COMPOUNDING MARKET, BY TYPE, 2018-2032 (USD THOUSAND)
TABLE 1730 COLOMBIA REINFORCEMENTS IN PLASTIC COMPOUNDING MARKET, BY TYPE, 2018-2032 (USD THOUSAND)
TABLE 1731 COLOMBIA ADDITIVES IN PLASTIC COMPOUNDING MARKET, BY TYPE, 2018-2032 (USD THOUSAND)
TABLE 1732 COLOMBIA PLASTIC COMPOUNDING MARKET, BY MANUFACTURING PROCESS, 2018-2032 (USD THOUSAND)
TABLE 1733 COLOMBIA PLASTIC COMPOUNDING MARKET, BY MANUFACTURING PROCESS, 2018-2032 (KILO TONS)
TABLE 1734 COLOMBIA EXTRUSION IN PLASTIC COMPOUNDING MARKET, BY TYPE, 2018-2032 (USD THOUSAND)
TABLE 1735 COLOMBIA EXTRUSION IN PLASTIC COMPOUNDING MARKET, BY PELLETIZING SYSTEM, 2018-2032 (USD THOUSAND)
TABLE 1736 COLOMBIA INJECTION MOLDING BASED COMPOUNDING IN PLASTIC COMPOUNDING MARKET, BY PELLETIZING SYSTEM, 2018-2032 (USD THOUSAND)
TABLE 1737 COLOMBIA COMPACTION/PRESSING IN PLASTIC COMPOUNDING MARKET, BY PELLETIZING SYSTEM, 2018-2032 (USD THOUSAND)
TABLE 1738 COLOMBIA KNEADER/BANBURY MIXING IN PLASTIC COMPOUNDING MARKET, BY PELLETIZING SYSTEM, 2018-2032 (USD THOUSAND)
TABLE 1739 COLOMBIA PLASTIC COMPOUNDING MARKET, BY PROPERTIES, 2018-2032 (USD THOUSAND)
TABLE 1740 COLOMBIA PLASTIC COMPOUNDING MARKET, BY APPLICATION, 2018-2032 (USD THOUSAND)
TABLE 1741 COLOMBIA PLASTIC COMPOUNDING MARKET, BY APPLICATION, 2018-2032 (KILO TONS)
TABLE 1742 COLOMBIA AUTOMOTIVE IN PLASTIC COMPOUNDING MARKET, BY CATEGORY, 2018-2032 (USD THOUSAND)
TABLE 1743 COLOMBIA INTERIOR COMPONENTS IN PLASTIC COMPOUNDING MARKET, BY TYPE, 2018-2032 (USD THOUSAND)
TABLE 1744 COLOMBIA EXTERIOR BODY PARTS IN PLASTIC COMPOUNDING MARKET, BY TYPE, 2018-2032 (USD THOUSAND)
TABLE 1745 COLOMBIA UNDER-THE-HOOD APPLICATIONS IN PLASTIC COMPOUNDING MARKET, BY TYPE, 2018-2032 (USD THOUSAND)
TABLE 1746 COLOMBIA PACKAGING IN PLASTIC COMPOUNDING MARKET, BY CATEGORY, 2018-2032 (USD THOUSAND)
TABLE 1747 COLOMBIA FOOD & BEVERAGE PACKAGING IN PLASTIC COMPOUNDING MARKET, BY TYPE, 2018-2032 (USD THOUSAND)
TABLE 1748 COLOMBIA INDUSTRIAL PACKAGING IN PLASTIC COMPOUNDING MARKET, BY TYPE, 2018-2032 (USD THOUSAND)
TABLE 1749 COLOMBIA CONSUMER GOODS PACKAGING IN PLASTIC COMPOUNDING MARKET, BY TYPE, 2018-2032 (USD THOUSAND)
TABLE 1750 COLOMBIA BUILDING & CONSTRUCTION IN PLASTIC COMPOUNDING MARKET, BY CATEGORY, 2018-2032 (USD THOUSAND)
TABLE 1751 COLOMBIA ELECTRICAL & ELECTRONICS IN PLASTIC COMPOUNDING MARKET, BY CATEGORY, 2018-2032 (USD THOUSAND)
TABLE 1752 COLOMBIA MEDICAL DEVICES IN PLASTIC COMPOUNDING MARKET, BY CATEGORY, 2018-2032 (USD THOUSAND)
TABLE 1753 COLOMBIA FURNITURE IN PLASTIC COMPOUNDING MARKET, BY CATEGORY, 2018-2032 (USD THOUSAND)
TABLE 1754 COLOMBIA ENERGY AND POWER IN PLASTIC COMPOUNDING MARKET, BY CATEGORY, 2018-2032 (USD THOUSAND)
TABLE 1755 COLOMBIA AEROSPACE AND DEFENSE IN PLASTIC COMPOUNDING MARKET, BY CATEGORY, 2018-2032 (USD THOUSAND)
TABLE 1756 CHILE PLASTIC COMPOUNDING MARKET, BY POLYMER TYPE, 2018-2032 (USD THOUSAND)
TABLE 1757 CHILE PLASTIC COMPOUNDING MARKET, BY POLYMER TYPE, 2018-2032 (KILO TONS)
TABLE 1758 CHILE THERMOPLASTICS IN PLASTIC COMPOUNDING MARKET, BY TYPE, 2018-2032 (USD THOUSAND)
TABLE 1759 CHILE POLYETHYLENE (PE) IN PLASTIC COMPOUNDING MARKET, BY TYPE, 2018-2032 (USD THOUSAND)
TABLE 1760 CHILE ENGINEERING PLASTICS IN PLASTIC COMPOUNDING MARKET, BY TYPE, 2018-2032 (USD THOUSAND)
TABLE 1761 CHILE THERMOSETTING PLASTICS IN PLASTIC COMPOUNDING MARKET, BY TYPE, 2018-2032 (USD THOUSAND)
TABLE 1762 CHILE BIOPLASTICS IN PLASTIC COMPOUNDING MARKET, BY TYPE, 2018-2032 (USD THOUSAND)
TABLE 1763 CHILE PLASTIC COMPOUNDING MARKET, BY FILLER TYPE, 2018-2032 (USD THOUSAND)
TABLE 1764 CHILE MINERAL FILLERS IN PLASTIC COMPOUNDING MARKET, BY TYPE, 2018-2032 (USD THOUSAND)
TABLE 1765 CHILE REINFORCEMENTS IN PLASTIC COMPOUNDING MARKET, BY TYPE, 2018-2032 (USD THOUSAND)
TABLE 1766 CHILE ADDITIVES IN PLASTIC COMPOUNDING MARKET, BY TYPE, 2018-2032 (USD THOUSAND)
TABLE 1767 CHILE PLASTIC COMPOUNDING MARKET, BY MANUFACTURING PROCESS, 2018-2032 (USD THOUSAND)
TABLE 1768 CHILE PLASTIC COMPOUNDING MARKET, BY MANUFACTURING PROCESS, 2018-2032 (KILO TONS)
TABLE 1769 CHILE EXTRUSION IN PLASTIC COMPOUNDING MARKET, BY TYPE, 2018-2032 (USD THOUSAND)
TABLE 1770 CHILE EXTRUSION IN PLASTIC COMPOUNDING MARKET, BY PELLETIZING SYSTEM, 2018-2032 (USD THOUSAND)
TABLE 1771 CHILE INJECTION MOLDING BASED COMPOUNDING IN PLASTIC COMPOUNDING MARKET, BY PELLETIZING SYSTEM, 2018-2032 (USD THOUSAND)
TABLE 1772 CHILE COMPACTION/PRESSING IN PLASTIC COMPOUNDING MARKET, BY PELLETIZING SYSTEM, 2018-2032 (USD THOUSAND)
TABLE 1773 CHILE KNEADER/BANBURY MIXING IN PLASTIC COMPOUNDING MARKET, BY PELLETIZING SYSTEM, 2018-2032 (USD THOUSAND)
TABLE 1774 CHILE PLASTIC COMPOUNDING MARKET, BY PROPERTIES, 2018-2032 (USD THOUSAND)
TABLE 1775 CHILE PLASTIC COMPOUNDING MARKET, BY APPLICATION, 2018-2032 (USD THOUSAND)
TABLE 1776 CHILE PLASTIC COMPOUNDING MARKET, BY APPLICATION, 2018-2032 (KILO TONS)
TABLE 1777 CHILE AUTOMOTIVE IN PLASTIC COMPOUNDING MARKET, BY CATEGORY, 2018-2032 (USD THOUSAND)
TABLE 1778 CHILE INTERIOR COMPONENTS IN PLASTIC COMPOUNDING MARKET, BY TYPE, 2018-2032 (USD THOUSAND)
TABLE 1779 CHILE EXTERIOR BODY PARTS IN PLASTIC COMPOUNDING MARKET, BY TYPE, 2018-2032 (USD THOUSAND)
TABLE 1780 CHILE UNDER-THE-HOOD APPLICATIONS IN PLASTIC COMPOUNDING MARKET, BY TYPE, 2018-2032 (USD THOUSAND)
TABLE 1781 CHILE PACKAGING IN PLASTIC COMPOUNDING MARKET, BY CATEGORY, 2018-2032 (USD THOUSAND)
TABLE 1782 CHILE FOOD & BEVERAGE PACKAGING IN PLASTIC COMPOUNDING MARKET, BY TYPE, 2018-2032 (USD THOUSAND)
TABLE 1783 CHILE INDUSTRIAL PACKAGING IN PLASTIC COMPOUNDING MARKET, BY TYPE, 2018-2032 (USD THOUSAND)
TABLE 1784 CHILE CONSUMER GOODS PACKAGING IN PLASTIC COMPOUNDING MARKET, BY TYPE, 2018-2032 (USD THOUSAND)
TABLE 1785 CHILE BUILDING & CONSTRUCTION IN PLASTIC COMPOUNDING MARKET, BY CATEGORY, 2018-2032 (USD THOUSAND)
TABLE 1786 CHILE ELECTRICAL & ELECTRONICS IN PLASTIC COMPOUNDING MARKET, BY CATEGORY, 2018-2032 (USD THOUSAND)
TABLE 1787 CHILE MEDICAL DEVICES IN PLASTIC COMPOUNDING MARKET, BY CATEGORY, 2018-2032 (USD THOUSAND)
TABLE 1788 CHILE FURNITURE IN PLASTIC COMPOUNDING MARKET, BY CATEGORY, 2018-2032 (USD THOUSAND)
TABLE 1789 CHILE ENERGY AND POWER IN PLASTIC COMPOUNDING MARKET, BY CATEGORY, 2018-2032 (USD THOUSAND)
TABLE 1790 CHILE AEROSPACE AND DEFENSE IN PLASTIC COMPOUNDING MARKET, BY CATEGORY, 2018-2032 (USD THOUSAND)
TABLE 1791 PERU PLASTIC COMPOUNDING MARKET, BY POLYMER TYPE, 2018-2032 (USD THOUSAND)
TABLE 1792 PERU PLASTIC COMPOUNDING MARKET, BY POLYMER TYPE, 2018-2032 (KILO TONS)..
TABLE 1793 PERU THERMOPLASTICS IN PLASTIC COMPOUNDING MARKET, BY TYPE, 2018-2032 (USD THOUSAND)
TABLE 1794 PERU POLYETHYLENE (PE) IN PLASTIC COMPOUNDING MARKET, BY TYPE, 2018-2032 (USD THOUSAND)
TABLE 1795 PERU ENGINEERING PLASTICS IN PLASTIC COMPOUNDING MARKET, BY TYPE, 2018-2032 (USD THOUSAND)
TABLE 1796 PERU THERMOSETTING PLASTICS IN PLASTIC COMPOUNDING MARKET, BY TYPE, 2018-2032 (USD THOUSAND)
TABLE 1797 PERU BIOPLASTICS IN PLASTIC COMPOUNDING MARKET, BY TYPE, 2018-2032 (USD THOUSAND)
TABLE 1798 PERU PLASTIC COMPOUNDING MARKET, BY FILLER TYPE, 2018-2032 (USD THOUSAND)
TABLE 1799 PERU MINERAL FILLERS IN PLASTIC COMPOUNDING MARKET, BY TYPE, 2018-2032 (USD THOUSAND)
TABLE 1800 PERU REINFORCEMENTS IN PLASTIC COMPOUNDING MARKET, BY TYPE, 2018-2032 (USD THOUSAND)
TABLE 1801 PERU ADDITIVES IN PLASTIC COMPOUNDING MARKET, BY TYPE, 2018-2032 (USD THOUSAND)
TABLE 1802 PERU PLASTIC COMPOUNDING MARKET, BY MANUFACTURING PROCESS, 2018-2032 (USD THOUSAND)
TABLE 1803 PERU PLASTIC COMPOUNDING MARKET, BY MANUFACTURING PROCESS, 2018-2032 (KILO TONS)
TABLE 1804 PERU EXTRUSION IN PLASTIC COMPOUNDING MARKET, BY TYPE, 2018-2032 (USD THOUSAND)
TABLE 1805 PERU EXTRUSION IN PLASTIC COMPOUNDING MARKET, BY PELLETIZING SYSTEM, 2018-2032 (USD THOUSAND)
TABLE 1806 PERU INJECTION MOLDING BASED COMPOUNDING IN PLASTIC COMPOUNDING MARKET, BY PELLETIZING SYSTEM, 2018-2032 (USD THOUSAND)
TABLE 1807 PERU COMPACTION/PRESSING IN PLASTIC COMPOUNDING MARKET, BY PELLETIZING SYSTEM, 2018-2032 (USD THOUSAND)
TABLE 1808 PERU KNEADER/BANBURY MIXING IN PLASTIC COMPOUNDING MARKET, BY PELLETIZING SYSTEM, 2018-2032 (USD THOUSAND)
TABLE 1809 PERU PLASTIC COMPOUNDING MARKET, BY PROPERTIES, 2018-2032 (USD THOUSAND)
TABLE 1810 PERU PLASTIC COMPOUNDING MARKET, BY APPLICATION, 2018-2032 (USD THOUSAND)
TABLE 1811 PERU PLASTIC COMPOUNDING MARKET, BY APPLICATION, 2018-2032 (KILO TONS)
TABLE 1812 PERU AUTOMOTIVE IN PLASTIC COMPOUNDING MARKET, BY CATEGORY, 2018-2032 (USD THOUSAND)
TABLE 1813 PERU INTERIOR COMPONENTS IN PLASTIC COMPOUNDING MARKET, BY TYPE, 2018-2032 (USD THOUSAND)
TABLE 1814 PERU EXTERIOR BODY PARTS IN PLASTIC COMPOUNDING MARKET, BY TYPE, 2018-2032 (USD THOUSAND)
TABLE 1815 PERU UNDER-THE-HOOD APPLICATIONS IN PLASTIC COMPOUNDING MARKET, BY TYPE, 2018-2032 (USD THOUSAND)
TABLE 1816 PERU PACKAGING IN PLASTIC COMPOUNDING MARKET, BY CATEGORY, 2018-2032 (USD THOUSAND)
TABLE 1817 PERU FOOD & BEVERAGE PACKAGING IN PLASTIC COMPOUNDING MARKET, BY TYPE, 2018-2032 (USD THOUSAND)
TABLE 1818 PERU INDUSTRIAL PACKAGING IN PLASTIC COMPOUNDING MARKET, BY TYPE, 2018-2032 (USD THOUSAND)
TABLE 1819 PERU CONSUMER GOODS PACKAGING IN PLASTIC COMPOUNDING MARKET, BY TYPE, 2018-2032 (USD THOUSAND)
TABLE 1820 PERU BUILDING & CONSTRUCTION IN PLASTIC COMPOUNDING MARKET, BY CATEGORY, 2018-2032 (USD THOUSAND)
TABLE 1821 PERU ELECTRICAL & ELECTRONICS IN PLASTIC COMPOUNDING MARKET, BY CATEGORY, 2018-2032 (USD THOUSAND)
TABLE 1822 PERU MEDICAL DEVICES IN PLASTIC COMPOUNDING MARKET, BY CATEGORY, 2018-2032 (USD THOUSAND)
TABLE 1823 PERU FURNITURE IN PLASTIC COMPOUNDING MARKET, BY CATEGORY, 2018-2032 (USD THOUSAND)
TABLE 1824 PERU ENERGY AND POWER IN PLASTIC COMPOUNDING MARKET, BY CATEGORY, 2018-2032 (USD THOUSAND)
TABLE 1825 PERU AEROSPACE AND DEFENSE IN PLASTIC COMPOUNDING MARKET, BY CATEGORY, 2018-2032 (USD THOUSAND)
TABLE 1826 ECUADOR PLASTIC COMPOUNDING MARKET, BY POLYMER TYPE, 2018-2032 (USD THOUSAND)
TABLE 1827 ECUADOR PLASTIC COMPOUNDING MARKET, BY POLYMER TYPE, 2018-2032 (KILO TONS)
TABLE 1828 ECUADOR THERMOPLASTICS IN PLASTIC COMPOUNDING MARKET, BY TYPE, 2018-2032 (USD THOUSAND)
TABLE 1829 ECUADOR POLYETHYLENE (PE) IN PLASTIC COMPOUNDING MARKET, BY TYPE, 2018-2032 (USD THOUSAND)
TABLE 1830 ECUADOR ENGINEERING PLASTICS IN PLASTIC COMPOUNDING MARKET, BY TYPE, 2018-2032 (USD THOUSAND)
TABLE 1831 ECUADOR THERMOSETTING PLASTICS IN PLASTIC COMPOUNDING MARKET, BY TYPE, 2018-2032 (USD THOUSAND)
TABLE 1832 ECUADOR BIOPLASTICS IN PLASTIC COMPOUNDING MARKET, BY TYPE, 2018-2032 (USD THOUSAND)
TABLE 1833 ECUADOR PLASTIC COMPOUNDING MARKET, BY FILLER TYPE, 2018-2032 (USD THOUSAND)
TABLE 1834 ECUADOR MINERAL FILLERS IN PLASTIC COMPOUNDING MARKET, BY TYPE, 2018-2032 (USD THOUSAND)
TABLE 1835 ECUADOR REINFORCEMENTS IN PLASTIC COMPOUNDING MARKET, BY TYPE, 2018-2032 (USD THOUSAND)
TABLE 1836 ECUADOR ADDITIVES IN PLASTIC COMPOUNDING MARKET, BY TYPE, 2018-2032 (USD THOUSAND)
TABLE 1837 ECUADOR PLASTIC COMPOUNDING MARKET, BY MANUFACTURING PROCESS, 2018-2032 (USD THOUSAND)
TABLE 1838 ECUADOR PLASTIC COMPOUNDING MARKET, BY MANUFACTURING PROCESS, 2018-2032 (KILO TONS)
TABLE 1839 ECUADOR EXTRUSION IN PLASTIC COMPOUNDING MARKET, BY TYPE, 2018-2032 (USD THOUSAND)
TABLE 1840 ECUADOR EXTRUSION IN PLASTIC COMPOUNDING MARKET, BY PELLETIZING SYSTEM, 2018-2032 (USD THOUSAND)
TABLE 1841 ECUADOR INJECTION MOLDING BASED COMPOUNDING IN PLASTIC COMPOUNDING MARKET, BY PELLETIZING SYSTEM, 2018-2032 (USD THOUSAND)
TABLE 1842 ECUADOR COMPACTION/PRESSING IN PLASTIC COMPOUNDING MARKET, BY PELLETIZING SYSTEM, 2018-2032 (USD THOUSAND)
TABLE 1843 ECUADOR KNEADER/BANBURY MIXING IN PLASTIC COMPOUNDING MARKET, BY PELLETIZING SYSTEM, 2018-2032 (USD THOUSAND)
TABLE 1844 ECUADOR PLASTIC COMPOUNDING MARKET, BY PROPERTIES, 2018-2032 (USD THOUSAND)
TABLE 1845 ECUADOR PLASTIC COMPOUNDING MARKET, BY APPLICATION, 2018-2032 (USD THOUSAND)
TABLE 1846 ECUADOR PLASTIC COMPOUNDING MARKET, BY APPLICATION, 2018-2032 (KILO TONS)
TABLE 1847 ECUADOR AUTOMOTIVE IN PLASTIC COMPOUNDING MARKET, BY CATEGORY, 2018-2032 (USD THOUSAND)
TABLE 1848 ECUADOR INTERIOR COMPONENTS IN PLASTIC COMPOUNDING MARKET, BY TYPE, 2018-2032 (USD THOUSAND)
TABLE 1849 ECUADOR EXTERIOR BODY PARTS IN PLASTIC COMPOUNDING MARKET, BY TYPE, 2018-2032 (USD THOUSAND)
TABLE 1850 ECUADOR UNDER-THE-HOOD APPLICATIONS IN PLASTIC COMPOUNDING MARKET, BY TYPE, 2018-2032 (USD THOUSAND)
TABLE 1851 ECUADOR PACKAGING IN PLASTIC COMPOUNDING MARKET, BY CATEGORY, 2018-2032 (USD THOUSAND)
TABLE 1852 ECUADOR FOOD & BEVERAGE PACKAGING IN PLASTIC COMPOUNDING MARKET, BY TYPE, 2018-2032 (USD THOUSAND)
TABLE 1853 ECUADOR INDUSTRIAL PACKAGING IN PLASTIC COMPOUNDING MARKET, BY TYPE, 2018-2032 (USD THOUSAND)
TABLE 1854 ECUADOR CONSUMER GOODS PACKAGING IN PLASTIC COMPOUNDING MARKET, BY TYPE, 2018-2032 (USD THOUSAND)
TABLE 1855 ECUADOR BUILDING & CONSTRUCTION IN PLASTIC COMPOUNDING MARKET, BY CATEGORY, 2018-2032 (USD THOUSAND)
TABLE 1856 ECUADOR ELECTRICAL & ELECTRONICS IN PLASTIC COMPOUNDING MARKET, BY CATEGORY, 2018-2032 (USD THOUSAND)
TABLE 1857 ECUADOR MEDICAL DEVICES IN PLASTIC COMPOUNDING MARKET, BY CATEGORY, 2018-2032 (USD THOUSAND)
TABLE 1858 ECUADOR FURNITURE IN PLASTIC COMPOUNDING MARKET, BY CATEGORY, 2018-2032 (USD THOUSAND)
TABLE 1859 ECUADOR ENERGY AND POWER IN PLASTIC COMPOUNDING MARKET, BY CATEGORY, 2018-2032 (USD THOUSAND)
TABLE 1860 ECUADOR AEROSPACE AND DEFENSE IN PLASTIC COMPOUNDING MARKET, BY CATEGORY, 2018-2032 (USD THOUSAND)
TABLE 1861 VENEZUELA PLASTIC COMPOUNDING MARKET, BY POLYMER TYPE, 2018-2032 (USD THOUSAND)
TABLE 1862 VENEZUELA PLASTIC COMPOUNDING MARKET, BY POLYMER TYPE, 2018-2032 (KILO TONS)
TABLE 1863 VENEZUELA THERMOPLASTICS IN PLASTIC COMPOUNDING MARKET, BY TYPE, 2018-2032 (USD THOUSAND)
TABLE 1864 VENEZUELA POLYETHYLENE (PE) IN PLASTIC COMPOUNDING MARKET, BY TYPE, 2018-2032 (USD THOUSAND)
TABLE 1865 VENEZUELA ENGINEERING PLASTICS IN PLASTIC COMPOUNDING MARKET, BY TYPE, 2018-2032 (USD THOUSAND)
TABLE 1866 VENEZUELA THERMOSETTING PLASTICS IN PLASTIC COMPOUNDING MARKET, BY TYPE, 2018-2032 (USD THOUSAND)
TABLE 1867 VENEZUELA BIOPLASTICS IN PLASTIC COMPOUNDING MARKET, BY TYPE, 2018-2032 (USD THOUSAND)
TABLE 1868 VENEZUELA PLASTIC COMPOUNDING MARKET, BY FILLER TYPE, 2018-2032 (USD THOUSAND)
TABLE 1869 VENEZUELA MINERAL FILLERS IN PLASTIC COMPOUNDING MARKET, BY TYPE, 2018-2032 (USD THOUSAND)
TABLE 1870 VENEZUELA REINFORCEMENTS IN PLASTIC COMPOUNDING MARKET, BY TYPE, 2018-2032 (USD THOUSAND)
TABLE 1871 VENEZUELA ADDITIVES IN PLASTIC COMPOUNDING MARKET, BY TYPE, 2018-2032 (USD THOUSAND)
TABLE 1872 VENEZUELA PLASTIC COMPOUNDING MARKET, BY MANUFACTURING PROCESS, 2018-2032 (USD THOUSAND)
TABLE 1873 VENEZUELA PLASTIC COMPOUNDING MARKET, BY MANUFACTURING PROCESS, 2018-2032 (KILO TONS)
TABLE 1874 VENEZUELA EXTRUSION IN PLASTIC COMPOUNDING MARKET, BY TYPE, 2018-2032 (USD THOUSAND)
TABLE 1875 VENEZUELA EXTRUSION IN PLASTIC COMPOUNDING MARKET, BY PELLETIZING SYSTEM, 2018-2032 (USD THOUSAND)
TABLE 1876 VENEZUELA INJECTION MOLDING BASED COMPOUNDING IN PLASTIC COMPOUNDING MARKET, BY PELLETIZING SYSTEM, 2018-2032 (USD THOUSAND)
TABLE 1877 VENEZUELA COMPACTION/PRESSING IN PLASTIC COMPOUNDING MARKET, BY PELLETIZING SYSTEM, 2018-2032 (USD THOUSAND)
TABLE 1878 VENEZUELA KNEADER/BANBURY MIXING IN PLASTIC COMPOUNDING MARKET, BY PELLETIZING SYSTEM, 2018-2032 (USD THOUSAND)
TABLE 1879 VENEZUELA PLASTIC COMPOUNDING MARKET, BY PROPERTIES, 2018-2032 (USD THOUSAND)
TABLE 1880 VENEZUELA PLASTIC COMPOUNDING MARKET, BY APPLICATION, 2018-2032 (USD THOUSAND)
TABLE 1881 VENEZUELA PLASTIC COMPOUNDING MARKET, BY APPLICATION, 2018-2032 (KILO TONS)
TABLE 1882 VENEZUELA AUTOMOTIVE IN PLASTIC COMPOUNDING MARKET, BY CATEGORY, 2018-2032 (USD THOUSAND)
TABLE 1883 VENEZUELA INTERIOR COMPONENTS IN PLASTIC COMPOUNDING MARKET, BY TYPE, 2018-2032 (USD THOUSAND)
TABLE 1884 VENEZUELA EXTERIOR BODY PARTS IN PLASTIC COMPOUNDING MARKET, BY TYPE, 2018-2032 (USD THOUSAND)
TABLE 1885 VENEZUELA UNDER-THE-HOOD APPLICATIONS IN PLASTIC COMPOUNDING MARKET, BY TYPE, 2018-2032 (USD THOUSAND)
TABLE 1886 VENEZUELA PACKAGING IN PLASTIC COMPOUNDING MARKET, BY CATEGORY, 2018-2032 (USD THOUSAND)
TABLE 1887 VENEZUELA FOOD & BEVERAGE PACKAGING IN PLASTIC COMPOUNDING MARKET, BY TYPE, 2018-2032 (USD THOUSAND)
TABLE 1888 VENEZUELA INDUSTRIAL PACKAGING IN PLASTIC COMPOUNDING MARKET, BY TYPE, 2018-2032 (USD THOUSAND)
TABLE 1889 VENEZUELA CONSUMER GOODS PACKAGING IN PLASTIC COMPOUNDING MARKET, BY TYPE, 2018-2032 (USD THOUSAND)
TABLE 1890 VENEZUELA BUILDING & CONSTRUCTION IN PLASTIC COMPOUNDING MARKET, BY CATEGORY, 2018-2032 (USD THOUSAND)
TABLE 1891 VENEZUELA ELECTRICAL & ELECTRONICS IN PLASTIC COMPOUNDING MARKET, BY CATEGORY, 2018-2032 (USD THOUSAND)
TABLE 1892 VENEZUELA MEDICAL DEVICES IN PLASTIC COMPOUNDING MARKET, BY CATEGORY, 2018-2032 (USD THOUSAND)
TABLE 1893 VENEZUELA FURNITURE IN PLASTIC COMPOUNDING MARKET, BY CATEGORY, 2018-2032 (USD THOUSAND)
TABLE 1894 VENEZUELA ENERGY AND POWER IN PLASTIC COMPOUNDING MARKET, BY CATEGORY, 2018-2032 (USD THOUSAND)
TABLE 1895 VENEZUELA AEROSPACE AND DEFENSE IN PLASTIC COMPOUNDING MARKET, BY CATEGORY, 2018-2032 (USD THOUSAND)
TABLE 1896 BOLIVIA PLASTIC COMPOUNDING MARKET, BY POLYMER TYPE, 2018-2032 (USD THOUSAND)
TABLE 1897 BOLIVIA PLASTIC COMPOUNDING MARKET, BY POLYMER TYPE, 2018-2032 (KILO TONS)
TABLE 1898 BOLIVIA THERMOPLASTICS IN PLASTIC COMPOUNDING MARKET, BY TYPE, 2018-2032 (USD THOUSAND)
TABLE 1899 BOLIVIA POLYETHYLENE (PE) IN PLASTIC COMPOUNDING MARKET, BY TYPE, 2018-2032 (USD THOUSAND)
TABLE 1900 BOLIVIA ENGINEERING PLASTICS IN PLASTIC COMPOUNDING MARKET, BY TYPE, 2018-2032 (USD THOUSAND)
TABLE 1901 BOLIVIA THERMOSETTING PLASTICS IN PLASTIC COMPOUNDING MARKET, BY TYPE, 2018-2032 (USD THOUSAND)
TABLE 1902 BOLIVIA BIOPLASTICS IN PLASTIC COMPOUNDING MARKET, BY TYPE, 2018-2032 (USD THOUSAND)
TABLE 1903 BOLIVIA PLASTIC COMPOUNDING MARKET, BY FILLER TYPE, 2018-2032 (USD THOUSAND)
TABLE 1904 BOLIVIA MINERAL FILLERS IN PLASTIC COMPOUNDING MARKET, BY TYPE, 2018-2032 (USD THOUSAND)
TABLE 1905 BOLIVIA REINFORCEMENTS IN PLASTIC COMPOUNDING MARKET, BY TYPE, 2018-2032 (USD THOUSAND)
TABLE 1906 BOLIVIA ADDITIVES IN PLASTIC COMPOUNDING MARKET, BY TYPE, 2018-2032 (USD THOUSAND)
TABLE 1907 BOLIVIA PLASTIC COMPOUNDING MARKET, BY MANUFACTURING PROCESS, 2018-2032 (USD THOUSAND)
TABLE 1908 BOLIVIA PLASTIC COMPOUNDING MARKET, BY MANUFACTURING PROCESS, 2018-2032 (KILO TONS)
TABLE 1909 BOLIVIA EXTRUSION IN PLASTIC COMPOUNDING MARKET, BY TYPE, 2018-2032 (USD THOUSAND)
TABLE 1910 BOLIVIA EXTRUSION IN PLASTIC COMPOUNDING MARKET, BY PELLETIZING SYSTEM, 2018-2032 (USD THOUSAND)
TABLE 1911 BOLIVIA INJECTION MOLDING BASED COMPOUNDING IN PLASTIC COMPOUNDING MARKET, BY PELLETIZING SYSTEM, 2018-2032 (USD THOUSAND)
TABLE 1912 BOLIVIA COMPACTION/PRESSING IN PLASTIC COMPOUNDING MARKET, BY PELLETIZING SYSTEM, 2018-2032 (USD THOUSAND)
TABLE 1913 BOLIVIA KNEADER/BANBURY MIXING IN PLASTIC COMPOUNDING MARKET, BY PELLETIZING SYSTEM, 2018-2032 (USD THOUSAND)
TABLE 1914 BOLIVIA PLASTIC COMPOUNDING MARKET, BY PROPERTIES, 2018-2032 (USD THOUSAND)
TABLE 1915 BOLIVIA PLASTIC COMPOUNDING MARKET, BY APPLICATION, 2018-2032 (USD THOUSAND)
TABLE 1916 BOLIVIA PLASTIC COMPOUNDING MARKET, BY APPLICATION, 2018-2032 (KILO TONS)
TABLE 1917 BOLIVIA AUTOMOTIVE IN PLASTIC COMPOUNDING MARKET, BY CATEGORY, 2018-2032 (USD THOUSAND)
TABLE 1918 BOLIVIA INTERIOR COMPONENTS IN PLASTIC COMPOUNDING MARKET, BY TYPE, 2018-2032 (USD THOUSAND)
TABLE 1919 BOLIVIA EXTERIOR BODY PARTS IN PLASTIC COMPOUNDING MARKET, BY TYPE, 2018-2032 (USD THOUSAND)
TABLE 1920 BOLIVIA UNDER-THE-HOOD APPLICATIONS IN PLASTIC COMPOUNDING MARKET, BY TYPE, 2018-2032 (USD THOUSAND)
TABLE 1921 BOLIVIA PACKAGING IN PLASTIC COMPOUNDING MARKET, BY CATEGORY, 2018-2032 (USD THOUSAND)
TABLE 1922 BOLIVIA FOOD & BEVERAGE PACKAGING IN PLASTIC COMPOUNDING MARKET, BY TYPE, 2018-2032 (USD THOUSAND)
TABLE 1923 BOLIVIA INDUSTRIAL PACKAGING IN PLASTIC COMPOUNDING MARKET, BY TYPE, 2018-2032 (USD THOUSAND)
TABLE 1924 BOLIVIA CONSUMER GOODS PACKAGING IN PLASTIC COMPOUNDING MARKET, BY TYPE, 2018-2032 (USD THOUSAND)
TABLE 1925 BOLIVIA BUILDING & CONSTRUCTION IN PLASTIC COMPOUNDING MARKET, BY CATEGORY, 2018-2032 (USD THOUSAND)
TABLE 1926 BOLIVIA ELECTRICAL & ELECTRONICS IN PLASTIC COMPOUNDING MARKET, BY CATEGORY, 2018-2032 (USD THOUSAND)
TABLE 1927 BOLIVIA MEDICAL DEVICES IN PLASTIC COMPOUNDING MARKET, BY CATEGORY, 2018-2032 (USD THOUSAND)
TABLE 1928 BOLIVIA FURNITURE IN PLASTIC COMPOUNDING MARKET, BY CATEGORY, 2018-2032 (USD THOUSAND)
TABLE 1929 BOLIVIA ENERGY AND POWER IN PLASTIC COMPOUNDING MARKET, BY CATEGORY, 2018-2032 (USD THOUSAND)
TABLE 1930 BOLIVIA AEROSPACE AND DEFENSE IN PLASTIC COMPOUNDING MARKET, BY CATEGORY, 2018-2032 (USD THOUSAND)
TABLE 1931 PARAGUAY PLASTIC COMPOUNDING MARKET, BY POLYMER TYPE, 2018-2032 (USD THOUSAND)
TABLE 1932 PARAGUAY PLASTIC COMPOUNDING MARKET, BY POLYMER TYPE, 2018-2032 (KILO TONS)
TABLE 1933 PARAGUAY THERMOPLASTICS IN PLASTIC COMPOUNDING MARKET, BY TYPE, 2018-2032 (USD THOUSAND)
TABLE 1934 PARAGUAY POLYETHYLENE (PE) IN PLASTIC COMPOUNDING MARKET, BY TYPE, 2018-2032 (USD THOUSAND)
TABLE 1935 PARAGUAY ENGINEERING PLASTICS IN PLASTIC COMPOUNDING MARKET, BY TYPE, 2018-2032 (USD THOUSAND)
TABLE 1936 PARAGUAY THERMOSETTING PLASTICS IN PLASTIC COMPOUNDING MARKET, BY TYPE, 2018-2032 (USD THOUSAND)
TABLE 1937 PARAGUAY BIOPLASTICS IN PLASTIC COMPOUNDING MARKET, BY TYPE, 2018-2032 (USD THOUSAND)
TABLE 1938 PARAGUAY PLASTIC COMPOUNDING MARKET, BY FILLER TYPE, 2018-2032 (USD THOUSAND)
TABLE 1939 PARAGUAY MINERAL FILLERS IN PLASTIC COMPOUNDING MARKET, BY TYPE, 2018-2032 (USD THOUSAND)
TABLE 1940 PARAGUAY REINFORCEMENTS IN PLASTIC COMPOUNDING MARKET, BY TYPE, 2018-2032 (USD THOUSAND)
TABLE 1941 PARAGUAY ADDITIVES IN PLASTIC COMPOUNDING MARKET, BY TYPE, 2018-2032 (USD THOUSAND)
TABLE 1942 PARAGUAY PLASTIC COMPOUNDING MARKET, BY MANUFACTURING PROCESS, 2018-2032 (USD THOUSAND)
TABLE 1943 PARAGUAY PLASTIC COMPOUNDING MARKET, BY MANUFACTURING PROCESS, 2018-2032 (KILO TONS)
TABLE 1944 PARAGUAY EXTRUSION IN PLASTIC COMPOUNDING MARKET, BY TYPE, 2018-2032 (USD THOUSAND)
TABLE 1945 PARAGUAY EXTRUSION IN PLASTIC COMPOUNDING MARKET, BY PELLETIZING SYSTEM, 2018-2032 (USD THOUSAND)
TABLE 1946 PARAGUAY INJECTION MOLDING BASED COMPOUNDING IN PLASTIC COMPOUNDING MARKET, BY PELLETIZING SYSTEM, 2018-2032 (USD THOUSAND)
TABLE 1947 PARAGUAY COMPACTION/PRESSING IN PLASTIC COMPOUNDING MARKET, BY PELLETIZING SYSTEM, 2018-2032 (USD THOUSAND)
TABLE 1948 PARAGUAY KNEADER/BANBURY MIXING IN PLASTIC COMPOUNDING MARKET, BY PELLETIZING SYSTEM, 2018-2032 (USD THOUSAND)
TABLE 1949 PARAGUAY PLASTIC COMPOUNDING MARKET, BY PROPERTIES, 2018-2032 (USD THOUSAND)
TABLE 1950 PARAGUAY PLASTIC COMPOUNDING MARKET, BY APPLICATION, 2018-2032 (USD THOUSAND)
TABLE 1951 PARAGUAY PLASTIC COMPOUNDING MARKET, BY APPLICATION, 2018-2032 (KILO TONS)
TABLE 1952 PARAGUAY AUTOMOTIVE IN PLASTIC COMPOUNDING MARKET, BY CATEGORY, 2018-2032 (USD THOUSAND)
TABLE 1953 PARAGUAY INTERIOR COMPONENTS IN PLASTIC COMPOUNDING MARKET, BY TYPE, 2018-2032 (USD THOUSAND)
TABLE 1954 PARAGUAY EXTERIOR BODY PARTS IN PLASTIC COMPOUNDING MARKET, BY TYPE, 2018-2032 (USD THOUSAND)
TABLE 1955 PARAGUAY UNDER-THE-HOOD APPLICATIONS IN PLASTIC COMPOUNDING MARKET, BY TYPE, 2018-2032 (USD THOUSAND)
TABLE 1956 PARAGUAY PACKAGING IN PLASTIC COMPOUNDING MARKET, BY CATEGORY, 2018-2032 (USD THOUSAND)
TABLE 1957 PARAGUAY FOOD & BEVERAGE PACKAGING IN PLASTIC COMPOUNDING MARKET, BY TYPE, 2018-2032 (USD THOUSAND)
TABLE 1958 PARAGUAY INDUSTRIAL PACKAGING IN PLASTIC COMPOUNDING MARKET, BY TYPE, 2018-2032 (USD THOUSAND)
TABLE 1959 PARAGUAY CONSUMER GOODS PACKAGING IN PLASTIC COMPOUNDING MARKET, BY TYPE, 2018-2032 (USD THOUSAND)
TABLE 1960 PARAGUAY BUILDING & CONSTRUCTION IN PLASTIC COMPOUNDING MARKET, BY CATEGORY, 2018-2032 (USD THOUSAND)
TABLE 1961 PARAGUAY ELECTRICAL & ELECTRONICS IN PLASTIC COMPOUNDING MARKET, BY CATEGORY, 2018-2032 (USD THOUSAND)
TABLE 1962 PARAGUAY MEDICAL DEVICES IN PLASTIC COMPOUNDING MARKET, BY CATEGORY, 2018-2032 (USD THOUSAND)
TABLE 1963 PARAGUAY FURNITURE IN PLASTIC COMPOUNDING MARKET, BY CATEGORY, 2018-2032 (USD THOUSAND)
TABLE 1964 ARAGUAY ENERGY AND POWER IN PLASTIC COMPOUNDING MARKET, BY CATEGORY, 2018-2032 (USD THOUSAND)
TABLE 1965 PARAGUAY AEROSPACE AND DEFENSE IN PLASTIC COMPOUNDING MARKET, BY CATEGORY, 2018-2032 (USD THOUSAND)
TABLE 1966 URUGUAY PLASTIC COMPOUNDING MARKET, BY POLYMER TYPE, 2018-2032 (USD THOUSAND)
TABLE 1967 URUGUAY PLASTIC COMPOUNDING MARKET, BY POLYMER TYPE, 2018-2032 (KILO TONS)
TABLE 1968 URUGUAY THERMOPLASTICS IN PLASTIC COMPOUNDING MARKET, BY TYPE, 2018-2032 (USD THOUSAND)
TABLE 1969 URUGUAY POLYETHYLENE (PE) IN PLASTIC COMPOUNDING MARKET, BY TYPE, 2018-2032 (USD THOUSAND)
TABLE 1970 URUGUAY ENGINEERING PLASTICS IN PLASTIC COMPOUNDING MARKET, BY TYPE, 2018-2032 (USD THOUSAND)
TABLE 1971 URUGUAY THERMOSETTING PLASTICS IN PLASTIC COMPOUNDING MARKET, BY TYPE, 2018-2032 (USD THOUSAND)
TABLE 1972 URUGUAY BIOPLASTICS IN PLASTIC COMPOUNDING MARKET, BY TYPE, 2018-2032 (USD THOUSAND)
TABLE 1973 URUGUAY PLASTIC COMPOUNDING MARKET, BY FILLER TYPE, 2018-2032 (USD THOUSAND)
TABLE 1974 URUGUAY MINERAL FILLERS IN PLASTIC COMPOUNDING MARKET, BY TYPE, 2018-2032 (USD THOUSAND)
TABLE 1975 URUGUAY REINFORCEMENTS IN PLASTIC COMPOUNDING MARKET, BY TYPE, 2018-2032 (USD THOUSAND)
TABLE 1976 URUGUAY ADDITIVES IN PLASTIC COMPOUNDING MARKET, BY TYPE, 2018-2032 (USD THOUSAND)
TABLE 1977 URUGUAY PLASTIC COMPOUNDING MARKET, BY MANUFACTURING PROCESS, 2018-2032 (USD THOUSAND)
TABLE 1978 URUGUAY PLASTIC COMPOUNDING MARKET, BY MANUFACTURING PROCESS, 2018-2032 (KILO TONS)
TABLE 1979 URUGUAY EXTRUSION IN PLASTIC COMPOUNDING MARKET, BY TYPE, 2018-2032 (USD THOUSAND)
TABLE 1980 URUGUAY EXTRUSION IN PLASTIC COMPOUNDING MARKET, BY PELLETIZING SYSTEM, 2018-2032 (USD THOUSAND)
TABLE 1981 URUGUAY INJECTION MOLDING BASED COMPOUNDING IN PLASTIC COMPOUNDING MARKET, BY PELLETIZING SYSTEM, 2018-2032 (USD THOUSAND)
TABLE 1982 URUGUAY COMPACTION/PRESSING IN PLASTIC COMPOUNDING MARKET, BY PELLETIZING SYSTEM, 2018-2032 (USD THOUSAND)
TABLE 1983 URUGUAY KNEADER/BANBURY MIXING IN PLASTIC COMPOUNDING MARKET, BY PELLETIZING SYSTEM, 2018-2032 (USD THOUSAND)
TABLE 1984 URUGUAY PLASTIC COMPOUNDING MARKET, BY PROPERTIES, 2018-2032 (USD THOUSAND)
TABLE 1985 URUGUAY PLASTIC COMPOUNDING MARKET, BY APPLICATION, 2018-2032 (USD THOUSAND)
TABLE 1986 URUGUAY PLASTIC COMPOUNDING MARKET, BY APPLICATION, 2018-2032 (KILO TONS)
TABLE 1987 URUGUAY AUTOMOTIVE IN PLASTIC COMPOUNDING MARKET, BY CATEGORY, 2018-2032 (USD THOUSAND)
TABLE 1988 URUGUAY INTERIOR COMPONENTS IN PLASTIC COMPOUNDING MARKET, BY TYPE, 2018-2032 (USD THOUSAND)
TABLE 1989 URUGUAY EXTERIOR BODY PARTS IN PLASTIC COMPOUNDING MARKET, BY TYPE, 2018-2032 (USD THOUSAND)
TABLE 1990 URUGUAY UNDER-THE-HOOD APPLICATIONS IN PLASTIC COMPOUNDING MARKET, BY TYPE, 2018-2032 (USD THOUSAND)
TABLE 1991 URUGUAY PACKAGING IN PLASTIC COMPOUNDING MARKET, BY CATEGORY, 2018-2032 (USD THOUSAND)
TABLE 1992 URUGUAY FOOD & BEVERAGE PACKAGING IN PLASTIC COMPOUNDING MARKET, BY TYPE, 2018-2032 (USD THOUSAND)
TABLE 1993 URUGUAY INDUSTRIAL PACKAGING IN PLASTIC COMPOUNDING MARKET, BY TYPE, 2018-2032 (USD THOUSAND)
TABLE 1994 URUGUAY CONSUMER GOODS PACKAGING IN PLASTIC COMPOUNDING MARKET, BY TYPE, 2018-2032 (USD THOUSAND)
TABLE 1995 URUGUAY BUILDING & CONSTRUCTION IN PLASTIC COMPOUNDING MARKET, BY CATEGORY, 2018-2032 (USD THOUSAND)
TABLE 1996 URUGUAY ELECTRICAL & ELECTRONICS IN PLASTIC COMPOUNDING MARKET, BY CATEGORY, 2018-2032 (USD THOUSAND)
TABLE 1997 URUGUAY MEDICAL DEVICES IN PLASTIC COMPOUNDING MARKET, BY CATEGORY, 2018-2032 (USD THOUSAND)
TABLE 1998 URUGUAY FURNITURE IN PLASTIC COMPOUNDING MARKET, BY CATEGORY, 2018-2032 (USD THOUSAND)
TABLE 1999 URUGUAY ENERGY AND POWER IN PLASTIC COMPOUNDING MARKET, BY CATEGORY, 2018-2032 (USD THOUSAND)
TABLE 2000 URUGUAY AEROSPACE AND DEFENSE IN PLASTIC COMPOUNDING MARKET, BY CATEGORY, 2018-2032 (USD THOUSAND)
TABLE 2001 REST OF SOUTH AMERICA PLASTIC COMPOUNDING MARKET, BY POLYMER TYPE, 2018-2032 (USD THOUSAND)
TABLE 2002 REST OF SOUTH AMERICA PLASTIC COMPOUNDING MARKET, BY POLYMER TYPE, 2018-2032 (KILO TONS)
Lista de Figura
FIGURE 1 GLOBAL PLASTIC COMPOUNDING MARKET
FIGURE 2 GLOBAL PLASTIC COMPOUNDING MARKET: DATA TRIANGULATION
FIGURE 3 GLOBAL PLASTIC COMPOUNDING MARKET: DROC ANALYSIS
FIGURE 4 GLOBAL PLASTIC COMPOUNDING MARKET: GLOBAL VS REGIONAL MARKET ANALYSIS.
FIGURE 5 GLOBAL PLASTIC COMPOUNDING MARKET: COMPANY RESEARCH ANALYSIS
FIGURE 6 GLOBAL PLASTIC COMPOUNDING MARKET: MULTIVARIATE MODELLING
FIGURE 7 GLOBAL PLASTIC COMPOUNDING MARKET: INTERVIEW DEMOGRAPHICS
FIGURE 8 GLOBAL PLASTIC COMPOUNDING MARKET: DBMR MARKET POSITION GRID
FIGURE 9 GLOBAL PLASTIC COMPOUNDING MARKET: MARKET APPLICATION COVERAGE GRID
FIGURE 10 EXECUTIVE SUMMARY
FIGURE 11 GLOBAL PLASTIC COMPOUNDING MARKET: SEGMENTATION
FIGURE 12 FIVE SEGMENTS COMPRISE THE GLOBAL PLASTIC COMPOUNDING MARKET, BY POLYMER TYPE
FIGURE 13 STRATEGIC DECISIONS
FIGURE 14 ASIA-PACIFIC IS EXPECTED TO DOMINATE THE GLOBAL PLASTIC COMPOUNDING MARKET, AND IS EXPECTED TO GROW WITH THE HIGHEST CAGR IN THE FORECAST PERIOD
FIGURE 15 SHIFT TOWARDS RECYCLABLE AND BIODEGRADABLE PLASTIC COMPOUNDS DUE TO ENVIRONMENTAL REGULATION IS EXPECTED TO DRIVE THE GLOBAL PLASTIC COMPUNDING MARKET DURING THE FORECAST PERIOD OF 2025 TO 2032
FIGURE 16 THERMOPLASTICS SEGMENT IS EXPECTED TO ACCOUNT FOR THE LARGEST SHARE OF THE GLOBAL PLASTIC COMPUNDING MARKET IN 2025 AND 2032
FIGURE 17 ASIA-PACIFIC IS THE FASTEST-GROWING REGION FOR GLOBAL PLASTIC COMPUNDING MARKET IN THE FORECAST PERIOD
FIGURE 18 PORTER’S FIVE FORCES ANALYSIS
FIGURE 19 GLOBAL PLASTIC COMPOUNDING MARKET: VALUE CHAIN ANALYSIS
FIGURE 20 IMPORT EXPORT SCENARIO (USD THOUSAND)
FIGURE 21 PRODUCTION CAPACITY FOR TOP MANUFACTURERS
FIGURE 22 IPC CODE V/S NUMBER OF PATENTS
FIGURE 23 NUMBER OF PATENTS PER YEAR
FIGURE 24 NUMBER OF PATENTS PER REGION/COUNTRY
FIGURE 25 TOP PATENT APPLICANTS
FIGURE 26 GLOBAL PLASTIC COMPOUNDING MARKET, 2024-2032, AVERAGE SELLING PRICE (USD/KG)
FIGURE 27 DRIVERS, RESTRAINTS, OPPORTUNITIES AND CHALLENGES OF THE GLOBAL PLASTIC COMPOUNDING MARKET
FIGURE 28 GLOBAL PLASTIC COMPOUNDING MARKET: BY POLYMER TYPE, 2024
FIGURE 29 GLOBAL PLASTIC COMPOUNDING MARKET, BY FILTER TYPE, 2024
FIGURE 30 GLOBAL PLASTIC COMPOUNDING MARKET, BY MANUFACTURING PROCESS, 2024
FIGURE 31 GLOBAL PLASTIC COMPOUNDING MARKET, BY PROPERTIES, 2024
FIGURE 32 GLOBAL PLASTIC COMPOUNDING MARKET, BY APPLICATION, 2024
FIGURE 33 GLOBAL PLASTIC COMPOUNDING MARKET: SNAPSHOT (2024)
FIGURE 34 NORTH AMERICA PLASTIC COMPOUNDING MARKET: SNAPSHOT (2024)
FIGURE 35 EUROPE PLASTIC COMPOUNDING MARKET: SNAPSHOT (2024)
FIGURE 36 ASIA-PACIFIC PLASTIC COMPOUNDING MARKET: SNAPSHOT (2024)
FIGURE 38 SOUTH AMERICA PLASTIC COMPOUNDING MARKET: SNAPSHOT (2024)
FIGURE 39 GLOBAL PLASTIC COMPOUNDING MARKET: COMPANY SHARE 2024 (%)
FIGURE 40 NORTH AMERICA PLASTIC COMPOUNDING MARKET: COMPANY SHARE 2024 (%)
FIGURE 41 EUROPE PLASTIC COMPOUNDING MARKET: COMPANY SHARE 2024 (%)
FIGURE 42 ASIA-PACIFIC PLASTIC COMPOUNDING MARKET: COMPANY SHARE 2024 (%)
Metodologia de Investigação
A recolha de dados e a análise do ano base são feitas através de módulos de recolha de dados com amostras grandes. A etapa inclui a obtenção de informações de mercado ou dados relacionados através de diversas fontes e estratégias. Inclui examinar e planear antecipadamente todos os dados adquiridos no passado. Da mesma forma, envolve o exame de inconsistências de informação observadas em diferentes fontes de informação. Os dados de mercado são analisados e estimados utilizando modelos estatísticos e coerentes de mercado. Além disso, a análise da quota de mercado e a análise das principais tendências são os principais fatores de sucesso no relatório de mercado. Para saber mais, solicite uma chamada de analista ou abra a sua consulta.
A principal metodologia de investigação utilizada pela equipa de investigação do DBMR é a triangulação de dados que envolve a mineração de dados, a análise do impacto das variáveis de dados no mercado e a validação primária (especialista do setor). Os modelos de dados incluem grelha de posicionamento de fornecedores, análise da linha de tempo do mercado, visão geral e guia de mercado, grelha de posicionamento da empresa, análise de patentes, análise de preços, análise da quota de mercado da empresa, normas de medição, análise global versus regional e de participação dos fornecedores. Para saber mais sobre a metodologia de investigação, faça uma consulta para falar com os nossos especialistas do setor.
Personalização disponível
A Data Bridge Market Research é líder em investigação formativa avançada. Orgulhamo-nos de servir os nossos clientes novos e existentes com dados e análises que correspondem e atendem aos seus objetivos. O relatório pode ser personalizado para incluir análise de tendências de preços de marcas-alvo, compreensão do mercado para países adicionais (solicite a lista de países), dados de resultados de ensaios clínicos, revisão de literatura, mercado remodelado e análise de base de produtos . A análise de mercado dos concorrentes-alvo pode ser analisada desde análises baseadas em tecnologia até estratégias de carteira de mercado. Podemos adicionar quantos concorrentes necessitar de dados no formato e estilo de dados que procura. A nossa equipa de analistas também pode fornecer dados em tabelas dinâmicas de ficheiros Excel em bruto (livro de factos) ou pode ajudá-lo a criar apresentações a partir dos conjuntos de dados disponíveis no relatório.

