
Global Next Generation Packaging Market, By Type (Active Packaging, Intelligent Packaging and Modified Atmosphere Packaging), Function (Moisture Control, Temperature Indicators, Shelf Life Sensing, Product Tracking, and Others), Technology (Scavengers and Susceptors RFID Tags, QR Codes, NFC Tags, Coding & Markings, Sensors & Output Devices, and Others), Material (Plastic, Paper, Corrugated Board and Others), Application (Food, Beverages, Personal Care, Healthcare, Logistics & Supply Chain, Consumer Electronics and Others), Country (U.S., Canada, Mexico, Germany, UK, Italy, France, Spain, Russia, Switzerland, Turkey, Belgium, Netherlands, Luxemburg and rest of Europe, Japan, China, South Korea, India, Singapore, Thailand, Indonesia, Malaysia, Philippines, Australia & New Zealand and rest of Asia-pacific, Brazil, Argentina and Rest of South America, South Africa, Saudi Arabia, UAE, Egypt, Israel and Rest of Middle East and Africa) Industry Trends and Forecast To 2029
Market Analysis and Insights: Global Next Generation Packaging Market
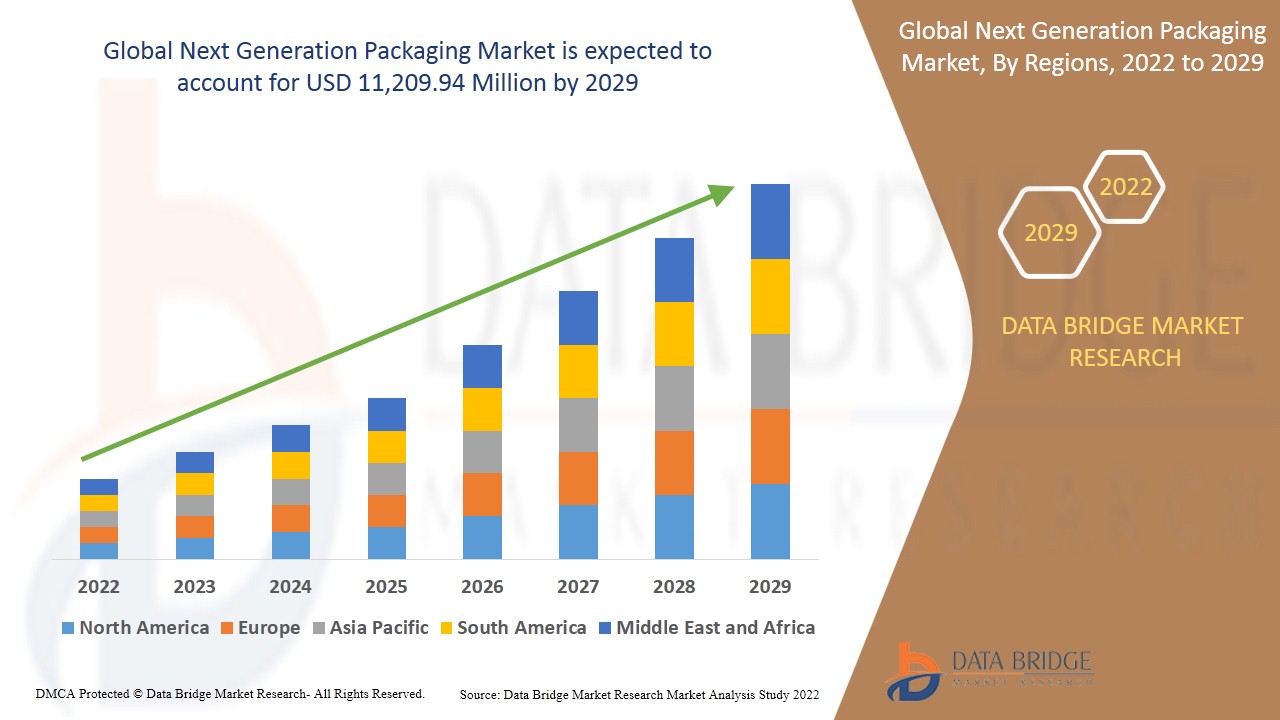
Global next generation packaging market is expected to gain significant growth in the forecast period of 2022 to 2029. Data Bridge Market Research analyzes that the market is growing with a CAGR of 6.5% in the forecast period of 2022 to 2029 and is expected to reach USD 11,209.94 million by 2029.
Growing demand for intelligent packaging to avoid food wastage is accelerating the use of next generation packaging products, which is expected to drive the market growth. However, high costs associated with research and development activities are expected to restrain the growth of the market. The recent trend indicates increasing demand for next generation packaging as investments in public and private food industries continue to increase. The factors driving the growth of the market are increasing health awareness among the general population and continuous technological advancements in packaging. With the rapid growth of globalization and increase in mandates for food and beverages by various countries and regions, the global next generation packaging market will witness an increased trajectory in the coming years. However, the high cost of packaging in the global next generation packaging will restrict the market growth.
Various companies are making strategic decisions, such as forming agreements with research facilities to launch new products, to improve their market share. As a result, the next-generation packaging market is growing at a rapid rate. On the other hand, recent innovations and new product launches are creating new opportunities for the market. However, easy availability of alternative products is acting as a challenge for the global next generation packaging market.
The global next generation packaging market report provides details of market share, new developments, and product pipeline analysis, impact of domestic and localized market players, analyses opportunities in terms of emerging revenue pockets, changes in market regulations, product approvals, strategic decisions, product launches, geographic expansions, and technological innovations in the market. To understand the analysis and the market scenario contact us for an Analyst Brief, our team will help you create a revenue impact solution to achieve your desired goal.
Global Next Generation Packaging Market Scope and Market Size
Global next generation packaging market is segmented into five segments based on type, function, technology, material, and application. The growth among segments helps you analyze niche pockets of growth and strategies to approach the market and determine your core application areas and the difference in your target markets.
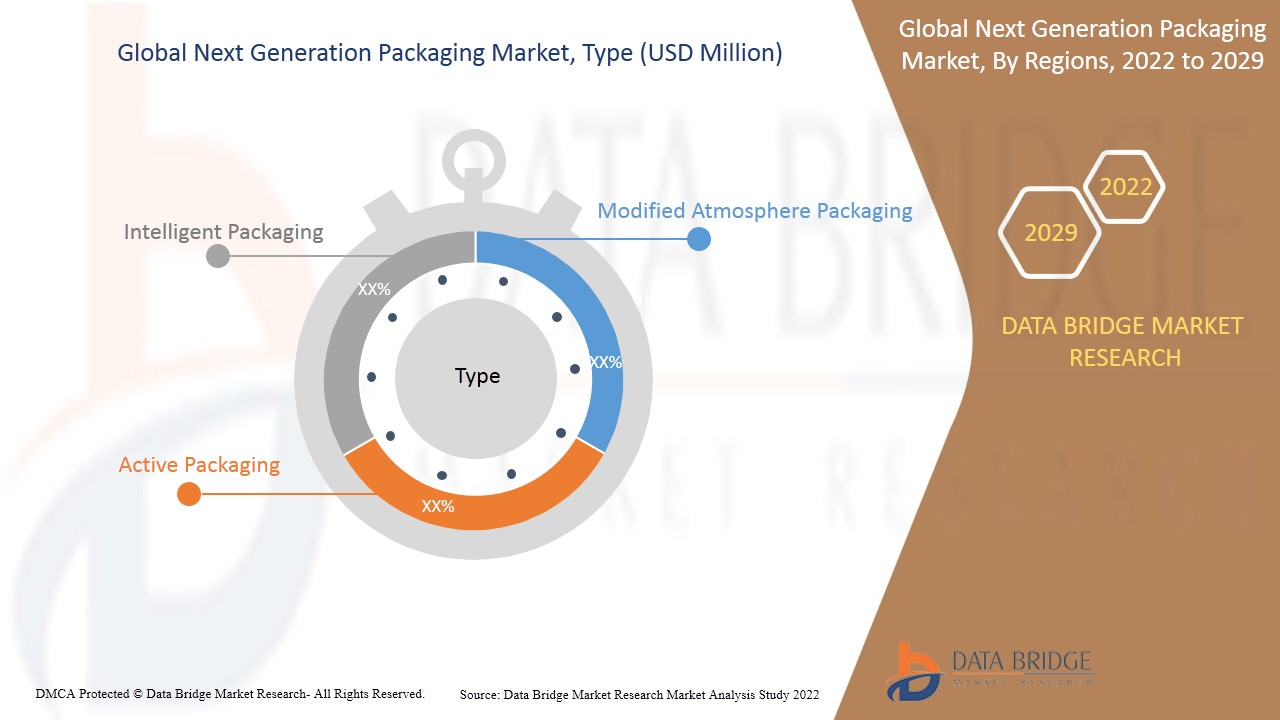
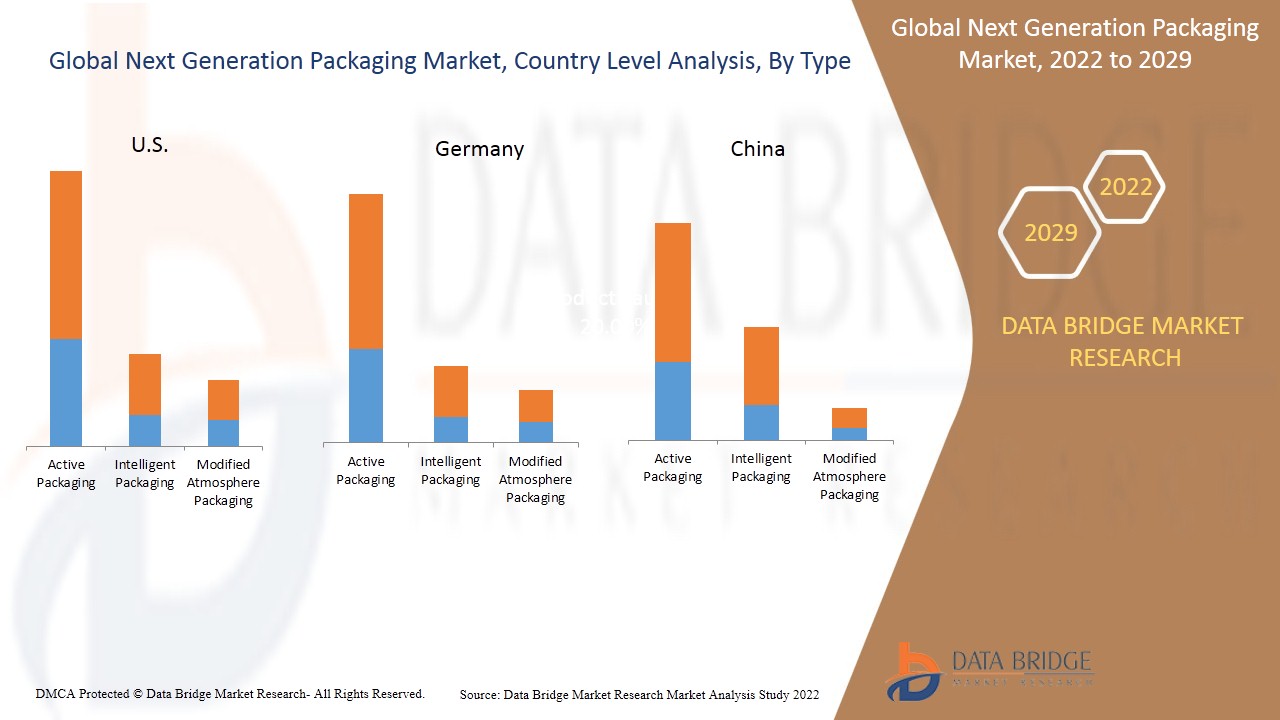
- On the basis of type, the global next generation packaging market is segmented into active packaging, intelligent packaging, and modified atmosphere packaging. In 2022, the active packaging segment is expected to dominate the market due to high production quantity and ease to use nature of active packaging.
- On the basis of function, the global next generation packaging market is segmented into moisture control, temperature indicators, shelf life sensing, product tracking, and others. In 2022, moisture control segment is expected to dominate the market as it is the most demanded packaging function to extend the shelf life of the product.
- On the basis of technology, the global next generation packaging market is segmented into scavengers and susceptors, RFID tags, QR codes, NFC tags, coding & markings, sensors & output devices, and others. In 2022, the scavengers and susceptors segment is expected to dominate the market as it gives an easy access to the product to consumers.
- On the basis of material, the global next generation packaging market is segmented into plastic, paper, corrugated board, and others. In 2022, the plastic segment is expected to dominate the market due to consumers showcasing keen interest in the size of the product’s packaging due to its affordability.
- On the basis of application, the global next generation packaging market is segmented into food, beverages, personal care, healthcare, logistics & supply chain, consumer electronics, and others. In 2022, the food segment is expected to dominate the market as the demand for packed food is increasing all over the world owing to busy lifestyles.
Global next generation packaging market is fragmented and the major players have used various strategies, such as new product launches, expansions, agreements, joint ventures, partnerships, acquisitions, and others, to increase their footprints in the market.
North America by country is segmented into U.S., Canada and Mexico. In 2022, U.S. is domination the North America next generation packaging market, due to growing application of this market in food and beverage industry.
Next Generation Packaging Market Country Level Analysis
Global next generation packaging market is analysed and market size information is provided based on type, function, technology, material, and application.
Asia-Pacific is expected to grow with the most promising growth rate in the forecast period of 2022 to 2029 as major industrialists are focusing on developing food and beverages products consisting next generation packaging.
The country section of the report also provides individual market impacting factors and changes in regulation in the market domestically that impacts the current and future trends of the market. Data points such as new sales, replacement sales, country demographics, regulatory acts and import-export tariffs are some of the major pointers used to forecast the market scenario for individual countries. Also, presence and availability of global brands and their challenges faced due to large or scarce competition from local and domestic brands, impact of sales channels are considered while providing forecast analysis of the country data.
The U.S. has dominated the market in North America owing to the increased demand for active packaging in food applications.
Increased awareness about food safety and quality has increased demand for next generation packaging in Germany.
Increasing risk of foodborne diseases has increased the food safety in China, which in turn gas helped the packaging market to grow in the country.
Rising Demand for Next Generation Packaging
Global next generation packaging market also provides you with detailed market analysis for every country growth in industry with sales, components sales, and impact of technological development in next generation packaging and changes in regulatory scenarios with their support for the market. The data is available for historic period 2019 to 2029.
Competitive Landscape and Next Generation Packaging Market Share Analysis
Global next generation packaging market competitive landscape provides details by competitor. Details included are company overview, company financials, revenue generated, market potential, investment in research and development, new market initiatives, global presence, production sites and facilities, company strengths and weaknesses, product launch, product trials pipelines, product approvals, patents, product width and breadth, application dominance, and technology lifeline curve. The above data points provided are only related to the companies’ focus related to the global next generation packaging market.
Some of the major players operating in the global next generation packaging market are Amcor plc, Sealed Air, Klöckner Pentaplast, MicrobeGuard Corporation, TOPPAN INC., BALL CORPORATION, DuPont de Nemours, Inc., R.R. Donnelley & Sons Company, Vesta, Amerplast Ltd., MITSUBISHI GAS CHEMICAL, Graham Packaging Company, Active Packaging, American Thermal Instruments, AVERY DENNISON CORPORATION, Temptime Corporation, Cortec Packaging, and SAES Getters S.p.A. among others.
Various product developments are also initiated by the companies worldwide, which are also accelerating the growth of the next generation packaging market.
For instance,
- In 2017, DuPont launched new Tyvek 40L in China, plans for global availability DuPont Protection Solutions for the introduction of DuPont Tyvek 40L medical packaging, a new class of Tyvek for medical packaging applications that provide a cost-effective option for protecting lightweight, low-risk devices
Partnership, joint ventures, and other strategies enhance the company market share with increased coverage and presence. It also benefits organizations to improve their offering for next generation packaging through expanded range of size.
SKU-
Obtenha acesso online ao relatório sobre a primeira nuvem de inteligência de mercado do mundo

- Painel interativo de análise de dados
- Painel de análise da empresa para oportunidades de elevado potencial de crescimento
- Acesso de analista de pesquisa para personalização e customização. consultas
- Análise da concorrência com painel interativo
- Últimas notícias, atualizações e atualizações Análise de tendências
- Aproveite o poder da análise de benchmark para um rastreio abrangente da concorrência
Índice
1 INTRODUCTION
1.1 OBJECTIVES OF THE STUDY
1.2 MARKET DEFINITION
1.3 OVERVIEW OF GLOBAL NEXT GENERATION PACKAGING MARKET
1.4 LIMITATIONS
1.5 MARKETS COVERED
2 MARKET SEGMENTATION
2.1 MARKETS COVERED
2.2 GEOGRAPHICAL SCOPE
2.3 YEARS CONSIDERED FOR THE STUDY
2.4 CURRENCY AND PRICING
2.5 DBMR TRIPOD DATA VALIDATION MODEL
2.6 MULTIVARIATE MODELLING
2.7 SOURCE LIFELINE CURVE
2.8 PRIMARY INTERVIEWS WITH KEY OPINION LEADERS
2.9 DBMR MARKET POSITION GRID
2.1 GLOBAL NEXT GENERATION PACKAGING MARKET: APPLICATION COVERAGE GRID
2.11 VENDOR SHARE ANALYSIS
2.12 SECONDARY SOURCES
2.13 ASSUMPTIONS
3 EXECUTIVE SUMMARY
4 PREMIUM INSIGHTS
5 INDUSTRIAL INSIGHTS: GLOBAL NEXT GENERATION PACKAGING MARKET
5.1 DEVELOPMENT OF ADVANCED SMART PACKAGING PRODUCT
5.2 TEMPERATURE BALANCING SMART PACKAGING:
5.3 SMART PACKAGING TO IMPROVE CONSUMER SAFETY:
5.4 CONCLUSION:
6 MARKET OVERVIEW
6.1 DRIVERS
6.1.1 GROWING DEMAND FOR INTELLIGENT PACKAGING TO AVOID FOOD WASTAGE
6.1.2 INCREASING DISPOSABLE INCOME OF CONSUMERS
6.1.3 INCREASING CASES OF FOOD CONTAMINATION
6.1.4 INCREASE IN THE CONSUMPTION OF PACKAGED PRODUCTS
6.1.5 INCREASING HEALTH AWARENESS AMONG CONSUMERS
6.2 RESTRAINTS
6.2.1 COSTS ASSOCIATED WITH RESEARCH AND DEVELOPMENT ACTIVITIES
6.2.2 HIGH COMPETITION AMONG MARKET PLAYERS
6.3 OPPORTUNITIES
6.3.1 RECENT INNOVATIONS AND NEW PRODUCT LAUNCHES
6.3.2 GROWING ALCOHOLIC AND NON-ALCOHOLIC INDUSTRY WITH ACTIVE AND INTELLIGENT PACKAGING
6.4 CHALLENGES
6.4.1 AVAILABILITY OF ALTERNATIVES IN THE MARKET
6.4.2 SUPPLY CHAIN DISRUPTION DUE TO COVID-19
7 IMPACT OF COVID-19 ON THE GLOBAL NEXT GENERATION PACKAGING MARKET
7.1 AWARENESS ABOUT FOOD SAFETY AND QUALITY INCREASED DUE TO THE COVID-19 PANDEMIC
7.2 COVID-19 IMPACT ON DEMAND & SUPPLY CHAIN OF NEXT GENERATION PACKAGING
7.3 IMPACT ON PRICE
7.4 INITIATIVES TAKEN BY MANUFACTURERS
7.5 CONCLUSION
8 GLOBAL NEXT GENERATION PACKAGING MARKET, BY TYPE
8.1 OVERVIEW
8.2 ACTIVE PACKAGING
8.2.1 GAS SCAVENGERS/EMITTERS
8.2.2 MICROWAVE SUSCEPTORS
8.2.3 OTHERS
8.3 INTELLIGENT PACKAGING
8.4 MODIFIED ATMOSPHERE PACKAGING
9 GLOBAL NEXT GENERATION PACKAGING MARKET, BY FUNCTION
9.1 OVERVIEW
9.2 MOISTURE CONTROL
9.3 TEMPERATURE INDICATORS
9.4 PRODUCT TRACKING
9.5 SHELF LIFE SENSING
9.6 OTHERS
10 GLOBAL NEXT GENERATION PACKAGING MARKET, BY TECHNOLOGY
10.1 OVERVIEW
10.2 SCAVENGERS AND SUSCEPTORS
10.3 RFID TAGS
10.4 NFC TAGS
10.5 QR CODES
10.6 SENSORS & OUTPUT DEVICES
10.7 CODING & MARKINGS
10.8 OTHERS
11 GLOBAL NEXT GENERATION PACKAGING MARKET, BY MATERIAL
11.1 OVERVIEW
11.2 PLASTIC
11.3 PAPER
11.4 CORRUGATED BOARD
11.5 OTHERS
12 GLOBAL NEXT GENERATION PACKAGING MARKET, BY APPLICATION
12.1 OVERVIEW
12.2 FOOD
12.2.1 PACKAGED FOOD
12.2.2 PROCESSED FOOD
12.2.2.1 CHILLED
12.2.2.2 DRIED
12.2.3 MEAT & POULTRY
12.2.4 DAIRY
12.2.5 BAKERY & CONFECTIONERY
12.2.6 FRUITS & VEGETABLES
12.2.7 FROZEN FOOD
12.2.8 OTHERS
12.3 BEVERAGES
12.3.1 NON- ALCOHOLIC
12.3.2 ALCOHOLIC
12.4 PERSONAL CARE
12.5 HEALTH CARE
12.6 LOGISTICS & SUPPLY CHAIN
12.7 CONSUMER ELECTRONICS
12.8 OTHERS
13 GLOBAL NEXT GENERATION PACKAGING MARKET, BY REGION
13.1 OVERVIEW
13.2 ASIA-PACIFIC
13.2.1 JAPAN
13.2.2 CHINA
13.2.3 AUSTRALIA & NEW ZEALAND
13.2.4 SOUTH KOREA
13.2.5 INDIA
13.2.6 INDONESIA
13.2.7 PHILIPPINES
13.2.8 THAILAND
13.2.9 MALAYSIA
13.2.10 SINGAPORE
13.2.11 REST OF ASIA-PACIFIC
13.3 NORTH AMERICA
13.3.1 U.S.
13.3.2 CANADA
13.3.3 MEXICO
13.4 EUROPE
13.4.1 GERMANY
13.4.2 FRANCE
13.4.3 U.K.
13.4.4 ITALY
13.4.5 SPAIN
13.4.6 RUSSIA
13.4.7 BELGIUM
13.4.8 NETHERLANDS
13.4.9 SWITZERLAND
13.4.10 TURKEY
13.4.11 LUXEMBURG
13.4.12 REST OF EUROPE
13.5 MIDDLE EAST AND AFRICA
13.5.1 SOUTH AFRICA
13.5.2 SAUDI ARABIA
13.5.3 U.A.E.
13.5.4 EGYPT
13.5.5 ISRAEL
13.5.6 REST OF MIDDLE EAST & AFRICA
13.6 SOUTH AMERICA
13.6.1 BRAZIL
13.6.2 ARGENTINA
13.6.3 REST OF SOUTH AMERICA
14 COMPANY LANDSCAPE
14.1 COMPANY SHARE ANALYSIS: GLOBAL
14.2 COMPANY SHARE ANALYSIS: NORTH AMERICA
14.3 COMPANY SHARE ANALYSIS: EUROPE
14.4 COMPANY SHARE ANALYSIS: ASIA-PACIFIC
15 SWOT ANALYSIS
16 COMPANY PROFILE
16.1 AVERY DENNISON CORPORATION
16.1.1 COMPANY SNAPSHOT
16.1.2 REVENUE ANALYSIS
16.1.3 COMPANY SHARE ANALYSIS
16.1.4 PRODUCT PORTFOLIO
16.1.5 RECENT DEVELOPMENT
16.2 DUPONT
16.2.1 COMPANY SNAPSHOT
16.2.2 REVENUE ANALYSIS
16.2.3 COMPANY SHARE ANALYSIS
16.2.4 PRODUCT PORTFOLIO
16.2.5 RECENT DEVELOPMENTS
16.3 BALL CORPORATION
16.3.1 COMPANY SNAPSHOT
16.3.2 REVENUE ANALYSIS
16.3.3 COMPANY SHARE ANALYSIS
16.3.4 PRODUCT PORTFOLIO
16.3.5 RECENT DEVELOPMENT
16.4 GRAHAM PACKAGING COMPANY
16.4.1 COMPANY SNAPSHOT
16.4.2 COMPANY SHARE ANALYSIS
16.4.3 PRODUCT PORTFOLIO
16.4.4 RECENT DEVELOPMENT
16.5 R.R. DONNELLEY & SONS COMPANY
16.5.1 COMPANY SNAPSHOT
16.5.2 REVENUE ANALYSIS
16.5.3 COMPANY SHARE ANALYSIS
16.5.4 PRODUCT PORTFOLIO
16.5.5 RECENT DEVELOPMENTS
16.6 ACTIVE PACKAGING
16.6.1 COMPANY SANPSHOT
16.6.2 PRODUCT PORTFOLIO
16.6.3 RECENT DEVELOPMENT
16.7 AMCOR PLC
16.7.1 COMPANY SNAPSHOT
16.7.2 REVENUE ANALYSIS
16.7.3 PRODUCT PORTFOLIO
16.7.4 RECENT DEVELOPMENTS
16.8 AMERPLAST
16.8.1 COMPANY SNAPSHOT
16.8.2 PRODUCT PORTFOLIO
16.8.3 RECENT DEVELOPMENT
16.9 AMERICAN THERMAL INSTRUMENTS
16.9.1 COMPANY SANPSHOT
16.9.2 PRODUCT PORTFOLIO
16.9.3 RECENT DEVELOPMENTS
16.1 CORTEC PACKAGING
16.10.1 COMPANY SNAPSHOT
16.10.2 PRODUCT PORTFOLIO
16.10.3 RECENT DEVELOPMENT
16.11 KLÖCKNER PENTAPLAST
16.11.1 COMPANY SNAPSHOT
16.11.2 PRODUCT PORTFOLIO
16.11.3 RECENT DEVELOPMENTS
16.12 MICROBEGUARD CORPORATION
16.12.1 COMPANY SNAPSHOT
16.12.2 PRODUCT PORTFOLIO
16.12.3 RECENT DEVELOPMENT
16.13 MITSUBISHI GAS CHEMICAL COMPANY, INC.
16.13.1 COMPANY SNAPSHOT
16.13.2 REVENUE ANALYSIS
16.13.3 PRODUCT PORTFOLIO
16.13.4 RECENT DEVELOPMENTS
16.14 SAES GETTERS S.P.A.
16.14.1 COMPANY SANPSHOT
16.14.2 PRODUCT PORTFOLIO
16.14.3 RECENT DEVELOPMENT
16.15 SEALED AIR
16.15.1 COMPANY SNAPSHOT
16.15.2 REVENUE ANALYSIS
16.15.3 PRODUCT PORTFOLIO
16.15.4 RECENT DEVELOPMENT
16.16 TEMPTIME CORPORATION.
16.16.1 COMPANY SANPSHOT
16.16.2 PRODUCT PORTFOLIO
16.16.3 RECENT DEVELOPMENTS
16.17 TOPPAN INC.
16.17.1 COMPANY SNAPSHOT
16.17.2 PRODUCT PORTFOLIO
16.17.3 RECENT DEVELOPMENT
16.18 VESTA
16.18.1 COMPANY SNAPSHOT
16.18.2 PRODUCT PORTFOLIO
16.18.3 RECENT DEVELOPMENT
17 QUESTIONNAIRE
18 RELATED REPORTS
Lista de Tabela
TABLE 1 GLOBAL NEXT GENERATION PACKAGING MARKET, BY TYPE, 2020-2029 (USD MILLION)
TABLE 2 GLOBAL ACTIVE PACKAGING IN NEXT GENERATION PACKAGING MARKET, BY REGION, 2020-2029 (USD MILLION)
TABLE 3 GLOBAL ACTIVE PACKAGING IN NEXT GENERATION PACKAGING MARKET, BY TYPE, 2020-2029 (USD MILLION)
TABLE 4 GLOBAL INTELLIGENT PACKAGING IN NEXT GENERATION PACKAGING MARKET, BY REGION, 2020-2029 (USD MILLION)
TABLE 5 GLOBAL MODIFIED ATMOSPHERE PACKAGING IN NEXT GENERATION PACKAGING MARKET, BY REGION, 2020-2029 (USD MILLION)
TABLE 6 GLOBAL NEXT GENERATION PACKAGING MARKET, BY FUNCTION, 2020-2029 (USD MILLION)
TABLE 7 GLOBAL MOISTURE CONTROL IN NEXT GENERATION PACKAGING MARKET, BY REGION, 2020-2029 (USD MILLION)
TABLE 8 GLOBAL TEMPERATURE INDICATORS IN NEXT GENERATION PACKAGING MARKET, BY REGION, 2020-2029 (USD MILLION)
TABLE 9 GLOBAL PRODUCT TRACKING IN NEXT GENERATION PACKAGING MARKET, BY REGION, 2020-2029 (USD MILLION)
TABLE 10 GLOBAL SHELF LIFE SENSING IN NEXT GENERATION PACKAGING MARKET, BY REGION, 2020-2029 (USD MILLION)
TABLE 11 GLOBAL OTHERS IN NEXT GENERATION PACKAGING MARKET, BY REGION, 2020-2029 (USD MILLION)
TABLE 12 GLOBAL NEXT GENERATION PACKAGING MARKET, BY TECHNOLOGY, 2020-2029 (USD MILLION)
TABLE 13 GLOBAL SCAVENGERS AND SUSCEPTORS IN NEXT GENERATION PACKAGING MARKET, BY REGION, 2020-2029 (USD MILLION)
TABLE 14 GLOBAL RFID TAGS IN NEXT GENERATION PACKAGING MARKET, BY REGION, 2020-2029 (USD MILLION)
TABLE 15 GLOBAL NFC TAGS IN NEXT GENERATION PACKAGING MARKET, BY REGION, 2020-2029 (USD MILLION)
TABLE 16 GLOBAL QR CODES IN NEXT GENERATION PACKAGING MARKET, BY REGION, 2020-2029 (USD MILLION)
TABLE 17 GLOBAL SENSORS & OUTPUT DEVICES IN NEXT GENERATION PACKAGING MARKET, BY REGION, 2020-2029 (USD MILLION)
TABLE 18 GLOBAL CODING & MARKINGS IN NEXT GENERATION PACKAGING MARKET, BY REGION, 2020-2029 (USD MILLION)
TABLE 19 GLOBAL OTHERS IN NEXT GENERATION PACKAGING MARKET, BY REGION, 2020-2029 (USD MILLION)
TABLE 20 GLOBAL NEXT GENERATION PACKAGING MARKET, BY MATERIAL, 2020-2029 (USD MILLION)
TABLE 21 GLOBAL PLASTIC IN NEXT GENERATION PACKAGING MARKET, BY REGION, 2020-2029 (USD MILLION)
TABLE 22 GLOBAL PAPER IN NEXT GENERATION PACKAGING MARKET, BY REGION, 2020-2029 (USD MILLION)
TABLE 23 GLOBAL CORRUGATED BOARD IN NEXT GENERATION PACKAGING MARKET, BY REGION, 2020-2029 (USD MILLION)
TABLE 24 GLOBAL OTHERS IN NEXT GENERATION PACKAGING MARKET, BY REGION, 2020-2029 (USD MILLION)
TABLE 25 GLOBAL NEXT GENERATION PACKAGING MARKET, BY APPLICATION, 2020-2029 (USD MILLION)
TABLE 26 GLOBAL FOOD IN NEXT GENERATION PACKAGING MARKET, BY REGION, 2020-2029 (USD MILLION)
TABLE 27 GLOBAL FOOD IN NEXT GENERATION PACKAGING MARKET, BY APPLICATION, 2020-2029 (USD MILLION)
TABLE 28 GLOBAL PROCESSED FOOD IN NEXT GENERATION PACKAGING MARKET, BY APPLICTION, 2020-2029 (USD MILLION)
TABLE 29 GLOBAL BEVERAGES IN NEXT GENERATION PACKAGING MARKET, BY REGION, 2020-2029 (USD MILLION)
TABLE 30 GLOBAL BEVERAGES IN NEXT GENERATION PACKAGING MARKET, BY APPLICATION, 2020-2029 (USD MILLION)
TABLE 31 GLOBAL PERSONAL CARE IN NEXT GENERATION PACKAGING MARKET, BY REGION, 2020-2029 (USD MILLION)
TABLE 32 GLOBAL HEALTHCARE IN NEXT GENERATION PACKAGING MARKET, BY REGION, 2020-2029 (USD MILLION)
TABLE 33 GLOBAL LOGISTICS & SUPPLY CHAIN IN NEXT GENERATION PACKAGING MARKET, BY REGION, 2020-2029 (USD MILLION)
TABLE 34 GLOBAL CONSUMER ELECTRONICS IN NEXT GENERATION PACKAGING MARKET, BY REGION, 2020-2029 (USD MILLION)
TABLE 35 GLOBAL OTHERS IN NEXT GENERATION PACKAGING MARKET, BY REGION, 2020-2029 (USD MILLION)
TABLE 36 GLOBAL NEXT GENERATION PACKAGING MARKET, BY REGION, 2020-2029 (USD MILLION)
TABLE 37 ASIA-PACIFIC NEXT GENERATION PACKAGING MARKET, BY COUNTRY, 2020-2029 (USD MILLION)
TABLE 38 ASIA-PACIFIC NEXT GENERATION PACKAGING MARKET, BY TYPE, 2020-2029 (USD MILLION)
TABLE 39 ASIA-PACIFIC ACTIVE PACKAGING IN NEXT GENERATION PACKAGING MARKET, BY TYPE, 2020-2029 (USD MILLION)
TABLE 40 ASIA-PACIFIC NEXT GENERATION PACKAGING MARKET, BY FUNCTION, 2020-2029 (USD MILLION)
TABLE 41 ASIA-PACIFIC NEXT GENERATION PACKAGING MARKET, BY TECHNOLOGY, 2020-2029 (USD MILLION)
TABLE 42 ASIA-PACIFIC NEXT GENERATION PACKAGING MARKET, BY MATERIAL, 2020-2029 (USD MILLION)
TABLE 43 ASIA-PACIFIC NEXT GENERATION PACKAGING MARKET, BY APPLICATION, 2020-2029 (USD MILLION)
TABLE 44 ASIA-PACIFIC FOOD IN NEXT GENERATION PACKAGING MARKET, BY APPLICATION, 2020-2029 (USD MILLION)
TABLE 45 ASIA-PACIFIC PROCESSED FOOD IN NEXT GENERATION PACKAGING MARKET, BY APPLICATION, 2020-2029 (USD MILLION)
TABLE 46 ASIA-PACIFIC BEVERAGES IN NEXT GENERATION PACKAGING MARKET, BY APPLICATION, 2020-2029 (USD MILLION)
TABLE 47 JAPAN NEXT GENERATION PACKAGING MARKET, BY TYPE, 2020-2029 (USD MILLION)
TABLE 48 JAPAN ACTIVE PACKAGING IN NEXT GENERATION PACKAGING MARKET, BY TYPE, 2020-2029 (USD MILLION)
TABLE 49 JAPAN NEXT GENERATION PACKAGING MARKET, BY FUNCTION, 2020-2029 (USD MILLION)
TABLE 50 JAPAN NEXT GENERATION PACKAGING MARKET, BY TECHNOLOGY, 2020-2029 (USD MILLION)
TABLE 51 JAPAN NEXT GENERATION PACKAGING MARKET, BY MATERIAL, 2020-2029 (USD MILLION)
TABLE 52 JAPAN NEXT GENERATION PACKAGING MARKET, BY APPLICATION, 2020-2029 (USD MILLION)
TABLE 53 JAPAN FOOD IN NEXT GENERATION PACKAGING MARKET, BY APPLICATION, 2020-2029 (USD MILLION)
TABLE 54 JAPAN PROCESSED FOOD IN NEXT GENERATION PACKAGING MARKET, BY APPLICATION, 2020-2029 (USD MILLION)
TABLE 55 JAPAN BEVERAGES IN NEXT GENERATION PACKAGING MARKET, BY APPLICATION, 2020-2029 (USD MILLION)
TABLE 56 CHINA NEXT GENERATION PACKAGING MARKET, BY TYPE, 2020-2029 (USD MILLION)
TABLE 57 CHINA ACTIVE PACKAGING IN NEXT GENERATION PACKAGING MARKET, BY TYPE, 2020-2029 (USD MILLION)
TABLE 58 CHINA NEXT GENERATION PACKAGING MARKET, BY FUNCTION, 2020-2029 (USD MILLION)
TABLE 59 CHINA NEXT GENERATION PACKAGING MARKET, BY TECHNOLOGY, 2020-2029 (USD MILLION)
TABLE 60 CHINA NEXT GENERATION PACKAGING MARKET, BY MATERIAL, 2020-2029 (USD MILLION)
TABLE 61 CHINA NEXT GENERATION PACKAGING MARKET, BY APPLICATION, 2020-2029 (USD MILLION)
TABLE 62 CHINA FOOD IN NEXT GENERATION PACKAGING MARKET, BY APPLICATION, 2020-2029 (USD MILLION)
TABLE 63 CHINA PROCESSED FOOD IN NEXT GENERATION PACKAGING MARKET, BY APPLICATION, 2020-2029 (USD MILLION)
TABLE 64 CHINA BEVERAGES IN NEXT GENERATION PACKAGING MARKET, BY APPLICATION, 2020-2029 (USD MILLION)
TABLE 65 AUSTRALIA & NEW ZEALAND NEXT GENERATION PACKAGING MARKET, BY TYPE, 2020-2029 (USD MILLION)
TABLE 66 AUSTRALIA & NEW ZEALAND ACTIVE PACKAGING IN NEXT GENERATION PACKAGING MARKET, BY TYPE, 2020-2029 (USD MILLION)
TABLE 67 AUSTRALIA & NEW ZEALAND NEXT GENERATION PACKAGING MARKET, BY FUNCTION, 2020-2029 (USD MILLION)
TABLE 68 AUSTRALIA & NEW ZEALAND NEXT GENERATION PACKAGING MARKET, BY TECHNOLOGY, 2020-2029 (USD MILLION)
TABLE 69 AUSTRALIA & NEW ZEALAND NEXT GENERATION PACKAGING MARKET, BY MATERIAL, 2020-2029 (USD MILLION)
TABLE 70 AUSTRALIA & NEW ZEALAND NEXT GENERATION PACKAGING MARKET, BY APPLICATION, 2020-2029 (USD MILLION)
TABLE 71 AUSTRALIA & NEW ZEALAND FOOD IN NEXT GENERATION PACKAGING MARKET, BY APPLICATION, 2020-2029 (USD MILLION)
TABLE 72 AUSTRALIA & NEW ZEALAND PROCESSED FOOD IN NEXT GENERATION PACKAGING MARKET, BY APPLICATION, 2020-2029 (USD MILLION)
TABLE 73 AUSTRALIA & NEW ZEALAND BEVERAGES IN NEXT GENERATION PACKAGING MARKET, BY APPLICATION, 2020-2029 (USD MILLION)
TABLE 74 SOUTH KOREA NEXT GENERATION PACKAGING MARKET, BY TYPE, 2020-2029 (USD MILLION)
TABLE 75 SOUTH KOREA ACTIVE PACKAGING IN NEXT GENERATION PACKAGING MARKET, BY TYPE, 2020-2029 (USD MILLION)
TABLE 76 SOUTH KOREA NEXT GENERATION PACKAGING MARKET, BY FUNCTION, 2020-2029 (USD MILLION)
TABLE 77 SOUTH KOREA NEXT GENERATION PACKAGING MARKET, BY TECHNOLOGY, 2020-2029 (USD MILLION)
TABLE 78 SOUTH KOREA NEXT GENERATION PACKAGING MARKET, BY MATERIAL, 2020-2029 (USD MILLION)
TABLE 79 SOUTH KOREA NEXT GENERATION PACKAGING MARKET, BY APPLICATION, 2020-2029 (USD MILLION)
TABLE 80 SOUTH KOREA FOOD IN NEXT GENERATION PACKAGING MARKET, BY APPLICATION, 2020-2029 (USD MILLION)
TABLE 81 SOUTH KOREA PROCESSED FOOD IN NEXT GENERATION PACKAGING MARKET, BY APPLICATION, 2020-2029 (USD MILLION)
TABLE 82 SOUTH KOREA BEVERAGES IN NEXT GENERATION PACKAGING MARKET, BY APPLICATION, 2020-2029 (USD MILLION)
TABLE 83 INDIA NEXT GENERATION PACKAGING MARKET, BY TYPE, 2020-2029 (USD MILLION)
TABLE 84 INDIA ACTIVE PACKAGING IN NEXT GENERATION PACKAGING MARKET, BY TYPE, 2020-2029 (USD MILLION)
TABLE 85 INDIA NEXT GENERATION PACKAGING MARKET, BY FUNCTION, 2020-2029 (USD MILLION)
TABLE 86 INDIA NEXT GENERATION PACKAGING MARKET, BY TECHNOLOGY, 2020-2029 (USD MILLION)
TABLE 87 INDIA NEXT GENERATION PACKAGING MARKET, BY MATERIAL, 2020-2029 (USD MILLION)
TABLE 88 INDIA NEXT GENERATION PACKAGING MARKET, BY APPLICATION, 2020-2029 (USD MILLION)
TABLE 89 INDIA FOOD IN NEXT GENERATION PACKAGING MARKET, BY APPLICATION, 2020-2029 (USD MILLION)
TABLE 90 INDIA PROCESSED FOOD IN NEXT GENERATION PACKAGING MARKET, BY APPLICATION, 2020-2029 (USD MILLION)
TABLE 91 INDIA BEVERAGES IN NEXT GENERATION PACKAGING MARKET, BY APPLICATION, 2020-2029 (USD MILLION)
TABLE 92 INDONESIA NEXT GENERATION PACKAGING MARKET, BY TYPE, 2020-2029 (USD MILLION)
TABLE 93 INDONESIA ACTIVE PACKAGING IN NEXT GENERATION PACKAGING MARKET, BY TYPE, 2020-2029 (USD MILLION)
TABLE 94 INDONESIA NEXT GENERATION PACKAGING MARKET, BY FUNCTION, 2020-2029 (USD MILLION)
TABLE 95 INDONESIA NEXT GENERATION PACKAGING MARKET, BY TECHNOLOGY, 2020-2029 (USD MILLION)
TABLE 96 INDONESIA NEXT GENERATION PACKAGING MARKET, BY MATERIAL, 2020-2029 (USD MILLION)
TABLE 97 INDONESIA NEXT GENERATION PACKAGING MARKET, BY APPLICATION, 2020-2029 (USD MILLION)
TABLE 98 INDONESIA FOOD IN NEXT GENERATION PACKAGING MARKET, BY APPLICATION, 2020-2029 (USD MILLION)
TABLE 99 INDONESIA PROCESSED FOOD IN NEXT GENERATION PACKAGING MARKET, BY APPLICATION, 2020-2029 (USD MILLION)
TABLE 100 INDONESIA BEVERAGES IN NEXT GENERATION PACKAGING MARKET, BY APPLICATION, 2020-2029 (USD MILLION)
TABLE 101 PHILIPPINES NEXT GENERATION PACKAGING MARKET, BY TYPE, 2020-2029 (USD MILLION)
TABLE 102 PHILIPPINES ACTIVE PACKAGING IN NEXT GENERATION PACKAGING MARKET, BY TYPE, 2020-2029 (USD MILLION)
TABLE 103 PHILIPPINES NEXT GENERATION PACKAGING MARKET, BY FUNCTION, 2020-2029 (USD MILLION)
TABLE 104 PHILIPPINES NEXT GENERATION PACKAGING MARKET, BY TECHNOLOGY, 2020-2029 (USD MILLION)
TABLE 105 PHILIPPINES NEXT GENERATION PACKAGING MARKET, BY MATERIAL, 2020-2029 (USD MILLION)
TABLE 106 PHILIPPINES NEXT GENERATION PACKAGING MARKET, BY APPLICATION, 2020-2029 (USD MILLION)
TABLE 107 PHILIPPINES FOOD IN NEXT GENERATION PACKAGING MARKET, BY APPLICATION, 2020-2029 (USD MILLION)
TABLE 108 PHILIPPINES PROCESSED FOOD IN NEXT GENERATION PACKAGING MARKET, BY APPLICATION, 2020-2029 (USD MILLION)
TABLE 109 PHILIPPINES BEVERAGES IN NEXT GENERATION PACKAGING MARKET, BY APPLICATION, 2020-2029 (USD MILLION)
TABLE 110 THAILAND NEXT GENERATION PACKAGING MARKET, BY TYPE, 2020-2029 (USD MILLION)
TABLE 111 THAILAND ACTIVE PACKAGING IN NEXT GENERATION PACKAGING MARKET, BY TYPE, 2020-2029 (USD MILLION)
TABLE 112 THAILAND NEXT GENERATION PACKAGING MARKET, BY FUNCTION, 2020-2029 (USD MILLION)
TABLE 113 THAILAND NEXT GENERATION PACKAGING MARKET, BY TECHNOLOGY, 2020-2029 (USD MILLION)
TABLE 114 THAILAND NEXT GENERATION PACKAGING MARKET, BY MATERIAL, 2020-2029 (USD MILLION)
TABLE 115 THAILAND NEXT GENERATION PACKAGING MARKET, BY APPLICATION, 2020-2029 (USD MILLION)
TABLE 116 THAILAND FOOD IN NEXT GENERATION PACKAGING MARKET, BY APPLICATION, 2020-2029 (USD MILLION)
TABLE 117 THAILAND PROCESSED FOOD IN NEXT GENERATION PACKAGING MARKET, BY APPLICATION, 2020-2029 (USD MILLION)
TABLE 118 THAILAND BEVERAGES IN NEXT GENERATION PACKAGING MARKET, BY APPLICATION, 2020-2029 (USD MILLION)
TABLE 119 MALAYSIA NEXT GENERATION PACKAGING MARKET, BY TYPE, 2020-2029 (USD MILLION)
TABLE 120 MALAYSIA ACTIVE PACKAGING IN NEXT GENERATION PACKAGING MARKET, BY TYPE, 2020-2029 (USD MILLION)
TABLE 121 MALAYSIA NEXT GENERATION PACKAGING MARKET, BY FUNCTION, 2020-2029 (USD MILLION)
TABLE 122 MALAYSIA NEXT GENERATION PACKAGING MARKET, BY TECHNOLOGY, 2020-2029 (USD MILLION)
TABLE 123 MALAYSIA NEXT GENERATION PACKAGING MARKET, BY MATERIAL, 2020-2029 (USD MILLION)
TABLE 124 MALAYSIA NEXT GENERATION PACKAGING MARKET, BY APPLICATION, 2020-2029 (USD MILLION)
TABLE 125 MALAYSIA FOOD IN NEXT GENERATION PACKAGING MARKET, BY APPLICATION, 2020-2029 (USD MILLION)
TABLE 126 MALAYSIA PROCESSED FOOD IN NEXT GENERATION PACKAGING MARKET, BY APPLICATION, 2020-2029 (USD MILLION)
TABLE 127 MALAYSIA BEVERAGES IN NEXT GENERATION PACKAGING MARKET, BY APPLICATION, 2020-2029 (USD MILLION)
TABLE 128 SINGAPORE NEXT GENERATION PACKAGING MARKET, BY TYPE, 2020-2029 (USD MILLION)
TABLE 129 SINGAPORE ACTIVE PACKAGING IN NEXT GENERATION PACKAGING MARKET, BY TYPE, 2020-2029 (USD MILLION)
TABLE 130 SINGAPORE NEXT GENERATION PACKAGING MARKET, BY FUNCTION, 2020-2029 (USD MILLION)
TABLE 131 SINGAPORE NEXT GENERATION PACKAGING MARKET, BY TECHNOLOGY, 2020-2029 (USD MILLION)
TABLE 132 SINGAPORE NEXT GENERATION PACKAGING MARKET, BY MATERIAL, 2020-2029 (USD MILLION)
TABLE 133 SINGAPORE NEXT GENERATION PACKAGING MARKET, BY APPLICATION, 2020-2029 (USD MILLION)
TABLE 134 SINGAPORE FOOD IN NEXT GENERATION PACKAGING MARKET, BY APPLICATION, 2020-2029 (USD MILLION)
TABLE 135 SINGAPORE PROCESSED FOOD IN NEXT GENERATION PACKAGING MARKET, BY APPLICATION, 2020-2029 (USD MILLION)
TABLE 136 SINGAPORE BEVERAGES IN NEXT GENERATION PACKAGING MARKET, BY APPLICATION, 2020-2029 (USD MILLION)
TABLE 137 REST OF ASIA-PACIFIC NEXT GENERATION PACKAGING MARKET, BY TYPE, 2020-2029 (USD MILLION)
TABLE 138 NORTH AMERICA NEXT GENERATION PACKAGING MARKET, BY COUNTRY, 2020-2029 (USD MILLION)
TABLE 139 NORTH AMERICA NEXT GENERATION PACKAGING MARKET, BY TYPE, 2020-2029 (USD MILLION)
TABLE 140 NORTH AMERICA ACTIVE PACKAGING IN NEXT GENERATION PACKAGING MARKET, BY TYPE, 2020-2029 (USD MILLION)
TABLE 141 NORTH AMERICA NEXT GENERATION PACKAGING MARKET, BY FUNCTION, 2020-2029 (USD MILLION)
TABLE 142 NORTH AMERICA NEXT GENERATION PACKAGING MARKET, BY TECHNOLOGY, 2020-2029 (USD MILLION)
TABLE 143 NORTH AMERICA NEXT GENERATION PACKAGING MARKET, BY MATERIAL, 2020-2029 (USD MILLION)
TABLE 144 NORTH AMERICA NEXT GENERATION PACKAGING MARKET, BY APPLICATION, 2020-2029 (USD MILLION)
TABLE 145 NORTH AMERICA FOOD IN NEXT GENERATION PACKAGING MARKET, BY APPLICATION, 2020-2029 (USD MILLION)
TABLE 146 NORTH AMERICA PROCESSED FOOD IN NEXT GENERATION PACKAGING MARKET, BY APPLICATION, 2020-2029 (USD MILLION)
TABLE 147 NORTH AMERICA BEVERAGES IN NEXT GENERATION PACKAGING MARKET, BY APPLICATION, 2020-2029 (USD MILLION)
TABLE 148 U.S. NEXT GENERATION PACKAGING MARKET, BY TYPE, 2020-2029 (USD MILLION)
TABLE 149 U.S. ACTIVE PACKAGING IN NEXT GENERATION PACKAGING MARKET, BY TYPE, 2020-2029 (USD MILLION)
TABLE 150 U.S. NEXT GENERATION PACKAGING MARKET, BY FUNCTION, 2020-2029 (USD MILLION)
TABLE 151 U.S. NEXT GENERATION PACKAGING MARKET, BY TECHNOLOGY, 2020-2029 (USD MILLION)
TABLE 152 U.S. NEXT GENERATION PACKAGING MARKET, BY MATERIAL, 2020-2029 (USD MILLION)
TABLE 153 U.S. NEXT GENERATION PACKAGING MARKET, BY APPLICATION, 2020-2029 (USD MILLION)
TABLE 154 U.S. FOOD IN NEXT GENERATION PACKAGING MARKET, BY APPLICATION, 2020-2029 (USD MILLION)
TABLE 155 U.S. PROCESSED FOOD IN NEXT GENERATION PACKAGING MARKET, BY APPLICATION, 2020-2029 (USD MILLION)
TABLE 156 U.S. BEVERAGES IN NEXT GENERATION PACKAGING MARKET, BY APPLICATION, 2020-2029 (USD MILLION)
TABLE 157 CANADA NEXT GENERATION PACKAGING MARKET, BY TYPE, 2020-2029 (USD MILLION)
TABLE 158 CANADA ACTIVE PACKAGING IN NEXT GENERATION PACKAGING MARKET, BY TYPE, 2020-2029 (USD MILLION)
TABLE 159 CANADA NEXT GENERATION PACKAGING MARKET, BY FUNCTION, 2020-2029 (USD MILLION)
TABLE 160 CANADA NEXT GENERATION PACKAGING MARKET, BY TECHNOLOGY, 2020-2029 (USD MILLION)
TABLE 161 CANADA NEXT GENERATION PACKAGING MARKET, BY MATERIAL, 2020-2029 (USD MILLION)
TABLE 162 CANADA NEXT GENERATION PACKAGING MARKET, BY APPLICATION, 2020-2029 (USD MILLION)
TABLE 163 CANADA FOOD IN NEXT GENERATION PACKAGING MARKET, BY APPLICATION, 2020-2029 (USD MILLION)
TABLE 164 CANADA PROCESSED FOOD IN NEXT GENERATION PACKAGING MARKET, BY APPLICATION, 2020-2029 (USD MILLION)
TABLE 165 CANADA BEVERAGES IN NEXT GENERATION PACKAGING MARKET, BY APPLICATION, 2020-2029 (USD MILLION)
TABLE 166 MEXICO NEXT GENERATION PACKAGING MARKET, BY TYPE, 2020-2029 (USD MILLION)
TABLE 167 MEXICO ACTIVE PACKAGING IN NEXT GENERATION PACKAGING MARKET, BY TYPE, 2020-2029 (USD MILLION)
TABLE 168 MEXICO NEXT GENERATION PACKAGING MARKET, BY FUNCTION, 2020-2029 (USD MILLION)
TABLE 169 MEXICO NEXT GENERATION PACKAGING MARKET, BY TECHNOLOGY, 2020-2029 (USD MILLION)
TABLE 170 MEXICO NEXT GENERATION PACKAGING MARKET, BY MATERIAL, 2020-2029 (USD MILLION)
TABLE 171 MEXICO NEXT GENERATION PACKAGING MARKET, BY APPLICATION, 2020-2029 (USD MILLION)
TABLE 172 MEXICO FOOD IN NEXT GENERATION PACKAGING MARKET, BY APPLICATION, 2020-2029 (USD MILLION)
TABLE 173 MEXICO PROCESSED FOOD IN NEXT GENERATION PACKAGING MARKET, BY APPLICATION, 2020-2029 (USD MILLION)
TABLE 174 MEXICO BEVERAGES IN NEXT GENERATION PACKAGING MARKET, BY APPLICATION, 2020-2029 (USD MILLION)
TABLE 175 EUROPE NEXT GENERATION PACKAGING MARKET, BY COUNTRY, 2020-2029 (USD MILLION)
TABLE 176 EUROPE NEXT GENERATION PACKAGING MARKET, BY TYPE, 2020-2029 (USD MILLION)
TABLE 177 EUROPE ACTIVE PACKAGING IN NEXT GENERATION PACKAGING MARKET, BY TYPE, 2020-2029 (USD MILLION)
TABLE 178 EUROPE NEXT GENERATION PACKAGING MARKET, BY FUNCTION, 2020-2029 (USD MILLION)
TABLE 179 EUROPE NEXT GENERATION PACKAGING MARKET, BY TECHNOLOGY, 2020-2029 (USD MILLION)
TABLE 180 EUROPE NEXT GENERATION PACKAGING MARKET, BY MATERIAL, 2020-2029 (USD MILLION)
TABLE 181 EUROPE NEXT GENERATION PACKAGING MARKET, BY APPLICATION, 2020-2029 (USD MILLION)
TABLE 182 EUROPE FOOD IN NEXT GENERATION PACKAGING MARKET, BY APPLICATION, 2020-2029 (USD MILLION)
TABLE 183 EUROPE PROCESSED FOOD IN NEXT GENERATION PACKAGING MARKET, BY APPLICATION, 2020-2029 (USD MILLION)
TABLE 184 EUROPE BEVERAGES IN NEXT GENERATION PACKAGING MARKET, BY APPLICATION, 2020-2029 (USD MILLION)
TABLE 185 GERMANY NEXT GENERATION PACKAGING MARKET, BY TYPE, 2020-2029 (USD MILLION)
TABLE 186 GERMANY ACTIVE PACKAGING IN NEXT GENERATION PACKAGING MARKET, BY TYPE, 2020-2029 (USD MILLION)
TABLE 187 GERMANY NEXT GENERATION PACKAGING MARKET, BY FUNCTION, 2020-2029 (USD MILLION)
TABLE 188 GERMANY NEXT GENERATION PACKAGING MARKET, BY TECHNOLOGY, 2020-2029 (USD MILLION)
TABLE 189 GERMANY NEXT GENERATION PACKAGING MARKET, BY MATERIAL, 2020-2029 (USD MILLION)
TABLE 190 GERMANY NEXT GENERATION PACKAGING MARKET, BY APPLICATION, 2020-2029 (USD MILLION)
TABLE 191 GERMANY FOOD IN NEXT GENERATION PACKAGING MARKET, BY APPLICATION, 2020-2029 (USD MILLION)
TABLE 192 GERMANY PROCESSED FOOD IN NEXT GENERATION PACKAGING MARKET, BY APPLICATION, 2020-2029 (USD MILLION)
TABLE 193 GERMANY BEVERAGES IN NEXT GENERATION PACKAGING MARKET, BY APPLICATION, 2020-2029 (USD MILLION)
TABLE 194 FRANCE NEXT GENERATION PACKAGING MARKET, BY TYPE, 2020-2029 (USD MILLION)
TABLE 195 FRANCE ACTIVE PACKAGING IN NEXT GENERATION PACKAGING MARKET, BY TYPE, 2020-2029 (USD MILLION)
TABLE 196 FRANCE NEXT GENERATION PACKAGING MARKET, BY FUNCTION, 2020-2029 (USD MILLION)
TABLE 197 FRANCE NEXT GENERATION PACKAGING MARKET, BY TECHNOLOGY, 2020-2029 (USD MILLION)
TABLE 198 FRANCE NEXT GENERATION PACKAGING MARKET, BY MATERIAL, 2020-2029 (USD MILLION)
TABLE 199 FRANCE NEXT GENERATION PACKAGING MARKET, BY APPLICATION, 2020-2029 (USD MILLION)
TABLE 200 FRANCE FOOD IN NEXT GENERATION PACKAGING MARKET, BY APPLICATION, 2020-2029 (USD MILLION)
TABLE 201 FRANCE PROCESSED FOOD IN NEXT GENERATION PACKAGING MARKET, BY APPLICATION, 2020-2029 (USD MILLION)
TABLE 202 FRANCE BEVERAGES IN NEXT GENERATION PACKAGING MARKET, BY APPLICATION, 2020-2029 (USD MILLION)
TABLE 203 U.K. NEXT GENERATION PACKAGING MARKET, BY TYPE, 2020-2029 (USD MILLION)
TABLE 204 U.K. ACTIVE PACKAGING IN NEXT GENERATION PACKAGING MARKET, BY TYPE, 2020-2029 (USD MILLION)
TABLE 205 U.K. NEXT GENERATION PACKAGING MARKET, BY FUNCTION, 2020-2029 (USD MILLION)
TABLE 206 U.K. NEXT GENERATION PACKAGING MARKET, BY TECHNOLOGY, 2020-2029 (USD MILLION)
TABLE 207 U.K. NEXT GENERATION PACKAGING MARKET, BY MATERIAL, 2020-2029 (USD MILLION)
TABLE 208 U.K. NEXT GENERATION PACKAGING MARKET, BY APPLICATION, 2020-2029 (USD MILLION)
TABLE 209 U.K. FOOD IN NEXT GENERATION PACKAGING MARKET, BY APPLICATION, 2020-2029 (USD MILLION)
TABLE 210 U.K. PROCESSED FOOD IN NEXT GENERATION PACKAGING MARKET, BY APPLICATION, 2020-2029 (USD MILLION)
TABLE 211 U.K. BEVERAGES IN NEXT GENERATION PACKAGING MARKET, BY APPLICATION, 2020-2029 (USD MILLION)
TABLE 212 ITALY NEXT GENERATION PACKAGING MARKET, BY TYPE, 2020-2029 (USD MILLION)
TABLE 213 ITALY ACTIVE PACKAGING IN NEXT GENERATION PACKAGING MARKET, BY TYPE, 2020-2029 (USD MILLION)
TABLE 214 ITALY NEXT GENERATION PACKAGING MARKET, BY FUNCTION, 2020-2029 (USD MILLION)
TABLE 215 ITALY NEXT GENERATION PACKAGING MARKET, BY TECHNOLOGY, 2020-2029 (USD MILLION)
TABLE 216 ITALY NEXT GENERATION PACKAGING MARKET, BY MATERIAL, 2020-2029 (USD MILLION)
TABLE 217 ITALY NEXT GENERATION PACKAGING MARKET, BY APPLICATION, 2020-2029 (USD MILLION)
TABLE 218 ITALY FOOD IN NEXT GENERATION PACKAGING MARKET, BY APPLICATION, 2020-2029 (USD MILLION)
TABLE 219 ITALY PROCESSED FOOD IN NEXT GENERATION PACKAGING MARKET, BY APPLICATION, 2020-2029 (USD MILLION)
TABLE 220 ITALY BEVERAGES IN NEXT GENERATION PACKAGING MARKET, BY APPLICATION, 2020-2029 (USD MILLION)
TABLE 221 SPAIN NEXT GENERATION PACKAGING MARKET, BY TYPE, 2020-2029 (USD MILLION)
TABLE 222 SPAIN ACTIVE PACKAGING IN NEXT GENERATION PACKAGING MARKET, BY TYPE, 2020-2029 (USD MILLION)
TABLE 223 SPAIN NEXT GENERATION PACKAGING MARKET, BY FUNCTION, 2020-2029 (USD MILLION)
TABLE 224 SPAIN NEXT GENERATION PACKAGING MARKET, BY TECHNOLOGY, 2020-2029 (USD MILLION)
TABLE 225 SPAIN NEXT GENERATION PACKAGING MARKET, BY MATERIAL, 2020-2029 (USD MILLION)
TABLE 226 SPAIN NEXT GENERATION PACKAGING MARKET, BY APPLICATION, 2020-2029 (USD MILLION)
TABLE 227 SPAIN FOOD IN NEXT GENERATION PACKAGING MARKET, BY APPLICATION, 2020-2029 (USD MILLION)
TABLE 228 SPAIN PROCESSED FOOD IN NEXT GENERATION PACKAGING MARKET, BY APPLICATION, 2020-2029 (USD MILLION)
TABLE 229 SPAIN BEVERAGES IN NEXT GENERATION PACKAGING MARKET, BY APPLICATION, 2020-2029 (USD MILLION)
TABLE 230 RUSSIA NEXT GENERATION PACKAGING MARKET, BY TYPE, 2020-2029 (USD MILLION)
TABLE 231 RUSSIA ACTIVE PACKAGING IN NEXT GENERATION PACKAGING MARKET, BY TYPE, 2020-2029 (USD MILLION)
TABLE 232 RUSSIA NEXT GENERATION PACKAGING MARKET, BY FUNCTION, 2020-2029 (USD MILLION)
TABLE 233 RUSSIA NEXT GENERATION PACKAGING MARKET, BY TECHNOLOGY, 2020-2029 (USD MILLION)
TABLE 234 RUSSIA NEXT GENERATION PACKAGING MARKET, BY MATERIAL, 2020-2029 (USD MILLION)
TABLE 235 RUSSIA NEXT GENERATION PACKAGING MARKET, BY APPLICATION, 2020-2029 (USD MILLION)
TABLE 236 RUSSIA FOOD IN NEXT GENERATION PACKAGING MARKET, BY APPLICATION, 2020-2029 (USD MILLION)
TABLE 237 RUSSIA PROCESSED FOOD IN NEXT GENERATION PACKAGING MARKET, BY APPLICATION, 2020-2029 (USD MILLION)
TABLE 238 RUSSIA BEVERAGES IN NEXT GENERATION PACKAGING MARKET, BY APPLICATION, 2020-2029 (USD MILLION)
TABLE 239 BELGIUM NEXT GENERATION PACKAGING MARKET, BY TYPE, 2020-2029 (USD MILLION)
TABLE 240 BELGIUM ACTIVE PACKAGING IN NEXT GENERATION PACKAGING MARKET, BY TYPE, 2020-2029 (USD MILLION)
TABLE 241 BELGIUM NEXT GENERATION PACKAGING MARKET, BY FUNCTION, 2020-2029 (USD MILLION)
TABLE 242 BELGIUM NEXT GENERATION PACKAGING MARKET, BY TECHNOLOGY, 2020-2029 (USD MILLION)
TABLE 243 BELGIUM NEXT GENERATION PACKAGING MARKET, BY MATERIAL, 2020-2029 (USD MILLION)
TABLE 244 BELGIUM NEXT GENERATION PACKAGING MARKET, BY APPLICATION, 2020-2029 (USD MILLION)
TABLE 245 BELGIUM FOOD IN NEXT GENERATION PACKAGING MARKET, BY APPLICATION, 2020-2029 (USD MILLION)
TABLE 246 BELGIUM PROCESSED FOOD IN NEXT GENERATION PACKAGING MARKET, BY APPLICATION, 2020-2029 (USD MILLION)
TABLE 247 BELGIUM BEVERAGES IN NEXT GENERATION PACKAGING MARKET, BY APPLICATION, 2020-2029 (USD MILLION)
TABLE 248 NETHERLANDS NEXT GENERATION PACKAGING MARKET, BY TYPE, 2020-2029 (USD MILLION)
TABLE 249 NETHERLANDS ACTIVE PACKAGING IN NEXT GENERATION PACKAGING MARKET, BY TYPE, 2020-2029 (USD MILLION)
TABLE 250 NETHERLANDS NEXT GENERATION PACKAGING MARKET, BY FUNCTION, 2020-2029 (USD MILLION)
TABLE 251 NETHERLANDS NEXT GENERATION PACKAGING MARKET, BY TECHNOLOGY, 2020-2029 (USD MILLION)
TABLE 252 NETHERLANDS NEXT GENERATION PACKAGING MARKET, BY MATERIAL, 2020-2029 (USD MILLION)
TABLE 253 NETHERLANDS NEXT GENERATION PACKAGING MARKET, BY APPLICATION, 2020-2029 (USD MILLION)
TABLE 254 NETHERLANDS FOOD IN NEXT GENERATION PACKAGING MARKET, BY APPLICATION, 2020-2029 (USD MILLION)
TABLE 255 NETHERLANDS PROCESSED FOOD IN NEXT GENERATION PACKAGING MARKET, BY APPLICATION, 2020-2029 (USD MILLION)
TABLE 256 NETHERLANDS BEVERAGES IN NEXT GENERATION PACKAGING MARKET, BY APPLICATION, 2020-2029 (USD MILLION)
TABLE 257 SWITZERLAND NEXT GENERATION PACKAGING MARKET, BY TYPE, 2020-2029 (USD MILLION)
TABLE 258 SWITZERLAND ACTIVE PACKAGING IN NEXT GENERATION PACKAGING MARKET, BY TYPE, 2020-2029 (USD MILLION)
TABLE 259 SWITZERLAND NEXT GENERATION PACKAGING MARKET, BY FUNCTION, 2020-2029 (USD MILLION)
TABLE 260 SWITZERLAND NEXT GENERATION PACKAGING MARKET, BY TECHNOLOGY, 2020-2029 (USD MILLION)
TABLE 261 SWITZERLAND NEXT GENERATION PACKAGING MARKET, BY MATERIAL, 2020-2029 (USD MILLION)
TABLE 262 SWITZERLAND NEXT GENERATION PACKAGING MARKET, BY APPLICATION, 2020-2029 (USD MILLION)
TABLE 263 SWITZERLAND FOOD IN NEXT GENERATION PACKAGING MARKET, BY APPLICATION, 2020-2029 (USD MILLION)
TABLE 264 SWITZERLAND PROCESSED FOOD IN NEXT GENERATION PACKAGING MARKET, BY APPLICATION, 2020-2029 (USD MILLION)
TABLE 265 SWITZERLAND BEVERAGES IN NEXT GENERATION PACKAGING MARKET, BY APPLICATION, 2020-2029 (USD MILLION)
TABLE 266 TURKEY NEXT GENERATION PACKAGING MARKET, BY TYPE, 2020-2029 (USD MILLION)
TABLE 267 TURKEY ACTIVE PACKAGING IN NEXT GENERATION PACKAGING MARKET, BY TYPE, 2020-2029 (USD MILLION)
TABLE 268 TURKEY NEXT GENERATION PACKAGING MARKET, BY FUNCTION, 2020-2029 (USD MILLION)
TABLE 269 TURKEY NEXT GENERATION PACKAGING MARKET, BY TECHNOLOGY, 2020-2029 (USD MILLION)
TABLE 270 TURKEY NEXT GENERATION PACKAGING MARKET, BY MATERIAL, 2020-2029 (USD MILLION)
TABLE 271 TURKEY NEXT GENERATION PACKAGING MARKET, BY APPLICATION, 2020-2029 (USD MILLION)
TABLE 272 TURKEY FOOD IN NEXT GENERATION PACKAGING MARKET, BY APPLICATION, 2020-2029 (USD MILLION)
TABLE 273 TURKEY PROCESSED FOOD IN NEXT GENERATION PACKAGING MARKET, BY APPLICATION, 2020-2029 (USD MILLION)
TABLE 274 TURKEY BEVERAGES IN NEXT GENERATION PACKAGING MARKET, BY APPLICATION, 2020-2029 (USD MILLION)
TABLE 275 LUXEMBURG NEXT GENERATION PACKAGING MARKET, BY TYPE, 2020-2029 (USD MILLION)
TABLE 276 LUXEMBURG ACTIVE PACKAGING IN NEXT GENERATION PACKAGING MARKET, BY TYPE, 2020-2029 (USD MILLION)
TABLE 277 LUXEMBURG NEXT GENERATION PACKAGING MARKET, BY FUNCTION, 2020-2029 (USD MILLION)
TABLE 278 LUXEMBURG NEXT GENERATION PACKAGING MARKET, BY TECHNOLOGY, 2020-2029 (USD MILLION)
TABLE 279 LUXEMBURG NEXT GENERATION PACKAGING MARKET, BY MATERIAL, 2020-2029 (USD MILLION)
TABLE 280 LUXEMBURG NEXT GENERATION PACKAGING MARKET, BY APPLICATION, 2020-2029 (USD MILLION)
TABLE 281 LUXEMBURG FOOD IN NEXT GENERATION PACKAGING MARKET, BY APPLICATION, 2020-2029 (USD MILLION)
TABLE 282 LUXEMBURG PROCESSED FOOD IN NEXT GENERATION PACKAGING MARKET, BY APPLICATION, 2020-2029 (USD MILLION)
TABLE 283 LUXEMBURG BEVERAGES IN NEXT GENERATION PACKAGING MARKET, BY APPLICATION, 2020-2029 (USD MILLION)
TABLE 284 REST OF EUROPE NEXT GENERATION PACKAGING MARKET, BY TYPE, 2020-2029 (USD MILLION)
TABLE 285 MIDDLE EAST AND AFRICA NEXT GENERATION PACKAGING MARKET, BY COUNTRY, 2020-2029 (USD MILLION)
TABLE 286 MIDDLE EAST AND AFRICA NEXT GENERATION PACKAGING MARKET, BY TYPE, 2020-2029 (USD MILLION)
TABLE 287 MIDDLE EAST AND AFRICA ACTIVE PACKAGING IN NEXT GENERATION PACKAGING MARKET, BY TYPE, 2020-2029 (USD MILLION)
TABLE 288 MIDDLE EAST AND AFRICA NEXT GENERATION PACKAGING MARKET, BY FUNCTION, 2020-2029 (USD MILLION)
TABLE 289 MIDDLE EAST AND AFRICA NEXT GENERATION PACKAGING MARKET, BY TECHNOLOGY, 2020-2029 (USD MILLION)
TABLE 290 MIDDLE EAST AND AFRICA NEXT GENERATION PACKAGING MARKET, BY MATERIAL, 2020-2029 (USD MILLION)
TABLE 291 MIDDLE EAST AND AFRICA NEXT GENERATION PACKAGING MARKET, BY APPLICATION, 2020-2029 (USD MILLION)
TABLE 292 MIDDLE EAST AND AFRICA FOOD IN NEXT GENERATION PACKAGING MARKET, BY APPLICATION, 2020-2029 (USD MILLION)
TABLE 293 MIDDLE EAST AND AFRICA PROCESSED FOOD IN NEXT GENERATION PACKAGING MARKET, BY APPLICATION, 2020-2029 (USD MILLION)
TABLE 294 MIDDLE EAST AND AFRICA BEVERAGES IN NEXT GENERATION PACKAGING MARKET, BY APPLICATION, 2020-2029 (USD MILLION)
TABLE 295 SOUTH AFRICA NEXT GENERATION PACKAGING MARKET, BY TYPE, 2020-2029 (USD MILLION)
TABLE 296 SOUTH AFRICA ACTIVE PACKAGING IN NEXT GENERATION PACKAGING MARKET, BY TYPE, 2020-2029 (USD MILLION)
TABLE 297 SOUTH AFRICA NEXT GENERATION PACKAGING MARKET, BY FUNCTION, 2020-2029 (USD MILLION)
TABLE 298 SOUTH AFRICA NEXT GENERATION PACKAGING MARKET, BY TECHNOLOGY, 2020-2029 (USD MILLION)
TABLE 299 SOUTH AFRICA NEXT GENERATION PACKAGING MARKET, BY MATERIAL, 2020-2029 (USD MILLION)
TABLE 300 SOUTH AFRICA NEXT GENERATION PACKAGING MARKET, BY APPLICATION, 2020-2029 (USD MILLION)
TABLE 301 SOUTH AFRICA FOOD IN NEXT GENERATION PACKAGING MARKET, BY APPLICATION, 2020-2029 (USD MILLION)
TABLE 302 SOUTH AFRICA PROCESSED FOOD IN NEXT GENERATION PACKAGING MARKET, BY APPLICATION, 2020-2029 (USD MILLION)
TABLE 303 SOUTH AFRICA BEVERAGES IN NEXT GENERATION PACKAGING MARKET, BY APPLICATION, 2020-2029 (USD MILLION)
TABLE 304 SAUDI ARABIA NEXT GENERATION PACKAGING MARKET, BY TYPE, 2020-2029 (USD MILLION)
TABLE 305 SAUDI ARABIA ACTIVE PACKAGING IN NEXT GENERATION PACKAGING MARKET, BY TYPE, 2020-2029 (USD MILLION)
TABLE 306 SAUDI ARABIA NEXT GENERATION PACKAGING MARKET, BY FUNCTION, 2020-2029 (USD MILLION)
TABLE 307 SAUDI ARABIA NEXT GENERATION PACKAGING MARKET, BY TECHNOLOGY, 2020-2029 (USD MILLION)
TABLE 308 SAUDI ARABIA NEXT GENERATION PACKAGING MARKET, BY MATERIAL, 2020-2029 (USD MILLION)
TABLE 309 SAUDI ARABIA NEXT GENERATION PACKAGING MARKET, BY APPLICATION, 2020-2029 (USD MILLION)
TABLE 310 SAUDI ARABIA FOOD IN NEXT GENERATION PACKAGING MARKET, BY APPLICATION, 2020-2029 (USD MILLION)
TABLE 311 SAUDI ARABIA PROCESSED FOOD IN NEXT GENERATION PACKAGING MARKET, BY APPLICATION, 2020-2029 (USD MILLION)
TABLE 312 SAUDI ARABIA BEVERAGES IN NEXT GENERATION PACKAGING MARKET, BY APPLICATION, 2020-2029 (USD MILLION)
TABLE 313 U.A.E. NEXT GENERATION PACKAGING MARKET, BY TYPE, 2020-2029 (USD MILLION)
TABLE 314 U.A.E. ACTIVE PACKAGING IN NEXT GENERATION PACKAGING MARKET, BY TYPE, 2020-2029 (USD MILLION)
TABLE 315 U.A.E. NEXT GENERATION PACKAGING MARKET, BY FUNCTION, 2020-2029 (USD MILLION)
TABLE 316 U.A.E. NEXT GENERATION PACKAGING MARKET, BY TECHNOLOGY, 2020-2029 (USD MILLION)
TABLE 317 U.A.E. NEXT GENERATION PACKAGING MARKET, BY MATERIAL, 2020-2029 (USD MILLION)
TABLE 318 U.A.E. NEXT GENERATION PACKAGING MARKET, BY APPLICATION, 2020-2029 (USD MILLION)
TABLE 319 U.A.E. FOOD IN NEXT GENERATION PACKAGING MARKET, BY APPLICATION, 2020-2029 (USD MILLION)
TABLE 320 U.A.E. PROCESSED FOOD IN NEXT GENERATION PACKAGING MARKET, BY APPLICATION, 2020-2029 (USD MILLION)
TABLE 321 U.A.E. BEVERAGES IN NEXT GENERATION PACKAGING MARKET, BY APPLICATION, 2020-2029 (USD MILLION)
TABLE 322 EGYPT NEXT GENERATION PACKAGING MARKET, BY TYPE, 2020-2029 (USD MILLION)
TABLE 323 EGYPT ACTIVE PACKAGING IN NEXT GENERATION PACKAGING MARKET, BY TYPE, 2020-2029 (USD MILLION)
TABLE 324 EGYPT NEXT GENERATION PACKAGING MARKET, BY FUNCTION, 2020-2029 (USD MILLION)
TABLE 325 EGYPT NEXT GENERATION PACKAGING MARKET, BY TECHNOLOGY, 2020-2029 (USD MILLION)
TABLE 326 EGYPT NEXT GENERATION PACKAGING MARKET, BY MATERIAL, 2020-2029 (USD MILLION)
TABLE 327 EGYPT NEXT GENERATION PACKAGING MARKET, BY APPLICATION, 2020-2029 (USD MILLION)
TABLE 328 EGYPT FOOD IN NEXT GENERATION PACKAGING MARKET, BY APPLICATION, 2020-2029 (USD MILLION)
TABLE 329 EGYPT PROCESSED FOOD IN NEXT GENERATION PACKAGING MARKET, BY APPLICATION, 2020-2029 (USD MILLION)
TABLE 330 EGYPT BEVERAGES IN NEXT GENERATION PACKAGING MARKET, BY APPLICATION, 2020-2029 (USD MILLION)
TABLE 331 ISRAEL NEXT GENERATION PACKAGING MARKET, BY TYPE, 2020-2029 (USD MILLION)
TABLE 332 ISRAEL ACTIVE PACKAGING IN NEXT GENERATION PACKAGING MARKET, BY TYPE, 2020-2029 (USD MILLION)
TABLE 333 ISRAEL NEXT GENERATION PACKAGING MARKET, BY FUNCTION, 2020-2029 (USD MILLION)
TABLE 334 ISRAEL NEXT GENERATION PACKAGING MARKET, BY TECHNOLOGY, 2020-2029 (USD MILLION)
TABLE 335 ISRAEL NEXT GENERATION PACKAGING MARKET, BY MATERIAL, 2020-2029 (USD MILLION)
TABLE 336 ISRAEL NEXT GENERATION PACKAGING MARKET, BY APPLICATION, 2020-2029 (USD MILLION)
TABLE 337 ISRAEL FOOD IN NEXT GENERATION PACKAGING MARKET, BY APPLICATION, 2020-2029 (USD MILLION)
TABLE 338 ISRAEL PROCESSED FOOD IN NEXT GENERATION PACKAGING MARKET, BY APPLICATION, 2020-2029 (USD MILLION)
TABLE 339 ISRAEL BEVERAGES IN NEXT GENERATION PACKAGING MARKET, BY APPLICATION, 2020-2029 (USD MILLION)
TABLE 340 REST OF MIDDLE EAST & AFRICA NEXT GENERATION PACKAGING MARKET, BY TYPE, 2020-2029 (USD MILLION)
TABLE 341 SOUTH AMERICA NEXT GENERATION PACKAGING MARKET, BY COUNTRY, 2020-2029 (USD MILLION)
TABLE 342 SOUTH AMERICA NEXT GENERATION PACKAGING MARKET, BY TYPE, 2020-2029 (USD MILLION)
TABLE 343 SOUTH AMERICA ACTIVE PACKAGING IN NEXT GENERATION PACKAGING MARKET, BY TYPE, 2020-2029 (USD MILLION)
TABLE 344 SOUTH AMERICA NEXT GENERATION PACKAGING MARKET, BY FUNCTION, 2020-2029 (USD MILLION)
TABLE 345 SOUTH AMERICA NEXT GENERATION PACKAGING MARKET, BY TECHNOLOGY, 2020-2029 (USD MILLION)
TABLE 346 SOUTH AMERICA NEXT GENERATION PACKAGING MARKET, BY MATERIAL, 2020-2029 (USD MILLION)
TABLE 347 SOUTH AMERICA NEXT GENERATION PACKAGING MARKET, BY APPLICATION, 2020-2029 (USD MILLION)
TABLE 348 SOUTH AMERICA FOOD IN NEXT GENERATION PACKAGING MARKET, BY APPLICATION, 2020-2029 (USD MILLION)
TABLE 349 SOUTH AMERICA PROCESSED FOOD IN NEXT GENERATION PACKAGING MARKET, BY APPLICATION, 2020-2029 (USD MILLION)
TABLE 350 SOUTH AMERICA BEVERAGES IN NEXT GENERATION PACKAGING MARKET, BY APPLICATION, 2020-2029 (USD MILLION)
TABLE 351 BRAZIL NEXT GENERATION PACKAGING MARKET, BY TYPE, 2020-2029 (USD MILLION)
TABLE 352 BRAZIL ACTIVE PACKAGING IN NEXT GENERATION PACKAGING MARKET, BY TYPE, 2020-2029 (USD MILLION)
TABLE 353 BRAZIL NEXT GENERATION PACKAGING MARKET, BY FUNCTION, 2020-2029 (USD MILLION)
TABLE 354 BRAZIL NEXT GENERATION PACKAGING MARKET, BY TECHNOLOGY, 2020-2029 (USD MILLION)
TABLE 355 BRAZIL NEXT GENERATION PACKAGING MARKET, BY MATERIAL, 2020-2029 (USD MILLION)
TABLE 356 BRAZIL NEXT GENERATION PACKAGING MARKET, BY APPLICATION, 2020-2029 (USD MILLION)
TABLE 357 BRAZIL FOOD IN NEXT GENERATION PACKAGING MARKET, BY APPLICATION, 2020-2029 (USD MILLION)
TABLE 358 BRAZIL PROCESSED FOOD IN NEXT GENERATION PACKAGING MARKET, BY APPLICATION, 2020-2029 (USD MILLION)
TABLE 359 BRAZIL BEVERAGES IN NEXT GENERATION PACKAGING MARKET, BY APPLICATION, 2020-2029 (USD MILLION)
TABLE 360 ARGENTINA NEXT GENERATION PACKAGING MARKET, BY TYPE, 2020-2029 (USD MILLION)
TABLE 361 ARGENTINA ACTIVE PACKAGING IN NEXT GENERATION PACKAGING MARKET, BY TYPE, 2020-2029 (USD MILLION)
TABLE 362 ARGENTINA NEXT GENERATION PACKAGING MARKET, BY FUNCTION, 2020-2029 (USD MILLION)
TABLE 363 ARGENTINA NEXT GENERATION PACKAGING MARKET, BY TECHNOLOGY, 2020-2029 (USD MILLION)
TABLE 364 ARGENTINA NEXT GENERATION PACKAGING MARKET, BY MATERIAL, 2020-2029 (USD MILLION)
TABLE 365 ARGENTINA NEXT GENERATION PACKAGING MARKET, BY APPLICATION, 2020-2029 (USD MILLION)
TABLE 366 ARGENTINA FOOD IN NEXT GENERATION PACKAGING MARKET, BY APPLICATION, 2020-2029 (USD MILLION)
TABLE 367 ARGENTINA PROCESSED FOOD IN NEXT GENERATION PACKAGING MARKET, BY APPLICATION, 2020-2029 (USD MILLION)
TABLE 368 ARGENTINA BEVERAGES IN NEXT GENERATION PACKAGING MARKET, BY APPLICATION, 2020-2029 (USD MILLION)
TABLE 369 REST OF SOUTH AMERICA NEXT GENERATION PACKAGING MARKET, BY TYPE, 2020-2029 (USD MILLION)
Lista de Figura
FIGURE 1 GLOBAL NEXT GENERATION PACKAGING MARKET: SEGMENTATION
FIGURE 2 GLOBAL NEXT GENERATION PACKAGING MARKET: DATA TRIANGULATION
FIGURE 3 GLOBAL NEXT GENERATION PACKAGING MARKET: DROC ANALYSIS
FIGURE 4 GLOBAL NEXT GENERATION PACKAGING MARKET: GLOBAL VS REGIONAL MARKET ANALYSIS
FIGURE 5 GLOBAL NEXT GENERATION PACKAGING MARKET: COMPANY RESEARCH ANALYSIS
FIGURE 6 GLOBAL NEXT GENERATION PACKAGING MARKET: INTERVIEW DEMOGRAPHICS
FIGURE 7 GLOBAL NEXT GENERATION PACKAGING MARKET: DBMR MARKET POSITION GRID
FIGURE 8 GLOBAL NEXT GENERATION PACKAGING MARKET: VENDOR SHARE ANALYSIS
FIGURE 9 GLOBAL NEXT GENERATION PACKAGING MARKET: SEGMENTATION
FIGURE 10 ASIA-PACIFIC IS EXPECTED TO DOMINATE GLOBAL NEXT GENERATION PACKAGING MARKET AND IS EXPECTED TO GROW WITH HIGHEST CAGR IN FORECAST PERIOD OF 2022 TO 2029
FIGURE 11 AN INCREASE IN CONSUMPTION OF BEVERAGES AND HEALTH AWARENESS AMONG CONSUMERS IS EXPECTED TO DRIVE GLOBAL NEXT GENERATION PACKAGING MARKET IN THE FORECAST PERIOD OF 2022 TO 2029
FIGURE 12 PACKAGING TYPE SEGMENT IS EXPECTED TO ACCOUNT FOR LARGEST SHARE OF GLOBAL NEXT GENERATION PACKAGING MARKET IN 2022 & 2029
FIGURE 13 ASIA-PACIFIC IS THE FASTEST-GROWING MARKET FOR NEXT GENERATION PACKAGING MANUFACTURERS IN THE FORECAST PERIOD OF 2022 TO 2029
FIGURE 14 DRIVERS, RESTRINTS, OPPORTUNITIES AND CHALLENGES OF GLOBAL NEXT GENERATION PACKAGING MARKET
FIGURE 15 GLOBAL NEXT GENERATION PACKAGING MARKET, BY TYPE, 2021
FIGURE 16 GLOBAL NEXT GENERATION PACKAGING MARKET, BY FUNCTION, 2021
FIGURE 17 GLOBAL NEXT GENERATION PACKAGING MARKET, BY TECHNOLOGY, 2021
FIGURE 18 GLOBAL NEXT GENERATION PACKAGING MARKET, BY MATERIAL, 2021
FIGURE 19 GLOBAL NEXT GENERATION MARKET, BY APPLICATION, 2021
FIGURE 20 GLOBAL NEXT GENERATION PACKAGING MARKET: SNAPSHOT (2021)
FIGURE 21 GLOBAL NEXT GENERATION PACKAGING MARKET: BY REGION (2021)
FIGURE 22 GLOBAL NEXT GENERATION PACKAGING MARKET: BY REGION (2022 & 2029)
FIGURE 23 GLOBAL NEXT GENERATION PACKAGING MARKET: BY REGION (2021 & 2029)
FIGURE 24 GLOBAL NEXT GENERATION PACKAGING MARKET: BY TYPE (2022-2029)
FIGURE 25 ASIA-PACIFIC NEXT GENERATION PACKAGING MARKET: SNAPSHOT (2021)
FIGURE 26 ASIA-PACIFIC NEXT GENERATION PACKAGING MARKET: BY COUNTRY (2021)
FIGURE 27 ASIA-PACIFIC NEXT GENERATION PACKAGING MARKET: BY COUNTRY (2022 & 2029)
FIGURE 28 ASIA-PACIFIC NEXT GENERATION PACKAGING MARKET: BY COUNTRY (2021 & 2029)
FIGURE 29 ASIA-PACIFIC NEXT GENERATION PACKAGING MARKET: BY TYPE (2022 & 2029)
FIGURE 30 NORTH AMERICA NEXT GENERATION PACKAGING MARKET: SNAPSHOT (2021)
FIGURE 31 NORTH AMERICA NEXT GENERATION PACKAGING MARKET: BY COUNTRY (2021)
FIGURE 32 NORTH AMERICA NEXT GENERATION PACKAGING MARKET: BY COUNTRY (2022 & 2029)
FIGURE 33 NORTH AMERICA NEXT GENERATION PACKAGING MARKET: BY COUNTRY (2022 & 2029)
FIGURE 34 NORTH AMERICA NEXT GENERATION PACKAGING MARKET: BY TYPE (2022 & 2029)
FIGURE 35 EUROPE NEXT GENERATION PACKAGING MARKET: SNAPSHOT (2021)
FIGURE 36 EUROPE NEXT GENERATION PACKAGING MARKET: BY COUNTRY (2021)
FIGURE 37 EUROPE NEXT GENERATION PACKAGING MARKET: BY COUNTRY (2022 & 2029)
FIGURE 38 EUROPE NEXT GENERATION PACKAGING MARKET: BY COUNTRY (2021 & 2029)
FIGURE 39 EUROPE NEXT GENERATION PACKAGING MARKET: BY TYPE (2022 & 2029)
FIGURE 40 MIDDLE EAST AND AFRICA NEXT GENERATION PACKAGING MARKET: SNAPSHOT (2021)
FIGURE 41 MIDDLE EAST AND AFRICA NEXT GENERATION PACKAGING MARKET: BY COUNTRY (2021)
FIGURE 42 MIDDLE EAST AND AFRICA NEXT GENERATION PACKAGING MARKET: BY COUNTRY (2022 & 2029)
FIGURE 43 MIDDLE EAST AND AFRICA NEXT GENERATION PACKAGING MARKET: BY COUNTRY (2021 & 2029)
FIGURE 44 MIDDLE EAST AND AFRICA NEXT GENERATION PACKAGING MARKET: BY TYPE (2022 & 2029)
FIGURE 45 SOUTH AMERICA NEXT GENERATION PACKAGING MARKET: SNAPSHOT (2021)
FIGURE 46 SOUTH AMERICA NEXT GENERATION PACKAGING MARKET: BY COUNTRY (2021)
FIGURE 47 SOUTH AMERICA NEXT GENERATION PACKAGING MARKET: BY COUNTRY (2022 & 2029)
FIGURE 48 SOUTH AMERICA NEXT GENERATION PACKAGING MARKET: BY COUNTRY (2021 & 2029)
FIGURE 49 SOUTH AMERICA NEXT GENERATION PACKAGING MARKET: BY TYPE (2022 & 2029)
FIGURE 50 GLOBAL NEXT GENERATION PACKAGING MARKET: COMPANY SHARE 2021 (%)
FIGURE 51 NORTH AMERICA NEXT GENERATION PACKAGING MARKET: COMPANY SHARE 2021 (%)
FIGURE 52 EUROPE NEXT GENERATION PACKAGING MARKET: COMPANY SHARE 2021 (%)
FIGURE 53 ASIA-PACIFIC NEXT GENERATION PACKAGING MARKET: COMPANY SHARE 2021 (%)
Metodologia de Investigação
A recolha de dados e a análise do ano base são feitas através de módulos de recolha de dados com amostras grandes. A etapa inclui a obtenção de informações de mercado ou dados relacionados através de diversas fontes e estratégias. Inclui examinar e planear antecipadamente todos os dados adquiridos no passado. Da mesma forma, envolve o exame de inconsistências de informação observadas em diferentes fontes de informação. Os dados de mercado são analisados e estimados utilizando modelos estatísticos e coerentes de mercado. Além disso, a análise da quota de mercado e a análise das principais tendências são os principais fatores de sucesso no relatório de mercado. Para saber mais, solicite uma chamada de analista ou abra a sua consulta.
A principal metodologia de investigação utilizada pela equipa de investigação do DBMR é a triangulação de dados que envolve a mineração de dados, a análise do impacto das variáveis de dados no mercado e a validação primária (especialista do setor). Os modelos de dados incluem grelha de posicionamento de fornecedores, análise da linha de tempo do mercado, visão geral e guia de mercado, grelha de posicionamento da empresa, análise de patentes, análise de preços, análise da quota de mercado da empresa, normas de medição, análise global versus regional e de participação dos fornecedores. Para saber mais sobre a metodologia de investigação, faça uma consulta para falar com os nossos especialistas do setor.
Personalização disponível
A Data Bridge Market Research é líder em investigação formativa avançada. Orgulhamo-nos de servir os nossos clientes novos e existentes com dados e análises que correspondem e atendem aos seus objetivos. O relatório pode ser personalizado para incluir análise de tendências de preços de marcas-alvo, compreensão do mercado para países adicionais (solicite a lista de países), dados de resultados de ensaios clínicos, revisão de literatura, mercado remodelado e análise de base de produtos . A análise de mercado dos concorrentes-alvo pode ser analisada desde análises baseadas em tecnologia até estratégias de carteira de mercado. Podemos adicionar quantos concorrentes necessitar de dados no formato e estilo de dados que procura. A nossa equipa de analistas também pode fornecer dados em tabelas dinâmicas de ficheiros Excel em bruto (livro de factos) ou pode ajudá-lo a criar apresentações a partir dos conjuntos de dados disponíveis no relatório.

