

Mercado global de óleo de neem e concentrados, por tipo (extrato de fruta e semente, extrato de folha e extrato de casca), aplicação (agricultura e pecuária, produtos farmacêuticos e nutracêuticos, cuidados pessoais, automóvel, alimentos e bebidas e outros) - tendências e previsões da indústria até 2030.
Análise e dimensão do mercado de óleo de Neem e concentrados
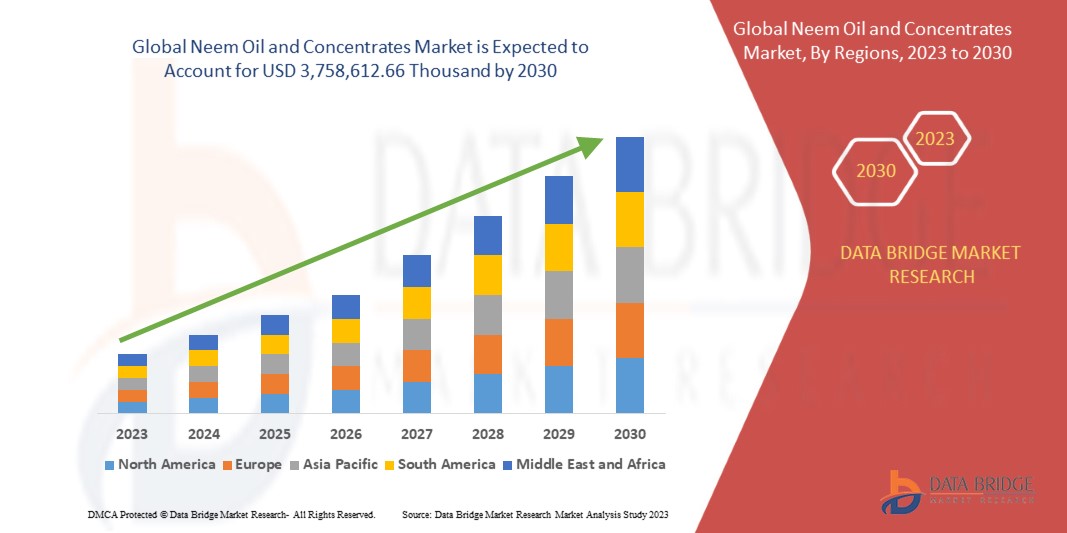
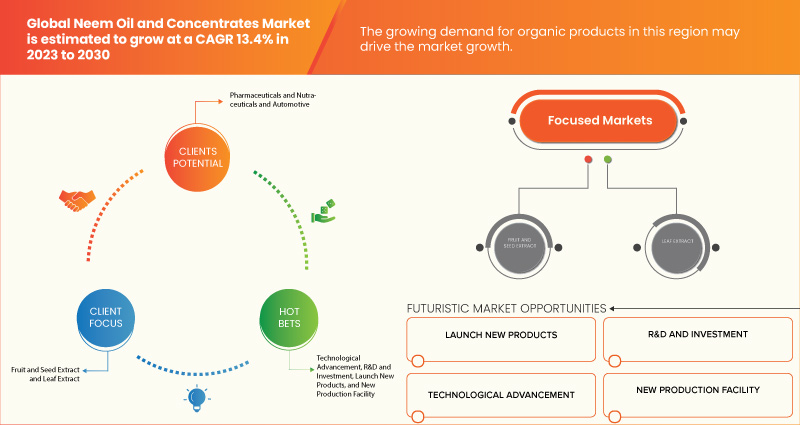
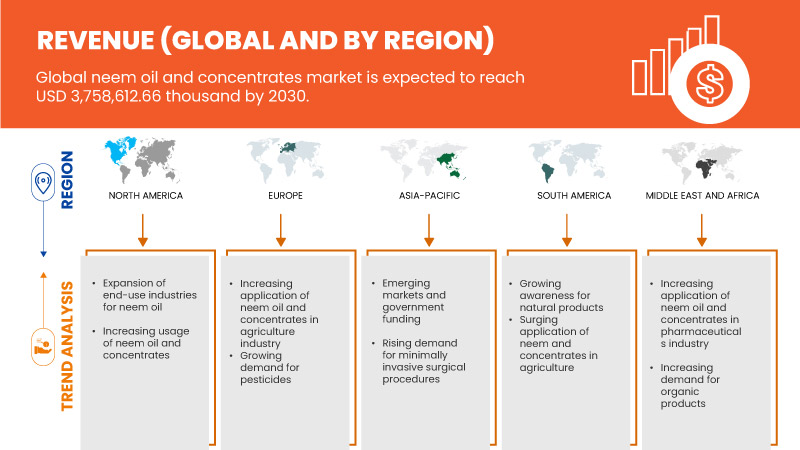
O mercado global de óleo de neem e concentrados deverá crescer significativamente de 2023 a 2030. A Data Bridge Market Research analisa que o mercado está a crescer com um CAGR de 13,4% de 2023 a 2030 e deverá atingir os 3.758 dólares. 612,66 mil até 2030. O principal O fator que impulsiona o crescimento é a crescente popularidade do óleo de neem. Concentra produtos ao longo dos milénios e aumenta a consciencialização sobre as propriedades do óleo de neem e dos produtos concentrados.
O óleo de neem é um óleo vegetal derivado das sementes da árvore de neem (Azadirachta Indica), originária do subcontinente indiano. É utilizado há séculos na medicina tradicional indiana, na agricultura e nos cuidados com a pele. O óleo de neem contém vários compostos biologicamente ativos, incluindo azadiractina, nimbina e nimbidina, responsáveis pelas suas propriedades medicinais e pesticidas. Possui propriedades antifúngicas, antibacterianas, antivirais e inseticidas, o que o torna um remédio natural e pesticida popular.
O relatório do mercado global de óleo de neem e concentrados fornece detalhes sobre a quota de mercado, novos desenvolvimentos e o impacto dos participantes do mercado nacional e localizado, analisa as oportunidades em termos de bolsas de receitas emergentes, alterações nas regulamentações do mercado, aprovações de produtos , decisões estratégicas, lançamentos de produtos, expansões geográficas e inovações tecnológicas no mercado. Para compreender a análise e o cenário de mercado, contacte-nos para obter um briefing de analista. A nossa equipa irá ajudá-lo a criar uma solução de impacto na receita para atingir a sua meta desejada.
|
Métrica de Reporte |
Detalhes |
|
Período de previsão |
2023 a 2030 |
|
Ano base |
2022 |
|
Anos históricos |
2021 (Personalizável para 2015 - 2020) |
|
Unidades quantitativas |
Receita em USD Mil e Volume em Toneladas |
|
Segmentos abrangidos |
Por tipo (extrato de fruta e semente, extrato de folha e extrato de casca), aplicação (agricultura e pecuária, produtos farmacêuticos e nutracêuticos, cuidados pessoais, automóvel, alimentos e bebidas e outros) |
|
Países abrangidos |
EUA, Canadá e México, Brasil, Argentina e restante América do Sul, Alemanha, Itália, Reino Unido, França, Espanha, Rússia, Turquia, Holanda, Bélgica, Suíça, Luxemburgo e restante Europa, Japão, China, Índia, Coreia do Sul, Austrália e Nova Zelândia, Filipinas, Malásia, Tailândia, Indonésia, Singapura e restante Ásia-Pacífico, Arábia Saudita, Emirados Árabes Unidos, África do Sul, Egito, Israel e resto do Médio Oriente e África |
|
Atores do mercado abrangidos |
SUNSHIV BOTANICS, ConnOils LLC, VedaOils.com, Ozone Biotech, SPECTRUM BRANDS, INC., Woodstream Corporation, DYNA-GRO, INC, BONIDE Products LLC, GreenWay Biotech, SBM Company (Natria), PF Harris, MYCSA AG, Pele Natural Aromantic Care, Manorama Industries Limited., SUN BIONATURALS e NOW Foods, entre outros |
Definição de Mercado
As sementes da árvore de neem contêm óleo de neem, um inseticida natural. É amarelo ou castanho, exala cheiro a alho/enxofre e tem um sabor amargo. Tem sido utilizada para erradicar doenças e pragas há centenas de anos. O óleo de neem ainda é utilizado hoje em dia em muitos produtos diferentes e em diversas formas. Consistem em champôs, cosméticos , sabonetes e pastas de dentes para animais de estimação. O óleo de neem também pode ser utilizado para produzir biodiesel ou biocombustíveis. O óleo de neem é composto por muitos ingredientes. O repelente e matador de insetos mais eficaz é a azadiractina, derivada do óleo de neem. É conhecido como óleo de neem hidrofóbico clarificado quando há sobras.
Dinâmica do mercado global de óleo de Neem e concentrados
Esta secção trata da compreensão dos impulsionadores, vantagens, restrições e desafios do mercado. Tudo isto é discutido em detalhe abaixo:
Motoristas
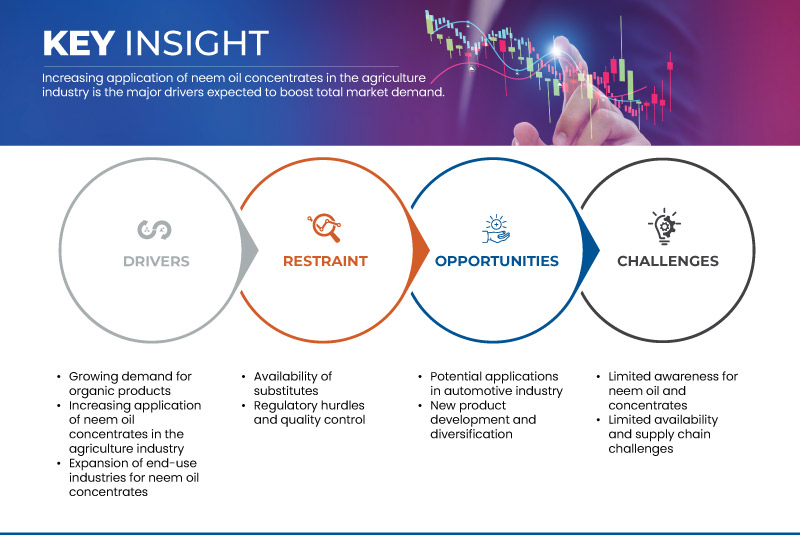
- Crescente procura por produtos biológicos
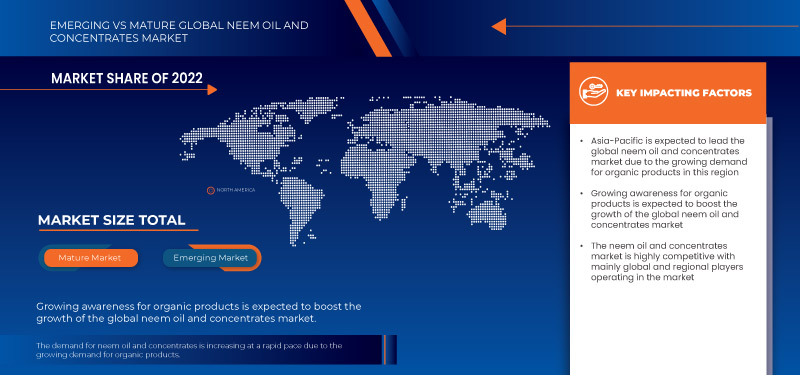
O mercado de concentrados de óleo de neem está a registar uma procura crescente por produtos orgânicos. O óleo de neem derivado da árvore de neem tem vindo a tornar-se cada vez mais popular ultimamente. A procura por produtos biológicos, como os concentrados de óleo de neem, aumentou à medida que os clientes se preocupam mais com a sua saúde e com o ambiente. À medida que os consumidores se tornam mais conscientes dos potenciais perigos para a saúde associados aos produtos químicos sintéticos e aos pesticidas, os produtos biológicos têm crescido enormemente no mercado global. Os concentrados de óleo de neem são extraídos das sementes da árvore de neem e são chamados de biológicos porque são produzidos sem produtos químicos tóxicos ou organismos geneticamente modificados (OGM). Isto torna os concentrados de óleo de neem atraentes para aqueles que procuram soluções naturais e sustentáveis. O óleo de neem tem características inseticidas e pode tratar diversas pragas, incluindo insetos, ácaros e nemátodos.
- Aumento da aplicação de concentrados de óleo de neem na indústria agrícola
O mercado global de concentrados de óleo de neem está a assistir a um aumento da utilização de concentrados de óleo de neem na agricultura. O óleo de neem, derivado da árvore de neem (Azadirachta Indica), tornou-se popular na agricultura devido à sua grande variedade de aplicações e múltiplas vantagens. A procura por concentrados de óleo de neem aumenta à medida que a agricultura procura alternativas mais sustentáveis e amigas do ambiente. O óleo de neem tem características inseticidas e pode tratar diversas pragas das culturas, como pulgões, moscas brancas, ácaros, lagartas e escaravelhos. Os seus componentes ativos previnem a proliferação e o desenvolvimento de insetos, resultando em menos perdas nas culturas.
Oportunidades
- Aplicações potenciais na indústria automóvel
Com a crescente procura por produtos amigos do ambiente, o setor automóvel procura continuamente soluções inovadoras e duradouras. O óleo de neem natural tem vantagens para uma variedade de aplicações automóveis. A indústria de tintas e revestimentos automóveis pode utilizar o óleo de neem como ingrediente. As suas qualidades antibacterianas e inseticidas podem ajudar a defender as superfícies exteriores dos automóveis contra agentes patogénicos e pragas perigosas. Os fabricantes de automóveis podem adicionar óleo de neem às fórmulas de revestimento para aumentar a tenacidade e a longevidade da tinta e proteger contra as variáveis ambientais que podem causar a degradação da tinta. Devido às suas excelentes características lubrificantes, o óleo de neem pode ser utilizado como lubrificante ou como complemento aos lubrificantes automóveis. Pode reduzir o atrito e o desgaste em vários componentes do motor, resultando num melhor desempenho do motor e numa maior vida útil das peças do motor. Além disso, a composição natural do óleo de neem pode ajudar a reduzir o impacto ambiental da utilização de lubrificantes em produtos da indústria automóvel.
- Desenvolvimento e diversificação de novos produtos
O óleo de neem é conhecido pelos seus muitos efeitos úteis, incluindo propriedades inseticidas, antibacterianas e antioxidantes. Estas características tornam-no um elemento flexível para uma variedade de aplicações. As empresas podem explorar novas formulações e aplicações do óleo de neem investindo em investigação e desenvolvimento, criando produtos exclusivos que servem determinados segmentos de mercado.
O óleo de neem pode ser preparado em várias concentrações ou combinado com outros componentes naturais para aumentar a sua eficiência e adaptabilidade. Isto pode levar à criação de produtos concentrados à base de óleo de neem que proporcionam soluções específicas de controlo de pragas para determinadas culturas ou utilizações. Além disso, os produtos à base de óleo de neem podem ser melhorados para satisfazer as necessidades especializadas de indústrias como a cosmética, medicamentos, cuidados pessoais e automóvel.
Restrições/Desafios
- Disponibilidade de substitutos
Embora o óleo de neem seja normalmente utilizado na agricultura como biopesticida e inseticida, os produtos alternativos e os produtos químicos sintéticos no mercado oferecem qualidades semelhantes de controlo de pragas. Estes substitutos podem estar mais facilmente disponíveis, ser mais baratos ou ter uma presença de mercado mais estabelecida, o que representa um desafio à ampla adoção do óleo de neem. Da mesma forma, algumas alternativas oferecem um desempenho comparável na indústria automóvel, onde o óleo de neem é utilizado em lubrificantes e revestimentos. As alternativas ao óleo de neem incluem lubrificantes sintéticos, revestimentos e outros óleos de base biológica. A disponibilidade e competitividade destes substitutos pode limitar a utilização do óleo de neem no setor automóvel.
- Disponibilidade limitada e desafios da cadeia de abastecimento
O mercado do óleo de neem e concentrado enfrenta grandes desafios devido à disponibilidade limitada e aos desafios da cadeia de abastecimento. O cultivo e o processamento de árvores de neem, que podem ser afetadas por vários fatores, como o clima, pragas e doenças, são necessários para fabricar óleo de neem. Isto pode causar alterações na disponibilidade do óleo de neem e perturbar a cadeia de abastecimento. Além disso, a procura de óleo de neem tem vindo a aumentar constantemente em vários setores, incluindo a agricultura, a cosmética e a saúde. Para satisfazer esta procura crescente exige uma cadeia de abastecimento bem estabelecida e eficiente para garantir a disponibilidade consistente e atempada dos produtos de óleo de neem.
Desenvolvimento recente
- Em março de 2022, aproveitando as tendências do JdC Garden, a SBM Company Life Science France formalizou um acordo exclusivo com a start-up francesa AXIOMA. Com a ajuda desta parceria, a SBM poderá expandir a sua seleção de remédios naturais e fornecer aos distribuidores e aos seus clientes um novo estimulante vegetal baseado em extratos naturais de plantas que promoverá o desenvolvimento de plantas em hortas.
Âmbito do mercado global de óleo de Neem e concentrados
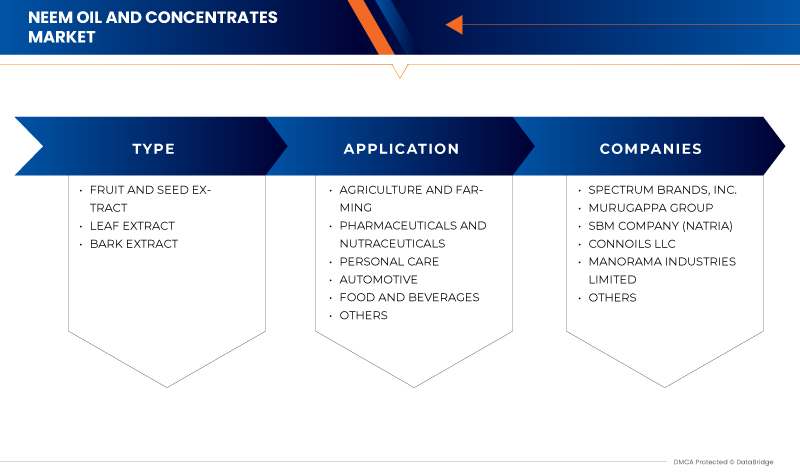
O mercado global de óleo de neem e concentrados é categorizado com base no tipo e na aplicação. O crescimento entre estes segmentos irá ajudá-lo a analisar os principais segmentos de crescimento nos setores e fornecerá aos utilizadores uma visão geral valiosa do mercado e informações de mercado para tomar decisões estratégicas para identificar as principais aplicações de mercado.
Tipo
- Extrato de Frutas e Sementes
- Extrato de Folha
- Extrato de casca
Com base no tipo, o mercado global de óleo de neem e concentrados é classificado em três segmentos: extrato de frutos e sementes, extrato de folhas e extrato de casca.
Aplicação
- Agricultura e Pecuária
- Produtos farmacêuticos e nutracêuticos
- Cuidados pessoais
- Automotivo
- Alimentos e Bebidas
- Outros
Com base na aplicação, o mercado global de óleo de neem e concentrados está classificado em seis segmentos: agricultura e pecuária, produtos farmacêuticos e nutracêuticos, cuidados pessoais, automóvel, alimentos e bebidas e outros.
Análise/Insights Regionais do Mercado Global de Óleo de Neem e Concentrados
O mercado global de óleo de neem e concentrados está segmentado com base no tipo e na aplicação.
Os países no mercado global de óleo de neem e concentrados são os EUA, Canadá e México, Brasil, Argentina e resto da América do Sul, Alemanha, Itália, Reino Unido, França, Espanha, Rússia, Turquia, Holanda, Bélgica, Suíça, Luxemburgo , e Resto da Europa, Japão, China, Índia, Coreia do Sul, Austrália e Nova Zelândia, Filipinas, Malásia, Tailândia, Indonésia, Singapura e Resto da Ásia-Pacífico, Arábia Saudita, Emirados Árabes Unidos, África do Sul, Egito , Israel e Resto do Médio Oriente e África.
Espera-se que a Ásia-Pacífico domine o mercado global de óleo de neem e concentrados devido às condições favoráveis de clima e solo nesta região, que a tornam ideal para o cultivo de árvores de neem. Os EUA dominam a região da América do Norte devido à crescente consciencialização das propriedades do óleo de neem e dos produtos concentrados. Espera-se que a Alemanha domine a região da Europa devido às crescentes tecnologias de óleo de nim e produtos concentrados.
A secção de países do relatório também fornece fatores individuais que impactam o mercado e alterações na regulamentação do mercado que impactam as tendências atuais e futuras do mercado. A análise dos pontos de dados a montante e a jusante da cadeia de valor, a análise das tendências técnicas das cinco forças de Porter e os estudos de caso são alguns dos indicadores utilizados para prever o cenário de mercado para países individuais. Além disso, a presença e disponibilidade de marcas globais e os seus desafios enfrentados devido à grande ou escassa concorrência de marcas locais e nacionais, o impacto das tarifas domésticas e das rotas comerciais são considerados ao fornecer uma análise de previsão dos dados do país.
Análise do panorama competitivo e da quota de mercado global de óleo de Neem e concentrados
O panorama competitivo do mercado global de óleo de neem e concentrados fornece detalhes por concorrentes. Os detalhes incluídos são a visão geral da empresa, finanças da empresa, receitas geradas, potencial de mercado, investimento em investigação e desenvolvimento, novas iniciativas de mercado, localizações e instalações de produção, pontos fortes e fracos da empresa, lançamento de produtos, pipelines de testes de produto, aprovações de produto, patentes, largura e amplitude do produto, domínio da aplicação, curva de vida da tecnologia. Os pontos de dados fornecidos acima estão apenas relacionados com o foco da empresa em relação ao mercado.
Alguns dos participantes proeminentes que operam no mercado global de óleo de neem e concentrados são a SUNSHIV BOTANICS, ConnOils LLC, VedaOils.com, Ozone Biotech, SPECTRUM BRANDS, INC., Woodstream Corporation, DYNA-GRO, INC, BONIDE Products LLC, GreenWay Biotech , SBM Company (Natria), PF Harris, MYCSA AG, Aromantic Natural Skin Care, Manorama Industries Limited., SUN BIONATURALS e NOW Foods, entre outras.
SKU-
Obtenha acesso online ao relatório sobre a primeira nuvem de inteligência de mercado do mundo

- Painel interativo de análise de dados
- Painel de análise da empresa para oportunidades de elevado potencial de crescimento
- Acesso de analista de pesquisa para personalização e customização. consultas
- Análise da concorrência com painel interativo
- Últimas notícias, atualizações e atualizações Análise de tendências
- Aproveite o poder da análise de benchmark para um rastreio abrangente da concorrência
Índice
1 INTRODUCTION
1.1 OBJECTIVES OF THE STUDY
1.2 MARKET DEFINITION
1.3 OVERVIEW
1.4 LIMITATIONS
1.5 MARKETS COVERED
2 MARKET SEGMENTATION
2.1 MARKETS COVERED
2.2 GEOGRAPHICAL SCOPE
2.3 YEARS CONSIDERED FOR THE STUDY
2.4 CURRENCY AND PRICING
2.5 DBMR TRIPOD DATA VALIDATION MODEL
2.6 TYPE LIFE LINE CURVE
2.7 MULTIVARIATE MODELING
2.8 PRIMARY INTERVIEWS WITH KEY OPINION LEADERS
2.9 DBMR MARKET POSITION GRID
2.1 MARKET APPLICATION COVERAGE GRID
2.11 DBMR MARKET CHALLENGE MATRIX
2.12 DBMR VENDOR SHARE ANALYSIS
2.13 SECONDARY SOURCES
2.14 ASSUMPTIONS
3 EXECUTIVE SUMMARY
4 PREMIUM INSIGHTS
4.1 ADDITIONAL CUSTOMIZATIONS
4.1.1 PRODUCTION CAPACITY BY MAJOR COUNTRIES
4.1.2 NEEM OILS' PRICE FROM PRODUCERS TO TRADERS ANALYSIS
4.1.3 NEEM OILS AS BIOFUELS
4.1.4 LIST OF MANUFACTURERS
4.1.5 PRICE ANALYSIS
5 MARKET OVERVIEW
5.1 DRIVERS
5.1.1 GROWING DEMAND FOR ORGANIC PRODUCTS
5.1.2 INCREASING APPLICATION OF NEEM OIL CONCENTRATES IN THE AGRICULTURE INDUSTRY
5.1.3 EXPANSION OF END-USE INDUSTRIES FOR NEEM OIL CONCENTRATES
5.2 RESTRAINTS
5.2.1 AVAILABILITY OF SUBSTITUTES
5.2.2 REGULATORY HURDLES AND QUALITY CONTROL
5.3 OPPORTUNITIES
5.3.1 POTENTIAL APPLICATIONS IN AUTOMOTIVE INDUSTRY
5.3.2 NEW PRODUCT DEVELOPMENT AND DIVERSIFICATION
5.4 CHALLENGES
5.4.1 LIMITED AWARENESS OF NEEM OIL AND CONCENTRATES
5.4.2 LIMITED AVAILABILITY AND SUPPLY CHAIN CHALLENGES
6 GLOBAL NEEM OIL AND CONCENTRATES MARKET, BY REGION
6.1 OVERVIEW
6.2 ASIA-PACIFIC
6.2.1 CHINA
6.2.2 INDIA
6.2.3 AUSTRALIA & NEW ZEALAND
6.2.4 SOUTH KOREA
6.2.5 JAPAN
6.2.6 INDONESIA
6.2.7 THAILAND
6.2.8 PHILIPPINES
6.2.9 MALAYSIA
6.2.10 SINGAPORE
6.2.11 REST OF ASIA-PACIFIC
6.3 NORTH AMERICA
6.3.1 U.S.
6.3.2 MEXICO
6.3.3 CANADA
6.4 EUROPE
6.4.1 GERMANY
6.4.2 SPAIN
6.4.3 FRANCE
6.4.4 ITALY
6.4.5 U.K.
6.4.6 NETHERLANDS
6.4.7 RUSSIA
6.4.8 TURKEY
6.4.9 BELGIUM
6.4.10 SWITZERLAND
6.4.11 LUXEMBOURG
6.4.12 REST OF EUROPE
6.5 SOUTH AMERICA
6.5.1 BRAZIL
6.5.2 ARGENTINA
6.5.3 REST OF SOUTH AMERICA
6.6 MIDDLE EAST AND AFRICA
6.6.1 SOUTH AFRICA
6.6.2 EGYPT
6.6.3 SAUDI ARABIA
6.6.4 ISRAEL
6.6.5 UNITED ARAB EMIRATES
6.6.6 REST OF MIDDLE EAST AND AFRICA
7 GLOBAL NEEM OIL AND CONCENTRATES MARKET: COMPANY LANDSCAPE
7.1 COMPANY SHARE ANALYSIS: GLOBAL
7.2 COMPANY SHARE ANALYSIS: ASIA-PACIFIC
7.3 COMPANY SHARE ANALYSIS: NORTH AMERICA
7.4 COMPANY SHARE ANALYSIS: EUROPE
7.5 PARTNERSHIP
7.6 CERTIFICATIONS
7.7 ACQUISITION
7.8 NEW PLANT
8 SWOT ANALYSIS
9 COMPANY PROFILES
9.1 SPECTRUM BRANDS, INC.
9.1.1 COMPANY SNAPSHOT
9.1.2 REVENUE ANALYSIS
9.1.3 COMPANY SHARE ANALYSIS
9.1.4 PRODUCT PORTFOLIO
9.1.5 RECENT DEVELOPMENT
9.2 MURUGAPPA GROUP
9.2.1 COMPANY SNAPSHOT
9.2.2 REVENUE ANALYSIS
9.2.3 COMPANY SHARE ANALYSIS
9.2.4 PRODUCT PORTFOLIO
9.2.5 RECENT DEVELOPMENT
9.3 SBM COMPANY (NATRIA)
9.3.1 COMPANY SNAPSHOT
9.3.2 COMPANY SHARE ANALYSIS
9.3.3 PRODUCT PORTFOLIO
9.3.4 RECENT DEVELOPMENTS
9.4 CONNOILS LLC
9.4.1 COMPANY SNAPSHOT
9.4.2 COMPANY SHARE ANALYSIS
9.4.3 PRODUCT PORTFOLIO
9.4.4 RECENT DEVELOPMENT
9.5 MANORAMA INDUSTRIES LIMITED
9.5.1 COMPANY SNAPSHOT
9.5.2 REVENUE ANALYSIS
9.5.3 COMPANY SHARE ANALYSIS
9.5.4 PRODUCT PORTFOLIO
9.5.5 RECENT DEVELOPMENT
9.6 AROMANTIC NATURAL SKIN CARE
9.6.1 COMPANY SNAPSHOT
9.6.2 PRODUCT PORTFOLIO
9.6.3 RECENT DEVELOPMENT
9.7 BONIDE PRODUCTS LLC
9.7.1 COMPANY SNAPSHOT
9.7.2 PRODUCT PORTFOLIO
9.7.3 RECENT DEVELOPMENT
9.8 DYNO-GRO, INC
9.8.1 COMPANY SNAPSHOT
9.8.2 PRODUCT PORTFOLIO
9.8.3 RECENT DEVELOPMENT
9.9 GREENWAY BIOTECH
9.9.1 COMPANY SNAPSHOT
9.9.2 PRODUCT PORTFOLIO
9.9.3 RECENT DEVELOPMENT
9.1 MYCSA AG
9.10.1 COMPANY SNAPSHOT
9.10.2 PRODUCT PORTFOLIO
9.10.3 RECENT DEVELOPMENT
9.11 NOW FOODS
9.11.1 COMPANY SNAPSHOT
9.11.2 PRODUCT PORTFOLIO
9.11.3 RECENT DEVELOPMENT
9.12 OZONE BIOTECH
9.12.1 COMPANY SNAPSHOT
9.12.2 PRODUCT PORTFOLIO
9.12.3 RECENT DEVELOPMENT
9.13 PF HARRIS
9.13.1 COMPANY SNAPSHOT
9.13.2 PRODUCT PORTFOLIO
9.13.3 RECENT DEVELOPMENT
9.14 SUN BIONATURALS
9.14.1 COMPANY SNAPSHOT
9.14.2 PRODUCT PORTFOLIO
9.14.3 RECENT DEVELOPMENT
9.15 SUNSHIV BOTANICS
9.15.1 COMPANY SNAPSHOT
9.15.2 PRODUCT PORTFOLIO
9.15.3 RECENT DEVELOPMENT
9.16 VEDAOILS.COM
9.16.1 COMPANY SNAPSHOT
9.16.2 PRODUCT PORTFOLIO
9.16.3 RECENT DEVELOPMENT
9.17 WOODSTREAM CORPORATION
9.17.1 COMPANY SNAPSHOT
9.17.2 PRODUCT PORTFOLIO
9.17.3 RECENT DEVELOPMENT
10 QUESTIONNAIRE
11 RELATED REPORTS
Lista de Tabela
TABLE 1 THE ESTIMATED COST OF PRODUCING BIODIESEL FROM NEEM OIL IS REPRESENTED BELOW :
TABLE 2 GLOBAL NEEM OIL AND CONCENTRATES MARKET, BY REGION, 2021-2030 (USD THOUSAND)
TABLE 3 GLOBAL NEEM OIL AND CONCENTRATES MARKET, BY REGION, 2021-2030 (TONS)
TABLE 4 GLOBAL NEEM OIL AND CONCENTRATES MARKET, BY TYPE, 2021-2030 (USD THOUSAND)
TABLE 5 GLOBAL NEEM OIL AND CONCENTRATES MARKET, BY TYPE, 2021-2030 (TONS)
TABLE 6 GLOBAL NEEM OIL AND CONCENTRATES MARKET, BY APPLICATION, 2021-2030 (USD THOUSAND)
TABLE 7 GLOBAL AGRICULTURE AND FARMING IN NEEM OIL AND CONCENTRATES MARKET, BY TYPE, 2021-2030 (USD THOUSAND)
TABLE 8 GLOBAL PERSONAL CARE IN NEEM OIL AND CONCENTRATES MARKET, BY TYPE, 2021-2030 (USD THOUSAND)
TABLE 9 GLOBAL PHARMACEUTICALS AND NUTRACEUTICALS IN NEEM OIL AND CONCENTRATES MARKET, BY TYPE, 2021-2030 (USD THOUSAND)
TABLE 10 GLOBAL AUTOMOTIVE IN NEEM OIL AND CONCENTRATES MARKET, BY TYPE, 2021-2030 (USD THOUSAND)
TABLE 11 GLOBAL FOOD AND BEVERAGES IN NEEM OIL AND CONCENTRATES MARKET, BY TYPE, 2021-2030 (USD THOUSAND)
TABLE 12 GLOBAL OTHERS IN NEEM OIL AND CONCENTRATES MARKET, BY TYPE, 2021-2030 (USD THOUSAND)
TABLE 13 ASIA-PACIFIC NEEM OIL AND CONCENTRATES MARKET, BY COUNTRY, 2021-2030 (USD THOUSAND)
TABLE 14 ASIA-PACIFIC NEEM OIL AND CONCENTRATES MARKET, BY COUNTRY, 2021-2030 (TONS)
TABLE 15 ASIA-PACIFIC NEEM OIL AND CONCENTRATES MARKET, BY TYPE, 2021-2030 (USD THOUSAND)
TABLE 16 ASIA-PACIFIC NEEM OIL AND CONCENTRATES MARKET, BY TYPE, 2021-2030 (TONS)
TABLE 17 ASIA-PACIFIC NEEM OIL AND CONCENTRATES MARKET, BY APPLICATION, 2021-2030 (USD THOUSAND)
TABLE 18 ASIA-PACIFIC AGRICULTURE AND FARMING IN NEEM OIL AND CONCENTRATES MARKET, BY TYPE, 2021-2030 (USD THOUSAND)
TABLE 19 ASIA-PACIFIC PHARMACEUTICALS AND NUTRACEUTICALS IN NEEM OIL AND CONCENTRATES MARKET, BY TYPE, 2021-2030 (USD THOUSAND)
TABLE 20 ASIA-PACIFIC PERSONAL CARE IN NEEM OIL AND CONCENTRATES MARKET, BY TYPE, 2021-2030 (USD THOUSAND)
TABLE 21 ASIA-PACIFIC AUTOMOTIVE IN NEEM OIL AND CONCENTRATES MARKET, BY TYPE, 2021-2030 (USD THOUSAND)
TABLE 22 ASIA-PACIFIC FOOD AND BEVERAGES IN NEEM OIL AND CONCENTRATES MARKET, BY TYPE, 2021-2030 (USD THOUSAND)
TABLE 23 ASIA-PACIFIC OTHERS IN NEEM OIL AND CONCENTRATES MARKET, BY TYPE, 2021-2030 (USD THOUSAND)
TABLE 24 CHINA NEEM OIL AND CONCENTRATES MARKET, BY TYPE, 2021-2030 (USD THOUSAND)
TABLE 25 CHINA NEEM OIL AND CONCENTRATES MARKET, BY TYPE, 2021-2030 (TONS)
TABLE 26 CHINA NEEM OIL AND CONCENTRATES MARKET, BY APPLICATION, 2021-2030 (USD THOUSAND)
TABLE 27 CHINA AGRICULTURE AND FARMING IN NEEM OIL AND CONCENTRATES MARKET, BY TYPE, 2021-2030 (USD THOUSAND)
TABLE 28 CHINA PHARMACEUTICALS AND NUTRACEUTICALS IN NEEM OIL AND CONCENTRATES MARKET, BY TYPE, 2021-2030 (USD THOUSAND)
TABLE 29 CHINA PERSONAL CARE IN NEEM OIL AND CONCENTRATES MARKET, BY TYPE, 2021-2030 (USD THOUSAND)
TABLE 30 CHINA AUTOMOTIVE IN NEEM OIL AND CONCENTRATES MARKET, BY TYPE, 2021-2030 (USD THOUSAND)
TABLE 31 CHINA FOOD AND BEVERAGES IN NEEM OIL AND CONCENTRATES MARKET, BY TYPE, 2021-2030 (USD THOUSAND)
TABLE 32 CHINA OTHERS IN NEEM OIL AND CONCENTRATES MARKET, BY TYPE, 2021-2030 (USD THOUSAND)
TABLE 33 INDIA NEEM OIL AND CONCENTRATES MARKET, BY TYPE, 2021-2030 (USD THOUSAND)
TABLE 34 INDIA NEEM OIL AND CONCENTRATES MARKET, BY TYPE, 2021-2030 (TONS)
TABLE 35 INDIA NEEM OIL AND CONCENTRATES MARKET, BY APPLICATION, 2021-2030 (USD THOUSAND)
TABLE 36 INDIA AGRICULTURE AND FARMING IN NEEM OIL AND CONCENTRATES MARKET, BY TYPE, 2021-2030 (USD THOUSAND)
TABLE 37 INDIA PHARMACEUTICALS AND NUTRACEUTICALS IN NEEM OIL AND CONCENTRATES MARKET, BY TYPE, 2021-2030 (USD THOUSAND)
TABLE 38 INDIA PERSONAL CARE IN NEEM OIL AND CONCENTRATES MARKET, BY TYPE, 2021-2030 (USD THOUSAND)
TABLE 39 INDIA AUTOMOTIVE IN NEEM OIL AND CONCENTRATES MARKET, BY TYPE, 2021-2030 (USD THOUSAND)
TABLE 40 INDIA FOOD AND BEVERAGES IN NEEM OIL AND CONCENTRATES MARKET, BY TYPE, 2021-2030 (USD THOUSAND)
TABLE 41 INDIA OTHERS IN NEEM OIL AND CONCENTRATES MARKET, BY TYPE, 2021-2030 (USD THOUSAND)
TABLE 42 AUSTRALIA & NEW ZEALAND NEEM OIL AND CONCENTRATES MARKET, BY TYPE, 2021-2030 (USD THOUSAND)
TABLE 43 AUSTRALIA & NEW ZEALAND NEEM OIL AND CONCENTRATES MARKET, BY TYPE, 2021-2030 (TONS)
TABLE 44 AUSTRALIA & NEW ZEALAND NEEM OIL AND CONCENTRATES MARKET, BY APPLICATION, 2021-2030 (USD THOUSAND)
TABLE 45 AUSTRALIA & NEW ZEALAND AGRICULTURE AND FARMING IN NEEM OIL AND CONCENTRATES MARKET, BY TYPE, 2021-2030 (USD THOUSAND)
TABLE 46 AUSTRALIA & NEW ZEALAND PHARMACEUTICALS AND NUTRACEUTICALS IN NEEM OIL AND CONCENTRATES MARKET, BY TYPE, 2021-2030 (USD THOUSAND)
TABLE 47 AUSTRALIA & NEW ZEALAND PERSONAL CARE IN NEEM OIL AND CONCENTRATES MARKET, BY TYPE, 2021-2030 (USD THOUSAND)
TABLE 48 AUSTRALIA & NEW ZEALAND AUTOMOTIVE IN NEEM OIL AND CONCENTRATES MARKET, BY TYPE, 2021-2030 (USD THOUSAND)
TABLE 49 AUSTRALIA & NEW ZEALAND FOOD AND BEVERAGES IN NEEM OIL AND CONCENTRATES MARKET, BY TYPE, 2021-2030 (USD THOUSAND)
TABLE 50 AUSTRALIA & NEW ZEALAND OTHERS IN NEEM OIL AND CONCENTRATES MARKET, BY TYPE, 2021-2030 (USD THOUSAND)
TABLE 51 SOUTH KOREA NEEM OIL AND CONCENTRATES MARKET, BY TYPE, 2021-2030 (USD THOUSAND)
TABLE 52 SOUTH KOREA NEEM OIL AND CONCENTRATES MARKET, BY TYPE, 2021-2030 (TONS)
TABLE 53 SOUTH KOREA NEEM OIL AND CONCENTRATES MARKET, BY APPLICATION, 2021-2030 (USD THOUSAND)
TABLE 54 SOUTH KOREA AGRICULTURE AND FARMING IN NEEM OIL AND CONCENTRATES MARKET, BY TYPE, 2021-2030 (USD THOUSAND)
TABLE 55 SOUTH KOREA PHARMACEUTICALS AND NUTRACEUTICALS IN NEEM OIL AND CONCENTRATES MARKET, BY TYPE, 2021-2030 (USD THOUSAND)
TABLE 56 SOUTH KOREA PERSONAL CARE IN NEEM OIL AND CONCENTRATES MARKET, BY TYPE, 2021-2030 (USD THOUSAND)
TABLE 57 SOUTH KOREA AUTOMOTIVE IN NEEM OIL AND CONCENTRATES MARKET, BY TYPE, 2021-2030 (USD THOUSAND)
TABLE 58 SOUTH KOREA FOOD AND BEVERAGES IN NEEM OIL AND CONCENTRATES MARKET, BY TYPE, 2021-2030 (USD THOUSAND)
TABLE 59 SOUTH KOREA OTHERS IN NEEM OIL AND CONCENTRATES MARKET, BY TYPE, 2021-2030 (USD THOUSAND)
TABLE 60 JAPAN NEEM OIL AND CONCENTRATES MARKET, BY TYPE, 2021-2030 (USD THOUSAND)
TABLE 61 JAPAN NEEM OIL AND CONCENTRATES MARKET, BY TYPE, 2021-2030 (TONS)
TABLE 62 JAPAN NEEM OIL AND CONCENTRATES MARKET, BY APPLICATION, 2021-2030 (USD THOUSAND)
TABLE 63 JAPAN AGRICULTURE AND FARMING IN NEEM OIL AND CONCENTRATES MARKET, BY TYPE, 2021-2030 (USD THOUSAND)
TABLE 64 JAPAN PHARMACEUTICALS AND NUTRACEUTICALS IN NEEM OIL AND CONCENTRATES MARKET, BY TYPE, 2021-2030 (USD THOUSAND)
TABLE 65 JAPAN PERSONAL CARE IN NEEM OIL AND CONCENTRATES MARKET, BY TYPE, 2021-2030 (USD THOUSAND)
TABLE 66 JAPAN AUTOMOTIVE IN NEEM OIL AND CONCENTRATES MARKET, BY TYPE, 2021-2030 (USD THOUSAND)
TABLE 67 JAPAN FOOD AND BEVERAGES IN NEEM OIL AND CONCENTRATES MARKET, BY TYPE, 2021-2030 (USD THOUSAND)
TABLE 68 JAPAN OTHERS IN NEEM OIL AND CONCENTRATES MARKET, BY TYPE, 2021-2030 (USD THOUSAND)
TABLE 69 INDONESIA NEEM OIL AND CONCENTRATES MARKET, BY TYPE, 2021-2030 (USD THOUSAND)
TABLE 70 INDONESIA NEEM OIL AND CONCENTRATES MARKET, BY TYPE, 2021-2030 (TONS)
TABLE 71 INDONESIA NEEM OIL AND CONCENTRATES MARKET, BY APPLICATION, 2021-2030 (USD THOUSAND)
TABLE 72 INDONESIA AGRICULTURE AND FARMING IN NEEM OIL AND CONCENTRATES MARKET, BY TYPE, 2021-2030 (USD THOUSAND)
TABLE 73 INDONESIA PHARMACEUTICALS AND NUTRACEUTICALS IN NEEM OIL AND CONCENTRATES MARKET, BY TYPE, 2021-2030 (USD THOUSAND)
TABLE 74 INDONESIA PERSONAL CARE IN NEEM OIL AND CONCENTRATES MARKET, BY TYPE, 2021-2030 (USD THOUSAND)
TABLE 75 INDONESIA AUTOMOTIVE IN NEEM OIL AND CONCENTRATES MARKET, BY TYPE, 2021-2030 (USD THOUSAND)
TABLE 76 INDONESIA FOOD AND BEVERAGES IN NEEM OIL AND CONCENTRATES MARKET, BY TYPE, 2021-2030 (USD THOUSAND)
TABLE 77 INDONESIA OTHERS IN NEEM OIL AND CONCENTRATES MARKET, BY TYPE, 2021-2030 (USD THOUSAND)
TABLE 78 THAILAND NEEM OIL AND CONCENTRATES MARKET, BY TYPE, 2021-2030 (USD THOUSAND)
TABLE 79 THAILAND NEEM OIL AND CONCENTRATES MARKET, BY TYPE, 2021-2030 (TONS)
TABLE 80 THAILAND NEEM OIL AND CONCENTRATES MARKET, BY APPLICATION, 2021-2030 (USD THOUSAND)
TABLE 81 THAILAND AGRICULTURE AND FARMING IN NEEM OIL AND CONCENTRATES MARKET, BY TYPE, 2021-2030 (USD THOUSAND)
TABLE 82 THAILAND PHARMACEUTICALS AND NUTRACEUTICALS IN NEEM OIL AND CONCENTRATES MARKET, BY TYPE, 2021-2030 (USD THOUSAND)
TABLE 83 THAILAND PERSONAL CARE IN NEEM OIL AND CONCENTRATES MARKET, BY TYPE, 2021-2030 (USD THOUSAND)
TABLE 84 THAILAND AUTOMOTIVE IN NEEM OIL AND CONCENTRATES MARKET, BY TYPE, 2021-2030 (USD THOUSAND)
TABLE 85 THAILAND FOOD AND BEVERAGES IN NEEM OIL AND CONCENTRATES MARKET, BY TYPE, 2021-2030 (USD THOUSAND)
TABLE 86 THAILAND OTHERS IN NEEM OIL AND CONCENTRATES MARKET, BY TYPE, 2021-2030 (USD THOUSAND)
TABLE 87 PHILIPPINES NEEM OIL AND CONCENTRATES MARKET, BY TYPE, 2021-2030 (USD THOUSAND)
TABLE 88 PHILIPPINES NEEM OIL AND CONCENTRATES MARKET, BY TYPE, 2021-2030 (TONS)
TABLE 89 PHILIPPINES NEEM OIL AND CONCENTRATES MARKET, BY APPLICATION, 2021-2030 (USD THOUSAND)
TABLE 90 PHILIPPINES AGRICULTURE AND FARMING IN NEEM OIL AND CONCENTRATES MARKET, BY TYPE, 2021-2030 (USD THOUSAND)
TABLE 91 PHILIPPINES PHARMACEUTICALS AND NUTRACEUTICALS IN NEEM OIL AND CONCENTRATES MARKET, BY TYPE, 2021-2030 (USD THOUSAND)
TABLE 92 PHILIPPINES PERSONAL CARE IN NEEM OIL AND CONCENTRATES MARKET, BY TYPE, 2021-2030 (USD THOUSAND)
TABLE 93 PHILIPPINES AUTOMOTIVE IN NEEM OIL AND CONCENTRATES MARKET, BY TYPE, 2021-2030 (USD THOUSAND)
TABLE 94 PHILIPPINES FOOD AND BEVERAGES IN NEEM OIL AND CONCENTRATES MARKET, BY TYPE, 2021-2030 (USD THOUSAND)
TABLE 95 PHILIPPINES OTHERS IN NEEM OIL AND CONCENTRATES MARKET, BY TYPE, 2021-2030 (USD THOUSAND)
TABLE 96 MALAYSIA NEEM OIL AND CONCENTRATES MARKET, BY TYPE, 2021-2030 (USD THOUSAND)
TABLE 97 MALAYSIA NEEM OIL AND CONCENTRATES MARKET, BY TYPE, 2021-2030 (TONS)
TABLE 98 MALAYSIA NEEM OIL AND CONCENTRATES MARKET, BY APPLICATION, 2021-2030 (USD THOUSAND)
TABLE 99 MALAYSIA AGRICULTURE AND FARMING IN NEEM OIL AND CONCENTRATES MARKET, BY TYPE, 2021-2030 (USD THOUSAND)
TABLE 100 MALAYSIA PHARMACEUTICALS AND NUTRACEUTICALS IN NEEM OIL AND CONCENTRATES MARKET, BY TYPE, 2021-2030 (USD THOUSAND)
TABLE 101 MALAYSIA PERSONAL CARE IN NEEM OIL AND CONCENTRATES MARKET, BY TYPE, 2021-2030 (USD THOUSAND)
TABLE 102 MALAYSIA AUTOMOTIVE IN NEEM OIL AND CONCENTRATES MARKET, BY TYPE, 2021-2030 (USD THOUSAND)
TABLE 103 MALAYSIA FOOD AND BEVERAGES IN NEEM OIL AND CONCENTRATES MARKET, BY TYPE, 2021-2030 (USD THOUSAND)
TABLE 104 MALAYSIA OTHERS IN NEEM OIL AND CONCENTRATES MARKET, BY TYPE, 2021-2030 (USD THOUSAND)
TABLE 105 SINGAPORE NEEM OIL AND CONCENTRATES MARKET, BY TYPE, 2021-2030 (USD THOUSAND)
TABLE 106 SINGAPORE NEEM OIL AND CONCENTRATES MARKET, BY TYPE, 2021-2030 (TONS)
TABLE 107 SINGAPORE NEEM OIL AND CONCENTRATES MARKET, BY APPLICATION, 2021-2030 (USD THOUSAND)
TABLE 108 SINGAPORE AGRICULTURE AND FARMING IN NEEM OIL AND CONCENTRATES MARKET, BY TYPE, 2021-2030 (USD THOUSAND)
TABLE 109 SINGAPORE PHARMACEUTICALS AND NUTRACEUTICALS IN NEEM OIL AND CONCENTRATES MARKET, BY TYPE, 2021-2030 (USD THOUSAND)
TABLE 110 SINGAPORE PERSONAL CARE IN NEEM OIL AND CONCENTRATES MARKET, BY TYPE, 2021-2030 (USD THOUSAND)
TABLE 111 SINGAPORE AUTOMOTIVE IN NEEM OIL AND CONCENTRATES MARKET, BY TYPE, 2021-2030 (USD THOUSAND)
TABLE 112 SINGAPORE FOOD AND BEVERAGES IN NEEM OIL AND CONCENTRATES MARKET, BY TYPE, 2021-2030 (USD THOUSAND)
TABLE 113 SINGAPORE OTHERS IN NEEM OIL AND CONCENTRATES MARKET, BY TYPE, 2021-2030 (USD THOUSAND)
TABLE 114 REST OF ASIA-PACIFIC NEEM OIL AND CONCENTRATES MARKET, BY TYPE, 2021-2030 (USD THOUSAND)
TABLE 115 REST OF ASIA-PACIFIC NEEM OIL AND CONCENTRATES MARKET, BY TYPE, 2021-2030 (TONS)
TABLE 116 NORTH AMERICA NEEM OIL AND CONCENTRATES MARKET, BY COUNTRY, 2021-2030 (USD THOUSAND)
TABLE 117 NORTH AMERICA NEEM OIL AND CONCENTRATES MARKET, BY COUNTRY, 2021-2030 (TONS)
TABLE 118 NORTH AMERICA NEEM OIL AND CONCENTRATES MARKET, BY TYPE, 2021-2030 (USD THOUSAND)
TABLE 119 NORTH AMERICA NEEM OIL AND CONCENTRATES MARKET, BY TYPE, 2021-2030 (TONS)
TABLE 120 NORTH AMERICA NEEM OIL AND CONCENTRATES MARKET, BY APPLICATION, 2021-2030 (USD THOUSAND)
TABLE 121 NORTH AMERICA AGRICULTURE AND FARMING IN NEEM OIL AND CONCENTRATES MARKET, BY TYPE, 2021-2030 (USD THOUSAND)
TABLE 122 NORTH AMERICA PERSONAL CARE IN NEEM OIL AND CONCENTRATES MARKET, BY TYPE, 2021-2030 (USD THOUSAND)
TABLE 123 NORTH AMERICA PHARMACEUTICALS AND NUTRACEUTICALS IN NEEM OIL AND CONCENTRATES MARKET, BY TYPE, 2021-2030 (USD THOUSAND)
TABLE 124 NORTH AMERICA AUTOMOTIVE IN NEEM OIL AND CONCENTRATES MARKET, BY TYPE, 2021-2030 (USD THOUSAND)
TABLE 125 NORTH AMERICA FOOD AND BEVERAGES IN NEEM OIL AND CONCENTRATES MARKET, BY TYPE, 2021-2030 (USD THOUSAND)
TABLE 126 NORTH AMERICA OTHERS IN NEEM OIL AND CONCENTRATES MARKET, BY TYPE, 2021-2030 (USD THOUSAND)
TABLE 127 U.S. NEEM OIL AND CONCENTRATES MARKET, BY TYPE, 2021-2030 (USD THOUSAND)
TABLE 128 U.S. NEEM OIL AND CONCENTRATES MARKET, BY TYPE, 2021-2030 (TONS)
TABLE 129 U.S. NEEM OIL AND CONCENTRATES MARKET, BY APPLICATION, 2021-2030 (USD THOUSAND)
TABLE 130 U.S. AGRICULTURE AND FARMING IN NEEM OIL AND CONCENTRATES MARKET, BY TYPE, 2021-2030 (USD THOUSAND)
TABLE 131 U.S. PERSONAL CARE IN NEEM OIL AND CONCENTRATES MARKET, BY TYPE, 2021-2030 (USD THOUSAND)
TABLE 132 U.S. PHARMACEUTICALS AND NUTRACEUTICALS IN NEEM OIL AND CONCENTRATES MARKET, BY TYPE, 2021-2030 (USD THOUSAND)
TABLE 133 U.S. AUTOMOTIVE IN NEEM OIL AND CONCENTRATES MARKET, BY TYPE, 2021-2030 (USD THOUSAND)
TABLE 134 U.S. FOOD AND BEVERAGES IN NEEM OIL AND CONCENTRATES MARKET, BY TYPE, 2021-2030 (USD THOUSAND)
TABLE 135 U.S. OTHERS IN NEEM OIL AND CONCENTRATES MARKET, BY TYPE, 2021-2030 (USD THOUSAND)
TABLE 136 MEXICO NEEM OIL AND CONCENTRATES MARKET, BY TYPE, 2021-2030 (USD THOUSAND)
TABLE 137 MEXICO NEEM OIL AND CONCENTRATES MARKET, BY TYPE, 2021-2030 (TONS)
TABLE 138 MEXICO NEEM OIL AND CONCENTRATES MARKET, BY APPLICATION, 2021-2030 (USD THOUSAND)
TABLE 139 MEXICO AGRICULTURE AND FARMING IN NEEM OIL AND CONCENTRATES MARKET, BY TYPE, 2021-2030 (USD THOUSAND)
TABLE 140 MEXICO PERSONAL CARE IN NEEM OIL AND CONCENTRATES MARKET, BY TYPE, 2021-2030 (USD THOUSAND)
TABLE 141 MEXICO PHARMACEUTICALS AND NUTRACEUTICALS IN NEEM OIL AND CONCENTRATES MARKET, BY TYPE, 2021-2030 (USD THOUSAND)
TABLE 142 MEXICO AUTOMOTIVE IN NEEM OIL AND CONCENTRATES MARKET, BY TYPE, 2021-2030 (USD THOUSAND)
TABLE 143 MEXICO FOOD AND BEVERAGES IN NEEM OIL AND CONCENTRATES MARKET, BY TYPE, 2021-2030 (USD THOUSAND)
TABLE 144 MEXICO OTHERS IN NEEM OIL AND CONCENTRATES MARKET, BY TYPE, 2021-2030 (USD THOUSAND)
TABLE 145 CANADA NEEM OIL AND CONCENTRATES MARKET, BY TYPE, 2021-2030 (USD THOUSAND)
TABLE 146 CANADA NEEM OIL AND CONCENTRATES MARKET, BY TYPE, 2021-2030 (TONS)
TABLE 147 CANADA NEEM OIL AND CONCENTRATES MARKET, BY APPLICATION, 2021-2030 (USD THOUSAND)
TABLE 148 CANADA AGRICULTURE AND FARMING IN NEEM OIL AND CONCENTRATES MARKET, BY TYPE, 2021-2030 (USD THOUSAND)
TABLE 149 CANADA PERSONAL CARE IN NEEM OIL AND CONCENTRATES MARKET, BY TYPE, 2021-2030 (USD THOUSAND)
TABLE 150 CANADA PHARMACEUTICALS AND NUTRACEUTICALS IN NEEM OIL AND CONCENTRATES MARKET, BY TYPE, 2021-2030 (USD THOUSAND)
TABLE 151 CANADA AUTOMOTIVE IN NEEM OIL AND CONCENTRATES MARKET, BY TYPE, 2021-2030 (USD THOUSAND)
TABLE 152 CANADA FOOD AND BEVERAGES IN NEEM OIL AND CONCENTRATES MARKET, BY TYPE, 2021-2030 (USD THOUSAND)
TABLE 153 CANADA OTHERS IN NEEM OIL AND CONCENTRATES MARKET, BY TYPE, 2021-2030 (USD THOUSAND)
TABLE 154 EUROPE NEEM OIL AND CONCENTRATES MARKET, BY COUNTRY, 2021-2030 (USD THOUSAND)
TABLE 155 EUROPE NEEM OIL AND CONCENTRATES MARKET, BY COUNTRY, 2021-2030 (TONS)
TABLE 156 EUROPE NEEM OIL AND CONCENTRATES MARKET, BY TYPE, 2021-2030 (USD THOUSAND)
TABLE 157 EUROPE NEEM OIL AND CONCENTRATES MARKET, BY TYPE, 2021-2030 (TONS)
TABLE 158 EUROPE NEEM OIL AND CONCENTRATES MARKET, BY APPLICATION, 2021-2030 (USD THOUSAND)
TABLE 159 EUROPE AGRICULTURE AND FARMING IN NEEM OIL AND CONCENTRATES MARKET, BY TYPE, 2021-2030 (USD THOUSAND)
TABLE 160 EUROPE PERSONAL CARE IN NEEM OIL AND CONCENTRATES MARKET, BY TYPE, 2021-2030 (USD THOUSAND)
TABLE 161 EUROPE PHARMACEUTICALS AND NUTRACEUTICALS IN NEEM OIL AND CONCENTRATES MARKET, BY TYPE, 2021-2030 (USD THOUSAND)
TABLE 162 EUROPE AUTOMOTIVE IN NEEM OIL AND CONCENTRATES MARKET, BY TYPE, 2021-2030 (USD THOUSAND)
TABLE 163 EUROPE FOOD AND BEVERAGES IN NEEM OIL AND CONCENTRATES MARKET, BY TYPE, 2021-2030 (USD THOUSAND)
TABLE 164 EUROPE OTHERS IN NEEM OIL AND CONCENTRATES MARKET, BY TYPE, 2021-2030 (USD THOUSAND)
TABLE 165 GERMANY NEEM OIL AND CONCENTRATES MARKET, BY TYPE, 2021-2030 (USD THOUSAND)
TABLE 166 GERMANY NEEM OIL AND CONCENTRATES MARKET, BY TYPE, 2021-2030 (TONS)
TABLE 167 GERMANY NEEM OIL AND CONCENTRATES MARKET, BY APPLICATION, 2021-2030 (USD THOUSAND)
TABLE 168 GERMANY AGRICULTURE AND FARMING IN NEEM OIL AND CONCENTRATES MARKET, BY TYPE, 2021-2030 (USD THOUSAND)
TABLE 169 GERMANY PERSONAL CARE IN NEEM OIL AND CONCENTRATES MARKET, BY TYPE, 2021-2030 (USD THOUSAND)
TABLE 170 GERMANY PHARMACEUTICALS AND NUTRACEUTICALS IN NEEM OIL AND CONCENTRATES MARKET, BY TYPE, 2021-2030 (USD THOUSAND)
TABLE 171 GERMANY AUTOMOTIVE IN NEEM OIL AND CONCENTRATES MARKET, BY TYPE, 2021-2030 (USD THOUSAND)
TABLE 172 GERMANY FOOD AND BEVERAGES IN NEEM OIL AND CONCENTRATES MARKET, BY TYPE, 2021-2030 (USD THOUSAND)
TABLE 173 GERMANY OTHERS IN NEEM OIL AND CONCENTRATES MARKET, BY TYPE, 2021-2030 (USD THOUSAND)
TABLE 174 SPAIN NEEM OIL AND CONCENTRATES MARKET, BY TYPE, 2021-2030 (USD THOUSAND)
TABLE 175 SPAIN NEEM OIL AND CONCENTRATES MARKET, BY TYPE, 2021-2030 (TONS)
TABLE 176 SPAIN NEEM OIL AND CONCENTRATES MARKET, BY APPLICATION, 2021-2030 (USD THOUSAND)
TABLE 177 SPAIN AGRICULTURE AND FARMING IN NEEM OIL AND CONCENTRATES MARKET, BY TYPE, 2021-2030 (USD THOUSAND)
TABLE 178 SPAIN PERSONAL CARE IN NEEM OIL AND CONCENTRATES MARKET, BY TYPE, 2021-2030 (USD THOUSAND)
TABLE 179 SPAIN PHARMACEUTICALS AND NUTRACEUTICALS IN NEEM OIL AND CONCENTRATES MARKET, BY TYPE, 2021-2030 (USD THOUSAND)
TABLE 180 SPAIN AUTOMOTIVE IN NEEM OIL AND CONCENTRATES MARKET, BY TYPE, 2021-2030 (USD THOUSAND)
TABLE 181 SPAIN FOOD AND BEVERAGES IN NEEM OIL AND CONCENTRATES MARKET, BY TYPE, 2021-2030 (USD THOUSAND)
TABLE 182 SPAIN OTHERS IN NEEM OIL AND CONCENTRATES MARKET, BY TYPE, 2021-2030 (USD THOUSAND)
TABLE 183 FRANCE NEEM OIL AND CONCENTRATES MARKET, BY TYPE, 2021-2030 (USD THOUSAND)
TABLE 184 FRANCE NEEM OIL AND CONCENTRATES MARKET, BY TYPE, 2021-2030 (TONS)
TABLE 185 FRANCE NEEM OIL AND CONCENTRATES MARKET, BY APPLICATION, 2021-2030 (USD THOUSAND)
TABLE 186 FRANCE AGRICULTURE AND FARMING IN NEEM OIL AND CONCENTRATES MARKET, BY TYPE, 2021-2030 (USD THOUSAND)
TABLE 187 FRANCE PERSONAL CARE IN NEEM OIL AND CONCENTRATES MARKET, BY TYPE, 2021-2030 (USD THOUSAND)
TABLE 188 FRANCE PHARMACEUTICALS AND NUTRACEUTICALS IN NEEM OIL AND CONCENTRATES MARKET, BY TYPE, 2021-2030 (USD THOUSAND)
TABLE 189 FRANCE AUTOMOTIVE IN NEEM OIL AND CONCENTRATES MARKET, BY TYPE, 2021-2030 (USD THOUSAND)
TABLE 190 FRANCE FOOD AND BEVERAGES IN NEEM OIL AND CONCENTRATES MARKET, BY TYPE, 2021-2030 (USD THOUSAND)
TABLE 191 FRANCE OTHERS IN NEEM OIL AND CONCENTRATES MARKET, BY TYPE, 2021-2030 (USD THOUSAND)
TABLE 192 ITALY NEEM OIL AND CONCENTRATES MARKET, BY TYPE, 2021-2030 (USD THOUSAND)
TABLE 193 ITALY NEEM OIL AND CONCENTRATES MARKET, BY TYPE, 2021-2030 (TONS)
TABLE 194 ITALY NEEM OIL AND CONCENTRATES MARKET, BY APPLICATION, 2021-2030 (USD THOUSAND)
TABLE 195 ITALY AGRICULTURE AND FARMING IN NEEM OIL AND CONCENTRATES MARKET, BY TYPE, 2021-2030 (USD THOUSAND)
TABLE 196 ITALY PERSONAL CARE IN NEEM OIL AND CONCENTRATES MARKET, BY TYPE, 2021-2030 (USD THOUSAND)
TABLE 197 ITALY PHARMACEUTICALS AND NUTRACEUTICALS IN NEEM OIL AND CONCENTRATES MARKET, BY TYPE, 2021-2030 (USD THOUSAND)
TABLE 198 ITALY AUTOMOTIVE IN NEEM OIL AND CONCENTRATES MARKET, BY TYPE, 2021-2030 (USD THOUSAND)
TABLE 199 ITALY FOOD AND BEVERAGES IN NEEM OIL AND CONCENTRATES MARKET, BY TYPE, 2021-2030 (USD THOUSAND)
TABLE 200 ITALY OTHERS IN NEEM OIL AND CONCENTRATES MARKET, BY TYPE, 2021-2030 (USD THOUSAND)
TABLE 201 U.K. NEEM OIL AND CONCENTRATES MARKET, BY TYPE, 2021-2030 (USD THOUSAND)
TABLE 202 U.K. NEEM OIL AND CONCENTRATES MARKET, BY TYPE, 2021-2030 (TONS)
TABLE 203 U.K. NEEM OIL AND CONCENTRATES MARKET, BY APPLICATION, 2021-2030 (USD THOUSAND)
TABLE 204 U.K. AGRICULTURE AND FARMING IN NEEM OIL AND CONCENTRATES MARKET, BY TYPE, 2021-2030 (USD THOUSAND)
TABLE 205 U.K. PERSONAL CARE IN NEEM OIL AND CONCENTRATES MARKET, BY TYPE, 2021-2030 (USD THOUSAND)
TABLE 206 U.K. PHARMACEUTICALS AND NUTRACEUTICALS IN NEEM OIL AND CONCENTRATES MARKET, BY TYPE, 2021-2030 (USD THOUSAND)
TABLE 207 U.K. AUTOMOTIVE IN NEEM OIL AND CONCENTRATES MARKET, BY TYPE, 2021-2030 (USD THOUSAND)
TABLE 208 U.K. FOOD AND BEVERAGES IN NEEM OIL AND CONCENTRATES MARKET, BY TYPE, 2021-2030 (USD THOUSAND)
TABLE 209 U.K. OTHERS IN NEEM OIL AND CONCENTRATES MARKET, BY TYPE, 2021-2030 (USD THOUSAND)
TABLE 210 NETHERLANDS NEEM OIL AND CONCENTRATES MARKET, BY TYPE, 2021-2030 (USD THOUSAND)
TABLE 211 NETHERLANDS NEEM OIL AND CONCENTRATES MARKET, BY TYPE, 2021-2030 (TONS)
TABLE 212 NETHERLANDS NEEM OIL AND CONCENTRATES MARKET, BY APPLICATION, 2021-2030 (USD THOUSAND)
TABLE 213 NETHERLANDS AGRICULTURE AND FARMING IN NEEM OIL AND CONCENTRATES MARKET, BY TYPE, 2021-2030 (USD THOUSAND)
TABLE 214 NETHERLANDS PERSONAL CARE IN NEEM OIL AND CONCENTRATES MARKET, BY TYPE, 2021-2030 (USD THOUSAND)
TABLE 215 NETHERLANDS PHARMACEUTICALS AND NUTRACEUTICALS IN NEEM OIL AND CONCENTRATES MARKET, BY TYPE, 2021-2030 (USD THOUSAND)
TABLE 216 NETHERLANDS AUTOMOTIVE IN NEEM OIL AND CONCENTRATES MARKET, BY TYPE, 2021-2030 (USD THOUSAND)
TABLE 217 NETHERLANDS FOOD AND BEVERAGES IN NEEM OIL AND CONCENTRATES MARKET, BY TYPE, 2021-2030 (USD THOUSAND)
TABLE 218 NETHERLANDS OTHERS IN NEEM OIL AND CONCENTRATES MARKET, BY TYPE, 2021-2030 (USD THOUSAND)
TABLE 219 RUSSIA NEEM OIL AND CONCENTRATES MARKET, BY TYPE, 2021-2030 (USD THOUSAND)
TABLE 220 RUSSIA NEEM OIL AND CONCENTRATES MARKET, BY TYPE, 2021-2030 (TONS)
TABLE 221 RUSSIA NEEM OIL AND CONCENTRATES MARKET, BY APPLICATION, 2021-2030 (USD THOUSAND)
TABLE 222 RUSSIA AGRICULTURE AND FARMING IN NEEM OIL AND CONCENTRATES MARKET, BY TYPE, 2021-2030 (USD THOUSAND)
TABLE 223 RUSSIA PERSONAL CARE IN NEEM OIL AND CONCENTRATES MARKET, BY TYPE, 2021-2030 (USD THOUSAND)
TABLE 224 RUSSIA PHARMACEUTICALS AND NUTRACEUTICALS IN NEEM OIL AND CONCENTRATES MARKET, BY TYPE, 2021-2030 (USD THOUSAND)
TABLE 225 RUSSIA AUTOMOTIVE IN NEEM OIL AND CONCENTRATES MARKET, BY TYPE, 2021-2030 (USD THOUSAND)
TABLE 226 RUSSIA FOOD AND BEVERAGES IN NEEM OIL AND CONCENTRATES MARKET, BY TYPE, 2021-2030 (USD THOUSAND)
TABLE 227 RUSSIA OTHERS IN NEEM OIL AND CONCENTRATES MARKET, BY TYPE, 2021-2030 (USD THOUSAND)
TABLE 228 TURKEY NEEM OIL AND CONCENTRATES MARKET, BY TYPE, 2021-2030 (USD THOUSAND)
TABLE 229 TURKEY NEEM OIL AND CONCENTRATES MARKET, BY TYPE, 2021-2030 (TONS)
TABLE 230 TURKEY NEEM OIL AND CONCENTRATES MARKET, BY APPLICATION, 2021-2030 (USD THOUSAND)
TABLE 231 TURKEY AGRICULTURE AND FARMING IN NEEM OIL AND CONCENTRATES MARKET, BY TYPE, 2021-2030 (USD THOUSAND)
TABLE 232 TURKEY PERSONAL CARE IN NEEM OIL AND CONCENTRATES MARKET, BY TYPE, 2021-2030 (USD THOUSAND)
TABLE 233 TURKEY PHARMACEUTICALS AND NUTRACEUTICALS IN NEEM OIL AND CONCENTRATES MARKET, BY TYPE, 2021-2030 (USD THOUSAND)
TABLE 234 TURKEY AUTOMOTIVE IN NEEM OIL AND CONCENTRATES MARKET, BY TYPE, 2021-2030 (USD THOUSAND)
TABLE 235 TURKEY FOOD AND BEVERAGES IN NEEM OIL AND CONCENTRATES MARKET, BY TYPE, 2021-2030 (USD THOUSAND)
TABLE 236 TURKEY OTHERS IN NEEM OIL AND CONCENTRATES MARKET, BY TYPE, 2021-2030 (USD THOUSAND)
TABLE 237 BELGIUM NEEM OIL AND CONCENTRATES MARKET, BY TYPE, 2021-2030 (USD THOUSAND)
TABLE 238 BELGIUM NEEM OIL AND CONCENTRATES MARKET, BY TYPE, 2021-2030 (TONS)
TABLE 239 BELGIUM NEEM OIL AND CONCENTRATES MARKET, BY APPLICATION, 2021-2030 (USD THOUSAND)
TABLE 240 BELGIUM AGRICULTURE AND FARMING IN NEEM OIL AND CONCENTRATES MARKET, BY TYPE, 2021-2030 (USD THOUSAND)
TABLE 241 BELGIUM PERSONAL CARE IN NEEM OIL AND CONCENTRATES MARKET, BY TYPE, 2021-2030 (USD THOUSAND)
TABLE 242 BELGIUM PHARMACEUTICALS AND NUTRACEUTICALS IN NEEM OIL AND CONCENTRATES MARKET, BY TYPE, 2021-2030 (USD THOUSAND)
TABLE 243 BELGIUM AUTOMOTIVE IN NEEM OIL AND CONCENTRATES MARKET, BY TYPE, 2021-2030 (USD THOUSAND)
TABLE 244 BELGIUM FOOD AND BEVERAGES IN NEEM OIL AND CONCENTRATES MARKET, BY TYPE, 2021-2030 (USD THOUSAND)
TABLE 245 BELGIUM OTHERS IN NEEM OIL AND CONCENTRATES MARKET, BY TYPE, 2021-2030 (USD THOUSAND)
TABLE 246 SWITZERLAND NEEM OIL AND CONCENTRATES MARKET, BY TYPE, 2021-2030 (USD THOUSAND)
TABLE 247 SWITZERLAND NEEM OIL AND CONCENTRATES MARKET, BY TYPE, 2021-2030 (TONS)
TABLE 248 SWITZERLAND NEEM OIL AND CONCENTRATES MARKET, BY APPLICATION, 2021-2030 (USD THOUSAND)
TABLE 249 SWITZERLAND AGRICULTURE AND FARMING IN NEEM OIL AND CONCENTRATES MARKET, BY TYPE, 2021-2030 (USD THOUSAND)
TABLE 250 SWITZERLAND PERSONAL CARE IN NEEM OIL AND CONCENTRATES MARKET, BY TYPE, 2021-2030 (USD THOUSAND)
TABLE 251 SWITZERLAND PHARMACEUTICALS AND NUTRACEUTICALS IN NEEM OIL AND CONCENTRATES MARKET, BY TYPE, 2021-2030 (USD THOUSAND)
TABLE 252 SWITZERLAND AUTOMOTIVE IN NEEM OIL AND CONCENTRATES MARKET, BY TYPE, 2021-2030 (USD THOUSAND)
TABLE 253 SWITZERLAND FOOD AND BEVERAGES IN NEEM OIL AND CONCENTRATES MARKET, BY TYPE, 2021-2030 (USD THOUSAND)
TABLE 254 SWITZERLAND OTHERS IN NEEM OIL AND CONCENTRATES MARKET, BY TYPE, 2021-2030 (USD THOUSAND)
TABLE 255 LUXEMBOURG NEEM OIL AND CONCENTRATES MARKET, BY TYPE, 2021-2030 (USD THOUSAND)
TABLE 256 LUXEMBOURG NEEM OIL AND CONCENTRATES MARKET, BY TYPE, 2021-2030 (TONS)
TABLE 257 LUXEMBOURG NEEM OIL AND CONCENTRATES MARKET, BY APPLICATION, 2021-2030 (USD THOUSAND)
TABLE 258 LUXEMBOURG AGRICULTURE AND FARMING IN NEEM OIL AND CONCENTRATES MARKET, BY TYPE, 2021-2030 (USD THOUSAND)
TABLE 259 LUXEMBOURG PERSONAL CARE IN NEEM OIL AND CONCENTRATES MARKET, BY TYPE, 2021-2030 (USD THOUSAND)
TABLE 260 LUXEMBOURG PHARMACEUTICALS AND NUTRACEUTICALS IN NEEM OIL AND CONCENTRATES MARKET, BY TYPE, 2021-2030 (USD THOUSAND)
TABLE 261 LUXEMBOURG AUTOMOTIVE IN NEEM OIL AND CONCENTRATES MARKET, BY TYPE, 2021-2030 (USD THOUSAND)
TABLE 262 LUXEMBOURG FOOD AND BEVERAGES IN NEEM OIL AND CONCENTRATES MARKET, BY TYPE, 2021-2030 (USD THOUSAND)
TABLE 263 LUXEMBOURG OTHERS IN NEEM OIL AND CONCENTRATES MARKET, BY TYPE, 2021-2030 (USD THOUSAND)
TABLE 264 REST OF EUROPE NEEM OIL AND CONCENTRATES MARKET, BY TYPE, 2021-2030 (USD THOUSAND)
TABLE 265 REST OF EUROPE NEEM OIL AND CONCENTRATES MARKET, BY TYPE, 2021-2030 (TONS)
TABLE 266 SOUTH AMERICA NEEM OIL AND CONCENTRATES MARKET, BY COUNTRY, 2021-2030 (USD THOUSAND)
TABLE 267 SOUTH AMERICA NEEM OIL AND CONCENTRATES MARKET, BY COUNTRY, 2021-2030 (TONS)
TABLE 268 SOUTH AMERICA NEEM OIL AND CONCENTRATES MARKET, BY TYPE, 2021-2030 (USD THOUSAND)
TABLE 269 SOUTH AMERICA NEEM OIL AND CONCENTRATES MARKET, BY TYPE, 2021-2030 (TONS)
TABLE 270 SOUTH AMERICA NEEM OIL AND CONCENTRATES MARKET, BY APPLICATION, 2021-2030 (USD THOUSAND)
TABLE 271 SOUTH AMERICA AGRICULTURE AND FARMING IN NEEM OIL AND CONCENTRATES MARKET, BY TYPE, 2021-2030 (USD THOUSAND)
TABLE 272 SOUTH AMERICA PERSONAL CARE IN NEEM OIL AND CONCENTRATES MARKET, BY TYPE, 2021-2030 (USD THOUSAND)
TABLE 273 SOUTH AMERICA PHARMACEUTICALS AND NUTRACEUTICALS IN NEEM OIL AND CONCENTRATES MARKET, BY TYPE, 2021-2030 (USD THOUSAND)
TABLE 274 SOUTH AMERICA AUTOMOTIVE IN NEEM OIL AND CONCENTRATES MARKET, BY TYPE, 2021-2030 (USD THOUSAND)
TABLE 275 SOUTH AMERICA FOOD AND BEVERAGES IN NEEM OIL AND CONCENTRATES MARKET, BY TYPE, 2021-2030 (USD THOUSAND)
TABLE 276 SOUTH AMERICA OTHERS IN NEEM OIL AND CONCENTRATES MARKET, BY TYPE, 2021-2030 (USD THOUSAND)
TABLE 277 BRAZIL NEEM OIL AND CONCENTRATES MARKET, BY TYPE, 2021-2030 (USD THOUSAND)
TABLE 278 BRAZIL NEEM OIL AND CONCENTRATES MARKET, BY TYPE, 2021-2030 (TONS)
TABLE 279 BRAZIL NEEM OIL AND CONCENTRATES MARKET, BY APPLICATION, 2021-2030 (USD THOUSAND)
TABLE 280 BRAZIL AGRICULTURE AND FARMING IN NEEM OIL AND CONCENTRATES MARKET, BY TYPE, 2021-2030 (USD THOUSAND)
TABLE 281 BRAZIL PERSONAL CARE IN NEEM OIL AND CONCENTRATES MARKET, BY TYPE, 2021-2030 (USD THOUSAND)
TABLE 282 BRAZIL PHARMACEUTICALS AND NUTRACEUTICALS IN NEEM OIL AND CONCENTRATES MARKET, BY TYPE, 2021-2030 (USD THOUSAND)
TABLE 283 BRAZIL AUTOMOTIVE IN NEEM OIL AND CONCENTRATES MARKET, BY TYPE, 2021-2030 (USD THOUSAND)
TABLE 284 BRAZIL FOOD AND BEVERAGES IN NEEM OIL AND CONCENTRATES MARKET, BY TYPE, 2021-2030 (USD THOUSAND)
TABLE 285 BRAZIL OTHERS IN NEEM OIL AND CONCENTRATES MARKET, BY TYPE, 2021-2030 (USD THOUSAND)
TABLE 286 ARGENTINA NEEM OIL AND CONCENTRATES MARKET, BY TYPE, 2021-2030 (USD THOUSAND)
TABLE 287 ARGENTINA NEEM OIL AND CONCENTRATES MARKET, BY TYPE, 2021-2030 (TONS)
TABLE 288 ARGENTINA NEEM OIL AND CONCENTRATES MARKET, BY APPLICATION, 2021-2030 (USD THOUSAND)
TABLE 289 ARGENTINA AGRICULTURE AND FARMING IN NEEM OIL AND CONCENTRATES MARKET, BY TYPE, 2021-2030 (USD THOUSAND)
TABLE 290 ARGENTINA PHARMACEUTICALS AND NUTRACEUTICALS IN NEEM OIL AND CONCENTRATES MARKET, BY TYPE, 2021-2030 (USD THOUSAND)
TABLE 291 ARGENTINA PHARMACEUTICALS AND NUTRACEUTICALS IN NEEM OIL AND CONCENTRATES MARKET, BY TYPE, 2021-2030 (USD THOUSAND)
TABLE 292 ARGENTINA AUTOMOTIVE IN NEEM OIL AND CONCENTRATES MARKET, BY TYPE, 2021-2030 (USD THOUSAND)
TABLE 293 ARGENTINA FOOD AND BEVERAGES IN NEEM OIL AND CONCENTRATES MARKET, BY TYPE, 2021-2030 (USD THOUSAND)
TABLE 294 ARGENTINA OTHERS IN NEEM OIL AND CONCENTRATES MARKET, BY TYPE, 2021-2030 (USD THOUSAND)
TABLE 295 REST OF SOUTH AMERICA NEEM OIL AND CONCENTRATES MARKET, BY TYPE, 2021-2030 (USD THOUSAND)
TABLE 296 REST OF SOUTH AMERICA NEEM OIL AND CONCENTRATES MARKET, BY TYPE, 2021-2030 (TONS)
TABLE 297 MIDDLE EAST AND AFRICA NEEM OIL AND CONCENTRATES MARKET, BY COUNTRY, 2021-2030 (USD THOUSAND)
TABLE 298 MIDDLE EAST AND AFRICA NEEM OIL AND CONCENTRATES MARKET, BY COUNTRY, 2021-2030 (TONS)
TABLE 299 MIDDLE EAST AND AFRICA NEEM OIL AND CONCENTRATES MARKET, BY TYPE, 2021-2030 (USD THOUSAND)
TABLE 300 MIDDLE EAST AND AFRICA NEEM OIL AND CONCENTRATES MARKET, BY TYPE, 2021-2030 (TONS)
TABLE 301 MIDDLE EAST AND AFRICA NEEM OIL AND CONCENTRATES MARKET, BY APPLICATION, 2021-2030 (USD THOUSAND)
TABLE 302 MIDDLE EAST AND AFRICA AGRICULTURE AND FARMING IN NEEM OIL AND CONCENTRATES MARKET, BY TYPE, 2021-2030 (USD THOUSAND)
TABLE 303 MIDDLE EAST AND AFRICA PHARMACEUTICALS AND NUTRACEUTICALS IN NEEM OIL AND CONCENTRATES MARKET, BY TYPE, 2021-2030 (USD THOUSAND)
TABLE 304 MIDDLE EAST AND AFRICA PERSONAL CARE IN NEEM OIL AND CONCENTRATES MARKET, BY TYPE, 2021-2030 (USD THOUSAND)
TABLE 305 MIDDLE EAST AND AFRICA AUTOMOTIVE IN NEEM OIL AND CONCENTRATES MARKET, BY TYPE, 2021-2030 (USD THOUSAND)
TABLE 306 MIDDLE EAST AND AFRICA FOOD AND BEVERAGES IN NEEM OIL AND CONCENTRATES MARKET, BY TYPE, 2021-2030 (USD THOUSAND)
TABLE 307 MIDDLE EAST AND AFRICA OTHERS IN NEEM OIL AND CONCENTRATES MARKET, BY TYPE, 2021-2030 (USD THOUSAND)
TABLE 308 SOUTH AFRICA NEEM OIL AND CONCENTRATES MARKET, BY TYPE, 2021-2030 (USD THOUSAND)
TABLE 309 SOUTH AFRICA NEEM OIL AND CONCENTRATES MARKET, BY TYPE, 2021-2030 (TONS)
TABLE 310 SOUTH AFRICA NEEM OIL AND CONCENTRATES MARKET, BY APPLICATION, 2021-2030 (USD THOUSAND)
TABLE 311 SOUTH AFRICA AGRICULTURE AND FARMING IN NEEM OIL AND CONCENTRATES MARKET, BY TYPE, 2021-2030 (USD THOUSAND)
TABLE 312 SOUTH AFRICA PHARMACEUTICALS AND NUTRACEUTICALS IN NEEM OIL AND CONCENTRATES MARKET, BY TYPE, 2021-2030 (USD THOUSAND)
TABLE 313 SOUTH AFRICA PERSONAL CARE IN NEEM OIL AND CONCENTRATES MARKET, BY TYPE, 2021-2030 (USD THOUSAND)
TABLE 314 SOUTH AFRICA AUTOMOTIVE IN NEEM OIL AND CONCENTRATES MARKET, BY TYPE, 2021-2030 (USD THOUSAND)
TABLE 315 SOUTH AFRICA FOOD AND BEVERAGES IN NEEM OIL AND CONCENTRATES MARKET, BY TYPE, 2021-2030 (USD THOUSAND)
TABLE 316 SOUTH AFRICA OTHERS IN NEEM OIL AND CONCENTRATES MARKET, BY TYPE, 2021-2030 (USD THOUSAND)
TABLE 317 EGYPT NEEM OIL AND CONCENTRATES MARKET, BY TYPE, 2021-2030 (USD THOUSAND)
TABLE 318 EGYPT NEEM OIL AND CONCENTRATES MARKET, BY TYPE, 2021-2030 (TONS)
TABLE 319 EGYPT NEEM OIL AND CONCENTRATES MARKET, BY APPLICATION, 2021-2030 (USD THOUSAND)
TABLE 320 EGYPT AGRICULTURE AND FARMING IN NEEM OIL AND CONCENTRATES MARKET, BY TYPE, 2021-2030 (USD THOUSAND)
TABLE 321 EGYPT PHARMACEUTICALS AND NUTRACEUTICALS IN NEEM OIL AND CONCENTRATES MARKET, BY TYPE, 2021-2030 (USD THOUSAND)
TABLE 322 EGYPT PERSONAL CARE IN NEEM OIL AND CONCENTRATES MARKET, BY TYPE, 2021-2030 (USD THOUSAND)
TABLE 323 EGYPT AUTOMOTIVE IN NEEM OIL AND CONCENTRATES MARKET, BY TYPE, 2021-2030 (USD THOUSAND)
TABLE 324 EGYPT FOOD AND BEVERAGES IN NEEM OIL AND CONCENTRATES MARKET, BY TYPE, 2021-2030 (USD THOUSAND)
TABLE 325 EGYPT OTHERS IN NEEM OIL AND CONCENTRATES MARKET, BY TYPE, 2021-2030 (USD THOUSAND)
TABLE 326 SAUDI ARABIA NEEM OIL AND CONCENTRATES MARKET, BY TYPE, 2021-2030 (USD THOUSAND)
TABLE 327 SAUDI ARABIA NEEM OIL AND CONCENTRATES MARKET, BY TYPE, 2021-2030 (TONS)
TABLE 328 SAUDI ARABIA NEEM OIL AND CONCENTRATES MARKET, BY APPLICATION, 2021-2030 (USD THOUSAND)
TABLE 329 SAUDI ARABIA AGRICULTURE AND FARMING IN NEEM OIL AND CONCENTRATES MARKET, BY TYPE, 2021-2030 (USD THOUSAND)
TABLE 330 SAUDI ARABIA PHARMACEUTICALS AND NUTRACEUTICALS IN NEEM OIL AND CONCENTRATES MARKET, BY TYPE, 2021-2030 (USD THOUSAND)
TABLE 331 SAUDI ARABIA PERSONAL CARE IN NEEM OIL AND CONCENTRATES MARKET, BY TYPE, 2021-2030 (USD THOUSAND)
TABLE 332 SAUDI ARABIA AUTOMOTIVE IN NEEM OIL AND CONCENTRATES MARKET, BY TYPE, 2021-2030 (USD THOUSAND)
TABLE 333 SAUDI ARABIA FOOD AND BEVERAGES IN NEEM OIL AND CONCENTRATES MARKET, BY TYPE, 2021-2030 (USD THOUSAND)
TABLE 334 SAUDI ARABIA OTHERS IN NEEM OIL AND CONCENTRATES MARKET, BY TYPE, 2021-2030 (USD THOUSAND)
TABLE 335 ISRAEL NEEM OIL AND CONCENTRATES MARKET, BY TYPE, 2021-2030 (USD THOUSAND)
TABLE 336 ISRAEL NEEM OIL AND CONCENTRATES MARKET, BY TYPE, 2021-2030 (TONS)
TABLE 337 ISRAEL NEEM OIL AND CONCENTRATES MARKET, BY APPLICATION, 2021-2030 (USD THOUSAND)
TABLE 338 ISRAEL AGRICULTURE AND FARMING IN NEEM OIL AND CONCENTRATES MARKET, BY TYPE, 2021-2030 (USD THOUSAND)
TABLE 339 ISRAEL PHARMACEUTICALS AND NUTRACEUTICALS IN NEEM OIL AND CONCENTRATES MARKET, BY TYPE, 2021-2030 (USD THOUSAND)
TABLE 340 ISRAEL PERSONAL CARE IN NEEM OIL AND CONCENTRATES MARKET, BY TYPE, 2021-2030 (USD THOUSAND)
TABLE 341 ISRAEL AUTOMOTIVE IN NEEM OIL AND CONCENTRATES MARKET, BY TYPE, 2021-2030 (USD THOUSAND)
TABLE 342 ISRAEL FOOD AND BEVERAGES IN NEEM OIL AND CONCENTRATES MARKET, BY TYPE, 2021-2030 (USD THOUSAND)
TABLE 343 ISRAEL OTHERS IN NEEM OIL AND CONCENTRATES MARKET, BY TYPE, 2021-2030 (USD THOUSAND)
TABLE 344 UNITED ARAB EMIRATES NEEM OIL AND CONCENTRATES MARKET, BY TYPE, 2021-2030 (USD THOUSAND)
TABLE 345 UNITED ARAB EMIRATES NEEM OIL AND CONCENTRATES MARKET, BY TYPE, 2021-2030 (TONS)
TABLE 346 UNITED ARAB EMIRATES NEEM OIL AND CONCENTRATES MARKET, BY APPLICATION, 2021-2030 (USD THOUSAND)
TABLE 347 UNITED ARAB EMIRATES AGRICULTURE AND FARMING IN NEEM OIL AND CONCENTRATES MARKET, BY TYPE, 2021-2030 (USD THOUSAND)
TABLE 348 UNITED ARAB EMIRATES PHARMACEUTICALS AND NUTRACEUTICALS IN NEEM OIL AND CONCENTRATES MARKET, BY TYPE, 2021-2030 (USD THOUSAND)
TABLE 349 UNITED ARAB EMIRATES PERSONAL CARE IN NEEM OIL AND CONCENTRATES MARKET, BY TYPE, 2021-2030 (USD THOUSAND)
TABLE 350 UNITED ARAB EMIRATES AUTOMOTIVE IN NEEM OIL AND CONCENTRATES MARKET, BY TYPE, 2021-2030 (USD THOUSAND)
TABLE 351 UNITED ARAB EMIRATES FOOD AND BEVERAGES IN NEEM OIL AND CONCENTRATES MARKET, BY TYPE, 2021-2030 (USD THOUSAND)
TABLE 352 UNITED ARAB EMIRATES OTHERS IN NEEM OIL AND CONCENTRATES MARKET, BY TYPE, 2021-2030 (USD THOUSAND)
TABLE 353 REST OF MIDDLE EAST AND AFRICA NEEM OIL AND CONCENTRATES MARKET, BY TYPE, 2021-2030 (USD THOUSAND)
TABLE 354 REST OF MIDDLE EAST AND AFRICA NEEM OIL AND CONCENTRATES MARKET, BY TYPE, 2021-2030 (TONS)
Lista de Figura
FIGURE 1 GLOBAL NEEM OIL AND CONCENTRATES MARKET
FIGURE 2 GLOBAL NEEM OIL AND CONCENTRATES MARKET: DATA TRIANGULATION
FIGURE 3 GLOBAL NEEM OIL AND CONCENTRATES MARKET: DROC ANALYSIS
FIGURE 4 GLOBAL NEEM OIL AND CONCENTRATES MARKET: GLOBAL VS REGIONAL MARKET ANALYSIS
FIGURE 5 GLOBAL NEEM OIL AND CONCENTRATES MARKET: COMPANY RESEARCH ANALYSIS
FIGURE 6 GLOBAL NEEM OIL AND CONCENTRATES MARKET: THE TYPE LIFE LINE CURVE
FIGURE 7 GLOBAL NEEM OIL AND CONCENTRATES MARKET: MULTIVARIATE MODELLING
FIGURE 8 GLOBAL NEEM OIL AND CONCENTRATES MARKET: INTERVIEW DEMOGRAPHICS
FIGURE 9 GLOBAL NEEM OIL AND CONCENTRATES MARKET: DBMR MARKET POSITION GRID
FIGURE 10 GLOBAL NEEM OIL AND CONCENTRATES MARKET: MARKET APPLICATION COVERAGE GRID
FIGURE 11 GLOBAL NEEM OIL AND CONCENTRATES MARKET: THE MARKET CHALLENGE MATRIX
FIGURE 12 GLOBAL NEEM OIL AND CONCENTRATES MARKET: VENDOR SHARE ANALYSIS
FIGURE 13 GLOBAL NEEM OIL AND CONCENTRATES MARKET: SEGMENTATION
FIGURE 14 ASIA-PACIFIC IS EXPECTED TO DOMINATE THE GLOBAL NEEM OIL AND CONCENTRATES MARKET, WHILE NORTH AMERICA IS EXPECTED TO GROW WITH THE HIGHEST CAGR IN THE FORECAST PERIOD
FIGURE 15 GROWING DEMAND FOR ORGANIC PRODUCTS IS EXPECTED TO DRIVE THE GLOBAL NEEM OIL AND CONCENTRATES MARKET IN THE FORECAST PERIOD
FIGURE 16 THE FRUIT AND SEED EXTRACT IS EXPECTED TO ACCOUNT FOR THE LARGEST SHARE OF THE GLOBAL NEEM OIL AND CONCENTRATES MARKET IN 2023 AND 2030
FIGURE 17 NORTH AMERICA IS THE FASTEST-GROWING MARKET FOR NEEM OIL AND CONCENTRATES MARKET MANUFACTURERS IN THE FORECAST PERIOD
FIGURE 18 DRIVERS, RESTRAINTS, OPPORTUNITIES, AND CHALLENGES OF THE GLOBAL NEEM OIL AND CONCENTRATES MARKET
FIGURE 19 GLOBAL NEEM OIL AND CONCENTRATES MARKET: SNAPSHOT (2022)
FIGURE 20 GLOBAL NEEM OIL AND CONCENTRATES MARKET: BY REGION (2022)
FIGURE 21 GLOBAL NEEM OIL AND CONCENTRATES MARKET: BY REGION (2023 & 2030)
FIGURE 22 GLOBAL NEEM OIL AND CONCENTRATES MARKET: BY REGION (2022 & 2030)
FIGURE 23 GLOBAL NEEM OIL AND CONCENTRATES MARKET: BY TYPE (2023 - 2030)
FIGURE 24 ASIA-PACIFIC NEEM OIL AND CONCENTRATES MARKET: SNAPSHOT (2022)
FIGURE 25 ASIA-PACIFIC NEEM OIL AND CONCENTRATES MARKET: BY COUNTRY (2022)
FIGURE 26 ASIA-PACIFIC NEEM OIL AND CONCENTRATES MARKET: BY COUNTRY (2023 & 2030)
FIGURE 27 ASIA-PACIFIC NEEM OIL AND CONCENTRATES MARKET: BY COUNTRY (2022 & 2030)
FIGURE 28 ASIA-PACIFIC NEEM OIL AND CONCENTRATES MARKET: BY TYPE (2023 - 2030)
FIGURE 29 NORTH AMERICA NEEM OIL AND CONCENTRATES MARKET: SNAPSHOT (2022)
FIGURE 30 NORTH AMERICA NEEM OIL AND CONCENTRATES MARKET: BY COUNTRY (2022)
FIGURE 31 NORTH AMERICA NEEM OIL AND CONCENTRATES MARKET: BY COUNTRY (2023 & 2030)
FIGURE 32 NORTH AMERICA NEEM OIL AND CONCENTRATES MARKET: BY COUNTRY (2022 & 2030)
FIGURE 33 NORTH AMERICA NEEM OIL AND CONCENTRATES MARKET: BY TYPE (2023 - 2030)
FIGURE 34 EUROPE NEEM OIL AND CONCENTRATES MARKET: SNAPSHOT (2022)
FIGURE 35 EUROPE NEEM OIL AND CONCENTRATES MARKET: BY COUNTRY (2022)
FIGURE 36 EUROPE NEEM OIL AND CONCENTRATES MARKET: BY COUNTRY (2023 & 2030)
FIGURE 37 EUROPE NEEM OIL AND CONCENTRATES MARKET: BY COUNTRY (2022 & 2030)
FIGURE 38 EUROPE NEEM OIL AND CONCENTRATES MARKET: BY TYPE (2023 - 2030)
FIGURE 39 SOUTH AMERICA NEEM OIL AND CONCENTRATES MARKET: SNAPSHOT (2022)
FIGURE 40 SOUTH AMERICA NEEM OIL AND CONCENTRATES MARKET: BY COUNTRY (2022)
FIGURE 41 SOUTH AMERICA NEEM OIL AND CONCENTRATES MARKET: BY COUNTRY (2023 & 2030)
FIGURE 42 SOUTH AMERICA NEEM OIL AND CONCENTRATES MARKET: BY COUNTRY (2022 & 2030)
FIGURE 43 SOUTH AMERICA NEEM OIL AND CONCENTRATES MARKET: BY TYPE (2023 - 2030)
FIGURE 44 MIDDLE EAST AND AFRICA NEEM OIL AND CONCENTRATES MARKET: SNAPSHOT (2022)
FIGURE 45 MIDDLE EAST AND AFRICA NEEM OIL AND CONCENTRATES MARKET: BY COUNTRY (2022)
FIGURE 46 MIDDLE EAST AND AFRICA NEEM OIL AND CONCENTRATES MARKET: BY COUNTRY (2023 & 2030)
FIGURE 47 MIDDLE EAST AND AFRICA NEEM OIL AND CONCENTRATES MARKET: BY COUNTRY (2022 & 2030)
FIGURE 48 MIDDLE EAST AND AFRICA NEEM OIL AND CONCENTRATES MARKET: BY TYPE (2023 - 2030)
FIGURE 49 GLOBAL NEEM OIL AND CONCENTRATES MARKET: COMPANY SHARE 2022 (%)
FIGURE 50 ASIA PACIFIC NEEM OIL AND CONCENTRATES MARKET: COMPANY SHARE 2022 (%)
FIGURE 51 NORTH AMERICA NEEM OIL AND CONCENTRATES MARKET: COMPANY SHARE 2022 (%)
FIGURE 52 EUROPE NEEM OIL AND CONCENTRATES MARKET: COMPANY SHARE 2022 (%)
Metodologia de Investigação
A recolha de dados e a análise do ano base são feitas através de módulos de recolha de dados com amostras grandes. A etapa inclui a obtenção de informações de mercado ou dados relacionados através de diversas fontes e estratégias. Inclui examinar e planear antecipadamente todos os dados adquiridos no passado. Da mesma forma, envolve o exame de inconsistências de informação observadas em diferentes fontes de informação. Os dados de mercado são analisados e estimados utilizando modelos estatísticos e coerentes de mercado. Além disso, a análise da quota de mercado e a análise das principais tendências são os principais fatores de sucesso no relatório de mercado. Para saber mais, solicite uma chamada de analista ou abra a sua consulta.
A principal metodologia de investigação utilizada pela equipa de investigação do DBMR é a triangulação de dados que envolve a mineração de dados, a análise do impacto das variáveis de dados no mercado e a validação primária (especialista do setor). Os modelos de dados incluem grelha de posicionamento de fornecedores, análise da linha de tempo do mercado, visão geral e guia de mercado, grelha de posicionamento da empresa, análise de patentes, análise de preços, análise da quota de mercado da empresa, normas de medição, análise global versus regional e de participação dos fornecedores. Para saber mais sobre a metodologia de investigação, faça uma consulta para falar com os nossos especialistas do setor.
Personalização disponível
A Data Bridge Market Research é líder em investigação formativa avançada. Orgulhamo-nos de servir os nossos clientes novos e existentes com dados e análises que correspondem e atendem aos seus objetivos. O relatório pode ser personalizado para incluir análise de tendências de preços de marcas-alvo, compreensão do mercado para países adicionais (solicite a lista de países), dados de resultados de ensaios clínicos, revisão de literatura, mercado remodelado e análise de base de produtos . A análise de mercado dos concorrentes-alvo pode ser analisada desde análises baseadas em tecnologia até estratégias de carteira de mercado. Podemos adicionar quantos concorrentes necessitar de dados no formato e estilo de dados que procura. A nossa equipa de analistas também pode fornecer dados em tabelas dinâmicas de ficheiros Excel em bruto (livro de factos) ou pode ajudá-lo a criar apresentações a partir dos conjuntos de dados disponíveis no relatório.

