
Global Food Bags Market
Tamanho do mercado em biliões de dólares
CAGR :
% 
 USD
399.63 Billion
USD
608.67 Billion
2024
2032
USD
399.63 Billion
USD
608.67 Billion
2024
2032
| 2025 –2032 | |
| USD 399.63 Billion | |
| USD 608.67 Billion | |
| % | |
|
Global Food Bags Market Segmentation, By Type (Standard Carry Bags, Stand Up Bags, Zipper Bags, Food Safe Barrier Bags, Self-Opening-Style Bags, Smell Proof Bags, Pinch Bottom Bags, T-Shirt Plastic Bags and Others), Material (Plastic, Paper, Aluminium and Others), Usage (Single-Use and Reusable), Style (Crystal Clear Bags, Heat Seal Bags, Eco Clear Bags, Cupcake Bags, Micro-Perforated Bags and Others), Capacity (Less Than 1 Kg, 1 Kg-5 Kg, 5 Kg-10 Kg and More Than 10 Kg), Distribution Channel (Supermarkets/Hypermarkets, Convenience Stores, Specialty Stores, E-Commerce and Others), End-User (Restaurants, Hotels, Tea & Coffee Shops, Sweets & Snacks Stores, Cafeteria, Home and Others) – Industry Trends and Forecast to 2032
Food Bags Market Analysis
Food bags are one of the generally used plastic bags in daily usage. Food bags owing toward their chemically unreactive are favourable for packaging of different kinds of materials including harmful substances. Food bags are a good solution for packing food, chemicals, and pharmaceuticals because of their high durability to weight ratio and flexibility. Food bags come in a range of shapes and sizes, thanks to manufacturers. Low-density food storage bags make up the majority of commonly used food storage bags (LDPE). Food bags are used in food packaging as they provide extended shelf life when coated or lined with hurdle films.
Food Bags Market Size
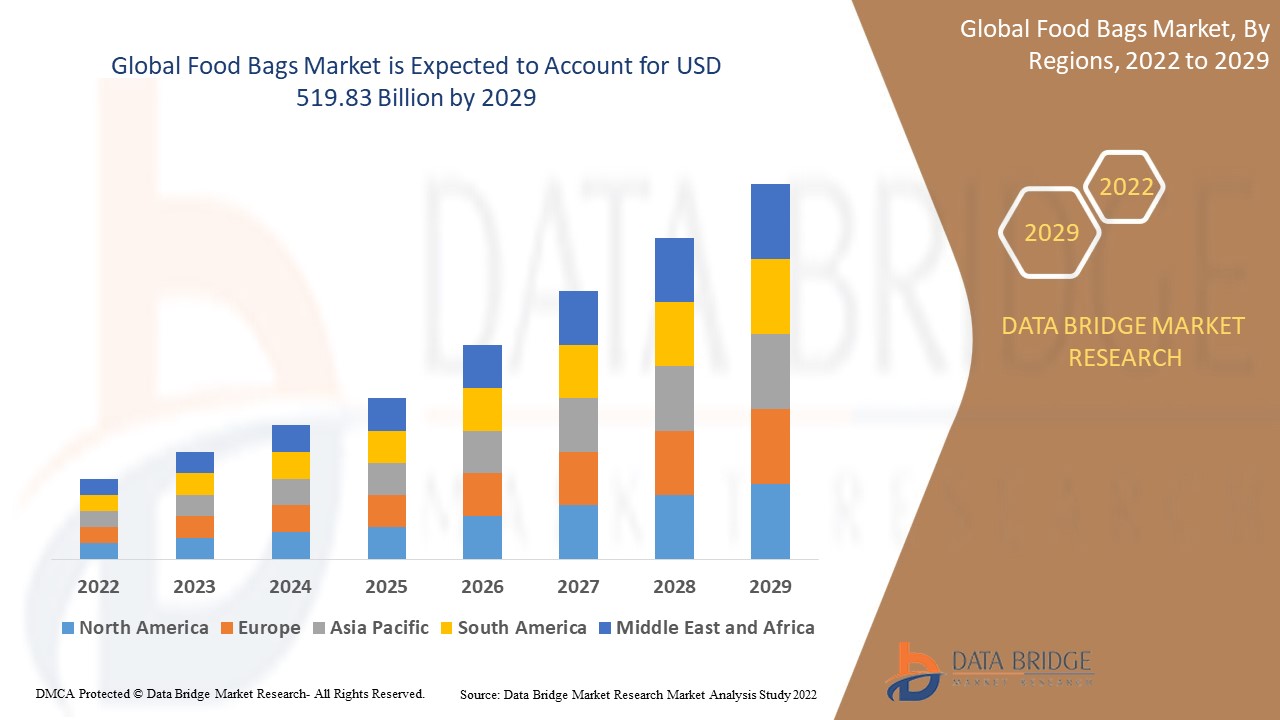
Global food bags market size was valued at USD 399.63 billion in 2024 and is projected to reach USD 608.67 billion by 2032, with a CAGR of 5.4% during the forecast period of 2025 to 2032.
Report Scope and Market Segmentation
|
Attributes |
Food Bags Key Market Insights |
|
Segmentation |
|
|
Countries Covered |
U.S., Canada, Mexico, Brazil, Argentina, Rest of South America, Germany, France, Italy, U.K., Belgium, Spain, Russia, Turkey, Netherlands, Switzerland, Rest of Europe, Japan, China, India, South Korea, Australia and New Zealand, Singapore, Malaysia, Thailand, Indonesia, Philippines, Rest of Asia-Pacific, United Arab Emirate, Saudi Arabia, Egypt, Israel, South Africa, Rest of Middle East and Africa |
|
Key Market Players |
International Paper (US), Amcor plc (Swiitzerland), Smurfit Kappa (Ireland), WestRock Company (US), PAPIER- METTLER (Germany), Unistar Plastics, LLC (US), Novolex (US), Inteplast Group (US), BioBag International AS.(Norway), Cardia bioplastics (Australia), Berry Global Inc (US), Packaging Pro (Australia), NOVPLASTA CZ, s.r.o. (Czechia), UNITED BAGS, INC. (US), Rizhao Chuanyu plastic Co., Ltd.(China), El Dorado Packaging Inc. (US), Superbag (US), Ronpak.com (US) |
|
Market Opportunities |
|
Food Bags Market Definition
Food bags play a vital role in protective and transporting food items to their preferred location without affecting the taste or quality. It prevents the contents from moisture and toxins, prevents the food products from spillage and tampering, and helps to preserve their shape and quality. Food packaging has also gained popularity as a means of communicating information such as nutritional content, expiration date, pricing, and origin of packaged goods. It is also a new marketing channel for retailers to attract customers from all around the world.
Food Bags Market Dynamics
Drivers
- Government initiatives for spreading consumer awareness
Rising health awareness and government initiatives are projected to drive the demand for fruits and vegetables and subsequently packaging solutions for the same and increasing consumer disposable income has led to increase in demand for garden-fresh products are those reasons which increase the consumer demand for eco-friendly food packaging solutions with low costs and comfort of handling is expected to drive the demand over the upcoming years.
- Increase demand of product in market
The market is rising at an accelerating rate due to several factors like changing trends towards specialty and advancement in materials, processed food, adoption and several types of strategies that help in the development of the market in the globe. Due to the rising advancement in the technology sector, the growth of the market is increasing. Nowadays, the changing lifestyle, more demand for packed food results increase the growth food bag market in the global.
Opportunities
- Rise in product innovations and technology and advancement
Increasing advancement in the food packaging technology owing to the use of antimicrobial packaging technique which helps in rising the shelf life of the packed foods and even of consumable food items. Also due to the rising competitive strategies among key players in the emerging countries, these are the major reasons which show various market growth opportunities during the forecasted period.
Furthermore, the increase in strategic collaborations and emerging new markets would function as market drivers, enhancing the industry's growth rate.
Restraints/ Challenges
The global market is growing rapidly, but several factors are limiting its expansion, such as the fluctuating prices of raw materials used in the food packaging business. The growth rate of the food bag market has slowed as a result of rising raw material costs. The primary material used in the food packaging business is non-biodegradable plastic, and the government has imposed stringent limitations on the usage of the market in some rising countries in order to limit the market's expansion.
This food bags market report provides details of new recent developments, trade regulations, import-export analysis, production analysis, value chain optimization, market share, impact of domestic and localized market players, analyses opportunities in terms of emerging revenue pockets, changes in market regulations, strategic market growth analysis, market size, category market growths, application niches and dominance, product approvals, product launches, geographic expansions, technological innovations in the market. To gain more info on the food bags market contact Data Bridge Market Research for an Analyst Brief, our team will help you take an informed market decision to achieve market growth.
Food Bags Market Scope
The food bags market is segmented on the basis of type, materials, usage, capacity, style, distribution channel and end-user. The growth amongst these segments will help you analyze meagre growth segments in the industries and provide the users with a valuable market overview and market insights to help them make strategic decisions for identifying core market applications.
Type
- Standard Carry Bags
- Stand Up Bags
- Zipper Bags
- Food Safe Barrier Bags
- Self-Opening-Style Bags
- Smell Proof Bags
- Pinch Bottom Bags
- T-Shirt Plastic Bags
- Others
Materials
- Plastic
- Paper
- Aluminium
- Others
Usage
- Single Use
- Re-Usable
Style
- Crystal Clear Bags
- Heat Seal Bags
- Eco Clear Bags
- Cupcake Bags
- Micro-Perforated Bags
- Others
Capacity
- Less Than 1 Kg,
- 1 Kg-5 Kg,
- 5 Kg-10 Kg
- More Than 10 Kg
Distribution Channel
- Supermarkets/Hypermarkets
- Convenience Stores
- Specialty Stores
- E-Commerce
- Others
End-User
- Restaurants
- Hotels
- Tea & Coffee Shops
- Sweets & Snacks Stores
- Cafeteria
- Home
- Others
Food Bags Market Regional Analysis
The food bags market is analyzed and market size insights and trends are provided by country, type, materials usage, capacity, style, distribution channel and end-user as referenced above.
The countries covered in the food bags market report are U.S., Canada, Mexico, Brazil, Argentina, Rest of South America, Germany, France, Italy, U.K., Belgium, Spain, Russia, Turkey, Netherlands, Switzerland, Rest of Europe, Japan, China, India, South Korea, Australia and New Zealand, Singapore, Malaysia, Thailand, Indonesia, Philippines, Rest of Asia-Pacific, United Arab Emirate, Saudi Arabia, Egypt, Israel, South Africa, Rest of Middle East and Africa.
Asia-Pacific dominates the food bags market and will continue to do so during the forecast period. This is due to the rising consumption of frozen food, increasing the demand for food bags in this region. The Asia-Pacific region dominates the food bags market, with China leading the way to the production and consumption of frozen food. Due of the ease of producing re-usable food bags, China is leading the Asia-Pacific market.
During the projected period, North America is expected to be the fastest developing region due to the rising demand for frozen food increase the demand for food bags in the retail sector in this region.
The country section of the report also provides individual market impacting factors and changes in market regulation that impact the current and future trends of the market. Data points like down-stream and upstream value chain analysis, technical trends and porter's five forces analysis, case studies are some of the pointers used to forecast the market scenario for individual countries. Also, the presence and availability of global brands and their challenges faced due to large or scarce competition from local and domestic brands, impact of domestic tariffs and trade routes are considered while providing forecast analysis of the country data.
Food Bags Market Share
The food bags market competitive landscape provides details by competitor. Details included are company overview, company financials, revenue generated, market potential, investment in research and development, new market initiatives, global presence, production sites and facilities, production capacities, company strengths and weaknesses, product launch, product width and breadth, application dominance. The above data points provided are only related to the companies' focus related to food bags market.
Food Bags Market Leaders Operating in the Market Are:
- International Paper (U.S)
- Amcor plc (Switzerland)
- Smurfit Kappa (Ireland)
- WestRock Company (U.S)
- PAPIER-METTLER (Germany)
- Unistar Plastics, LLC (U.S)
- Novolex (U.S)
- Inteplast Group (U.S)
- BioBag International AS. (Norway)
- Cardia bioplastics (Australia)
- Berry Global Inc (U.S.)
- PackagingPro (U.S)
- NOVPLASTA CZ, s.r.o. (Czechia)
- UNITED BAGS, INC. (U.S.)
- Rizhao Chuanyu plastic Co., Ltd. (China)
- El Dorado Packaging Inc. (U.S.)
- Superbag (U.S.)
- Ronpak.com (U.S.)
Latest Developments in Food Bags Market
- In September 2019, Amcor plc was honored with the best packaging innovation for the four times that increase the customer suitability towards the packaging products. The award helped in rising goodwill of the company.
- In June 2019, Smurfit Kappa was awarded with ‘World Star Awards’ for sustainable and innovative packaging solutions. The honour helped in growing the customer base and raises the goodwill of the business.
SKU-
Obtenha acesso online ao relatório sobre a primeira nuvem de inteligência de mercado do mundo

- Painel interativo de análise de dados
- Painel de análise da empresa para oportunidades de elevado potencial de crescimento
- Acesso de analista de pesquisa para personalização e customização. consultas
- Análise da concorrência com painel interativo
- Últimas notícias, atualizações e atualizações Análise de tendências
- Aproveite o poder da análise de benchmark para um rastreio abrangente da concorrência
Metodologia de Investigação
A recolha de dados e a análise do ano base são feitas através de módulos de recolha de dados com amostras grandes. A etapa inclui a obtenção de informações de mercado ou dados relacionados através de diversas fontes e estratégias. Inclui examinar e planear antecipadamente todos os dados adquiridos no passado. Da mesma forma, envolve o exame de inconsistências de informação observadas em diferentes fontes de informação. Os dados de mercado são analisados e estimados utilizando modelos estatísticos e coerentes de mercado. Além disso, a análise da quota de mercado e a análise das principais tendências são os principais fatores de sucesso no relatório de mercado. Para saber mais, solicite uma chamada de analista ou abra a sua consulta.
A principal metodologia de investigação utilizada pela equipa de investigação do DBMR é a triangulação de dados que envolve a mineração de dados, a análise do impacto das variáveis de dados no mercado e a validação primária (especialista do setor). Os modelos de dados incluem grelha de posicionamento de fornecedores, análise da linha de tempo do mercado, visão geral e guia de mercado, grelha de posicionamento da empresa, análise de patentes, análise de preços, análise da quota de mercado da empresa, normas de medição, análise global versus regional e de participação dos fornecedores. Para saber mais sobre a metodologia de investigação, faça uma consulta para falar com os nossos especialistas do setor.
Personalização disponível
A Data Bridge Market Research é líder em investigação formativa avançada. Orgulhamo-nos de servir os nossos clientes novos e existentes com dados e análises que correspondem e atendem aos seus objetivos. O relatório pode ser personalizado para incluir análise de tendências de preços de marcas-alvo, compreensão do mercado para países adicionais (solicite a lista de países), dados de resultados de ensaios clínicos, revisão de literatura, mercado remodelado e análise de base de produtos . A análise de mercado dos concorrentes-alvo pode ser analisada desde análises baseadas em tecnologia até estratégias de carteira de mercado. Podemos adicionar quantos concorrentes necessitar de dados no formato e estilo de dados que procura. A nossa equipa de analistas também pode fornecer dados em tabelas dinâmicas de ficheiros Excel em bruto (livro de factos) ou pode ajudá-lo a criar apresentações a partir dos conjuntos de dados disponíveis no relatório.

