
Global Display Quantum Dots Market
Tamanho do mercado em biliões de dólares
CAGR :
% 
 USD
4.50 Billion
USD
28.26 Billion
2021
2029
USD
4.50 Billion
USD
28.26 Billion
2021
2029
| 2022 –2029 | |
| USD 4.50 Billion | |
| USD 28.26 Billion | |
| % | |
|
Global Display Quantum Dots Market, By Component (Tube, Film, LED), Product (Smartphone, PC Monitor, Tablet PC, TV), Material (Cadmium-Containing, Cadmium-Free), Application (Optoelectronics, Biological Imaging, Security and Video Surveillance, Quantum Optics, Renewable Energy), Vertical (Consumer Electronics, Healthcare, Automotive, Information Technology (IT) and Telecommunication, Others) – Industry Trends and Forecast to 2029
Display Quantum Dots Market Analysis and Size
The display quantum dots are the quantum dots used extensively in display devices such as smartphones, PCs, tablets. High adoption of quantum dots in LED lightings and larger demands for large-sized and higher resolution displays will further create significant growth opportunities for the display quantum dots market over the forecasted period.
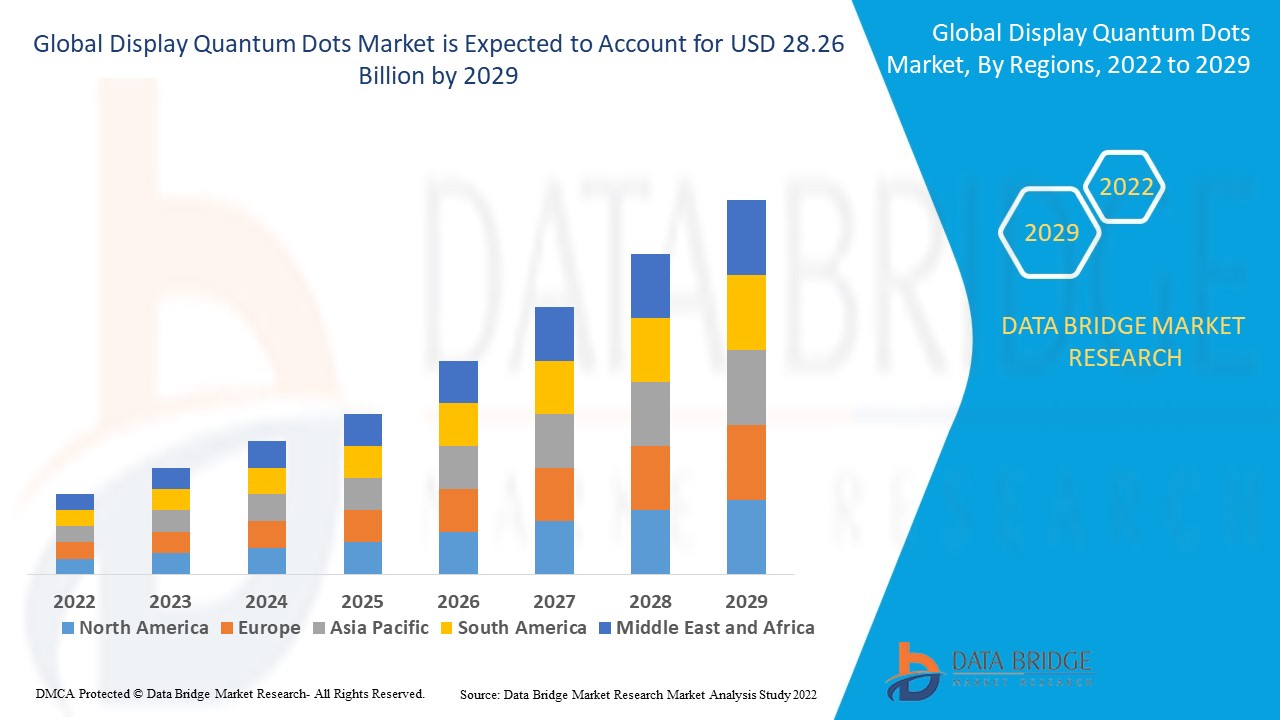
Global display quantum dots market was valued at USD 4.50 billion in 2021 and is expected to reach USD 28.26 billion by 2029, registering a CAGR of 25.82% during the forecast period of 2022-2029. In addition to the insights on market scenarios such as market value, growth rate, segmentation, geographical coverage, and major players, the market reports curated by the Data Bridge Market Research also include in-depth expert analysis, geographically represented company-wise production and capacity, network layouts of distributors and partners, detailed and updated price trend analysis and deficit analysis of supply chain and demand.
Report Scope and Market Segmentation
|
Report Metric |
Details |
|
Forecast Period |
2022 to 2029 |
|
Base Year |
2021 |
|
Historic Years |
2020 (Customizable to 2014 - 2019) |
|
Quantitative Units |
Revenue in USD Billion, Volumes in Units, Pricing in USD |
|
Segments Covered |
Component (Tube, Film, LED), Product (Smartphone, PC Monitor, Tablet PC, TV), Material (Cadmium-Containing, Cadmium-Free), Application (Optoelectronics, Biological Imaging, Security and Surveillance, Quantum Optics, Renewable Energy), Vertical (Consumer Electronics, Healthcare, Automotive, Information Technology (IT) and Telecommunication, Others) |
|
Countries Covered |
U.S., Canada and Mexico in North America, Germany, France, U.K., Netherlands, Switzerland, Belgium, Russia, Italy, Spain, Turkey, Rest of Europe in Europe, China, Japan, India, South Korea, Singapore, Malaysia, Australia, Thailand, Indonesia, Philippines, Rest of Asia-Pacific (APAC) in the Asia-Pacific (APAC), Saudi Arabia, U.A.E, South Africa, Egypt, Israel, Rest of Middle East and Africa (MEA) as a part of Middle East and Africa (MEA), Brazil, Argentina and Rest of South America as part of South America |
|
Market Players Covered |
Nanosys Inc. (U.S.), Dow (U.S.), SAMSUNG (South Korea), LG DISPLAY CO., LTD. (South Korea), Nanoco Group plc (U.K.), SHARP COPORATION (Japan), Quantum Materials Corporation (U.S.), Sony Corporation (Japan), 3M (U.S.), Ocean NanoTech (U.S.), QD Laser (Japan), MicroVision (U.S.), NNCrystal US Corporation (U.S.) |
|
Market Opportunities |
|
Market Definition
A display quantum dots are the quantum dots used extensively in display devices such as smartphones, PCs, tablets, TVs and others. High adoption of quantum dots in LED lightings and larger demands for large-sized and higher resolution displays and the enhanced energy effectiveness along with the high brightness are some beneficial factors delivered by the display quantum dots.
Global Display Quantum Dots Market Dynamics
This section deals with understanding the market drivers, advantages, opportunities, restraints and challenges. All of this is discussed in detail as below:
Drivers
- Growing demands for the display quantum dots across the globe
Growing demands for the display quantum dots due to the advanced features of quantum dots is the primary factor driving the growth of the display quantum dots market over the forecasted period. The enhanced energy effectiveness, high brightness, high adoption of quantum dots in LED lightings and larger demands for large-sized and higher resolution displays are significant factors projected to drive the growth of the display quantum dots market over the forecasted period.
- Increasing investments in the R&D sector
The increased investments in the research and development sectors across various end-users such as fuels the market growth. Various end-users such as consumer electronics, healthcare, automotive, information technology (IT), telecommunication, and others are adopting the display quantum dots to serve a wide range of applications such as optoelectronics, biological imaging, security and surveillance and others. All these factors are expected to drive the growth of the quantum display dots market over the forecasted period.
Opportunities
- Growing penetration and advancements
The growing penetration of LED across the globe is estimated to generate lucrative opportunities for the market, which will further expand the display quantum dots market's growth rate in the future. Moreover, the high adoption of quantum dots in LED lightings and larger demands for large-sized and higher resolution displays will further create significant growth opportunities for the display quantum dots market over the forecasted period.
Additionally, the technological advancements in consumer electronics, healthcare, automotive, information technology (IT) and telecommunication and other sectors will also offer numerous growth opportunities within the market.
Restraints/Challenges
- Limited availability of raw materials
The limited availability of rare-earth materials and unfavorable impact of falling prices of conventional OLED and LED/LCD displays on quantum dot displays are the major factors projected to create challenges for the display quantum dots market over the forecast period.
This display quantum dots market report provides details of new recent developments, trade regulations, import-export analysis, production analysis, value chain optimization, market share, impact of domestic and localized market players, analyses opportunities in terms of emerging revenue pockets, changes in market regulations, strategic market growth analysis, market size, category market growths, application niches and dominance, product approvals, product launches, geographic expansions, technological innovations in the market. To gain more info on the display quantum dots market contact Data Bridge Market Research for an Analyst Brief, our team will help you take an informed market decision to achieve market growth.
Impact and Current Market Scenario of Raw Material Shortage and Shipping Delays
Data Bridge Market Research offers a high-level analysis of the market and delivers information by keeping in account the impact and current market environment of raw material shortage and shipping delays. This translates into assessing strategic possibilities, creating effective action plans, and assisting businesses in making important decisions.
Apart from the standard report, we also offer in-depth analysis of the procurement level from forecasted shipping delays, distributor mapping by region, commodity analysis, production analysis, price mapping trends, sourcing, category performance analysis, supply chain risk management solutions, advanced benchmarking, and other services for procurement and strategic support.
Covid-19 impact on Display Quantum Dots Market
The covid-19 has led to severe crisis across the world and several causalities. Supply chain disruptions were created due to lockdown that was being imposed in several regions. Key manufacturers of quantum dost were severely affected during the first two quarters of 2020 due to the outbreak of the pandemic. Hence, an imbalance in the demand and supply was witnessed, leading to companies not manufacturing to their complete capacity. However, in the third quarter of 2020, lockdowns were lifted, leading to the market's steady recovery with the significant increase in the demands.
Expected Impact of Economic Slowdown on the Pricing and Availability of Products
When economic activity slows, industries begin to suffer. The forecasted effects of the economic downturn on the pricing and accessibility of the products are taken into account in the market insight reports and intelligence services provided by DBMR. With this, our clients can typically keep one step ahead of their competitors, project their sales and revenue, and estimate their profit and loss expenditures.
Recent developments
- In 2019, Samsung invested US$ 11 Billion in the world’s first dedicated quantum dot display manufacturing facility. It acted as a new hub for manufacturing quantum display dots over the region.
- In 2019, Nanosys demonstrated its revolutionary quantum efficiency heavy metal-free red, green, blue QDEL systems and successfully printed displays in their laboratories using ink jet technology.
Global Display Quantum Dots Market Scope
The display quantum dots market is segmented on the basis of component, product, material, application and vertical. The growth amongst these segments will help you analyze meagre growth segments in the industries and provide the users with a valuable market overview and market insights to help them make strategic decisions for identifying core market applications.
Component
- Tube
- Film
- LED
Product
- Smartphone
- PC Monitor
- Tablet PC
- TV
Material
- Cadmium-Containing
- Cadmium-Free
Application
- Optoelectronics
- Biological Imaging
- Security and Surveillance
- Quantum Optics
- Renewable Energy
Vertical
- Consumer Electronics
- Healthcare
- Automotive
- Information Technology (IT) and Telecommunication
- Others
Global Display Quantum Dots Market Regional Analysis/Insights
The display quantum dots market is analyzed and market size insights and trends are provided by component, product, material, application and vertical as referenced above.
The countries covered in the display quantum dots market report are U.S., Canada and Mexico in North America, Germany, France, U.K., Netherlands, Switzerland, Belgium, Russia, Italy, Spain, Turkey, Rest of Europe in Europe, China, Japan, India, South Korea, Singapore, Malaysia, Australia, Thailand, Indonesia, Philippines, Rest of Asia-Pacific (APAC) in the Asia-Pacific (APAC), Saudi Arabia, U.A.E, South Africa, Egypt, Israel, Rest of Middle East and Africa (MEA) as a part of Middle East and Africa (MEA), Brazil, Argentina and Rest of South America as part of South America.
North America dominates the display quantum dots market because of rising demands for the energy efficient devices, presence of well-established infrastructure and growing interests in cadmium free quantum dots in consumer electronics sector within the region.
Asia-Pacific is expected to witness significant growth during the forecast period of 2022 to 2029 due to the rising demand display quantum dots devices and rising demands for the energy effective solutions within the region.
The country section of the report also provides individual market impacting factors and changes in regulation in the market domestically that impacts the current and future trends of the market. Data points like down-stream and upstream value chain analysis, technical trends and porter's five forces analysis, case studies are some of the pointers used to forecast the market scenario for individual countries. Also, the presence and availability of global brands and their challenges faced due to large or scarce competition from local and domestic brands, impact of domestic tariffs and trade routes are considered while providing forecast analysis of the country data.
Competitive Landscape and Display Quantum Dots Market Share Analysis
The display quantum dots market competitive landscape provides details by competitor. Details included are company overview, company financials, revenue generated, market potential, investment in research and development, new market initiatives, global presence, production sites and facilities, production capacities, company strengths and weaknesses, product launch, product width and breadth, application dominance. The above data points provided are only related to the companies' focus related to display quantum dots market.
Some of the major players operating in the display quantum dots market are
- Nanosys Inc. (U.S.)
- Dow (U.S.)
- SAMSUNG (South Korea)
- LG DISPLAY CO., LTD. (South Korea)
- Nanoco Group plc (U.K.)
- SHARP COPORATION (Japan)
- Quantum Materials Corporation (U.S.)
- Sony Corporation (Japan)
- 3M (U.S.)
- Ocean NanoTech (U.S.)
- QD Laser (Japan)
- MicroVision (U.S.)
- NNCrystal US Corporation (U.S.)
SKU-
Obtenha acesso online ao relatório sobre a primeira nuvem de inteligência de mercado do mundo

- Painel interativo de análise de dados
- Painel de análise da empresa para oportunidades de elevado potencial de crescimento
- Acesso de analista de pesquisa para personalização e customização. consultas
- Análise da concorrência com painel interativo
- Últimas notícias, atualizações e atualizações Análise de tendências
- Aproveite o poder da análise de benchmark para um rastreio abrangente da concorrência
Metodologia de Investigação
A recolha de dados e a análise do ano base são feitas através de módulos de recolha de dados com amostras grandes. A etapa inclui a obtenção de informações de mercado ou dados relacionados através de diversas fontes e estratégias. Inclui examinar e planear antecipadamente todos os dados adquiridos no passado. Da mesma forma, envolve o exame de inconsistências de informação observadas em diferentes fontes de informação. Os dados de mercado são analisados e estimados utilizando modelos estatísticos e coerentes de mercado. Além disso, a análise da quota de mercado e a análise das principais tendências são os principais fatores de sucesso no relatório de mercado. Para saber mais, solicite uma chamada de analista ou abra a sua consulta.
A principal metodologia de investigação utilizada pela equipa de investigação do DBMR é a triangulação de dados que envolve a mineração de dados, a análise do impacto das variáveis de dados no mercado e a validação primária (especialista do setor). Os modelos de dados incluem grelha de posicionamento de fornecedores, análise da linha de tempo do mercado, visão geral e guia de mercado, grelha de posicionamento da empresa, análise de patentes, análise de preços, análise da quota de mercado da empresa, normas de medição, análise global versus regional e de participação dos fornecedores. Para saber mais sobre a metodologia de investigação, faça uma consulta para falar com os nossos especialistas do setor.
Personalização disponível
A Data Bridge Market Research é líder em investigação formativa avançada. Orgulhamo-nos de servir os nossos clientes novos e existentes com dados e análises que correspondem e atendem aos seus objetivos. O relatório pode ser personalizado para incluir análise de tendências de preços de marcas-alvo, compreensão do mercado para países adicionais (solicite a lista de países), dados de resultados de ensaios clínicos, revisão de literatura, mercado remodelado e análise de base de produtos . A análise de mercado dos concorrentes-alvo pode ser analisada desde análises baseadas em tecnologia até estratégias de carteira de mercado. Podemos adicionar quantos concorrentes necessitar de dados no formato e estilo de dados que procura. A nossa equipa de analistas também pode fornecer dados em tabelas dinâmicas de ficheiros Excel em bruto (livro de factos) ou pode ajudá-lo a criar apresentações a partir dos conjuntos de dados disponíveis no relatório.

