Global Api Intermediates Market
Tamanho do mercado em biliões de dólares
CAGR :
% 
 USD
2.68 Billion
USD
4.64 Billion
2024
2032
USD
2.68 Billion
USD
4.64 Billion
2024
2032
| 2025 –2032 | |
| USD 2.68 Billion | |
| USD 4.64 Billion | |
| % | |
|
Segmentação do mercado global de intermediários de API, por tipo (intermediários para medicamentos veterinários e intermediários para medicamentos farmacêuticos/a granel), produto (composto de bromo, salbutamol de o-benzila, hemissulfato, oxirano, base de bisoprolol, PCBHP quiral, base de feniramina, base de clorfeniramina, base de bromfeniramina, base de mepiramina/pirilamina, 6-amino-1,3-dimetil uracila, teofilina, acefilina, xantina, nitrilas e outros), tipo terapêutico (doenças autoimunes, oncologia, doenças metabólicas, oftalmologia, doenças cardiovasculares, doenças infecciosas, neurologia, distúrbios respiratórios, dermatologia, urologia e outros), clientes (usuários diretos/empresas farmacêuticas, comerciantes/atacadistas/distribuidores, associações/governo e instituições/instituições privadas), usuário final (fabricante de API e produtos acabados) Fabricante do produto), canal de distribuição (licitação direta, vendas no varejo e outros) — Tendências e previsões do setor até 2032

Tamanho do mercado de intermediários de API
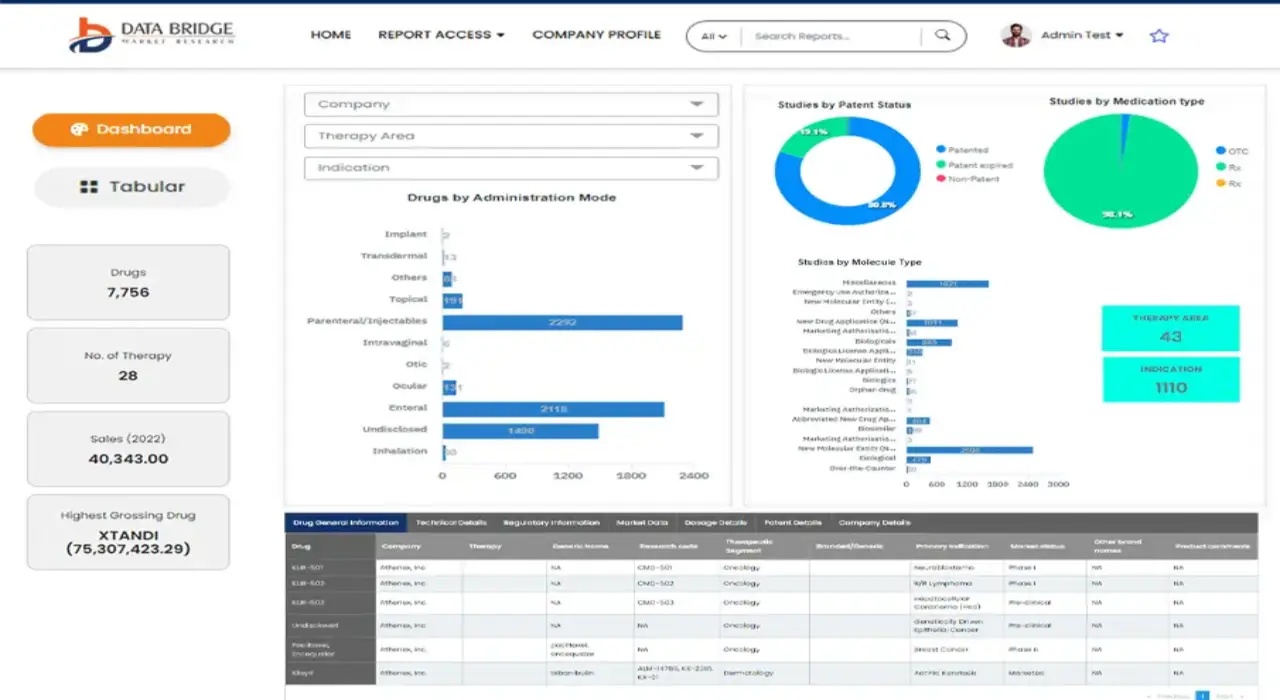
- O tamanho do mercado global de intermediários de API foi avaliado em US$ 2,68 bilhões em 2024 e deve atingir US$ 4,64 bilhões até 2032 , com um CAGR de 7,10% durante o período previsto.
- O crescimento do mercado é amplamente impulsionado pela crescente demanda por produtos farmacêuticos e biofarmacêuticos, juntamente com a crescente terceirização da fabricação de API para produtores especializados, o que está impulsionando a produção em larga escala e a inovação em intermediários de API.
- Além disso, os avanços nas tecnologias de síntese química, a crescente adoção de práticas de química verde e a crescente prevalência de doenças crônicas estão acelerando a adoção de intermediários de API em várias áreas terapêuticas, impulsionando significativamente o crescimento da indústria.
Análise de Mercado de Intermediários de API
- Intermediários de API, compostos químicos especializados que atuam como blocos de construção essenciais na síntese de ingredientes farmacêuticos ativos (APIs), desempenham um papel crítico no processo de fabricação de produtos farmacêuticos. Sua importância cresceu significativamente devido à crescente demanda por medicamentos inovadores e genéricos, aliada à rápida expansão dos serviços de fabricação sob contrato em todo o mundo.
- A crescente demanda por intermediários de API está sendo impulsionada por vários fatores importantes, incluindo a crescente prevalência de doenças crônicas, como distúrbios cardiovasculares, diabetes e câncer; maiores investimentos em pesquisa e desenvolvimento farmacêutico (P&D); e uma mudança pronunciada da indústria em direção à terceirização da produção de API para regiões com boa relação custo-benefício que podem manter altos padrões de qualidade enquanto reduzem as despesas de fabricação.
- A América do Norte dominou o mercado de intermediários de IFA, respondendo pela maior fatia da receita, de 39,5% em 2024. Essa liderança é sustentada pela infraestrutura farmacêutica avançada da região, por marcos regulatórios rigorosos e bem estabelecidos e pela presença de diversos fabricantes globais líderes de IFA. Na região, os EUA se destacam como o principal contribuinte, em grande parte devido à sua produção substancial de intermediários de alto valor e especializados que atendem a áreas terapêuticas complexas e de alta demanda.
- A Ásia-Pacífico deverá emergir como a região de crescimento mais rápido no mercado de intermediários de IFA durante o período previsto. Esse rápido crescimento será impulsionado pela crescente capacidade de fabricação farmacêutica da região, por iniciativas governamentais proativas de apoio à produção nacional de IFA e por custos de produção altamente competitivos — particularmente em países como Índia e China, que são grandes polos globais de fabricação de medicamentos a granel e intermediários.
- O segmento de intermediários farmacêuticos/para medicamentos a granel dominou o mercado de intermediários de IFA, com a maior participação na receita, de 68,4% em 2024, impulsionado por sua ampla aplicação na fabricação de medicamentos em larga escala em áreas terapêuticas como oncologia, doenças cardiovasculares e infecciosas. O segmento se beneficia da forte demanda de produtores de medicamentos genéricos e de marca em todo o mundo.
Escopo do Relatório e Segmentação do Mercado de Intermediários de API
|
Atributos |
Insights importantes do mercado de intermediários da API |
|
Segmentos abrangidos |
|
|
Países abrangidos |
América do Norte
Europa
Ásia-Pacífico
Oriente Médio e África
Ámérica do Sul
|
|
Principais participantes do mercado |
|
|
Oportunidades de mercado |
|
|
Conjuntos de informações de dados de valor agregado |
Além dos insights sobre cenários de mercado, como valor de mercado, taxa de crescimento, segmentação, cobertura geográfica e principais participantes, os relatórios de mercado selecionados pela Data Bridge Market Research também incluem análises aprofundadas de especialistas, análises de preços, análises de participação de marca, pesquisas com consumidores, análises demográficas, análises da cadeia de suprimentos, análises da cadeia de valor, visão geral de matérias-primas/consumíveis, critérios de seleção de fornecedores, análise PESTLE, análise de Porter e estrutura regulatória. |
Tendências de mercado de intermediários de API
Importância crescente dos intermediários de API na fabricação farmacêutica moderna
- Uma tendência significativa e crescente no mercado global de intermediários de IFA é a crescente adoção de tecnologias avançadas de fabricação, automação e ferramentas digitais de otimização de processos. Essa integração de métodos de produção inovadores está aprimorando a eficiência, a qualidade e a escalabilidade da produção de intermediários de IFA.
- Por exemplo, os principais fabricantes farmacêuticos estão implementando técnicas de fabricação contínua para intermediários de API, permitindo qualidade consistente do produto, prazos de produção reduzidos e melhor controle sobre parâmetros críticos do processo. Da mesma forma, tecnologias avançadas de análise de processos (TAP) estão sendo utilizadas para monitorar reações em tempo real, garantindo a conformidade com rigorosos requisitos regulatórios.
- A automação e a manufatura orientada por dados permitem a manutenção preditiva de equipamentos, a otimização do uso de matéria-prima e a redução do tempo de inatividade. Por exemplo, algumas instalações agora utilizam análises baseadas em IA para prever gargalos na produção e ajustar a programação de lotes para atender às demandas urgentes de API. Além disso, esses avanços ajudam a reduzir os custos de fabricação e a aumentar a produtividade, tornando a produção mais competitiva globalmente.
- A integração dos princípios da Indústria 4.0 com a fabricação intermediária de IFAs também facilita o controle e a supervisão centralizados em múltiplos locais de produção. Por meio de uma única interface digital, os fabricantes podem acompanhar o progresso dos lotes, monitorar métricas de qualidade e garantir a transparência da cadeia de suprimentos, desde as matérias-primas até os IFAs finais.
- Essa tendência em direção a processos de fabricação mais precisos, eficientes e conectados está remodelando fundamentalmente as cadeias de suprimentos farmacêuticas. Consequentemente, grandes players como Lonza e Cambrex estão investindo pesado na expansão de instalações de produção de intermediários de alta pureza, equipadas com sistemas modernos e automatizados.
- A demanda por intermediários de API de alta qualidade produzidos usando métodos avançados de fabricação está aumentando rapidamente nos segmentos de medicamentos de marca e genéricos, à medida que as empresas farmacêuticas priorizam cada vez mais a qualidade consistente, a eficiência de custos e a conformidade regulatória.
Dinâmica de Mercado de Intermediários de API
Motorista
Importância crescente dos intermediários de API na fabricação farmacêutica moderna
- A crescente demanda por uma produção farmacêutica eficiente e de alta qualidade, aliada à necessidade de prazos mais curtos para o desenvolvimento de medicamentos, está impulsionando significativamente o crescimento do mercado de intermediários de IFA. Esses intermediários, que são matérias-primas essenciais na síntese de ingredientes farmacêuticos ativos (IFAs), desempenham um papel indispensável para garantir a eficácia, a segurança e a estabilidade das formulações finais dos medicamentos.
- Por exemplo, em abril de 2024, a Divis Laboratories Ltd. anunciou a expansão de sua capacidade de produção de intermediários de IFA na Índia, visando atender à demanda interna e aos mercados de exportação. O investimento da empresa em tecnologias avançadas de síntese química e práticas de química verde reflete uma mudança mais ampla da indústria em direção à fabricação sustentável e escalável de IFA. Espera-se que tais expansões estratégicas impulsionem o crescimento do mercado de intermediários de IFA durante o período previsto.
- À medida que o setor farmacêutico global experimenta uma demanda crescente por genéricos, biossimilares e medicamentos especializados, os intermediários de API estão se tornando essenciais para permitir uma produção econômica e rápida. Seu papel na minimização de impurezas, na melhoria do rendimento e no suporte a processos complexos de síntese os torna um pilar fundamental da fabricação farmacêutica.
- Além disso, a crescente ênfase na resiliência da cadeia de suprimentos e a redução da dependência de fornecedores de um único país estão incentivando os fabricantes a diversificar suas capacidades de produção de IFAs intermediários. Essa tendência é apoiada por incentivos governamentais em vários países para impulsionar a fabricação nacional de ingredientes farmacêuticos.
- A integração de tecnologias de fabricação contínua, os avanços na química de processos e o aumento do investimento em P&D para intermediários de alta pureza estão criando novas oportunidades no mercado. Com sua adaptabilidade em diversas áreas terapêuticas — incluindo oncologia, doenças cardiovasculares e doenças infecciosas — os intermediários de API estão testemunhando aplicações em expansão que aprimoram tanto a eficiência da fabricação quanto a qualidade do produto.
Restrição/Desafio
Preocupações com a rigorosa conformidade regulatória e os altos custos de produção
- A indústria de intermediários de IFA enfrenta desafios relacionados a requisitos regulatórios rigorosos em diferentes regiões, o que pode prolongar os prazos de aprovação de produtos e aumentar os custos operacionais. A adesão às Boas Práticas de Fabricação (BPF) e ao cumprimento dos padrões da farmacopeia exige investimentos significativos em sistemas de controle de qualidade, mão de obra qualificada e infraestrutura de conformidade.
- Por exemplo, auditorias recentes de órgãos reguladores como a FDA dos EUA e a Agência Europeia de Medicamentos (EMA) resultaram em paralisações temporárias de fábricas de alguns fabricantes que não cumpriram os padrões ambientais e de segurança. Tais incidentes destacam a necessidade de estruturas de conformidade robustas para evitar interrupções no fornecimento.
- Além disso, o custo relativamente alto de intermediários de API avançados — particularmente aqueles que exigem síntese em múltiplas etapas ou catalisadores especializados — pode ser uma barreira para empresas farmacêuticas menores ou para mercados sensíveis a custos. Fatores como a volatilidade dos preços das matérias-primas, a dependência de precursores importados e os processos de produção com alto consumo de energia contribuem ainda mais para os altos custos de fabricação.
- Embora a otimização de processos e as economias de escala estejam gradualmente reduzindo os custos, o preço premium percebido para intermediários de API de alta pureza ou de nicho ainda pode limitar a adoção generalizada, especialmente em regiões de baixa e média renda
- A superação desses desafios exigirá não apenas avanços tecnológicos na química de processos, mas também uma maior colaboração entre fabricantes, agências reguladoras e fornecedores de matéria-prima para criar um ecossistema de fornecimento mais econômico e compatível para intermediários de API.
Escopo de mercado de intermediários de API
O mercado é segmentado com base no tipo, produto, tipo terapêutico, clientes, usuário final e canal de distribuição.
- Por tipo
Com base no tipo, o mercado de intermediários de IFA é segmentado em intermediários para medicamentos veterinários e intermediários para medicamentos farmacêuticos/a granel. O segmento de intermediários para medicamentos farmacêuticos/a granel dominou o mercado, com a maior participação na receita, de 68,4% em 2024, impulsionado por sua ampla aplicação na fabricação de medicamentos em larga escala em áreas terapêuticas como oncologia, doenças cardiovasculares e infecciosas. O segmento se beneficia da forte demanda de produtores de medicamentos genéricos e de marca em todo o mundo.
O segmento de intermediários para medicamentos veterinários deverá apresentar o CAGR mais rápido, de 9,7%, entre 2025 e 2032, impulsionado pelo foco crescente em saúde animal, pela expansão da indústria pecuária e pelo aumento das aprovações globais de medicamentos veterinários. A crescente conscientização sobre saúde animal, cuidados preventivos e incentivos regulatórios para o manejo pecuário estão impulsionando ainda mais a demanda por intermediários de API específicos para uso veterinário.
- Por produto
Com base no produto, o mercado de intermediários de IFA é segmentado em composto de bromo, O-benzil salbutamol, hemissulfato, oxirano, base de bisoprolol, PCBHP quiral, base de feniramina, base de clorfeniramina, base de bromfeniramina, base de mepiramina/pirilamina, 6-amino-1,3-dimetil uracila, teofilina, acefilina, xantina, nitrilas e outros. O segmento de composto de bromo representou a maior participação de mercado, de 21,3% em 2024, devido à sua ampla aplicação na produção de ingredientes farmacêuticos ativos para medicamentos cardiovasculares, respiratórios e oncológicos.
Prevê-se que o segmento de PCBHP quiral registre o CAGR mais rápido, de 10,8%, entre 2025 e 2032, impulsionado pela crescente demanda por síntese quiral em medicamentos terapêuticos de alto valor, onde alcançar a enantiopureza precisa é essencial para maximizar a eficácia do medicamento e minimizar os efeitos adversos. Esse crescimento é ainda sustentado pela crescente adoção de técnicas avançadas de síntese assimétrica, pela expansão de produtos biológicos e farmacêuticos especializados e pela crescente ênfase na conformidade regulatória para compostos enantiomericamente puros.
- Por tipo terapêutico
Com base no tipo terapêutico, o mercado de intermediários de IFA é segmentado em doenças autoimunes, oncologia, doenças metabólicas, oftalmologia, doenças cardiovasculares, doenças infecciosas, neurologia, doenças respiratórias, dermatologia, urologia e outras. O segmento de oncologia liderou o mercado em 2024, com uma participação de receita de 27,9%, devido à crescente prevalência de câncer, ao aumento das aprovações de terapias direcionadas e à demanda por intermediários de alta pureza para formulações complexas.
Espera-se que o segmento de doenças autoimunes cresça a uma taxa composta de crescimento anual (CAGR) de 11,2% entre 2025 e 2032, impulsionado pela crescente prevalência global de doenças autoimunes, o que aumentou a demanda por soluções terapêuticas direcionadas. Esse crescimento é ainda sustentado por um robusto pipeline de P&D focado no desenvolvimento de produtos biológicos inovadores e medicamentos de pequenas moléculas projetados para modular as respostas imunológicas de forma eficaz.
- Por clientes
Com base nos clientes, o mercado de intermediários de IFA é segmentado em usuários diretos/empresas farmacêuticas, comerciantes/atacadistas/distribuidores e associações/instituições governamentais e privadas. O segmento de usuários diretos/empresas farmacêuticas dominou em 2024, com 62,1% de participação de mercado, visto que os fabricantes farmacêuticos preferem a aquisição direta para garantir o controle de qualidade, a rastreabilidade e a conformidade com os padrões regulatórios.
O segmento de comerciantes/atacadistas/distribuidores deverá crescer a uma taxa composta de crescimento anual (CAGR) de 8,9% entre 2025 e 2032, impulsionado pela crescente presença de fornecedores regionais que atendem com eficiência às necessidades de fabricantes de medicamentos de pequeno e médio porte. Esses intermediários desempenham um papel crucial para garantir a disponibilidade oportuna de intermediários de IFA, aumentando a flexibilidade da cadeia de suprimentos e apoiando o crescimento de novos players farmacêuticos.
- Por usuário final
Com base no usuário final, o mercado de intermediários de IFA é segmentado em fabricantes de IFA e fabricantes de produtos acabados. Os fabricantes de IFA representaram a maior fatia da receita de mercado, com 54,7% em 2024, impulsionada principalmente pela tendência crescente de terceirização da produção de intermediários para instalações especializadas. Essas instalações oferecem soluções econômicas, escaláveis e de alta qualidade, permitindo que os fabricantes de IFA se concentrem na produção principal, garantindo a conformidade com os rigorosos padrões regulatórios.
Espera-se que os fabricantes de produtos acabados registrem o CAGR mais rápido, de 9,4%, entre 2025 e 2032, apoiados pela integração estratégica da produção intermediária nas cadeias verticais de fabricação. Essa integração permite um controle de qualidade aprimorado, maior eficiência operacional e um tempo de lançamento mais rápido para os produtos farmacêuticos finais, atendendo à crescente demanda global por medicamentos de alta qualidade.
- Por canal de distribuição
Com base no canal de distribuição, o mercado de intermediários de IFA é segmentado em licitação direta, vendas no varejo e outros. O segmento de licitação direta deteve a maior participação, 48,6%, em 2024, em grande parte atribuída às práticas de aquisição em massa por grandes empresas farmacêuticas e agências governamentais. Essas entidades frequentemente exigem intermediários de alto volume para a produção de medicamentos em larga escala, tornando a licitação direta o método de aquisição mais eficiente e econômico.
A previsão é de que as vendas no varejo cresçam a uma CAGR de 8,7%, a mais rápida, entre 2025 e 2032, impulsionadas pela crescente demanda de fabricantes de pequena escala e organizações de pesquisa contratadas. Esses compradores normalmente precisam de intermediários em quantidades menores, e os canais de varejo oferecem a flexibilidade, a acessibilidade e a conveniência necessárias para atender às suas necessidades de produção com eficiência.
Análise regional do mercado de intermediários de API
- A América do Norte dominou o mercado de intermediários de API com a maior participação na receita de 39,5% em 2024, impulsionada principalmente pela crescente demanda por produtos farmacêuticos inovadores e genéricos, bem como pela ênfase da região em capacidades avançadas de fabricação.
- O mercado se beneficia de uma forte supervisão regulatória, de extensas iniciativas de pesquisa e desenvolvimento e da presença de diversos fabricantes líderes globais de intermediários de API. Além disso, colaborações estratégicas entre empresas de biotecnologia e organizações de fabricação sob contrato (CMOs) estão fortalecendo a posição competitiva da América do Norte, permitindo a produção de intermediários especiais e de alta pureza, essenciais para o desenvolvimento de medicamentos modernos.
- O crescimento é ainda apoiado por elevados gastos com saúde, um setor farmacêutico bem estabelecido e um forte pipeline de medicamentos especializados, incluindo moléculas complexas e de alta potência, que requerem intermediários altamente purificados para garantir a eficácia terapêutica.
Visão do mercado de intermediários da API dos EUA
O mercado de intermediários de IFA dos EUA capturou a maior fatia da receita, de 82%, em 2024, na América do Norte, refletindo a liderança do país em inovação farmacêutica e síntese química avançada. O mercado americano é impulsionado pela rápida adoção de tecnologias de fabricação contínua, pelo aumento da terceirização para CMOs nacionais por empresas farmacêuticas globais e pela crescente produção de intermediários complexos e de alto valor. Além disso, a robusta estrutura de propriedade intelectual e a rigorosa supervisão regulatória da FDA garantem altos padrões de qualidade, reforçando a posição de destaque dos EUA nas cadeias globais de suprimentos de intermediários de IFA.
Visão do mercado de intermediários de API da Europa
O mercado europeu de intermediários de IFA deverá crescer a uma CAGR substancial durante o período previsto, impulsionado por regulamentações farmacêuticas rigorosas e um foco crescente em práticas de fabricação sustentáveis. O mercado regional também está se beneficiando do aumento do investimento na produção nacional de IFA, visando reduzir a dependência de importações e aumentar a resiliência da cadeia de suprimentos. Além disso, a crescente demanda por medicamentos especializados, particularmente em oncologia e tratamento de doenças raras, está criando oportunidades de crescimento significativas. Iniciativas apoiadas pela UE que apoiam a inovação na produção de intermediários estão fortalecendo ainda mais o mercado.
Visão geral do mercado de intermediários de API do Reino Unido
O mercado de intermediários de API do Reino Unido deverá crescer a um CAGR expressivo durante o período previsto, impulsionado pela expansão da capacidade de fabricação de biofármacos e tecnologias avançadas de síntese. O mercado é ainda impulsionado por um forte ecossistema de pesquisa e desenvolvimento, que promove a inovação na produção de intermediários complexos. Espera-se que o apoio governamental às ciências da vida e os esforços para aumentar a produção nacional de ingredientes farmacêuticos essenciais estimulem ainda mais o crescimento.
Visão do mercado de intermediários de API da Alemanha
Espera-se que o mercado alemão de intermediários de API registre um CAGR considerável durante o período previsto, impulsionado pela avançada infraestrutura de fabricação química do país e pelo foco em processos de produção sustentáveis e de alta qualidade. O setor farmacêutico alemão é caracterizado por fortes exportações e uma demanda significativa por intermediários especiais, especialmente para medicamentos cardiovasculares, oncológicos e para o sistema nervoso central. Esforços colaborativos entre empresas farmacêuticas, CMOs e instituições acadêmicas também estão fomentando a inovação na síntese de intermediários, impulsionando ainda mais a expansão do mercado.
Visão do mercado de intermediários de API da Ásia-Pacífico
O mercado de intermediários de API da Ásia-Pacífico deverá crescer a uma taxa composta de crescimento anual (CAGR) de 24% entre 2025 e 2032, impulsionado pela rápida expansão da capacidade de fabricação farmacêutica, vantagens de custo e forte apoio governamental ao setor. Países como China e Índia estão emergindo como líderes globais na produção de intermediários a granel e especiais devido à capacidade de fabricação em larga escala, talentos qualificados em engenharia química e custos competitivos. O aumento das exportações para mercados regulamentados e o aumento do consumo interno de produtos farmacêuticos de alta qualidade estão impulsionando ainda mais o crescimento do mercado.
Visão geral do mercado de intermediários da API Ja pan
O mercado japonês de intermediários de API está ganhando força devido ao foco do país em ingredientes farmacêuticos especiais de alta pureza e a um ambiente regulatório rigoroso. O setor farmacêutico japonês, impulsionado pela inovação, juntamente com os avanços na química de processos, está gerando uma demanda crescente por intermediários complexos. Além disso, o envelhecimento da população está impulsionando a maior produção de medicamentos voltados para doenças crônicas, o que, por sua vez, estimula a demanda pela fabricação de intermediários avançados.
Visão do mercado de intermediários de API da China
O mercado chinês de intermediários de IFA foi responsável pela maior fatia da receita na região Ásia-Pacífico em 2024, apoiado por ampla capacidade de fabricação, rápida modernização industrial e fortes iniciativas governamentais para desenvolver o setor farmacêutico. A China emergiu como um grande exportador global de intermediários de IFA, alavancando custos de produção competitivos, um amplo espectro de capacidades de síntese química e crescentes investimentos em processos de produção ecologicamente corretos. O papel crescente do país no fornecimento de intermediários de alto valor para mercados regulamentados fortalece ainda mais sua posição como um player crítico na indústria global de intermediários de IFA.
Participação de mercado de intermediários de API
O setor de intermediários de API é liderado principalmente por empresas bem estabelecidas, incluindo:
- HIKAL Ltd. (Índia)
- Cambrex Corporation (EUA)
- Ganesh-Group (Índia)
- AlzChem Group AG (Alemanha)
- Vasudha Pharma (Índia)
- Sandoo Produtos Farmacêuticos e Químicos Co., Ltd (China)
- Atul Ltd (Índia)
- Grupo Aceto (EUA)
- Supriya Lifescience Ltd. (Índia)
- LEVACHEM COMPANY LIMITED (China)
- Aurorium (EUA)
- Dishman Carbogen Amcis Ltd (Índia)
- Divi's Laboratories Limited (Índia)
- Aarti Industries Ltd. (Índia)
- Aurobindo Pharma Limited (Índia)
- BASF (Alemanha)
Últimos desenvolvimentos no mercado global de intermediários de API
- Em junho de 2025, o The Economic Times relatou uma queda significativa nos preços de ingredientes farmacêuticos ativos (IFAs) na Índia. Essa queda proporcionou um alívio muito necessário à indústria farmacêutica do país, reduzindo os custos de produção das farmacêuticas, que têm enfrentado a pressão dos altos preços das matérias-primas nos últimos anos. Espera-se que a queda nos preços dos IFAs aumente a lucratividade e estabilize a cadeia de suprimentos do setor, que é um componente crucial da economia de saúde e exportação da Índia.
SKU-
Obtenha acesso online ao relatório sobre a primeira nuvem de inteligência de mercado do mundo
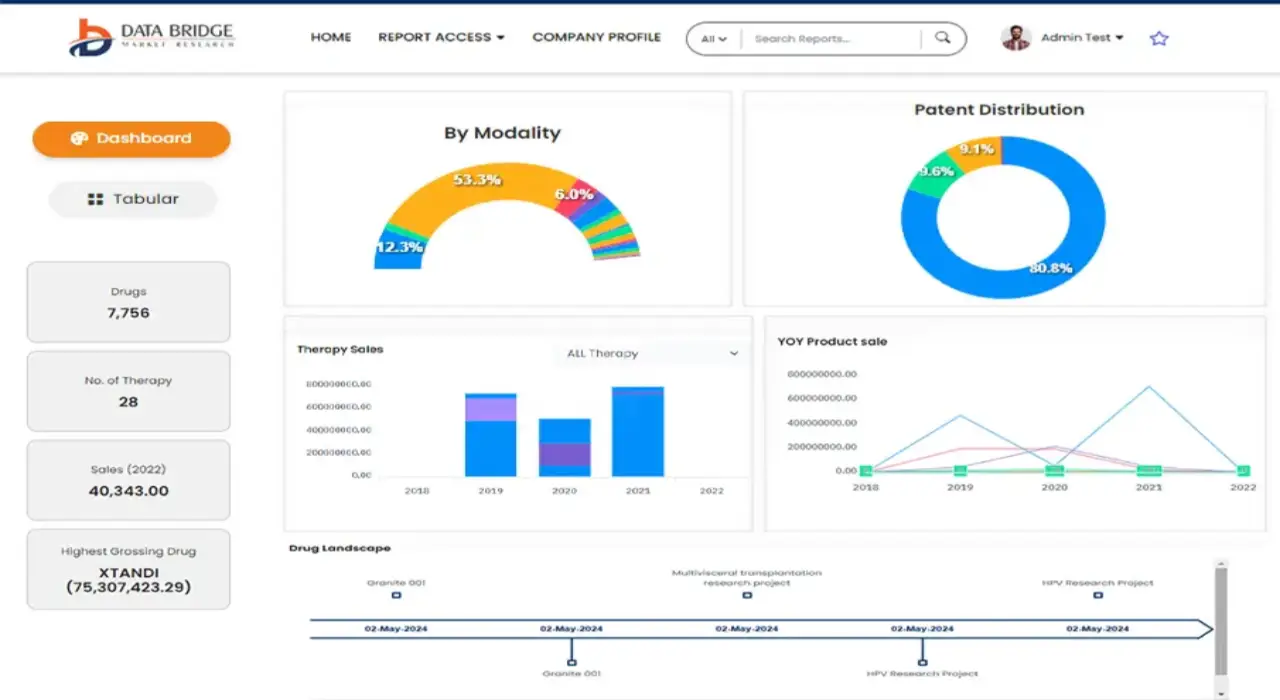
- Painel interativo de análise de dados
- Painel de análise da empresa para oportunidades de elevado potencial de crescimento
- Acesso de analista de pesquisa para personalização e customização. consultas
- Análise da concorrência com painel interativo
- Últimas notícias, atualizações e atualizações Análise de tendências
- Aproveite o poder da análise de benchmark para um rastreio abrangente da concorrência
Metodologia de Investigação
A recolha de dados e a análise do ano base são feitas através de módulos de recolha de dados com amostras grandes. A etapa inclui a obtenção de informações de mercado ou dados relacionados através de diversas fontes e estratégias. Inclui examinar e planear antecipadamente todos os dados adquiridos no passado. Da mesma forma, envolve o exame de inconsistências de informação observadas em diferentes fontes de informação. Os dados de mercado são analisados e estimados utilizando modelos estatísticos e coerentes de mercado. Além disso, a análise da quota de mercado e a análise das principais tendências são os principais fatores de sucesso no relatório de mercado. Para saber mais, solicite uma chamada de analista ou abra a sua consulta.
A principal metodologia de investigação utilizada pela equipa de investigação do DBMR é a triangulação de dados que envolve a mineração de dados, a análise do impacto das variáveis de dados no mercado e a validação primária (especialista do setor). Os modelos de dados incluem grelha de posicionamento de fornecedores, análise da linha de tempo do mercado, visão geral e guia de mercado, grelha de posicionamento da empresa, análise de patentes, análise de preços, análise da quota de mercado da empresa, normas de medição, análise global versus regional e de participação dos fornecedores. Para saber mais sobre a metodologia de investigação, faça uma consulta para falar com os nossos especialistas do setor.
Personalização disponível
A Data Bridge Market Research é líder em investigação formativa avançada. Orgulhamo-nos de servir os nossos clientes novos e existentes com dados e análises que correspondem e atendem aos seus objetivos. O relatório pode ser personalizado para incluir análise de tendências de preços de marcas-alvo, compreensão do mercado para países adicionais (solicite a lista de países), dados de resultados de ensaios clínicos, revisão de literatura, mercado remodelado e análise de base de produtos . A análise de mercado dos concorrentes-alvo pode ser analisada desde análises baseadas em tecnologia até estratégias de carteira de mercado. Podemos adicionar quantos concorrentes necessitar de dados no formato e estilo de dados que procura. A nossa equipa de analistas também pode fornecer dados em tabelas dinâmicas de ficheiros Excel em bruto (livro de factos) ou pode ajudá-lo a criar apresentações a partir dos conjuntos de dados disponíveis no relatório.