Mercado europeu de deteção de fugas, por tipo (upstream, midstream e downstream), tipo de produto (detetores de gás portáteis, detetores baseados em UAV, detetores de aeronaves tripuladas e detetores baseados em veículos), tecnologia (acústico/ultrassom, métodos de desvio de fluxo de pressão, estendido Modelo Transiente em Tempo Real (E-RTTM), Imagem Térmica , Balanço Massa/Volume, Detecção de Vapor, Absorção de Laser e Lidar, Detecção de Vazamento Hidráulico, Válvulas de Pressão Negativa e Outros), Utilizador Final (Petróleo e Gás, Central Química, Tratamento de Água Central, Central Térmica, Mineração e Chorume e Outros), País (Alemanha, França, Reino Unido, Itália, Espanha, Rússia, Turquia, Bélgica, Holanda, Suíça, Resto da Europa ) Tendências da Indústria e Previsão para 2028
Análise e insights de mercado : Mercado europeu de deteção de fugas
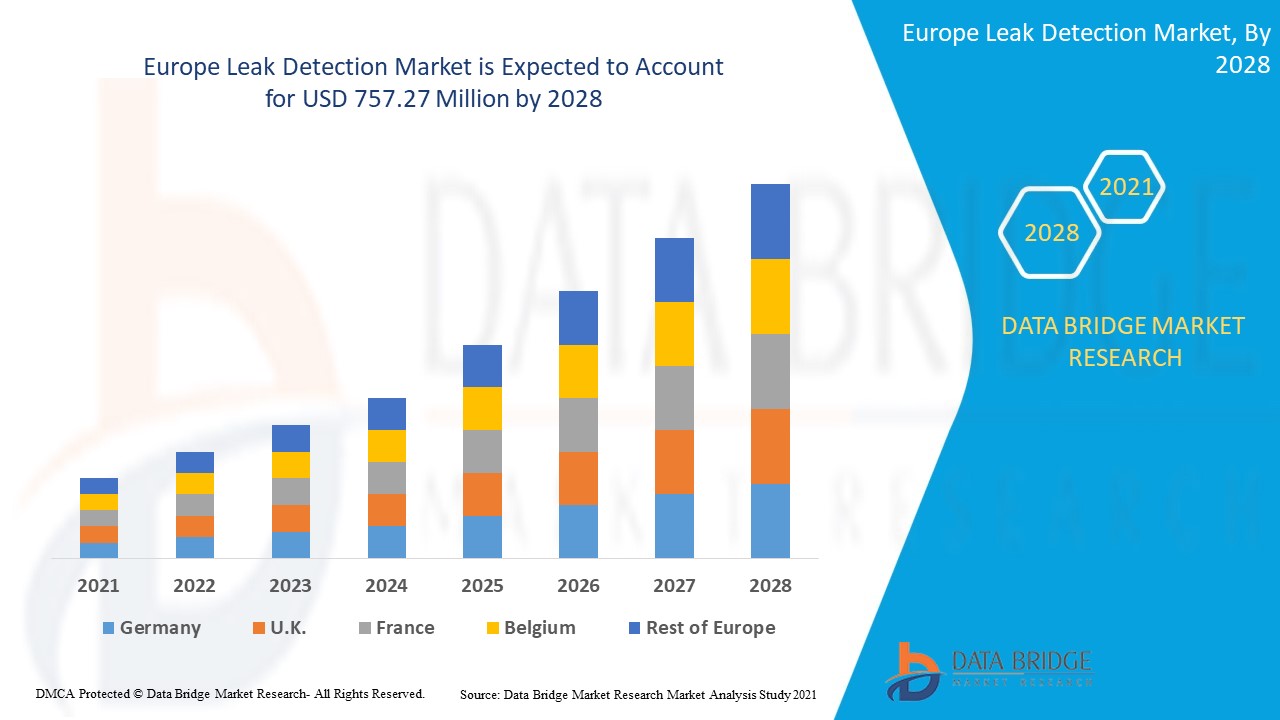
Espera-se que o mercado europeu de deteção de fugas ganhe crescimento de mercado no período de previsão de 2021 a 2028. A Data Bridge Market Research analisa que o mercado está a crescer com o CAGR de 7,4% no período de previsão de 2021 a 2028 e prevê-se que atinja os 757,27 milhões de dólares até 2028. O aumento do crescimento da infraestrutura de oleodutos e gasodutos e das instalações de armazenamento são os fatores proeminentes que impulsionam o crescimento do mercado.
O termo fuga ou vazamento significa uma fissura, buraco ou porosidade não intencional numa parede envolvente ou junta de tubos, baterias, produtos selados, câmaras ou recipientes de armazenamento que devem conter/transferir diferentes fluidos e gases. Estas fissuras ou furos permitem o escape de fluidos e gases do meio fechado. As fugas devem ser identificadas o mais cedo possível para reduzir as perdas e danos para o ambiente, para o qual são utilizados diversos sensores e instrumentos de deteção de fugas. A principal função do sistema de deteção de fugas é a localização e medição do tamanho das fugas em produtos selados.
O elevado número de incidentes de fugas em condutas e a crescente integração de tecnologia avançada em detetores de fugas estão a aumentar o mercado de deteção de fugas. Por exemplo, em janeiro de 2020, a FLIR Systems Inc. lançou a FLIR GF77a, a sua primeira câmara térmica conectada, não arrefecida e de montagem fixa, para deteção de metano e outros gases industriais. Com este novo lançamento da série de produtos de imagem ótica a gás (OGI), a empresa alargou o seu portefólio de produtos e aumentará a sua base de clientes.
Este relatório de mercado de deteção de fugas fornece detalhes de quota de mercado, novos desenvolvimentos e análise de pipeline de produtos, impacto dos participantes do mercado doméstico e localizado, analisa as oportunidades em termos de bolsas de receitas emergentes, alterações nas regulamentações de mercado, aprovações de produtos, decisões estratégicas, lançamentos de produtos, expansões geográficas e inovações tecnológicas no mercado. Para compreender a análise e o cenário do mercado contacte-nos para um Analyst Brief, a nossa equipa irá ajudá-lo a criar uma solução de impacto na receita para atingir o objetivo desejado.
Âmbito do mercado de deteção de fugas na Europa e tamanho do mercado
Leak detection market is segmented on the basis of type, product type, technology and end user. The growth among segments helps you analyse niche pockets of growth and strategies to approach the market and determine your core application areas and the difference in your target markets.
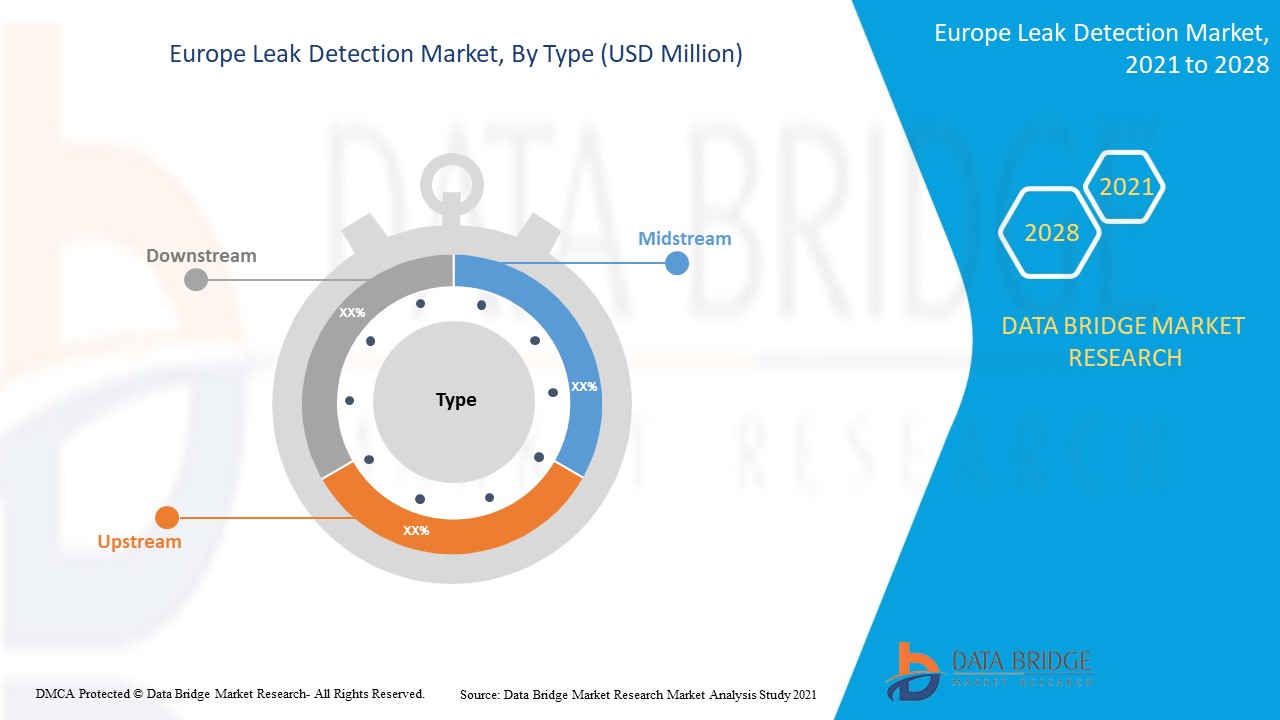
- On the basis of type, the leak detection market is segmented into upstream, midstream and downstream. In 2021, the midstream segment accounted largest market share as midstream segment basically deals with the transportation of crude oil and natural gas through various modes of transportation such as pipeline. These pipelines are needed to be protected against leakages to avoid leak incidents and cause loss of life and property. Thus, the midstream is dominating the type segment.
- On the basis of product type, the leak detection market is segmented into handheld gas detectors, UAV-based detectors, manned aircraft detectors and vehicle-based detectors. In 2021, vehicle-based detectors accounted largest market share as it can be easily mounted on a vehicle and be used for monitoring the pipelines through the moving vehicle. This is the most economical and fast way of detecting leaking and is therefore dominating the product type segment.
- On the basis of technology, the leak detection market is segmented into acoustic / ultrasound, fiber optic, pressure-flow deviation methods, extended real-time transient model (E-RTTM), thermal imaging, mass/volume balance, vapor sensing, laser absorption and LIDAR, hydraulic leak detection, negative pressure waves and others. In 2021, acoustic / ultrasound accounted largest market share as it offers faster detection of leakage and is low cost solution, moreover, it provides early detection and the loss can be prevented at an early stage, these factors lead to highest growth of acoustic/ultrasound in technology segment.
- On the basis of end user, the leak detection market is segmented into oil and gas, chemical plant, water treatment plants, thermal power plant, mining and slurry and others. In 2021, oil and gas accounted largest market share as this industry is a major user of leak detection system in order to prevent leakage of crude oil and gas and methane emission. The leakage can lead to severe loss of life and property. Moreover, several government regulations to prevent leak incidents have increased the demand of leak detection in oil and gas industry.
Europe Leak Detection Market Country Level Analysis
Leak detection market is analysed and market size information is provided by country, type, product type, technology and end user.
The countries covered in Europe leak detection market report are Germany, U.K., France, Switzerland, Italy, Spain, Netherlands, Russia, Belgium, Turkey and Rest of Europe.
Russia accounted largest market share owing to large number of oil and gas production and transferring pipeline projects in the region.
The country section of the report also provides individual market impacting factors and changes in regulation in the market domestically that impacts the current and future trends of the market. Data points such as new sales, replacement sales, country demographics, regulatory acts and import-export tariffs are some of the major pointers used to forecast the market scenario for individual countries. Also, presence and availability of Europe brands and their challenges faced due to large or scarce competition from local and domestic brands, impact of sales channels are considered while providing forecast analysis of the country data.
High Number of Pipeline Leakages Incidents
Leak detection market also provides you with detailed market analysis for every country growth in industry with sales, components sales, impact of technological development in leak detection and changes in regulatory scenarios with their support for the leak detection market. The data is available for historic period 2011 to 2019.
Competitive Landscape and Leak Detection Market Share Analysis
Leak detection market competitive landscape provides details by competitor. Details included are company overview, company financials, revenue generated, market potential, investment in research and development, new market initiatives, Europe presence, production sites and facilities, company strengths and weaknesses, product launch, product trials pipelines, product approvals, patents, product width and breadth, application dominance, technology lifeline curve. The above data points provided are only related to the companies’ focus related to leak detection market.
The major players covered in the report are FLIR SYSTEMS, Inc., ABB, Honeywell International Inc., Siemens Energy, Pentair, ClampOn AS, Schneider Electric, Atmos International, Xylem, Emerson Electric Co., KROHNE Messtechnik GmbH, PERMA-PIPE International Holdings, Inc., TTK, PSI Software AG, MSA, HIMA, AVEVA Group plc, Yokogawa Electric Corporation, INFICON, Fotech Group Ltd., Asel-Tech Inc., MAGNUM Pirex AG / MAGNUM LEO-Pipe GmbH and OptaSense Ltd. among others. DBMR analysts understand competitive strengths and provide competitive analysis for each competitor separately.
Many product developments are also initiated by the companies worldwide which are also accelerating the growth of leak detection market.
For instance,
- In October 2020, ABB has launched the new ABB MicroGuard, a first comprehensive gas leak detection system solution for utility industry to help safeguard city populations. The MicroGuard will work alongside ABB’s MobileGuard to pinpoint dangerous gas leaks faster and in easier way. Through this new product launch the company has expanded their product line.
- Em dezembro de 2019, a Honeywell International Inc. anunciou que adquiriu a Rebellion Photonics, fornecedora de soluções inovadoras, inteligentes e visuais de monitorização de gases que ajudam a maximizar a segurança, o desempenho operacional e a mitigação de emissões nas indústrias de petróleo e gás , petroquímica e energia. Esta aquisição ajudará a empresa a expandir o seu portfólio de produtos.
A expansão da produção, o desenvolvimento de novos produtos e outras estratégias aumentam a quota de mercado da empresa com maior cobertura e presença. Também oferece o benefício para a organização melhorar a sua oferta de deteção de fugas.
SKU-
Obtenha acesso online ao relatório sobre a primeira nuvem de inteligência de mercado do mundo
- Painel interativo de análise de dados
- Painel de análise da empresa para oportunidades de elevado potencial de crescimento
- Acesso de analista de pesquisa para personalização e customização. consultas
- Análise da concorrência com painel interativo
- Últimas notícias, atualizações e atualizações Análise de tendências
- Aproveite o poder da análise de benchmark para um rastreio abrangente da concorrência
Índice
- introduction
- OBJECTIVES OF THE STUDY
- MARKET DEFINITION
- OVERVIEW of EUROPE LEAK DETECTION MARKET
- LIMITATIONs
- MARKETS COVERED
- MARKET SEGMENTATION
- MARKETS COVERED
- geographical scope
- years considered for the study
- currency and pricing
- DBMR TRIPOD DATA VALIDATION MODEL
- primary interviews with key opinion leaders
- DBMR MARKET POSITION GRID
- vendor share analysis
- MULTIVARIATE MODELLING
- type LIFELINE CURVE
- secondary sourcEs
- assumptions
- EXECUTIVE SUMMARY
- premium insights
- Oil and gas Projects incorporating Leak detection products
- Upcoming Leak detection Tenders for Various End-Users
- market overview
- drivers
- Increasing growth in oil and gas pipeline and storage plant infrastructure
- High number of pipeline leakages incidents
- Rising Government initiatives to prevent methane leak detection
- Aging water infrastructure in developed countries
- Increasing need of leak detectors in chemical plants
- RESTRAINT
- technical complications with leak detectors
- OPPoRTUNITies
- Rising oil and gas production Europely
- Increasing Europe oil and natural gas consumption
- Increasing integration of advanced technology in leak detectors
- increasing GROWTH IN INVESTMENTS AND EXPANSIONS MADE BY the MARKET PLAYERS
- Emergence of new product developments
- CHALLENGES
- challenge associated with large diameter pipelines for effective leak detection
- rising focus on the development of renewable energy generation
- Europe economic crisis
- Impact of Covid-19 on Europe Leak Detection Market
- ANALYSIS ON IMPACT OF COVID-19 ON THE MARKET
- AFTERMATH OF COVID-19 AND GOVERNMENT INITIATIVE TO BOOST THE MARKET
- STRATEGIC DECISIONS FOR MANUFACTURERS AFTER COVID-19 TO GAIN COMPETITIVE MARKET SHARE
- IMPACT ON DEMAND
- IMPACT ON SUPPLY CHAIN
- CONCLUSION
- Europe leak detection MARKET, BY type
- overview
- Midstream
- Downstream
- upstream
- Europe leak detection MARKET, BY product type
- overview
- Vehicle-Based Detectors
- UAV-Based Detectors
- Handheld Gas Detectors
- Manned Aircraft Detectors
- others
- Europe leak detection MARKET, BY technology
- overview
- Acoustic/Ultrasound
- Extended Real-Time Transient Model (E-RTTM)
- Negative Pressure Waves
- Thermal Imaging
- Fiber Optic
- Laser Absorption and LIDAR
- Pressure-Flow Deviation Method
- Mass/Volume Balance
- Vapor Sensing
- Hydraulic Leak Detection
- others
- Europe leak detection MARKET, BY end-user
- overview
- Oil and Gas
- By loCation
- onshore
- Offshore
- By Medium
- Oil and Condensate
- Natural Gas
- By Technology
- Acoustic/Ultrasound
- Negative Pressure Waves
- Extended Real-Time Transient Model (E-RTTM)
- Thermal Imaging
- Laser Absorption and LIDAR
- Hydraulic Leak Detection
- Fiber Optic
- Pressure-Flow Deviation Method
- Mass/Volume Balance
- Vapor Sensing
- Others
- chemical plant
- By technology
- Acoustic/Ultrasound
- Thermal Imaging
- Pressure-Flow Deviation Method
- Extended Real-Time Transient Model (E-RTTM)
- Fiber Optic
- Mass/Volume Balance
- Vapor Sensing
- Laser Absorption and LIDAR
- Hydraulic Leak Detection
- Negative Pressure Waves
- Others
- water treatment Plant
- By technology
- Acoustic/Ultrasound
- Pressure-Flow Deviation Method
- Extended Real-Time Transient Model (E-RTTM)
- Vapor Sensing
- Negative Pressure Waves
- Mass/Volume Balance
- Thermal Imaging
- Laser Absorption and LIDAR
- Hydraulic Leak Detection
- Fiber Optic
- Others
- THERMAL POWER PLANT
- By technology
- Acoustic/Ultrasound
- Pressure-Flow Deviation Method
- Extended Real-Time Transient Model (E-RTTM)
- Vapor Sensing
- Negative Pressure Waves
- Mass/Volume Balance
- Thermal Imaging
- Laser Absorption and LIDAR
- Hydraulic Leak Detection
- Fiber Optic
- Others
- Mining and Slurry
- By technology
- Acoustic/Ultrasound
- Fiber Optic
- Pressure-Flow Deviation Method
- Extended Real-Time Transient Model (E-RTTM)
- Thermal Imaging
- Mass/Volume Balance
- Vapor Sensing
- Laser Absorption and LIDAR
- Hydraulic Leak Detection
- Negative Pressure Waves
- Others
- others
- EUROPE Leak detection market, by geography
- Europe
- Russia
- U.K.
- Italy
- Turkey
- Germany
- Netherlands
- Spain
- france
- belgium
- switzerland
- Rest of Europe
- Europe leak detection Market: COMPANY landscape
- Company share analysis: Europe
- swot
- company profiles
- flir systems, inc.
- COMPANY snapshot
- Revenue Analysis
- company share analysis
- product PORTFOLIO
- recent DEVELOPMENTS
- honeywell international inc.
- COMPANY snapshot
- revenue analysis
- company share analysis
- PRODUCT PORTFOLIO
- recent DEVELOPMENTS
- siemens energy
- COMPANY snapshot
- revenue analysis
- company share analysis
- PRODUCT PORTFOLIO
- recent DEVELOPMENT
- schneider electric
- COMPANY snapshot
- revenue analysis
- company share analysis
- PRODUCT PORTFOLIO
- recent DEVELOPMENTS
- inficon
- COMPANY snapshot
- Revenue analysis
- company share analysis
- PRODUCT PORTFOLIO
- recent DEVELOPMENTS
- ABB
- COMPANY snapshot
- Revenue Analysis
- company share analysis
- product PORTFOLIO
- recent DEVELOPMENTs
- asel-tech inc.
- COMPANY snapshot
- PRODUCT PORTFOLIO
- recent DEVELOPMENT
- atmos international
- COMPANY snapshot
- PRODUCT PORTFOLIO
- recent DEVELOPMENT
- aveva group plc
- COMPANY snapshot
- Revenue Analysis
- product PORTFOLIO
- recent DEVELOPMENT
- clampon as
- COMPANY snapshot
- PRODUCT PORTFOLIO
- recent DEVELOPMENT
- emerson electric co.
- COMPANY snapshot
- Revenue Analysis
- company share analysis
- product PORTFOLIO
- recent DEVELOPMENTS
- fotech group ltd.
- COMPANY snapshot
- PRODUCT PORTFOLIO
- recent DEVELOPMENT
- hawk measurement systems
- COMPANY snapshot
- PRODUCT PORTFOLIO
- recent DEVELOPMENTS
- hima
- COMPANY snapshot
- PRODUCT PORTFOLIO
- recent DEVELOPMENTS
- krohne messtechnik gmbh
- COMPANY snapshot
- PRODUCT PORTFOLIO
- recent DEVELOPMENTS
- magnum pirex ag / magnum leo-pipe gmbh
- COMPANY snapshot
- PRODUCT PORTFOLIO
- recent DEVELOPMENT
- msa
- COMPANY snapshot
- revenue analysis
- PRODUCT PORTFOLIO
- recent DEVELOPMENTS
- optasense ltd
- COMPANY snapshot
- PRODUCT PORTFOLIO
- recent DEVELOPMENTS
- pentair
- COMPANY snapshot
- revenue analysis
- PRODUCT PORTFOLIO
- recent DEVELOPMENT
- perma-pipe international holdings, inc.
- COMPANY snapshot
- revenue analysis
- PRODUCT PORTFOLIO
- recent DEVELOPMENTS
- psi software ag
- COMPANY snapshot
- revenue analysis
- PRODUCT PORTFOLIO
- recent DEVELOPMENT
- ttk - Leak Detection System
- COMPANY snapshot
- PRODUCT PORTFOLIO
- recent DEVELOPMENTS
- xylem
- COMPANY snapshot
- Revenue Analysis
- brand PORTFOLIO
- recent DEVELOPMENTS
- yokogawa electric corporation
- COMPANY snapshot
- Revenue Analysis
- Product PORTFOLIO
- recent developments
- questionnaire
- related reports
Lista de Tabela
TABLE 1 SUMMARY OF PIPELINE INCIDENTS FROM JANUARY 2010 TO DECEMBER 2019
TABLE 2 THE 10 LARGEST OIL PRODUCERS AND SHARE OF TOTAL WORLD OIL PRODUCTION IN 2019
TABLE 3 THE 10 LARGEST OIL CONSUMERS AND SHARE OF TOTAL WORLD OIL CONSUMPTION IN 2018
TABLE 4 Europe Leak Detection Market, By Type, 2019-2028 (USD Million)
TABLE 5 Europe Midstream in Leak Detection Market, By Region,2019-2028, (USD Million)
TABLE 6 Europe Downstream in Leak Detection Market, By Region,2019-2028, (USD Million)
TABLE 7 Europe Upstream in Leak Detection Market, By Region,2019-2028, (USD Million)
TABLE 8 Europe LEAK Detection Market, By Product Type, 2019-2028 (USD Million)
TABLE 9 Europe Vehicle Based-Detectors in Leak Detection Market, By Region,2019-2028, (USD Million)
TABLE 10 Europe UAV-Based Detectors in Leak Detection Market, By Region,2019-2028, (USD Million)
TABLE 11 Europe Handheld Gas Detectors in Leak Detection Market, By Region,2019-2028, (USD Million)
TABLE 12 Europe Manned Aircraft Detectors in Leak Detection Market, By Region,2019-2028, (USD Million)
TABLE 13 Europe Others in Leak Detection Market, By Region,2019-2028, (USD Million)
TABLE 14 Europe LEAK Detection Market, By Technology, 2019-2028 (USD Million)
TABLE 15 Europe Acoustic/Ultrasound in Leak Detection Market, By Region,2019-2028, (USD Million)
TABLE 16 Europe Extended Real-Time Transient Model (E-RTTM) in Leak Detection Market, By Region,2019-2028, (USD Million)
TABLE 17 Europe Negative Pressure Waves in Leak Detection Market, By Region,2019-2028, (USD Million)
TABLE 18 Europe Thermal Imaging in Leak Detection Market, By Region,2019-2028, (USD Million)
TABLE 19 Europe Fibre Optic in Leak Detection Market, By Region,2019-2028, (USD Million)
TABLE 20 Europe Laser Absorption and LIDAR in Leak Detection Market, By Region,2019-2028, (USD Million)
TABLE 21 Europe Pressure-Flow Deviation Method in Leak Detection Market, By Region,2019-2028, (USD Million)
TABLE 22 Europe Mass/Volume Balance in Leak Detection Market, By Region,2019-2028, (USD Million)
TABLE 23 Europe Vapor Sensing in Leak Detection Market, By Region,2019-2028, (USD Million)
TABLE 24 Europe Hydraulic Leak Detection in Leak Detection Market, By Region,2019-2028, (USD Million)
TABLE 25 Europe Others in Leak Detection Market, By Region,2019-2028, (USD Million)
TABLE 26 Europe Leak Detection Market, By End User, 2019-2028 (USD Million)
TABLE 27 Europe Oil and Gas in Leak Detection Market, By Region,2019-2028, (USD Million)
TABLE 28 Europe Oil and Gas in Leak Detection Market, By Location, 2019-2028 (USD Million)
TABLE 29 Europe Oil and Gas Leak Detection Market, By Medium, 2019-2028 (USD Million)
TABLE 30 Europe Oil and Gas Leak Detection Market, By Technology, 2019-2028 (USD Million)
TABLE 31 Europe Chemical Plant in Leak Detection Market, By Region,2019-2028, (USD Million)
TABLE 32 Europe Chemical Plant Leak Detection Market, By Technology, 2019-2028 (USD Million)
TABLE 33 Europe Water Treatment Plant in Leak Detection Market, By Region,2019-2028, (USD Million)
TABLE 34 Europe Water Treatment Plant Leak Detection Market, By Technology, 2019-2028 (USD Million)
TABLE 35 Europe Thermal Power Plant in Leak Detection Market, By Region,2019-2028, (USD Million)
TABLE 36 Europe Thermal Power Plant Leak Detection Market, By Technology, 2019-2028 (USD Million)
TABLE 37 Europe Mining and Slurry in Leak Detection Market, By Region,2019-2028, (USD Million)
TABLE 38 Europe Mining and Slurry in Leak Detection Market, By technology, Market Forecast 2021-2028 (USD Million)
TABLE 39 Europe Mining and Slurry in Leak detection market, By region, Market Forecast 2021-2028 (USD Million)
TABLE 40 Europe leak detection MARKET, BY COUNTRY, 2019-2028 (USD Million)
TABLE 41 Europe Leak Detection Market, By Type, 2019-2028 (USD Million)
TABLE 42 Europe Leak Detection Market, By Product Type, 2019-2028 (USD Million)
TABLE 43 Europe Leak Detection Market, By Technology, 2019-2028 (USD Million)
TABLE 44 Europe leak detection Market, By end user, 2019-2028 (USD Million)
TABLE 45 Europe Oil and Gas in Leak Detection Market, By Location, 2019-2028 (USD Million)
TABLE 46 Europe Oil and Gas Leak Detection Market, By Medium, 2019-2028 (USD Million)
TABLE 47 Europe Oil and Gas Leak Detection Market, By Technology, 2019-2028 (USD Million)
TABLE 48 Europe Chemical Plant Leak Detection Market, By Technology, 2019-2028 (USD Million)
TABLE 49 Europe Water Treatment Plant Leak Detection Market, By Technology, 2019-2028 (USD Million)
TABLE 50 Europe Thermal Power Plant Leak Detection Market, By Technology, 2019-2028 (USD Million)
TABLE 51 Europe Mining and Slurry Leak Detection Market, By Technology, 2019-2028 (USD Million)
TABLE 52 Russia Leak Detection Market, By Type, 2019-2028 (USD Million)
TABLE 53 Russia Leak Detection Market, By Product Type, 2019-2028 (USD Million)
TABLE 54 Russia Leak Detection Market, By Technology, 2019-2028 (USD Million)
TABLE 55 Russia leak detection Market, By end user, 2019-2028 (USD Million)
TABLE 56 Russia Oil and Gas in Leak Detection Market, By Location, 2019-2028 (USD Million)
TABLE 57 Russia Oil and Gas Leak Detection Market, By Medium, 2019-2028 (USD Million)
TABLE 58 Russia Oil and Gas Leak Detection Market, By Technology, 2019-2028 (USD Million)
TABLE 59 Russia Chemical Plant Leak Detection Market, By Technology, 2019-2028 (USD Million)
TABLE 60 Russia Water Treatment Plant Leak Detection Market, By Technology, 2019-2028 (USD Million)
TABLE 61 Russia Thermal Power Plant Leak Detection Market, By Technology, 2019-2028 (USD Million)
TABLE 62 Russia Mining and Slurry Leak Detection Market, By Technology, 2019-2028 (USD Million)
TABLE 63 U.K. Leak Detection Market, By Type, 2019-2028 (USD Million)
TABLE 64 U.K. Leak Detection Market, By Product Type, 2019-2028 (USD Million)
TABLE 65 U.K. Leak Detection Market, By Technology, 2019-2028 (USD Million)
TABLE 66 U.K. leak detection Market, By end user, 2019-2028 (USD Million)
TABLE 67 U.K. Oil and Gas in Leak Detection Market, By Location, 2019-2028 (USD Million)
TABLE 68 U.K. Oil and Gas Leak Detection Market, By Medium, 2019-2028 (USD Million)
TABLE 69 U.K. Oil and Gas Leak Detection Market, By Technology, 2019-2028 (USD Million)
TABLE 70 U.K. Chemical Plant Leak Detection Market, By Technology, 2019-2028 (USD Million)
TABLE 71 U.K. Water Treatment Plant Leak Detection Market, By Technology, 2019-2028 (USD Million)
TABLE 72 U.K. Thermal Power Plant Leak Detection Market, By Technology, 2019-2028 (USD Million)
TABLE 73 U.K. Mining and Slurry Leak Detection Market, By Technology, 2019-2028 (USD Million)
TABLE 74 Italy Leak Detection Market, By Type, 2019-2028 (USD Million)
TABLE 75 Italy Leak Detection Market, By Product Type, 2019-2028 (USD Million)
TABLE 76 Italy Leak Detection Market, By Technology, 2019-2028 (USD Million)
TABLE 77 Italy leak detection Market, By end user, 2019-2028 (USD Million)
TABLE 78 Italy Oil and Gas in Leak Detection Market, By Location, 2019-2028 (USD Million)
TABLE 79 Italy Oil and Gas Leak Detection Market, By Medium, 2019-2028 (USD Million)
TABLE 80 Italy Oil and Gas Leak Detection Market, By Technology, 2019-2028 (USD Million)
TABLE 81 Italy Chemical Plant Leak Detection Market, By Technology, 2019-2028 (USD Million)
TABLE 82 Italy Water Treatment Plant Leak Detection Market, By Technology, 2019-2028 (USD Million)
TABLE 83 Italy Thermal Power Plant Leak Detection Market, By Technology, 2019-2028 (USD Million)
TABLE 84 Italy Mining and Slurry Leak Detection Market, By Technology, 2019-2028 (USD Million)
TABLE 85 Turkey Leak Detection Market, By Type, 2019-2028 (USD Million)
TABLE 86 Turkey Leak Detection Market, By Product Type, 2019-2028 (USD Million)
TABLE 87 Turkey Leak Detection Market, By Technology, 2019-2028 (USD Million)
TABLE 88 Turkey leak detection Market, By end user, 2019-2028 (USD Million)
TABLE 89 Turkey Oil and Gas in Leak Detection Market, By Location, 2019-2028 (USD Million)
TABLE 90 Turkey Oil and Gas Leak Detection Market, By Medium, 2019-2028 (USD Million)
TABLE 91 Turkey Oil and Gas Leak Detection Market, By Technology, 2019-2028 (USD Million)
TABLE 92 Turkey Chemical Plant Leak Detection Market, By Technology, 2019-2028 (USD Million)
TABLE 93 Turkey Water Treatment Plant Leak Detection Market, By Technology, 2019-2028 (USD Million)
TABLE 94 Turkey Thermal Power Plant Leak Detection Market, By Technology, 2019-2028 (USD Million)
TABLE 95 Turkey Mining and Slurry Leak Detection Market, By Technology, 2019-2028 (USD Million)
TABLE 96 Germany Leak Detection Market, By Type, 2019-2028 (USD Million)
TABLE 97 Germany Leak Detection Market, By Product Type, 2019-2028 (USD Million)
TABLE 98 Germany Leak Detection Market, By Technology, 2019-2028 (USD Million)
TABLE 99 Germany leak detection Market, By end user, 2019-2028 (USD Million)
TABLE 100 Germany Oil and Gas in Leak Detection Market, By Location, 2019-2028 (USD Million)
TABLE 101 Germany Oil and Gas Leak Detection Market, By Medium, 2019-2028 (USD Million)
TABLE 102 Germany Oil and Gas Leak Detection Market, By Technology, 2019-2028 (USD Million)
TABLE 103 Germany Chemical Plant Leak Detection Market, By Technology, 2019-2028 (USD Million)
TABLE 104 Germany Water Treatment Plant Leak Detection Market, By Technology, 2019-2028 (USD Million)
TABLE 105 Germany Thermal Power Plant Leak Detection Market, By Technology, 2019-2028 (USD Million)
TABLE 106 Germany Mining and Slurry Leak Detection Market, By Technology, 2019-2028 (USD Million)
TABLE 107 Netherlands Leak Detection Market, By Type, 2019-2028 (USD Million)
TABLE 108 Netherlands Leak Detection Market, By Product Type, 2019-2028 (USD Million)
TABLE 109 Netherlands Leak Detection Market, By Technology, 2019-2028 (USD Million)
TABLE 110 Netherlands leak detection Market, By end user, 2019-2028 (USD Million)
TABLE 111 Netherlands Oil and Gas in Leak Detection Market, By Location, 2019-2028 (USD Million)
TABLE 112 Netherlands Oil and Gas Leak Detection Market, By Medium, 2019-2028 (USD Million)
TABLE 113 Netherlands Oil and Gas Leak Detection Market, By Technology, 2019-2028 (USD Million)
TABLE 114 Netherlands Chemical Plant Leak Detection Market, By Technology, 2019-2028 (USD Million)
TABLE 115 Netherlands Water Treatment Plant Leak Detection Market, By Technology, 2019-2028 (USD Million)
TABLE 116 Netherlands Thermal Power Plant Leak Detection Market, By Technology, 2019-2028 (USD Million)
TABLE 117 Netherlands Mining and Slurry Leak Detection Market, By Technology, 2019-2028 (USD Million)
TABLE 118 Spain Leak Detection Market, By Type, 2019-2028 (USD Million)
TABLE 119 Spain Leak Detection Market, By Product Type, 2019-2028 (USD Million)
TABLE 120 Spain Leak Detection Market, By Technology, 2019-2028 (USD Million)
TABLE 121 spain leak detection Market, By end user, 2019-2028 (USD Million)
TABLE 122 spain Oil and Gas in Leak Detection Market, By Location, 2019-2028 (USD Million)
TABLE 123 spain Oil and Gas Leak Detection Market, By Medium, 2019-2028 (USD Million)
TABLE 124 spain Oil and Gas Leak Detection Market, By Technology, 2019-2028 (USD Million)
TABLE 125 spain Chemical Plant Leak Detection Market, By Technology, 2019-2028 (USD Million)
TABLE 126 spain Water Treatment Plant Leak Detection Market, By Technology, 2019-2028 (USD Million)
TABLE 127 spain Thermal Power Plant Leak Detection Market, By Technology, 2019-2028 (USD Million)
TABLE 128 spain Mining and Slurry Leak Detection Market, By Technology, 2019-2028 (USD Million)
TABLE 129 france Leak Detection Market, By Type, 2019-2028 (USD Million)
TABLE 130 france Leak Detection Market, By Product Type, 2019-2028 (USD Million)
TABLE 131 france Leak Detection Market, By Technology, 2019-2028 (USD Million)
TABLE 132 france leak detection Market, By end user, 2019-2028 (USD Million)
TABLE 133 france Oil and Gas in Leak Detection Market, By Location, 2019-2028 (USD Million)
TABLE 134 france Oil and Gas Leak Detection Market, By Medium, 2019-2028 (USD Million)
TABLE 135 france Oil and Gas Leak Detection Market, By Technology, 2019-2028 (USD Million)
TABLE 136 france Chemical Plant Leak Detection Market, By Technology, 2019-2028 (USD Million)
TABLE 137 france Water Treatment Plant Leak Detection Market, By Technology, 2019-2028 (USD Million)
TABLE 138 france Thermal Power Plant Leak Detection Market, By Technology, 2019-2028 (USD Million)
TABLE 139 france Mining and Slurry Leak Detection Market, By Technology, 2019-2028 (USD Million)
TABLE 140 belgium Leak Detection Market, By Type, 2019-2028 (USD Million)
TABLE 141 belgium Leak Detection Market, By Product Type, 2019-2028 (USD Million)
TABLE 142 belgium Leak Detection Market, By Technology, 2019-2028 (USD Million)
TABLE 143 belgium leak detection Market, By end user, 2019-2028 (USD Million)
TABLE 144 belgium Oil and Gas in Leak Detection Market, By Location, 2019-2028 (USD Million)
TABLE 145 belgium Oil and Gas Leak Detection Market, By Medium, 2019-2028 (USD Million)
TABLE 146 belgium Oil and Gas Leak Detection Market, By Technology, 2019-2028 (USD Million)
TABLE 147 belgium Chemical Plant Leak Detection Market, By Technology, 2019-2028 (USD Million)
TABLE 148 belgium Water Treatment Plant Leak Detection Market, By Technology, 2019-2028 (USD Million)
TABLE 149 belgium Thermal Power Plant Leak Detection Market, By Technology, 2019-2028 (USD Million)
TABLE 150 belgium Mining and Slurry Leak Detection Market, By Technology, 2019-2028 (USD Million)
TABLE 151 Switzerland Leak Detection Market, By Type, 2019-2028 (USD Million)
TABLE 152 Switzerland Leak Detection Market, By Product Type, 2019-2028 (USD Million)
TABLE 153 Switzerland Leak Detection Market, By Technology, 2019-2028 (USD Million)
TABLE 154 Switzerland leak detection Market, By end user, 2019-2028 (USD Million)
TABLE 155 Switzerland Oil and Gas in Leak Detection Market, By Location, 2019-2028 (USD Million)
TABLE 156 Switzerland Oil and Gas Leak Detection Market, By Medium, 2019-2028 (USD Million)
TABLE 157 Switzerland Oil and Gas Leak Detection Market, By Technology, 2019-2028 (USD Million)
TABLE 158 Switzerland Chemical Plant Leak Detection Market, By Technology, 2019-2028 (USD Million)
TABLE 159 Switzerland Water Treatment Plant Leak Detection Market, By Technology, 2019-2028 (USD Million)
TABLE 160 Switzerland Thermal Power Plant Leak Detection Market, By Technology, 2019-2028 (USD Million)
TABLE 161 Switzerland Mining and Slurry Leak Detection Market, By Technology, 2019-2028 (USD Million)
TABLE 162 Rest of Europe Leak detection MARKET, BY type, 2019-2028 (USD Million)
Lista de Figura
FIGURE 1 Europe Leak Detection market: segmentation
FIGURE 2 EUROPE LEAK DETECTION MARKET: data triangulation
FIGURE 3 Europe Leak Detection market: DROC ANALYSIS
FIGURE 4 Europe Leak Detection market: EUROPE VS regional MARKET ANALYSIS
FIGURE 5 EUROPE LEAK DETECTION MARKET: COMPANY RESEARCH ANALYSIS
FIGURE 6 EUROPE LEAK DETECTION MARKET: INTERVIEW DEMOGRAPHICS
FIGURE 7 Europe Leak Detection market: DBMR MARKET POSITION GRID
FIGURE 8 Europe leak detection market: vendor share analysis
FIGURE 9 Europe Leak Detection market: SEGMENTATION
FIGURE 10 increasing growth in oil and gas pipeline and storage plant infrastructure is expected to DRIVe Europe Leak Detection MARKET IN THE FORECAST PERIOD of 2021 to 2028
FIGURE 11 midstream segment is expected to account for the largest share of Europe Leak Detection market in 2021 & 2028
FIGURE 12 DRIVERS, RESTRAINT, OPPORTUNITIES AND CHALLENGES OF EUROPE LEAK DETECTION MARKET
FIGURE 13 Europe leak detection MARKET: BY type, 2020
FIGURE 14 Europe leak detection MARKET: BY product type, 2020
FIGURE 15 Europe leak detection MARKET: BY technology, 2020
FIGURE 16 Europe leak detection MARKET: BY end user, 2020
FIGURE 17 Europe leak detection market: SNAPSHOT (2020)
FIGURE 18 Europe leak detection market: BY COUNTRY (2020)
FIGURE 19 Europe leak detection market: BY COUNTRY (2021& 2028)
FIGURE 20 Europe leak detection market: BY COUNTRY (2020& 2028)
FIGURE 21 Europe leak detection market: BY type (2021-2028)
FIGURE 22 EUROPE LEAK DETECTION market: COMPANY SHARE 2020 (%)
Metodologia de Investigação
A recolha de dados e a análise do ano base são feitas através de módulos de recolha de dados com amostras grandes. A etapa inclui a obtenção de informações de mercado ou dados relacionados através de diversas fontes e estratégias. Inclui examinar e planear antecipadamente todos os dados adquiridos no passado. Da mesma forma, envolve o exame de inconsistências de informação observadas em diferentes fontes de informação. Os dados de mercado são analisados e estimados utilizando modelos estatísticos e coerentes de mercado. Além disso, a análise da quota de mercado e a análise das principais tendências são os principais fatores de sucesso no relatório de mercado. Para saber mais, solicite uma chamada de analista ou abra a sua consulta.
A principal metodologia de investigação utilizada pela equipa de investigação do DBMR é a triangulação de dados que envolve a mineração de dados, a análise do impacto das variáveis de dados no mercado e a validação primária (especialista do setor). Os modelos de dados incluem grelha de posicionamento de fornecedores, análise da linha de tempo do mercado, visão geral e guia de mercado, grelha de posicionamento da empresa, análise de patentes, análise de preços, análise da quota de mercado da empresa, normas de medição, análise global versus regional e de participação dos fornecedores. Para saber mais sobre a metodologia de investigação, faça uma consulta para falar com os nossos especialistas do setor.
Personalização disponível
A Data Bridge Market Research é líder em investigação formativa avançada. Orgulhamo-nos de servir os nossos clientes novos e existentes com dados e análises que correspondem e atendem aos seus objetivos. O relatório pode ser personalizado para incluir análise de tendências de preços de marcas-alvo, compreensão do mercado para países adicionais (solicite a lista de países), dados de resultados de ensaios clínicos, revisão de literatura, mercado remodelado e análise de base de produtos . A análise de mercado dos concorrentes-alvo pode ser analisada desde análises baseadas em tecnologia até estratégias de carteira de mercado. Podemos adicionar quantos concorrentes necessitar de dados no formato e estilo de dados que procura. A nossa equipa de analistas também pode fornecer dados em tabelas dinâmicas de ficheiros Excel em bruto (livro de factos) ou pode ajudá-lo a criar apresentações a partir dos conjuntos de dados disponíveis no relatório.