Europe Car T Cell Therapy Treatment Market
Tamanho do mercado em biliões de dólares
CAGR :
% 
 USD
3.77 Billion
USD
29.63 Billion
2024
2032
USD
3.77 Billion
USD
29.63 Billion
2024
2032
| 2025 –2032 | |
| USD 3.77 Billion | |
| USD 29.63 Billion | |
| % | |
|
Segmentação do mercado europeu de terapia com células CAR-T por produto (células CAR-T autólogas, células CAR-T alogênicas), estrutura (células CAR-T de primeira geração, células CAR-T de segunda geração, células CAR-T de terceira geração, células CAR-T de quarta geração), antígenos-alvo (antígenos em tumores sólidos, antígenos em neoplasias hematológicas, outros), marca (Yescarta, Kymriah, Tecartus, outras), aplicação terapêutica (neoplasias hematológicas, câncer de pâncreas, câncer de mama, câncer de pulmão, câncer gástrico , mieloma múltiplo, leucemia linfocítica crônica, linfoma de células do manto, linfoma folicular, linfoma difuso de grandes células B, leucemia linfoblástica aguda, outros), usuário final (hospitais, clínicas especializadas, outros), canal de distribuição (farmácias hospitalares, outros) - Tendências e previsões do setor até 2032.
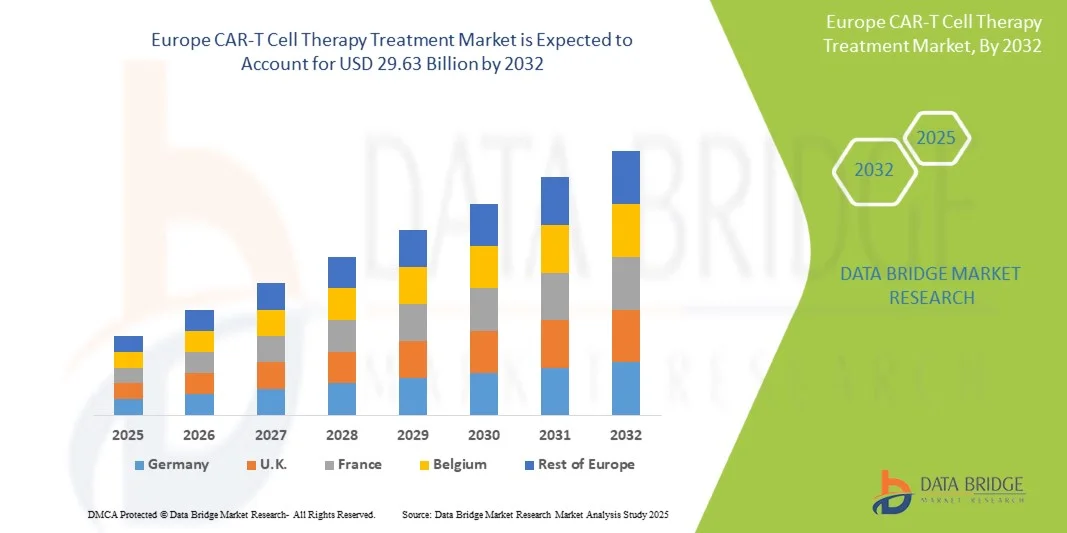
Tamanho do mercado europeu de tratamento com terapia de células CAR-T
- O mercado europeu de terapia com células CAR-T foi avaliado em US$ 3,77 bilhões em 2024 e deverá atingir US$ 29,63 bilhões até 2032 , com uma taxa de crescimento anual composta (CAGR) de 29,40% durante o período de previsão.
- O crescimento do mercado é impulsionado principalmente pela crescente prevalência de neoplasias hematológicas e outros tipos de câncer, juntamente com os rápidos avanços nas tecnologias de imunoterapia celular, o que leva a uma adoção mais ampla das terapias com células CAR-T na prática clínica.
- Além disso, a crescente demanda dos pacientes por opções de tratamento personalizadas, direcionadas e eficazes está impulsionando a adoção de soluções de terapia com células CAR-T, aumentando significativamente o crescimento do setor.
Análise do mercado europeu de tratamento com terapia de células CAR-T
- A terapia com células CAR-T, que oferece imunoterapia celular personalizada e direcionada para o tratamento do câncer, está se tornando um componente vital do tratamento oncológico moderno, tanto em hospitais quanto em clínicas especializadas, devido à sua alta eficácia e potencial para remissão a longo prazo.
- A crescente demanda pela terapia com células CAR-T é impulsionada principalmente pelo aumento da prevalência do câncer, pelos avanços na pesquisa em imunoterapia e pela preferência cada vez maior dos pacientes por soluções de tratamento inovadoras e de precisão.
- O Reino Unido dominou o mercado de tratamento com terapia celular CAR-T, com a maior participação de receita, de 36,8% em 2024, impulsionado por investimentos robustos em pesquisa do câncer, pela forte presença de empresas biofarmacêuticas líderes e pela rápida adoção de terapias celulares e gênicas avançadas no sistema de saúde do país. As iniciativas do Serviço Nacional de Saúde (NHS) do Reino Unido, que apoiam tratamentos personalizados e baseados em imunoterapia para o câncer, juntamente com vias regulatórias favoráveis, estão impulsionando ainda mais a expansão do mercado de tratamento com terapia celular CAR-T.
- Prevê-se que a Alemanha seja o país com o crescimento mais rápido no mercado de terapia com células CAR-T durante o período de previsão, expandindo a uma taxa composta de crescimento anual (CAGR) de 12,4%, devido ao crescimento significativo na pesquisa biotecnológica, ao aumento do financiamento para ensaios clínicos e à expansão das colaborações entre instituições acadêmicas e empresas farmacêuticas. O foco do país em medicina de precisão, inovação tecnológica e melhor acesso a terapias oncológicas avançadas continua a impulsionar o crescimento do mercado de tratamentos com células CAR-T na Alemanha.
- O segmento de neoplasias hematológicas dominou o mercado com 69,7% da receita em 2024, devido às aprovações precoces, alta prevalência e excelentes resultados clínicos. Hospitais e clínicas especializadas oferecem terapia e monitoramento centralizados.
Escopo do relatório e segmentação do mercado europeu de tratamento com terapia de células CAR-T
|
Atributos |
Principais informações sobre o mercado europeu de terapia com células CAR-T |
|
Segmentos abrangidos |
|
|
Países abrangidos |
Europa
|
|
Principais participantes do mercado |
|
|
Oportunidades de mercado |
|
|
Conjuntos de informações de dados de valor agregado |
Além das informações sobre cenários de mercado, como valor de mercado, taxa de crescimento, segmentação, cobertura geográfica e principais participantes, os relatórios de mercado elaborados pela Data Bridge Market Research também incluem análises aprofundadas de especialistas, epidemiologia de pacientes, análise de projetos em desenvolvimento, análise de preços e estrutura regulatória. |
Tendências do mercado europeu de tratamento com terapia de células CAR-T
“ Maior comodidade por meio de plataformas de terapia avançadas ”
- Uma tendência significativa e crescente no mercado europeu de terapia com células CAR-T é a integração cada vez maior de plataformas terapêuticas avançadas com soluções de saúde digital e sistemas de monitoramento assistidos por inteligência artificial. Essas tecnologias estão aprimorando a tomada de decisões clínicas, o monitoramento de pacientes e o planejamento personalizado de tratamentos com células CAR-T.
- Por exemplo, as plataformas CAR-T hospitalares estão cada vez mais equipadas com rastreamento de pacientes baseado em IA, permitindo que os médicos monitorem a liberação de citocinas, a resposta imune e os eventos adversos relacionados à terapia em tempo real. Da mesma forma, sistemas automatizados de gerenciamento de terapia podem otimizar os esquemas de dosagem e os protocolos de infusão celular.
- A integração da IA na terapia CAR-T possibilita funcionalidades como a previsão da resposta do paciente, a otimização dos prazos de produção de células CAR-T autólogas e alogênicas e o fornecimento de alertas precoces para potenciais toxicidades. Essa abordagem baseada em dados aprimora a segurança e a eficácia do tratamento.
- A integração perfeita das plataformas de tratamento com células CAR-T aos registros médicos eletrônicos (RME) hospitalares facilita o gerenciamento centralizado dos fluxos de trabalho da terapia, do histórico do paciente e dos cronogramas de acompanhamento. Por meio de uma interface unificada, os médicos podem coordenar o condicionamento pré-tratamento, a infusão e os cuidados pós-infusão de forma eficiente.
- Essa tendência em direção a plataformas CAR-T mais inteligentes, orientadas por dados e interconectadas está remodelando fundamentalmente as expectativas para os resultados do tratamento oncológico. Consequentemente, empresas como Novartis, Gilead e Bristol Myers Squibb estão desenvolvendo plataformas com monitoramento habilitado por IA, análises em tempo real e recursos de otimização da terapia.
- A demanda por terapias CAR-T com integração de plataforma aprimorada está crescendo rapidamente em hospitais e centros de oncologia especializados, à medida que pacientes e profissionais de saúde priorizam cada vez mais a segurança, a eficácia e a personalização do tratamento.
Dinâmica do mercado europeu de tratamento com terapia de células CAR-T
Motorista
“Crescente necessidade devido ao aumento da prevalência do câncer e à adoção de terapias avançadas”
- A crescente prevalência de neoplasias hematológicas e tumores sólidos, aliada à adoção cada vez maior de imunoterapias avançadas, é um fator significativo para o aumento da demanda por terapias com células CAR-T.
- Por exemplo, em 2024, vários produtos CAR-T receberam aprovação expandida para o tratamento de linfoma difuso de grandes células B, mieloma múltiplo e leucemia linfoblástica aguda, possibilitando uma adoção clínica mais ampla. Espera-se que essas aprovações regulatórias impulsionem o crescimento do mercado durante o período de previsão.
- À medida que os profissionais de saúde buscam opções de tratamento mais eficazes e duradouras, as terapias CAR-T oferecem abordagens personalizadas e direcionadas que podem produzir remissão a longo prazo em pacientes com câncer refratário ou recidivante.
- Além disso, o aumento dos investimentos em infraestrutura de fabricação de CAR-T, a expansão dos programas de ensaios clínicos e a melhoria da logística da cadeia de suprimentos estão tornando essas terapias mais acessíveis a pacientes em todo o mundo.
- A combinação de programas de conscientização do paciente, cobertura de reembolso ampliada e centros de tratamento especializados capazes de administrar a terapia CAR-T está impulsionando ainda mais a adoção no mercado. Plataformas de terapia avançadas que suportam produção em larga escala e planejamento de tratamento personalizado são fatores-chave para o crescimento.
Restrição/Desafio
“ Preocupações com relação à segurança, complexidade de fabricação e altos custos da terapia ”
- Preocupações relacionadas a eventos adversos graves, como a síndrome de liberação de citocinas (SLC) e a neurotoxicidade, representam desafios significativos para uma maior penetração no mercado. O monitoramento e o gerenciamento contínuos são essenciais para mitigar os riscos associados à terapia.
- O processo de fabricação complexo e demorado de células CAR-T autólogas, que envolve coleta personalizada de células, modificação genética e reinfusão, pode limitar a escalabilidade e a acessibilidade do tratamento.
- Abordar esses desafios por meio de protocolos padronizados, gestão de segurança aprimorada e automação na fabricação é crucial para aumentar o acesso do paciente e a adoção clínica.
- O alto custo da terapia CAR-T, que frequentemente ultrapassa centenas de milhares de dólares por tratamento, continua sendo uma barreira para pacientes em mercados emergentes ou para aqueles sem cobertura abrangente de seguro saúde. Estratégias de contenção de custos e ampliação do reembolso são necessárias para aumentar a acessibilidade.
- Além disso, as complexidades regulatórias para aprovação de terapias, controle de qualidade e farmacovigilância pós-comercialização podem retardar o crescimento do mercado. A harmonização das diretrizes entre os países é essencial para agilizar a adoção na Europa.
- Superar esses desafios por meio de inovação tecnológica, protocolos de segurança aprimorados e programas de apoio ao paciente será vital para o crescimento sustentado do mercado de tratamento com terapia de células CAR-T.
Escopo do mercado europeu de tratamento com terapia de células CAR-T
O mercado é segmentado com base no produto, estrutura, antígenos-alvo, marca, aplicação terapêutica, usuário final e canal de distribuição.
• Por produto
Com base no produto, o mercado de terapia com células CAR-T é segmentado em células CAR-T autólogas e células CAR-T alogênicas. O segmento de células CAR-T autólogas dominou o mercado com a maior participação na receita, de 62,5% em 2024, devido à sua abordagem personalizada, que minimiza os riscos da doença do enxerto contra o hospedeiro e maximiza a eficácia terapêutica. Hospitais e clínicas especializadas utilizam amplamente a terapia com células CAR-T autólogas para neoplasias hematológicas, oferecendo resultados otimizados para os pacientes. As aprovações regulatórias em mercados-chave, como os EUA, a Alemanha e a China, sustentam a adoção consistente. Evidências clínicas robustas, dados de resposta de pacientes a longo prazo e protocolos de fabricação estabelecidos fortalecem sua posição no mercado. O apoio ao reembolso, a conscientização dos pacientes e as tecnologias avançadas de processamento celular também impulsionam o crescimento. Pesquisa e desenvolvimento contínuos, expansões de ensaios clínicos e programas de educação médica aprimoram sua adoção clínica. A disponibilidade de terapias combinadas com células CAR-T autólogas consolida ainda mais a dominância do mercado.
Prevê-se que o segmento de células CAR-T alogênicas apresente o crescimento mais rápido, com uma taxa composta de crescimento anual (CAGR) de 14,2% entre 2025 e 2032, impulsionado por terapias prontas para uso que permitem administração imediata. Esses produtos reduzem o tempo e o custo de fabricação, melhorando o acesso dos pacientes. Os avanços na edição genética e nas tecnologias de células doadoras universais aprimoram a segurança e a escalabilidade. Ensaios clínicos direcionados a tumores hematológicos e sólidos estão acelerando o desenvolvimento. Colaborações estratégicas entre empresas de biotecnologia e fabricantes terceirizados (CMOs) estão expandindo a capacidade de produção. A abordagem de terapias prontas para uso atende a necessidades médicas não atendidas e amplia a cobertura do tratamento. O investimento em melhorias de segurança e eficácia impulsiona a adoção pelo mercado. O progresso regulatório em diversas regiões incentiva aprovações mais rápidas. Parcerias com hospitais e centros especializados aprimoram a distribuição e a visibilidade. O crescente número de pacientes em mercados emergentes também contribui para o rápido crescimento.
• Por estrutura
Com base na estrutura, o mercado é segmentado em células CAR-T de primeira, segunda, terceira e quarta geração. O segmento de células CAR-T de segunda geração dominou o mercado com uma participação de 55,8% na receita em 2024, graças aos domínios coestimulatórios que melhoram a persistência e a atividade citotóxica das células T. A maioria dos produtos CAR-T aprovados comercialmente pertence a essa geração. Hospitais e clínicas especializadas adotam amplamente essas terapias devido à eficácia e segurança comprovadas. Evidências robustas de ensaios clínicos, aprovações regulatórias e cobertura de reembolso reforçam sua posição. Padrões avançados de fabricação garantem a entrega de alta qualidade. O segmento se beneficia de opções otimizadas de terapia combinada. A inovação contínua em modificação genética e expansão de células T apoia a adoção clínica. Os resultados dos pacientes e os dados de sobrevida em longo prazo consolidam a dominância do mercado. Campanhas de conscientização e programas de educação médica na Europa aumentam a adoção por parte dos médicos. Parcerias com instituições de pesquisa fortalecem ainda mais a liderança de mercado.
O segmento de células CAR-T de terceira geração deverá apresentar o crescimento mais rápido, com uma taxa composta de crescimento anual (CAGR) de 12,5% entre 2025 e 2032, impulsionado por designs multi-coestimulatórios que potencializam a atividade antitumoral. Sua aplicação potencial em tumores hematológicos e sólidos está fomentando o interesse em pesquisa. Dados clínicos iniciais demonstram resultados promissores. Colaborações em biotecnologia e parcerias acadêmicas estão acelerando o desenvolvimento. As terapias CAR-T de terceira geração oferecem maior persistência, menor risco de recidiva e perfis de segurança aprimorados. O financiamento para pesquisa em imunoterapia apoia a expansão do segmento. Hospitais e clínicas especializadas estão adotando gradualmente esses produtos avançados. As diretrizes regulatórias estão se tornando mais favoráveis. A conscientização de pacientes e médicos sobre as novas inovações em CAR-T impulsiona a demanda. O foco crescente em medicina personalizada alimenta a rápida adoção. A penetração de mercado em regiões emergentes está se expandindo.
• Por meio de antígenos direcionados
Com base nos antígenos-alvo, o mercado é segmentado em Antígenos em Tumores Sólidos, Antígenos em Neoplasias Hematológicas e Outros. O segmento de Neoplasias Hematológicas dominou o mercado com 67,3% da receita em 2024, visto que as terapias CAR-T foram aprovadas inicialmente e amplamente adotadas para neoplasias de células B, como linfoma difuso de grandes células B (DLBCL), leucemia linfoblástica aguda (LLA) e mieloma múltiplo. Resultados clínicos robustos, ampla adesão hospitalar e suporte regulatório impulsionam essa dominância. A cobertura de reembolso garante o acesso dos pacientes. Dados extensivos de ensaios clínicos validam a eficácia e a segurança. Centros de tratamento especializados asseguram o manejo ideal da terapia. A educação e a conscientização dos médicos contribuem para a adoção. Hospitais e clínicas especializadas são os principais locais de administração. Dados de sobrevida em longo prazo reforçam a confiança do mercado. A demanda dos pacientes está aumentando. As diretrizes de tratamento europeias recomendam a terapia CAR-T para pacientes elegíveis. A pesquisa e o desenvolvimento contínuos sustentam a expansão do mercado.
Prevê-se que o segmento de Tumores Sólidos apresente o crescimento mais rápido, com uma taxa composta de crescimento anual (CAGR) de 13,8% entre 2025 e 2032, impulsionado por ensaios clínicos direcionados a HER2, EGFR, mesotelina e outros antígenos de tumores sólidos. Os avanços na modulação do microambiente tumoral melhoram as taxas de resposta. Combinações de inibidores de checkpoint imunológico estão em fase de investigação. O investimento em pesquisa e desenvolvimento está aumentando globalmente. Hospitais e clínicas especializadas estão expandindo a participação em ensaios clínicos. Novas terapias CAR-T demonstram segurança e eficácia promissoras. A colaboração entre empresas de biotecnologia e instituições acadêmicas acelera o crescimento. A demanda dos pacientes por terapias inovadoras está aumentando. A flexibilidade regulatória em oncologia incentiva a expansão dos ensaios clínicos. Programas de conscientização para médicos e pacientes estão promovendo a adoção dessas terapias. Inovações tecnológicas em edição genética aprimoram o direcionamento a tumores sólidos. A penetração de mercado em regiões emergentes sustenta o rápido crescimento.
• Por marca
Com base na marca, o mercado é segmentado em Yescarta, Kymriah, Tecartus e Outros. O segmento Yescarta dominou com 38,4% da receita em 2024, devido à aprovação precoce para o tratamento de linfoma difuso de grandes células B (DLBCL) e à ampla adoção hospitalar. Seu forte perfil de segurança, robusta eficácia clínica e programas estruturados de suporte ao paciente reforçam essa posição dominante. A cobertura de reembolso, a educação médica e a conscientização do paciente impulsionam a adoção. Hospitais e clínicas especializadas implementam protocolos padronizados. A capacidade de produção garante o fornecimento confiável do produto. Estudos pós-comercialização em andamento aumentam a confiança. Parcerias com centros médicos na Europa ampliam o alcance. Os resultados para os pacientes são favoráveis. A inovação contínua e as terapias combinadas sustentam a liderança de mercado.
O segmento Tecartus deverá apresentar o crescimento mais rápido, com uma taxa composta de crescimento anual (CAGR) de 15,1% entre 2025 e 2032, impulsionado pela sua aprovação para o tratamento de linfoma de células do manto e neoplasias de células B recidivantes/refratárias. Ensaios clínicos e programas de acesso expandido aceleram a adoção do tratamento. Clínicas especializadas e hospitais estão implementando cada vez mais a terapia Tecartus. Parcerias com empresas de biotecnologia aprimoram a distribuição. Resultados clínicos iniciais positivos aumentam a confiança. Investimentos em escalabilidade de produção sustentam a demanda. Incentivos regulatórios permitem aprovações mais rápidas. Programas de divulgação e conscientização melhoram o conhecimento dos médicos sobre o tratamento. A preferência dos pacientes por novas terapias está crescendo. A adoção do tratamento na Europa está se expandindo. A pesquisa e o desenvolvimento contínuos aprimoram o potencial terapêutico.
• Por aplicação terapêutica
Com base na aplicação terapêutica, o mercado é segmentado em Neoplasias Hematológicas, Câncer de Pâncreas, Câncer de Mama, Câncer de Pulmão, Câncer Gástrico, Mieloma Múltiplo, Leucemia Linfocítica Crônica, Linfoma de Células do Manto, Linfoma Folicular, Linfoma Difuso de Grandes Células B, Leucemia Linfoblástica Aguda e Outras. O segmento de Neoplasias Hematológicas dominou o mercado com 69,7% da receita em 2024, devido às aprovações precoces, alta prevalência e fortes resultados clínicos. Hospitais e clínicas especializadas oferecem terapia e monitoramento centralizados. A cobertura de reembolso e o endosso de diretrizes apoiam a adoção. Equipes multidisciplinares garantem a segurança. Dados de pacientes a longo prazo reforçam a eficácia. O respaldo de ensaios clínicos garante a conformidade regulatória. Os médicos priorizam a terapia CAR-T para pacientes elegíveis. O acesso a instalações especializadas sustenta a dominância do mercado. A conscientização dos pacientes é alta. A pesquisa e o desenvolvimento contínuos fortalecem o pipeline de produtos. A colaboração com centros acadêmicos garante o crescimento.
Prevê-se que o segmento de câncer pancreático apresente o crescimento mais rápido, com uma taxa composta de crescimento anual (CAGR) de 12,9% entre 2025 e 2032, devido a construções inovadoras de células CAR-T direcionadas a KRAS, mesotelina e outros antígenos. Ensaios clínicos demonstram resultados promissores iniciais. Terapias combinadas aumentam a eficácia. Hospitais e clínicas especializadas expandem a capacidade de realização de ensaios clínicos. Investimentos em biotecnologia impulsionam o desenvolvimento. A flexibilidade regulatória incentiva aprovações mais rápidas. Programas de conscientização para médicos aumentam a adoção. O interesse dos pacientes em novas terapias está crescendo. Colaborações acadêmicas impulsionam a pesquisa. A escalabilidade da produção melhora o acesso. A precisão da terapia direcionada sustenta o crescimento. A penetração de mercado em regiões emergentes impulsiona a rápida adoção.
• Pelo usuário final
Com base no usuário final, o mercado é segmentado em Hospitais, Clínicas Especializadas e Outros. O segmento de Hospitais dominou o mercado com 58,6% da receita em 2024, devido à administração centralizada da terapia CAR-T, equipes multidisciplinares, infraestrutura avançada e monitoramento contínuo do paciente. Os hospitais gerenciam a infusão, os eventos adversos e os cuidados pós-terapia. A conformidade regulatória e a cobertura de reembolso garantem a adoção. Instalações com múltiplas unidades proporcionam atendimento consistente. Evidências clínicas e resultados de longo prazo para os pacientes reforçam a dominância do mercado. A integração com cuidados de suporte aumenta a segurança. Protocolos de tratamento padronizados melhoram a eficácia. A familiaridade do médico com o tratamento incentiva a preferência. A confiança do paciente é maior em ambientes hospitalares. Parcerias com empresas de biotecnologia ampliam o acesso.
Prevê-se que o segmento de Clínicas Especializadas apresente o crescimento mais rápido, com uma taxa composta de crescimento anual (CAGR) de 11,3% entre 2025 e 2032, impulsionado por centros oncológicos ambulatoriais dedicados que oferecem atendimento personalizado. Menores tempos de espera, atenção focada e terapia de precisão aumentam a preferência dos pacientes. A expansão de tratamentos baseados em ensaios clínicos apoia a adoção. A conscientização dos médicos e a equipe especializada melhoram os resultados. Colaborações acadêmicas aceleram o compartilhamento de conhecimento. Terapias inovadoras tornam-se mais acessíveis. As clínicas oferecem agendamento flexível e monitoramento contínuo. Modelos de atendimento centrados no paciente atraem novos usuários. Campanhas de conscientização impulsionam a demanda. Melhorias na infraestrutura aumentam a capacidade. A adoção em mercados emergentes está aumentando.
• Por canal de distribuição
Com base no canal de distribuição, o mercado é segmentado em Farmácias Hospitalares e Outros. O segmento de Farmácias Hospitalares detinha a maior participação de mercado, com 52,1% em 2024, devido à dispensação controlada de terapias CAR-T de alto custo, instalações de armazenamento, conformidade regulatória e equipe treinada. Compras em grande escala, programas governamentais e cadeias de suprimentos integradas sustentam essa dominância. Protocolos de garantia de qualidade asseguram a segurança. Os hospitais proporcionam acesso oportuno aos pacientes. A cobertura de reembolso facilita a acessibilidade. Equipes de suporte clínico gerenciam a terapia e os eventos adversos. A adoção é facilitada por procedimentos hospitalares padronizados. As diretrizes regulatórias reforçam a conformidade. A distribuição centralizada melhora a eficiência. Os resultados para os pacientes são melhores em ambientes hospitalares.
Prevê-se que o segmento "Outros" cresça à taxa composta de crescimento anual (CAGR) mais rápida, de 10,7%, de 2025 a 2032, incluindo distribuidores especializados e soluções logísticas emergentes. Este canal melhora o acesso em regiões com infraestrutura hospitalar precária. A integração do comércio eletrônico e da telemedicina apoia a prestação de serviços. Distribuição mais rápida e cadeias de suprimentos flexíveis impulsionam a adoção. A colaboração com empresas de biotecnologia garante a confiabilidade do produto. A orientação regulatória facilita a expansão. Programas de conscientização aumentam a confiança dos médicos. Áreas remotas e carentes de serviços são beneficiadas. A logística especializada garante o manuseio seguro. A penetração no mercado em regiões em desenvolvimento acelera. O rastreamento habilitado por tecnologia aumenta a confiança. O acesso flexível sustenta o crescimento acelerado.
Análise Regional do Mercado Europeu de Tratamento com Terapia de Células CAR-T
- Prevê-se que o mercado europeu de terapia com células CAR-T cresça a uma taxa composta de crescimento anual (CAGR) significativa durante o período de previsão, impulsionado principalmente pelo aumento dos investimentos em terapias oncológicas avançadas, pela crescente conscientização sobre medicina personalizada e por iniciativas regulatórias favoráveis à pesquisa em terapia celular e gênica.
- A sólida infraestrutura biotecnológica da região, a expansão das atividades de ensaios clínicos e as colaborações entre empresas farmacêuticas e instituições de pesquisa estão impulsionando avanços substanciais nos tratamentos com células CAR-T.
- A Europa está testemunhando uma crescente adoção da terapia com células CAR-T nos principais sistemas de saúde para o tratamento de neoplasias hematológicas e tumores sólidos, refletindo uma mudança em direção a um tratamento oncológico de precisão.
Análise do mercado de tratamento com terapia de células CAR-T no Reino Unido
O mercado de terapia com células CAR-T no Reino Unido dominou o mercado europeu de tratamento com esse tipo de terapia, com a maior participação de receita, de 36,8% em 2024. Esse crescimento foi impulsionado por investimentos robustos em pesquisa oncológica, pela forte presença de empresas biofarmacêuticas líderes e pela rápida adoção de terapias celulares e gênicas avançadas no sistema de saúde do país. As iniciativas do Serviço Nacional de Saúde (NHS) do Reino Unido, que apoiam tratamentos oncológicos personalizados e baseados em imunoterapia, juntamente com vias regulatórias favoráveis e programas de inovação apoiados pelo governo, estão impulsionando ainda mais a expansão do mercado. Além disso, os avanços contínuos nas capacidades de fabricação e o estabelecimento de centros especializados em terapia celular reforçam a liderança do Reino Unido no mercado europeu de CAR-T.
Análise do mercado de tratamento com terapia de células CAR-T na Alemanha
O mercado alemão de terapia com células CAR-T deverá ser o de crescimento mais rápido durante o período de previsão, expandindo a uma taxa composta de crescimento anual (CAGR) de 12,4%, devido ao significativo crescimento da pesquisa em biotecnologia , ao aumento do financiamento para ensaios clínicos e à expansão das colaborações entre instituições acadêmicas e empresas farmacêuticas. A forte ênfase do país em medicina de precisão , inovação tecnológica e maior acesso a terapias oncológicas avançadas está acelerando a adoção de tratamentos com células CAR-T. A infraestrutura de saúde bem estabelecida da Alemanha, o apoio governamental à pesquisa e desenvolvimento (P&D) e o foco no desenvolvimento de modelos escaláveis de fabricação e distribuição de células CAR-T contribuem ainda mais para o rápido crescimento do mercado no país.
Participação de mercado do tratamento com terapia de células CAR-T na Europa
O setor de tratamento com terapia de células CAR-T é liderado principalmente por empresas consolidadas, incluindo:
- Novartis AG (Suíça)
- GSK plc (Reino Unido)
- Bristol Myers Squibb (Irlanda)
- Autolus Therapeutics plc (Reino Unido)
- Miltenyi Biotec (Alemanha)
- Cellectis SA (França)
- Thermo Fisher Scientific Inc (Alemanha)
- Orchard Therapeutics (Reino Unido)
- BioNTech SE (Alemanha)
- Oxford BioTherapeutics (Reino Unido)
- GEMoaB Monoclonals GmbH (Alemanha)
- Mabion SA (Polônia)
- Anaveon AG (Suíça)
- TC BioPharm (Reino Unido)
Últimos desenvolvimentos no mercado europeu de tratamento com terapia de células CAR-T
- Em março de 2021, a Food and Drug Administration (FDA) dos EUA aprovou o idecabtagene vicleucel (nome comercial Abecma) para pacientes adultos com mieloma múltiplo recidivado ou refratário após quatro ou mais linhas de tratamento anteriores. Essa aprovação representou a primeira terapia com células CAR-T aprovada pela FDA para mieloma múltiplo, um marco importante na oncologia personalizada e uma ampliação das opções de tratamento para pacientes com histórico de múltiplos tratamentos prévios.
- Em fevereiro de 2022, a FDA aprovou o ciltacabtagene autoleucel (nome comercial CARVYKTI) para pacientes adultos com mieloma múltiplo recidivado ou refratário após quatro ou mais linhas de terapia anteriores. Desenvolvido pela Janssen e pela Legend Biotech, o CARVYKTI demonstrou altas taxas de resposta global em ensaios clínicos, reforçando a crescente importância das terapias com células CAR-T no tratamento de neoplasias hematológicas.
- Em novembro de 2023, a Food and Drug Administration (FDA) dos EUA anunciou que estava investigando um risco potencial de malignidades de células T associadas a terapias com células CAR-T autólogas direcionadas a BCMA ou CD19. Essa ação refletiu uma maior vigilância regulatória em relação ao monitoramento de segurança a longo prazo dos produtos CAR-T e motivou revisões de segurança em todas as terapias CAR-T aprovadas nos Estados Unidos.
- Em abril de 2024, a FDA aprovou o uso expandido das terapias Abecma e CARVYKTI, permitindo sua administração mais precoce no processo de tratamento para pacientes com mieloma múltiplo recidivado ou refratário. Essa decisão ampliou significativamente a elegibilidade dos pacientes e reforçou a confiança da agência nos perfis de segurança e eficácia dessas terapias com células CAR-T.
SKU-
Obtenha acesso online ao relatório sobre a primeira nuvem de inteligência de mercado do mundo
- Painel interativo de análise de dados
- Painel de análise da empresa para oportunidades de elevado potencial de crescimento
- Acesso de analista de pesquisa para personalização e customização. consultas
- Análise da concorrência com painel interativo
- Últimas notícias, atualizações e atualizações Análise de tendências
- Aproveite o poder da análise de benchmark para um rastreio abrangente da concorrência
Metodologia de Investigação
A recolha de dados e a análise do ano base são feitas através de módulos de recolha de dados com amostras grandes. A etapa inclui a obtenção de informações de mercado ou dados relacionados através de diversas fontes e estratégias. Inclui examinar e planear antecipadamente todos os dados adquiridos no passado. Da mesma forma, envolve o exame de inconsistências de informação observadas em diferentes fontes de informação. Os dados de mercado são analisados e estimados utilizando modelos estatísticos e coerentes de mercado. Além disso, a análise da quota de mercado e a análise das principais tendências são os principais fatores de sucesso no relatório de mercado. Para saber mais, solicite uma chamada de analista ou abra a sua consulta.
A principal metodologia de investigação utilizada pela equipa de investigação do DBMR é a triangulação de dados que envolve a mineração de dados, a análise do impacto das variáveis de dados no mercado e a validação primária (especialista do setor). Os modelos de dados incluem grelha de posicionamento de fornecedores, análise da linha de tempo do mercado, visão geral e guia de mercado, grelha de posicionamento da empresa, análise de patentes, análise de preços, análise da quota de mercado da empresa, normas de medição, análise global versus regional e de participação dos fornecedores. Para saber mais sobre a metodologia de investigação, faça uma consulta para falar com os nossos especialistas do setor.
Personalização disponível
A Data Bridge Market Research é líder em investigação formativa avançada. Orgulhamo-nos de servir os nossos clientes novos e existentes com dados e análises que correspondem e atendem aos seus objetivos. O relatório pode ser personalizado para incluir análise de tendências de preços de marcas-alvo, compreensão do mercado para países adicionais (solicite a lista de países), dados de resultados de ensaios clínicos, revisão de literatura, mercado remodelado e análise de base de produtos . A análise de mercado dos concorrentes-alvo pode ser analisada desde análises baseadas em tecnologia até estratégias de carteira de mercado. Podemos adicionar quantos concorrentes necessitar de dados no formato e estilo de dados que procura. A nossa equipa de analistas também pode fornecer dados em tabelas dinâmicas de ficheiros Excel em bruto (livro de factos) ou pode ajudá-lo a criar apresentações a partir dos conjuntos de dados disponíveis no relatório.