
Mercado de robôs cirúrgicos ortopédicos da Ásia-Pacífico, por tipo de produto (sistema robótico, acessórios robóticos e software e serviços), utilizador final (hospitais e centros de cirurgia ambulatória (ASCS)), canal de distribuição (licitações diretas e distribuidores externos) - Tendências do setor e Previsão para 2029.
Análise e Insight do Mercado de Robôs Cirúrgicos Ortopédicos da Ásia-Pacífico
O mercado dos robôs cirúrgicos ortopédicos é amplamente influenciado pelo crescente foco dos grandes players nos avanços tecnológicos em diagnósticos moleculares e na colaboração e parcerias com outras organizações. O primeiro uso documentado da cirurgia ortopédica começou no século XV. A cirurgia ortopédica moderna e a investigação musculoesquelética tornam a cirurgia menos invasiva e tornam os componentes implantados melhores e mais duráveis. Os robôs cirúrgicos ortopédicos são utilizados para corrigir deformidades ósseas e restaurar a função do sistema esquelético humano. Nos últimos anos, novos produtos inovadores de robôs cirúrgicos ortopédicos foram desenvolvidos para aumentar o crescimento do mercado de robôs cirúrgicos ortopédicos, e os participantes do mercado estão a melhorar o seu portefólio de produtos. Muitos participantes do mercado estão envolvidos no fabrico de robôs cirúrgicos ortopédicos com inovações que abrem caminho para o crescimento do mercado.
O relatório do mercado de robôs cirúrgicos ortopédicos da Ásia-Pacífico fornece detalhes sobre a quota de mercado, novos desenvolvimentos e análise de pipeline de produtos, impacto dos participantes do mercado doméstico e localizado, analisa as oportunidades em termos de bolsas de receitas emergentes, alterações nas regulamentações de mercado, aprovações de produtos, decisões estratégicas, lançamentos de produtos, expansões geográficas e inovações tecnológicas no mercado. Para compreender a análise e o cenário de mercado, contacte-nos para um briefing analítico.
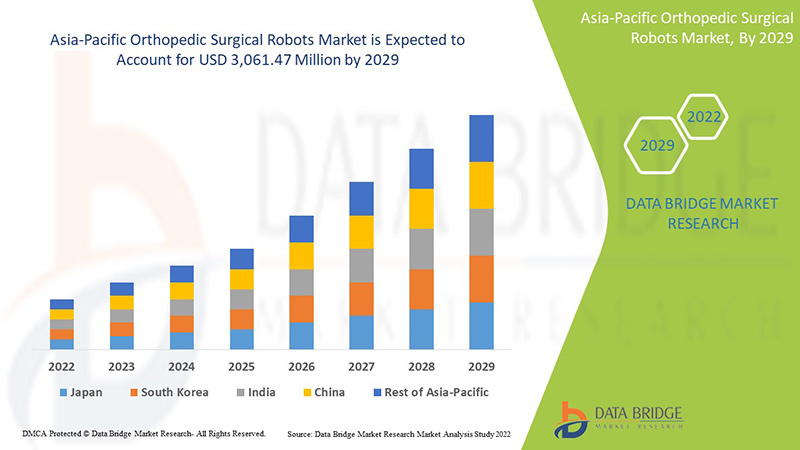
A Data Bridge Market Research analisa que o mercado de robôs cirúrgicos ortopédicos deverá atingir o valor de 3.061,47 milhões de dólares até 2029, com um CAGR de 27,8% durante o período previsto de 2022-2029.
|
Métrica de Reporte |
Detalhes |
|
Período de previsão |
2022 a 2029 |
|
Ano base |
2021 |
|
Ano Histórico |
2020 (Personalizável para 2019-2014) |
|
Unidades quantitativas |
Receita em milhões de dólares americanos, preço em dólares americanos |
|
Segmentos abrangidos |
Por tipo de produto (sistema robótico, acessórios robóticos e software e serviços), utilizador final (hospitais e centros de cirurgia ambulatória (ASCS)), canal de distribuição (licitações diretas e distribuidores externos) |
|
Países abrangidos |
China, Coreia do Sul, Japão, Índia, Austrália, Singapura, Malásia, Indonésia, Tailândia, Filipinas, Resto da Ásia-Pacífico na Ásia-Pacífico. |
|
Atores do mercado abrangidos |
Johnson & Johnson Services, Inc., Stryker, Zimmer Biomet, Smith & Nephew, Corin Group, NuVasive, Inc., Brainlab AG, Integrity Implants Inc. d/b/a/ Accelus, Beijing Tinavi Medical Technologies Co., Ltd, Medtronic , Globus Medical, Inc., Accuray Incorporated, THINK Surgical, Inc., CUREXO, INC. |
Definição de Mercado
Os robôs cirúrgicos ortopédicos são utilizados para corrigir deformidades ósseas e restaurar a função do sistema esquelético humano. Utiliza energia como radiação, radiofrequência e ultrassons para selar a pele e o tecido ósseo. Os robôs cirúrgicos ortopédicos requerem uma fonte de energia, como um gerador eletrocirúrgico (ESU), e um instrumento para transferir a energia para o paciente. Os tipos importantes incluem a radiofrequência (RF), a corrente elétrica modificada e o ultrassom, que converte a corrente elétrica em movimento mecânico. As tecnologias mais especializadas incluem as que utilizam gás árgon, plasma ou uma combinação de tecnologias. Os avanços tecnológicos utilizados nos robôs cirúrgicos ortopédicos são o ultrassom, a radiofrequência e a radiação. A tecnologia de diagnóstico utilizada nos robôs cirúrgicos ortopédicos permitiu aos cirurgiões ortopédicos alcançar novos níveis de precisão e segurança. Permite ao cirurgião diagnosticar, planear e agilizar a cirurgia ortopédica para obter resultados excecionais.
Dinâmica do mercado de robôs cirúrgicos ortopédicos
Esta secção trata da compreensão dos impulsionadores, vantagens, oportunidades, restrições e desafios do mercado. Tudo isto é discutido em detalhe abaixo:
MOTORISTAS
- AUMENTO DA PREVALÊNCIA DA OSTEOPOROSE
A osteoporose é uma doença crónica que suprime os ossos. Se um indivíduo tem osteoporose, corre um risco mais elevado de fraturas ósseas súbitas e inesperadas. Em 2021, dados da Organização Mundial de Saúde (OMS) indicavam que cerca de 200 milhões de pessoas teriam osteoporose.
Embora a osteoporose afete homens e mulheres, as mulheres têm maior probabilidade de desenvolver osteoporose do que os homens. Para o tratamento da osteoporose, existem fraturas da anca e próteses do joelho, sendo importante compreender as condições de saúde física anteriores dos doentes idosos, como a redução da massa óssea e a fragilidade óssea. A frequência da osteoporose está a aumentar, pelo que a abordagem cirúrgica da osteoporose está a aumentar. O aspirador irrigador-largador é um tipo de peça de mão utilizada pelos cirurgiões ortopédicos. Por exemplo, a ferramenta elétrica de alto torque é um alargador utilizado para tratar a osteoporose.
Com o aumento da prevalência da osteoporose em todo o mundo, a procura de diagnóstico precoce da doença está também a aumentar, o que aumenta a procura de cuidados, serviços e tecnologias para tratar condições crónicas na velhice.
-
AUMENTO DO NÚMERO DE CIRURGIAS ORTOPÉDICAS
O aumento da população geriátrica e as perturbações ortopédicas como a osteoporose. Devido ao aumento dos distúrbios ortopédicos, o número de cirurgias relacionadas com a ortopedia também está a aumentar. O aumento do número de cirurgias ortopédicas aumentaria o número de cirurgiões ortopédicos. Isto aumentaria o uso de robôs cirúrgicos ortopédicos. Aumentaria a produção e o fornecimento de robôs cirúrgicos ortopédicos.
Os robôs cirúrgicos já estão a transformar o mercado de saúde. À medida que captam um volume crescente de procedimentos cirúrgicos, os centros de ambulatório forçarão a redução dos preços dos dispositivos de tecnologia médica e desencadearão mudanças para os pagadores e prestadores. Assim sendo, espera-se que o aumento do número de cirurgias ortopédicas impulsione o crescimento do mercado de robôs cirúrgicos ortopédicos.
RESTRIÇÕES
-
FALTA DE CONSCIENTIZAÇÃO SOBRE CIRURGIAS ORTOPÉDICAS
Embora os dispositivos de energia cirúrgica ortopédica se tenham posicionado como uma plataforma no mercado dos dispositivos não invasivos, a inexistência de cirurgias ortopédicas está presente nos países em desenvolvimento. Isto resultaria num atraso no diagnóstico da doença ortopédica e faria com que os robôs cirúrgicos ortopédicos tivessem uma posição inferior no mercado. A falta de sensibilização e autoeficácia também aumenta as potenciais barreiras e a implementação imperfeita.
-
RISCOS OBSERVADOS EM CIRURGIAS ORTOPÉDICAS
As cirurgias ortopédicas são realizadas por ortopedistas para curar distúrbios ortopédicos, vasos sanguíneos, cortar tecidos e estancar hemorragias. São dispositivos portáteis, pelo que devem ser operados como parte do instrumento do médico. Embora não ofereçam um diagnóstico, fornecem medicamentos que permitem um melhor tratamento. No entanto, existem certos riscos observados durante a realização de cirurgias ortopédicas.
No entanto, espera-se que a variedade de riscos e complicações de saúde associados à cirurgia ortopédica e a necessidade de intervenção cirúrgica adicional para corrigir alguns deles prejudiquem a sua procura no mercado. Desta forma, espera-se que as complicações de saúde associadas às cirurgias ortopédicas restrinjam o mercado dos robôs cirúrgicos ortopédicos.
OPORTUNIDADES
-
AUMENTO DAS POPULAÇÕES GERIÁTRICAS
As perturbações do joelho são comuns na população idosa em todo o mundo. Os adultos com 60 anos ou mais, principalmente aqueles que vivem em instituições de cuidados continuados, provavelmente sofrem de sintomas crónicos nos joelhos. À medida que o envelhecimento aumenta, a carga de distúrbios do joelho na população geriátrica pode aumentar, o que abre caminho para o desenvolvimento de medicamentos e implantes em estratégias de diagnóstico e prevenção essenciais para melhorar os distúrbios do joelho em adultos mais velhos.
À medida que a idade aumenta, aumenta também a suscetibilidade a perturbações do joelho e outros fatores de risco. Para algumas pessoas, pode ser hereditária, enquanto que, para outras, a osteoartrite do joelho pode resultar de uma lesão, infeção ou até mesmo de excesso de peso. Espera-se que o aumento da população geriátrica impulsione o crescimento do mercado, uma vez que levará a uma maior utilização de robôs em inúmeras cirurgias. Estes robôs foram introduzidos para satisfazer as necessidades das pessoas idosas, incluindo cuidados físicos e médicos. Além disso, a população idosa é muito afetada por doenças crónicas, o que pode ser um fator no crescimento do mercado de robôs cirúrgicos ortopédicos.
-
AUMENTO DAS DESPESAS COM A SAÚDE
O gasto de dinheiro utilizado por um país em cuidados de saúde e a sua taxa de crescimento ao longo do tempo são influenciados por uma grande variedade de factores económicos e sociais, incluindo os acordos de financiamento e a estrutura da organização do sistema de saúde. Em particular, existe uma forte associação entre o nível de rendimento total de um país e o montante que a população do país gasta em cuidados de saúde.
Os gastos com a saúde aumentaram nos países desenvolvidos e emergentes à medida que o rendimento disponível das pessoas aumenta. Quanto mais dinheiro se gasta em saúde, mais saudável é a população de um país. Além disso, para satisfazer as necessidades da população, os organismos governamentais e as organizações de saúde de diferentes regiões estão a tomar a iniciativa de acelerar os gastos com a saúde. Portanto, o aumento dos gastos com a saúde ajuda simultaneamente as organizações de saúde e os organismos governamentais a aumentar os serviços de gestão da saúde em vários aspetos.
DESAFIOS
-
FALTA DE PROFISSIONAIS QUALIFICADOS
A falta ou escassez de conhecimentos especializados desafiaria o ritmo de recuperação e crescimento num local. Muitas vezes, os desempregados num local têm competências escassas noutros locais. Além disso, o rápido avanço tecnológico neste campo leva também à falta de especialização. Apesar do apelo para aumentar, o número de podologistas e alguns programas de formação de residência permanecem desconhecidos.
Mesmo com o início do processo de revalidação para cirurgiões ortopédicos na Suíça, no Reino Unido e noutros países, alguns profissionais ortopédicos e médicos noutras partes da Europa não começaram a abordar a questão da CME e dos requisitos relacionados. Como as exigências de competências são muito elevadas, reter e gerir profissionais com competências específicas tornou-se um desafio. Além disso, o avanço tecnológico é outro aspeto que leva ao aumento da procura de profissionais qualificados. Os podologistas relatam necessidades significativas de cuidados de suporte não satisfeitas e barreiras nos seus centros, com apenas uma pequena minoria a classificar-se como competente na prestação de cuidados de suporte. Há uma necessidade urgente de podologistas e profissionais para tratar as doenças crónicas do joelho e obter recursos de cuidados de suporte disponíveis. A falta de profissionais formados e experientes e as persistentes lacunas de qualificação limitam as perspetivas de empregabilidade e o acesso a empregos de qualidade. Portanto, isto significa que a falta de profissionais qualificados é um desafio para o crescimento do mercado de robôs cirúrgicos ortopédicos.
-
QUADROS REGULAMENTARES RIGOROSOS
A regulamentação dos dispositivos médicos desempenha um papel significativo na área da saúde. A obtenção da aprovação necessária para a venda legal de dispositivos médicos em tais jurisdições pode implicar despesas financeiras significativas, que podem levar meses ou anos a serem concluídas. Se estas restrições não forem compreendidas ou consideradas, os atrasos podem comprometer seriamente a probabilidade de sucesso num mercado altamente competitivo. Os robôs médicos são cada vez mais utilizados em cirurgias minimamente invasivas; As cirurgias de apoio são importantes para tratar diversas doenças. Mas a sua aprovação e comercialização em diversas regiões exigem o cumprimento de normas regulamentares rigorosas e aprovações de várias entidades reguladoras.
Impacto pós-COVID-19 no mercado dos robôs cirúrgicos ortopédicos
A COVID-19 causou um grande impacto no mercado dos robôs cirúrgicos ortopédicos, uma vez que quase todos os países optaram pelo encerramento de todas as unidades de produção, exceto as que estão envolvidas na produção de produtos essenciais. O governo tomou algumas medidas rigorosas, como a paragem da produção e venda de bens não essenciais, bloqueou o comércio internacional e muitas outras para impedir a propagação da COVID-19. Os únicos negócios que estão a lidar com esta situação de pandemia são os serviços essenciais que estão autorizados a abrir e executar os processos.
O crescimento do mercado de robôs cirúrgicos ortopédicos da Ásia-Pacífico está a aumentar a prevalência da osteoporose. Este setor aumentou a procura porque tem como alvo os doentes com doenças ósseas. Outras razões que impulsionam a procura destes procedimentos são o aumento do envelhecimento da população e a crescente necessidade de unidades de saúde, o que pode resultar numa redução ainda maior da carga sobre as unidades de saúde. Assim sendo, estima-se um aumento da procura de procedimentos cirúrgicos com robôs durante o período previsto. No entanto, fatores como a disponibilidade inadequada de matéria-prima para satisfazer a procura de produção de produtos robóticos cirúrgicos ortopédicos estão a restringir o crescimento do mercado. A paragem das unidades de produção durante a situação de pandemia teve um impacto significativo no mercado.
Desenvolvimentos recentes
- Em fevereiro de 2022, a Stryker conclui a aquisição da Vocera Communications. Esta aquisição oferece oportunidades significativas para promover inovações e acelerar as nossas aspirações digitais. A Vocera traz um portefólio altamente complementar e inovador para a divisão médica da Stryker, que irá melhorar as ofertas de cuidados de saúde digitais avançados da empresa e promover ainda mais o foco da Stryker na prevenção de eventos adversos em todo o continuum de cuidados.
- Em março de 2022, o Corin Group anunciou que a empresa está a estabelecer uma parceria com a Efferent Health, LLC, líder em tecnologia de automatização de operações médicas, fornecendo soluções inovadoras que agilizam processos importantes. Isto resulta no fortalecimento do portfólio de serviços de dados de interoperabilidade, bem como na expansão da credibilidade da empresa no mercado.
Âmbito do mercado de robôs cirúrgicos ortopédicos da Ásia-Pacífico
O mercado de robôs cirúrgicos ortopédicos da Ásia-Pacífico está segmentado com base no tipo de produto, utilizador final e canal de distribuição. O crescimento entre estes segmentos irá ajudá-lo a analisar os principais segmentos de crescimento nos setores e fornecerá aos utilizadores uma visão geral e informações valiosas do mercado para os ajudar a tomar decisões estratégicas para identificar as principais aplicações do mercado.
Por tipo de produto
- Sistema Robótico
- Acessórios Robóticos
- Software e Serviços
Com base no tipo de produto, o mercado de robôs cirúrgicos ortopédicos da Ásia-Pacífico está segmentado em sistema robótico, acessórios robóticos e software e serviços.
Por utilizador final
- Hospitais
- Centros Cirúrgicos Ambulatoriais
Com base no utilizador final, o mercado de robôs cirúrgicos ortopédicos da Ásia-Pacífico foi segmentado em hospitais e centros de cirurgia ambulatória.
Por canal de distribuição
- Licitação Direta
- Distribuidores Terceirizados

Com base no canal de distribuição, o mercado de robôs cirúrgicos ortopédicos da Ásia-Pacífico foi segmentado em licitação direta e distribuidores terceirizados.
Análise regional/perspetivas do mercado de robôs cirúrgicos ortopédicos
O mercado de robôs cirúrgicos ortopédicos é analisado e são fornecidos insights e tendências sobre o tamanho do mercado por país, tipo de produto, utilizador final e canal de distribuição, conforme referenciado acima.
Os países abrangidos pelo relatório de mercado de robôs cirúrgicos ortopédicos da Ásia-Pacífico são a China, Coreia do Sul, Japão, Índia, Austrália, Singapura, Malásia, Indonésia, Tailândia, Filipinas e Resto da Ásia-Pacífico.
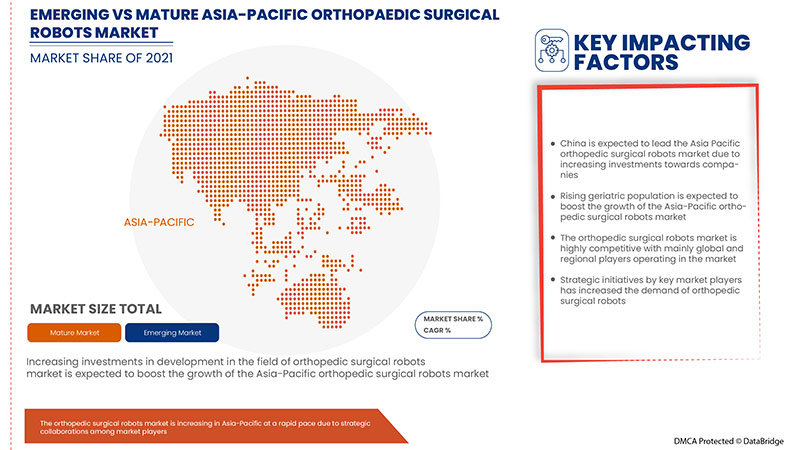
A China domina o mercado de robôs cirúrgicos ortopédicos da Ásia-Pacífico. A procura nesta região deverá ser impulsionada pela infra-estrutura de cuidados de saúde e pelas colaborações estratégicas entre os principais intervenientes no mercado da região.
A secção de países do relatório também fornece fatores individuais que impactam o mercado e alterações na regulamentação do mercado que impactam as tendências atuais e futuras do mercado. Pontos de dados como a análise da cadeia de valor a montante e a jusante, tendências técnicas e análise das cinco forças de Porter, estudos de caso são alguns dos indicadores utilizados para prever o cenário de mercado para países individuais. Além disso, a presença e a disponibilidade de marcas da Ásia-Pacífico e os seus desafios enfrentados devido à grande ou escassa concorrência de marcas locais e nacionais, ao impacto de tarifas domésticas e rotas comerciais são considerados ao fornecer uma análise de previsão dos dados do país .
Análise do panorama competitivo e da quota de mercado dos robôs cirúrgicos ortopédicos
O panorama competitivo do mercado de robôs cirúrgicos ortopédicos fornece detalhes por concorrente. Os detalhes incluídos são a visão geral da empresa, finanças da empresa, receitas geradas, potencial de mercado, investimento em investigação e desenvolvimento, novas iniciativas de mercado, presença na Ásia-Pacífico, localizações e instalações de produção, capacidades de produção, pontos fortes e fracos da empresa, lançamento do produto, amplitude e amplitude do produto , domínio da aplicação. Os pontos de dados fornecidos acima estão apenas relacionados com o foco das empresas no mercado dos robôs cirúrgicos ortopédicos.
Alguns dos principais participantes que operam no mercado dos robôs cirúrgicos ortopédicos são a Johnson & Johnson Services, Inc., a Stryker, a Zimmer Biomet, a Smith & Nephew, a Corin Group, a NuVasive, Inc., a Brainlab AG, a Integrity Implants Inc. d/b/a / Accelus, Beijing Tinavi Medical Technologies Co., Ltd, Medtronic, Globus Medical, Inc., Accuray Incorporated, THINK Surgical, Inc., CUREXO, INC.
SKU-
Obtenha acesso online ao relatório sobre a primeira nuvem de inteligência de mercado do mundo

- Painel interativo de análise de dados
- Painel de análise da empresa para oportunidades de elevado potencial de crescimento
- Acesso de analista de pesquisa para personalização e customização. consultas
- Análise da concorrência com painel interativo
- Últimas notícias, atualizações e atualizações Análise de tendências
- Aproveite o poder da análise de benchmark para um rastreio abrangente da concorrência
Índice
1 INTRODUCTION
1.1 OBJECTIVES OF THE STUDY
1.2 MARKET DEFINITION
1.3 OVERVIEW OF ASIA PACIFIC ORTHOPEDIC SURGICAL ROBOTS MARKET
1.4 CURRENCY AND PRICING
1.5 LIMITATIONS
1.6 MARKETS COVERED
2 MARKET SEGMENTATION
2.1 MARKETS COVERED
2.2 GEOGRAPHICAL SCOPE
2.3 YEARS CONSIDERED FOR THE STUDY
2.4 CURRENCY AND PRICING
2.5 DBMR TRIPOD DATA VALIDATION MODEL
2.6 MULTIVARIATE MODELLING
2.7 PRODUCTS LIFELINE CURVE
2.8 PRIMARY INTERVIEWS WITH KEY OPINION LEADERS
2.9 DBMR MARKET POSITION GRID
2.1 MARKET APPLICATION COVERAGE GRID
2.11 VENDOR SHARE ANALYSIS
2.12 SECONDARY SOURCES
2.13 ASSUMPTIONS
3 EXECUTIVE SUMMARY
4 PREMIUM INSIGHTS
4.1 PESTEL
4.2 PORTER'S FIVE FORCES
4.3 CLINICAL TRIALS ON ORTHOPEDIC SURGICAL ROBOTS ASIA PACIFICLY
4.4 STRATEGIC INITIATIVES
4.4.1 DEMOGRAPHIC TRENDS
4.4.2 KEY PATENT ENROLLMENT STRATEGIES
4.5 ASIA PACIFIC ORTHOPEDIC SURGICAL ROBOTS MARKET, REGULATORY FRAMEWORK
5 MARKET OVERVIEW
5.1 DRIVERS
5.1.1 RISING PREVALENCE OF OSTEOPOROSIS
5.1.2 GROWING TECHNOLOGICAL ADVANCEMENTS IN ROBOTIC SYSTEMS
5.1.3 INCREASE IN NUMBER OF ORTHOPEDIC SURGERIES
5.1.4 RISE IN INCIDENCE OF SPORTS AND TRAUMA INJURIES
5.2 RESTRAINTS
5.2.1 LACK OF AWARENESS ABOUT ORTHOPEDIC SURGERIES
5.2.2 RISKS OBSERVED IN ORTHOPEDIC SURGERIES
5.2.3 HIGH COST ASSOCIATED WITH THE ORTHOPEDIC SURGERY
5.3 OPPORTUNITIES
5.3.1 INCREASE IN GERIATRIC POPULATIONS
5.3.2 RISING HEALTHCARE EXPENDITURE
5.3.3 RISE IN FRACTURE INCIDENCE
5.4 CHALLENGES
5.4.1 LACK OF SKILLED PROFESSIONALS
5.4.2 STRICT REGULATORY FRAMEWORKS
6 ASIA PACIFIC ORTHOPEDIC SURGICAL ROBOTS MARKET, BY PRODUCT TYPE
6.1 OVERVIEW
6.2 ROBOTIC SYSTEMS
6.2.1 KNEE
6.2.1.1 SURGERY TYPE
6.2.1.1.1 TOTAL KNEE ARTHROPLASTY
6.2.1.1.2 UNICOMPARTMENTAL KNEE ARTHROPLASTY
6.2.1.1.3 ANTERIOR CRUCIATE LIGAMENT RECONSTRUCTION
6.2.1.1.4 OTHERS
6.2.1.1.5 ROBOT TYPE
6.2.1.1.6 MAKO
6.2.1.1.7 CORI
6.2.1.1.8 NAVIO
6.2.1.1.9 TIROBOT
6.2.1.1.10 TSOLUTION ONE
6.2.1.1.11 OTHERS
6.2.2 HIP
6.2.2.1 SURGERY TYPE
6.2.2.1.1 TOTAL HIP ARTHROPLASTY
6.2.2.1.2 OTHERS
6.2.2.1.3 ROBOT TYPE
6.2.2.1.4 MAKO
6.2.2.1.5 TSOLUTION ONE
6.2.2.1.6 OTHERS
6.2.3 SPINE
6.2.3.1 SURGERY TYPE
6.2.3.1.1 PEDICLE SCREW IMPLANTATION
6.2.3.1.2 VERTEBRAL AUGMENTATION
6.2.3.1.3 LAPAROSCOPIC ANTERIOR LUMBAR INTERBODY FUSION
6.2.3.1.4 SPINE TUMOR RESECTION SURGERY
6.2.3.1.5 INTRAOPERATIVE LOCALIZATION
6.2.3.1.6 ANTERIOR LUMBER INTERBODY FUSION
6.2.3.1.7 OTHERS
6.2.3.1.8 ROBOT TYPE
6.2.3.1.9 MAZOR
6.2.3.1.9.1 RENAISSANCE
6.2.3.1.9.2 MAZOR X
6.2.3.1.9.3 SPINE ASSIST
6.2.3.1.10 ROSA
6.2.3.1.11 CIRQ
6.2.3.1.12 EXCELSIUSGPS
6.2.3.1.13 OTHERS
6.2.4 FEMUR
6.2.4.1 SURGERY TYPE
6.2.4.1.1 FEMUR NECK CANNULATED SCREW PLACEMENT
6.2.4.1.2 INTRAMEDULLARY NAIL FIXATION
6.2.4.1.3 CORE DECOMPRESSION OF THE FEMORAL HEAD
6.2.4.1.4 OTHERS
6.2.4.1.5 ROBOT TYPE
6.2.4.1.6 TIROBOT
6.2.4.1.7 OTHERS
6.2.5 PELVIS
6.2.5.1 SURGERY TYPE
6.2.5.1.1 FEMUR NECK CANNULATED SCREW PLACEMENT
6.2.5.1.2 INTRAMEDULLARY NAIL FIXATION
6.2.5.1.3 CORE DECOMPRESSION OF THE FEMORAL HEAD
6.2.5.1.4 OTHERS
6.2.5.1.5 ROBOT TYPE
6.2.5.1.6 TIROBOT
6.2.5.1.7 OTHERS
6.2.6 HAND
6.2.6.1 SURGERY TYPE
6.2.6.1.1 FEMUR NECK CANNULATED SCREW PLACEMENT
6.2.6.1.2 INTRAMEDULLARY NAIL FIXATION
6.2.6.1.3 CORE DECOMPRESSION OF THE FEMORAL HEAD
6.2.6.1.4 OTHERS
6.2.6.1.5 ROBOT TYPE
6.2.6.1.6 TIROBOT
6.2.6.1.7 OTHERS
6.2.7 ELBOW
6.2.7.1 SURGERY TYPE
6.2.7.1.1 FEMUR NECK CANNULATED SCREW PLACEMENT
6.2.7.1.2 INTRAMEDULLARY NAIL FIXATION
6.2.7.1.3 CORE DECOMPRESSION OF THE FEMORAL HEAD
6.2.7.1.4 OTHERS
6.2.7.1.5 ROBOT TYPE
6.2.7.1.6 TIROBOT
6.2.7.1.7 OTHERS
6.2.8 OTHERS
6.3 ROBOTIC ACCESSORIES
6.4 SOFTWARE AND SERVICES
7 ASIA PACIFIC ORTHOPEDIC SURGICAL ROBOTS MARKET, BY END USER
7.1 OVERVIEW
7.2 HOSPITALS
7.2.1 ACTUE CARE HOSPITALS
7.2.2 LONG-TERM CARE HOSPITALS
7.2.3 NURSING FACILITIES
7.2.4 REHABILITATION CENTERS
7.3 AMBULATORY SURGICAL CENTERS
8 ASIA PACIFIC ORTHOPEDIC SURGICAL ROBOTS MARKET, BY DISTRIBUTION CHANNEL
8.1 OVERVIEW
8.2 DIRECT TENDER
8.3 THIRD PARTY DISTRIBUTORS
9 ASIA PACIFIC ORTHOPEDIC SURGICAL ROBOTS MARKET, BY REGION
9.1 ASIA-PACIFIC
9.1.1 CHINA
9.1.2 JAPAN
9.1.3 SOUTH KOREA
9.1.4 INDIA
9.1.5 AUSTRALIA
9.1.6 SINGAPORE
9.1.7 THAILAND
9.1.8 MALAYSIA
9.1.9 INDONESIA
9.1.10 PHILIPPINES
9.1.11 REST OF ASIA-PACIFIC
10 ASIA PACIFIC ORTHOPEDIC SURGICAL ROBOTS MARKET: COMPANY LANDSCAPE
10.1 COMPANY SHARE ANALYSIS: ASIA PACIFIC
11 SWOT ANALYSIS
12 COMPANY PROFILE
12.1 STRYKER
12.1.1 COMPANY SNAPSHOT
12.1.2 REVENUE ANALYSIS
12.1.3 COMPANY SHARE ANALYSIS
12.1.4 PRODUCT PORTFOLIO
12.1.5 RECENT DEVELOPMENTS
12.2 SMITH & NEPHEW
12.2.1 COMPANY SNAPSHOT
12.2.2 REVENUE ANALYSIS
12.2.3 COMPANY SHARE ANALYSIS
12.2.4 PRODUCT PORTFOLIO
12.2.5 RECENT DEVELOPMENTS
12.3 JOHNSON & JOHNSON SERVICES, INC.
12.3.1 COMPANY SNAPSHOT
12.3.2 REVENUE ANALYSIS
12.3.3 COMPANY SHARE ANALYSIS
12.3.4 PRODUCT PORTFOLIO
12.3.5 RECENT DEVELOPMENTS
12.4 MEDTRONIC
12.4.1 COMPANY SNAPSHOT
12.4.2 REVENUE ANALYSIS
12.4.3 COMPANY SHARE ANALYSIS
12.4.4 PRODUCT PORTFOLIO
12.4.5 RECENT DEVELOPMENT
12.5 ZIMMER BIOMET
12.5.1 COMPANY SNAPSHOT
12.5.2 REVENUE ANALYSIS
12.5.3 COMPANY SHARE ANALYSIS
12.5.4 PRODUCT PORTFOLIO
12.5.5 RECENT DEVELOPMENTS
12.6 ACCURAY INCORPORATED
12.6.1 COMPANY SNAPSHOT
12.6.2 REVENUE ANALYSIS
12.6.3 PRODUCT PORTFOLIO
12.6.4 RECENT DEVELOPMENT
12.7 BEIJING TINAVI MEDICAL TECHNOLOGIES CO., LTD.
12.7.1 COMPANY SNAPSHOT
12.7.2 PRODUCT PORTFOLIO
12.7.3 RECENT DEVELOPMENT
12.8 BRAINLAB AG
12.8.1 COMPANY SNAPSHOT
12.8.2 PRODUCT PORTFOLIO
12.8.3 RECENT DEVELOPMENTS
12.9 CORIN GROUP
12.9.1 COMPANY SNAPSHOT
12.9.2 PRODUCT PORTFOLIO
12.9.3 RECENT DEVELOPMENT
12.1 CUREXO, INC.
12.10.1 COMPANY SNAPSHOT
12.10.2 PRODUCT PORTFOLIO
12.10.3 RECENT DEVELOPMENTS
12.11 GLOBUS MEDICAL, INC.
12.11.1 COMPANY SNAPSHOT
12.11.2 REVENUE ANALYSIS
12.11.3 PRODUCT PORTFOLIO
12.11.4 RECENT DEVELOPMENTS
12.12 INTEGRITY IMPLANTS INC. D/B/A/ ACCELUS
12.12.1 COMPANY SNAPSHOT
12.12.2 PRODUCT PORTFOLIO
12.12.3 RECENT DEVELOPMENT
12.13 NUVASIVE, INC.
12.13.1 COMPANY SNAPSHOT
12.13.2 REVENUE ANALYSIS
12.13.3 PRODUCT PORTFOLIO
12.13.4 RECENT DEVELOPMENT
12.14 THINK SURGICAL, INC.
12.14.1 COMPANY SNAPSHOT
12.14.2 PRODUCT PORTFOLIO
12.14.3 RECENT DEVELOPMENTS
13 QUESTIONNAIRE
14 RELATED REPORTS
Lista de Tabela
TABLE 1 ASIA PACIFIC ORTHOPEDIC SURGICAL ROBOTS MARKET, BY PRODUCT TYPE, 2021-2029 (USD MILLION)
TABLE 2 ASIA PACIFIC ROBOTIC SYSTEMS IN ORTHOPEDIC SURGICAL ROBOTS MARKET, BY REGION, 2021-2029 (USD MILLION)
TABLE 3 ASIA PACIFIC ROBOTIC SYSTEMS IN ORTHOPEDIC SURGICAL ROBOTS MARKET, BY TYPE, 2020- 2029 (USD MILLION)
TABLE 4 ASIA PACIFIC KNEE IN ORTHOPEDIC SURGICAL ROBOTS MARKET, BY SURGERY TYPE, 2020- 2029 (USD MILLION)
TABLE 5 ASIA PACIFIC KNEE IN ORTHOPEDIC SURGICAL ROBOTS MARKET, BY ROBOT TYPE, 2020- 2029 (USD MILLION)
TABLE 6 ASIA PACIFIC KNEE IN ORTHOPEDIC SURGICAL ROBOTS MARKET, BY ROBOT TYPE, VOLUME, 2020- 2029 (UNITS)
TABLE 7 ASIA PACIFIC HIP IN ORTHOPEDIC SURGICAL ROBOTS MARKET, BY SURGERY TYPE, 2020- 2029 (USD MILLION)
TABLE 8 ASIA PACIFIC HIP IN ORTHOPEDIC SURGICAL ROBOTS MARKET, BY ROBOT TYPE, 2020- 2029 (USD MILLION)
TABLE 9 ASIA PACIFIC HIP IN ORTHOPEDIC SURGICAL ROBOTS MARKET, BY ROBOT TYPE, VOLUME, 2020- 2029 (UNITS)
TABLE 10 ASIA PACIFIC SPINE IN ORTHOPEDIC SURGICAL ROBOTS MARKET, BY SURGERY TYPE, 2020- 2029 (USD MILLION)
TABLE 11 ASIA PACIFIC SPINE IN ORTHOPEDIC SURGICAL ROBOTS MARKET, BY ROBOT TYPE, 2020- 2029 (USD MILLION)
TABLE 12 ASIA PACIFIC SPINE IN ORTHOPEDIC SURGICAL ROBOTS MARKET, BY ROBOT TYPE, VOLUME,2020- 2029 VOLUME, (UNITS)
TABLE 13 ASIA PACIFIC MAZOR IN ORTHOPEDIC SURGICAL ROBOTS MARKET, BY SURGERY TYPE, 2020- 2029 (USD MILLION)
TABLE 14 ASIA PACIFIC MAZOR IN ORTHOPEDIC SURGICAL ROBOTS MARKET, BY ROBOT TYPE, VOLUME,2020- 2029 (UNITS)
TABLE 15 ASIA PACIFIC FEMUR IN ORTHOPEDIC SURGICAL ROBOTS MARKET, BY SURGERY TYPE, 2020- 2029 (USD MILLION)
TABLE 16 ASIA PACIFIC FEMUR IN ORTHOPEDIC SURGICAL ROBOTS MARKET, BY ROBOT TYPE, 2020- 2029 (USD MILLION)
TABLE 17 ASIA PACIFIC FEMUR IN ORTHOPEDIC SURGICAL ROBOTS MARKET, BY ROBOT TYPE, VOLUME,2020- 2029 (UNITS)
TABLE 18 ASIA PACIFIC PELVIS IN ORTHOPEDIC SURGICAL ROBOTS MARKET, BY SURGERY TYPE, 2020- 2029 (USD MILLION)
TABLE 19 ASIA PACIFIC PELVIS IN ORTHOPEDIC SURGICAL ROBOTS MARKET, BY ROBOT TYPE, 2020- 2029 (USD MILLION)
TABLE 20 ASIA PACIFIC PELVIS IN ORTHOPEDIC SURGICAL ROBOTS MARKET, BY ROBOT TYPE, VOLUME,2020- 2029 (UNITS)
TABLE 21 ASIA PACIFIC HAND IN ORTHOPEDIC SURGICAL ROBOTS MARKET, BY SURGERY TYPE, 2020- 2029 (USD MILLION)
TABLE 22 ASIA PACIFIC HAND IN ORTHOPEDIC SURGICAL ROBOTS MARKET, BY ROBOT TYPE, 2020- 2029 (USD MILLION)
TABLE 23 ASIA PACIFIC HAND IN ORTHOPEDIC SURGICAL ROBOTS MARKET, BY ROBOT TYPE, VOLUME,2020- 2029 (UNITS)
TABLE 24 ASIA PACIFIC ELBOW IN ORTHOPEDIC SURGICAL ROBOTS MARKET, BY SURGERY TYPE, 2020- 2029 (USD MILLION)
TABLE 25 ASIA PACIFIC ELBOW IN ORTHOPEDIC SURGICAL ROBOTS MARKET, BY ROBOT TYPE, 2020- 2029 (USD MILLION)
TABLE 26 ASIA PACIFIC ELBOW IN ORTHOPEDIC SURGICAL ROBOTS MARKET, BY ROBOT TYPE, VOLUME,2020- 2029 (UNITS)
TABLE 27 ASIA PACIFIC ROBOTIC ACCESSORIES IN ORTHOPEDIC SURGICAL ROBOTS MARKET, BY REGION, 2021-2029 (USD MILLION)
TABLE 28 ASIA PACIFIC SOFTWARE AND DEVICES IN ORTHOPEDIC SURGICAL ROBOTS MARKET, BY REGION, 2021-2029 (USD MILLION)
TABLE 29 ASIA PACIFIC ORTHOPEDIC SURGICAL ROBOTS MARKET, BY END USER, 2020-2029 (USD MILLION)
TABLE 30 ASIA PACIFIC HOSPITALS IN ORTHOPEDIC SURGICAL ROBOTS MARKET, BY REGION, 2020-2029 (USD MILLION)
TABLE 31 ASIA PACIFIC HOSPITALS IN ORTHOPEDIC SURGICAL ROBOTS MARKET, BY END USER, 2020-2029 (USD MILLION)
TABLE 32 ASIA PACIFIC AMBULATORY SURGICAL CENTERS IN ORTHOPEDIC SURGICAL ROBOTS MARKET, BY REGION, 2020-2029 (USD MILLION)
TABLE 33 ASIA PACIFIC ORTHOPEDIC SURGICAL ROBOTS MARKET, BY DISTRIBUTION CHANNEL, 2020-2029 (USD MILLION)
TABLE 34 ASIA PACIFIC DIRECT TENDER IN ORTHOPEDIC SURGICAL ROBOTS MARKET, BY REGION, 2020-2029 (USD MILLION)
TABLE 35 ASIA PACIFIC THIRD PARTY DISTRIBUTORS IN ORTHOPEDIC SURGICAL ROBOTS MARKET, BY REGION, 2020-2029 (USD MILLION)
TABLE 36 ASIA-PACIFIC ORTHOPEDIC SURGICAL ROBOTS MARKET, BY COUNTRY, 2020-2029 (USD MILLION)
TABLE 37 ASIA-PACIFIC ORTHOPEDIC SURGICAL ROBOTS MARKET, BY PRODUCT TYPE, 2020-2029 (USD MILLION)
TABLE 38 ASIA-PACIFIC ROBOTIC SYSTEMS IN ORTHOPEDIC SURGICAL ROBOTS MARKET, BY APPLICATION, 2020-2029 (USD MILLION)
TABLE 39 ASIA-PACIFIC KNEE IN ORTHOPEDIC SURGICAL ROBOTS MARKET, BY SURGERY TYPE, 2020-2029 (USD MILLION)
TABLE 40 ASIA-PACIFIC KNEE IN ORTHOPEDIC SURGICAL ROBOTS MARKET, BY ROBOT TYPE, 2020-2029 (USD MILLION)
TABLE 41 ASIA-PACIFIC KNEE IN ORTHOPEDIC SURGICAL ROBOTS MARKET, BY ROBOT TYPE, VOLUME, 2020-2029 (UNITS)
TABLE 42 ASIA-PACIFIC HIP IN ORTHOPEDIC SURGICAL ROBOTS MARKET, BY SURGERY TYPE, 2020-2029 (USD MILLION)
TABLE 43 ASIA-PACIFIC HIP IN ORTHOPEDIC SURGICAL ROBOTS MARKET, BY ROBOT TYPE, 2020-2029 (USD MILLION)
TABLE 44 ASIA-PACIFIC HIP IN ORTHOPEDIC SURGICAL ROBOTS MARKET, BY ROBOT TYPE, VOLUME, 2020-2029 (UNITS)
TABLE 45 ASIA-PACIFIC SPINE IN ORTHOPEDIC SURGICAL ROBOTS MARKET, BY SURGERY TYPE, 2020-2029 (USD MILLION)
TABLE 46 ASIA-PACIFIC SPINE IN ORTHOPEDIC SURGICAL ROBOTS MARKET, BY ROBOT TYPE, 2020-2029 (USD MILLION)
TABLE 47 ASIA-PACIFIC SPINE IN ORTHOPEDIC SURGICAL ROBOTS MARKET, BY ROBOT TYPE, VOLUME, 2020-2029 (UNITS)
TABLE 48 ASIA-PACIFIC MAZOR IN ORTHOPEDIC SURGICAL ROBOTS MARKET, BY ROBOT TYPE, 2020-2029 (USD MILLION)
TABLE 49 ASIA-PACIFIC MAZOR IN ORTHOPEDIC SURGICAL ROBOTS MARKET, BY ROBOT TYPE, VOLUME, 2020-2029 (UNITS)
TABLE 50 ASIA-PACIFIC FEMUR IN ORTHOPEDIC SURGICAL ROBOTS MARKET, BY SURGERY TYPE, 2020-2029 (USD MILLION)
TABLE 51 ASIA-PACIFIC FEMUR IN ORTHOPEDIC SURGICAL ROBOTS MARKET, BY ROBOT TYPE, 2020-2029 (USD MILLION)
TABLE 52 ASIA-PACIFIC FEMUR IN ORTHOPEDIC SURGICAL ROBOTS MARKET, BY ROBOT TYPE, VOLUME, 2020-2029 (UNITS)
TABLE 53 ASIA-PACIFIC PELVIS IN ORTHOPEDIC SURGICAL ROBOTS MARKET, BY SURGERY TYPE, 2020-2029 (USD MILLION)
TABLE 54 ASIA-PACIFIC PELVIS IN ORTHOPEDIC SURGICAL ROBOTS MARKET, BY ROBOT TYPE, 2020-2029 (USD MILLION)
TABLE 55 ASIA-PACIFIC PELVIS IN ORTHOPEDIC SURGICAL ROBOTS MARKET, BY ROBOT TYPE, VOLUME, 2020-2029 (UNITS)
TABLE 56 ASIA-PACIFIC HAND IN ORTHOPEDIC SURGICAL ROBOTS MARKET, BY SURGERY TYPE, 2020-2029 (USD MILLION)
TABLE 57 ASIA-PACIFIC HAND IN ORTHOPEDIC SURGICAL ROBOTS MARKET, BY ROBOT TYPE, 2020-2029 (USD MILLION)
TABLE 58 ASIA-PACIFIC HAND IN ORTHOPEDIC SURGICAL ROBOTS MARKET, BY ROBOT TYPE, VOLUME, 2020-2029 (UNITS)
TABLE 59 ASIA-PACIFIC ELBOW IN ORTHOPEDIC SURGICAL ROBOTS MARKET, BY SURGERY TYPE, 2020-2029 (USD MILLION)
TABLE 60 ASIA-PACIFIC ELBOW IN ORTHOPEDIC SURGICAL ROBOTS MARKET, BY ROBOT TYPE, 2020-2029 (USD MILLION)
TABLE 61 ASIA-PACIFIC ELBOW IN ORTHOPEDIC SURGICAL ROBOTS MARKET, BY ROBOT TYPE, VOLUME, 2020-2029 (UNITS)
TABLE 62 ASIA-PACIFIC ORTHOPEDIC SURGICAL ROBOTS MARKET, BY END USER, 2020-2029 (USD MILLION)
TABLE 63 ASIA-PACIFIC ORTHOPEDIC SURGICAL ROBOTS MARKET, BY END USER, 2020-2029 (USD MILLION)
TABLE 64 ASIA-PACIFIC ORTHOPEDIC SURGICAL ROBOTS MARKET, BY DISTRIBUTION CHANNEL, 2020-2029 (USD MILLION)
TABLE 65 CHINA ORTHOPEDIC SURGICAL ROBOTS MARKET, BY PRODUCT TYPE, 2020-2029 (USD MILLION)
TABLE 66 CHINA ROBOTIC SYSTEMS IN ORTHOPEDIC SURGICAL ROBOTS MARKET, BY APPLICATION, 2020-2029 (USD MILLION)
TABLE 67 CHINA KNEE IN ORTHOPEDIC SURGICAL ROBOTS MARKET, BY SURGERY TYPE, 2020-2029 (USD MILLION)
TABLE 68 CHINA KNEE IN ORTHOPEDIC SURGICAL ROBOTS MARKET, BY ROBOT TYPE, 2020-2029 (USD MILLION)
TABLE 69 CHINA KNEE IN ORTHOPEDIC SURGICAL ROBOTS MARKET, BY ROBOT TYPE, VOLUME, 2020-2029 (UNITS)
TABLE 70 CHINA HIP IN ORTHOPEDIC SURGICAL ROBOTS MARKET, BY SURGERY TYPE, 2020-2029 (USD MILLION)
TABLE 71 CHINA HIP IN ORTHOPEDIC SURGICAL ROBOTS MARKET, BY ROBOT TYPE, 2020-2029 (USD MILLION)
TABLE 72 CHINA HIP IN ORTHOPEDIC SURGICAL ROBOTS MARKET, BY ROBOT TYPE, VOLUME, 2020-2029 (UNITS)
TABLE 73 CHINA SPINE IN ORTHOPEDIC SURGICAL ROBOTS MARKET, BY SURGERY TYPE, 2020-2029 (USD MILLION)
TABLE 74 CHINA SPINE IN ORTHOPEDIC SURGICAL ROBOTS MARKET, BY ROBOT TYPE, 2020-2029 (USD MILLION)
TABLE 75 CHINA SPINE IN ORTHOPEDIC SURGICAL ROBOTS MARKET, BY ROBOT TYPE, VOLUME, 2020-2029 (UNITS)
TABLE 76 CHINA MAZOR IN ORTHOPEDIC SURGICAL ROBOTS MARKET, BY ROBOT TYPE, 2020-2029 (USD MILLION)
TABLE 77 CHINA MAZOR IN ORTHOPEDIC SURGICAL ROBOTS MARKET, BY ROBOT TYPE, VOLUME, 2020-2029 (UNITS)
TABLE 78 CHINA FEMUR IN ORTHOPEDIC SURGICAL ROBOTS MARKET, BY SURGERY TYPE, 2020-2029 (USD MILLION)
TABLE 79 CHINA FEMUR IN ORTHOPEDIC SURGICAL ROBOTS MARKET, BY ROBOT TYPE, 2020-2029 (USD MILLION)
TABLE 80 CHINA FEMUR IN ORTHOPEDIC SURGICAL ROBOTS MARKET, BY ROBOT TYPE, VOLUME, 2020-2029 (UNITS)
TABLE 81 CHINA PELVIS IN ORTHOPEDIC SURGICAL ROBOTS MARKET, BY SURGERY TYPE, 2020-2029 (USD MILLION)
TABLE 82 CHINA PELVIS IN ORTHOPEDIC SURGICAL ROBOTS MARKET, BY ROBOT TYPE, 2020-2029 (USD MILLION)
TABLE 83 CHINA PELVIS IN ORTHOPEDIC SURGICAL ROBOTS MARKET, BY ROBOT TYPE, VOLUME, 2020-2029 (UNITS)
TABLE 84 CHINA HAND IN ORTHOPEDIC SURGICAL ROBOTS MARKET, BY SURGERY TYPE, 2020-2029 (USD MILLION)
TABLE 85 CHINA HAND IN ORTHOPEDIC SURGICAL ROBOTS MARKET, BY ROBOT TYPE, 2020-2029 (USD MILLION)
TABLE 86 CHINA HAND IN ORTHOPEDIC SURGICAL ROBOTS MARKET, BY ROBOT TYPE, VOLUME, 2020-2029 (UNITS)
TABLE 87 CHINA ELBOW IN ORTHOPEDIC SURGICAL ROBOTS MARKET, BY SURGERY TYPE, 2020-2029 (USD MILLION)
TABLE 88 CHINA ELBOW IN ORTHOPEDIC SURGICAL ROBOTS MARKET, BY ROBOT TYPE, 2020-2029 (USD MILLION)
TABLE 89 CHINA ELBOW IN ORTHOPEDIC SURGICAL ROBOTS MARKET, BY ROBOT TYPE, VOLUME, 2020-2029 (UNITS)
TABLE 90 CHINA ORTHOPEDIC SURGICAL ROBOTS MARKET, BY END USER, 2020-2029 (USD MILLION)
TABLE 91 CHINA ORTHOPEDIC SURGICAL ROBOTS MARKET, BY END USER, 2020-2029 (USD MILLION)
TABLE 92 CHINA ORTHOPEDIC SURGICAL ROBOTS MARKET, BY DISTRIBUTION CHANNEL, 2020-2029 (USD MILLION)
TABLE 93 JAPAN ORTHOPEDIC SURGICAL ROBOTS MARKET, BY PRODUCT TYPE, 2020-2029 (USD MILLION)
TABLE 94 JAPAN ROBOTIC SYSTEMS IN ORTHOPEDIC SURGICAL ROBOTS MARKET, BY APPLICATION, 2020-2029 (USD MILLION)
TABLE 95 JAPAN KNEE IN ORTHOPEDIC SURGICAL ROBOTS MARKET, BY SURGERY TYPE, 2020-2029 (USD MILLION)
TABLE 96 JAPAN KNEE IN ORTHOPEDIC SURGICAL ROBOTS MARKET, BY ROBOT TYPE, 2020-2029 (USD MILLION)
TABLE 97 JAPAN KNEE IN ORTHOPEDIC SURGICAL ROBOTS MARKET, BY ROBOT TYPE, VOLUME, 2020-2029 (UNITS)
TABLE 98 JAPAN HIP IN ORTHOPEDIC SURGICAL ROBOTS MARKET, BY SURGERY TYPE, 2020-2029 (USD MILLION)
TABLE 99 JAPAN HIP IN ORTHOPEDIC SURGICAL ROBOTS MARKET, BY ROBOT TYPE, 2020-2029 (USD MILLION)
TABLE 100 JAPAN HIP IN ORTHOPEDIC SURGICAL ROBOTS MARKET, BY ROBOT TYPE, VOLUME, 2020-2029 (UNITS)
TABLE 101 JAPAN SPINE IN ORTHOPEDIC SURGICAL ROBOTS MARKET, BY SURGERY TYPE, 2020-2029 (USD MILLION)
TABLE 102 JAPAN SPINE IN ORTHOPEDIC SURGICAL ROBOTS MARKET, BY ROBOT TYPE, 2020-2029 (USD MILLION)
TABLE 103 JAPAN SPINE IN ORTHOPEDIC SURGICAL ROBOTS MARKET, BY ROBOT TYPE, VOLUME, 2020-2029 (UNITS)
TABLE 104 JAPAN MAZOR IN ORTHOPEDIC SURGICAL ROBOTS MARKET, BY ROBOT TYPE, 2020-2029 (USD MILLION)
TABLE 105 JAPAN MAZOR IN ORTHOPEDIC SURGICAL ROBOTS MARKET, BY ROBOT TYPE, VOLUME, 2020-2029 (UNITS)
TABLE 106 JAPAN FEMUR IN ORTHOPEDIC SURGICAL ROBOTS MARKET, BY SURGERY TYPE, 2020-2029 (USD MILLION)
TABLE 107 JAPAN FEMUR IN ORTHOPEDIC SURGICAL ROBOTS MARKET, BY ROBOT TYPE, 2020-2029 (USD MILLION)
TABLE 108 JAPAN FEMUR IN ORTHOPEDIC SURGICAL ROBOTS MARKET, BY ROBOT TYPE, VOLUME, 2020-2029 (UNITS)
TABLE 109 JAPAN PELVIS IN ORTHOPEDIC SURGICAL ROBOTS MARKET, BY SURGERY TYPE, 2020-2029 (USD MILLION)
TABLE 110 JAPAN PELVIS IN ORTHOPEDIC SURGICAL ROBOTS MARKET, BY ROBOT TYPE, 2020-2029 (USD MILLION)
TABLE 111 JAPAN PELVIS IN ORTHOPEDIC SURGICAL ROBOTS MARKET, BY ROBOT TYPE, VOLUME, 2020-2029 (UNITS)
TABLE 112 JAPAN HAND IN ORTHOPEDIC SURGICAL ROBOTS MARKET, BY SURGERY TYPE, 2020-2029 (USD MILLION)
TABLE 113 JAPAN HAND IN ORTHOPEDIC SURGICAL ROBOTS MARKET, BY ROBOT TYPE, 2020-2029 (USD MILLION)
TABLE 114 JAPAN HAND IN ORTHOPEDIC SURGICAL ROBOTS MARKET, BY ROBOT TYPE, VOLUME, 2020-2029 (UNITS)
TABLE 115 JAPAN ELBOW IN ORTHOPEDIC SURGICAL ROBOTS MARKET, BY SURGERY TYPE, 2020-2029 (USD MILLION)
TABLE 116 JAPAN ELBOW IN ORTHOPEDIC SURGICAL ROBOTS MARKET, BY ROBOT TYPE, 2020-2029 (USD MILLION)
TABLE 117 JAPAN ELBOW IN ORTHOPEDIC SURGICAL ROBOTS MARKET, BY ROBOT TYPE, VOLUME, 2020-2029 (UNITS)
TABLE 118 JAPAN ORTHOPEDIC SURGICAL ROBOTS MARKET, BY END USER, 2020-2029 (USD MILLION)
TABLE 119 JAPAN ORTHOPEDIC SURGICAL ROBOTS MARKET, BY END USER, 2020-2029 (USD MILLION)
TABLE 120 JAPAN ORTHOPEDIC SURGICAL ROBOTS MARKET, BY DISTRIBUTION CHANNEL, 2020-2029 (USD MILLION)
TABLE 121 SOUTH KOREA ORTHOPEDIC SURGICAL ROBOTS MARKET, BY PRODUCT TYPE, 2020-2029 (USD MILLION)
TABLE 122 SOUTH KOREA ROBOTIC SYSTEMS IN ORTHOPEDIC SURGICAL ROBOTS MARKET, BY APPLICATION, 2020-2029 (USD MILLION)
TABLE 123 SOUTH KOREA KNEE IN ORTHOPEDIC SURGICAL ROBOTS MARKET, BY SURGERY TYPE, 2020-2029 (USD MILLION)
TABLE 124 SOUTH KOREA KNEE IN ORTHOPEDIC SURGICAL ROBOTS MARKET, BY ROBOT TYPE, 2020-2029 (USD MILLION)
TABLE 125 SOUTH KOREA KNEE IN ORTHOPEDIC SURGICAL ROBOTS MARKET, BY ROBOT TYPE, VOLUME, 2020-2029 (UNITS)
TABLE 126 SOUTH KOREA HIP IN ORTHOPEDIC SURGICAL ROBOTS MARKET, BY SURGERY TYPE, 2020-2029 (USD MILLION)
TABLE 127 SOUTH KOREA HIP IN ORTHOPEDIC SURGICAL ROBOTS MARKET, BY ROBOT TYPE, 2020-2029 (USD MILLION)
TABLE 128 SOUTH KOREA HIP IN ORTHOPEDIC SURGICAL ROBOTS MARKET, BY ROBOT TYPE, VOLUME, 2020-2029 (UNITS)
TABLE 129 SOUTH KOREA SPINE IN ORTHOPEDIC SURGICAL ROBOTS MARKET, BY SURGERY TYPE, 2020-2029 (USD MILLION)
TABLE 130 SOUTH KOREA SPINE IN ORTHOPEDIC SURGICAL ROBOTS MARKET, BY ROBOT TYPE, 2020-2029 (USD MILLION)
TABLE 131 SOUTH KOREA SPINE IN ORTHOPEDIC SURGICAL ROBOTS MARKET, BY ROBOT TYPE, VOLUME, 2020-2029 (UNITS)
TABLE 132 SOUTH KOREA MAZOR IN ORTHOPEDIC SURGICAL ROBOTS MARKET, BY ROBOT TYPE, 2020-2029 (USD MILLION)
TABLE 133 SOUTH KOREA MAZOR IN ORTHOPEDIC SURGICAL ROBOTS MARKET, BY ROBOT TYPE, VOLUME, 2020-2029 (UNITS)
TABLE 134 SOUTH KOREA FEMUR IN ORTHOPEDIC SURGICAL ROBOTS MARKET, BY SURGERY TYPE, 2020-2029 (USD MILLION)
TABLE 135 SOUTH KOREA FEMUR IN ORTHOPEDIC SURGICAL ROBOTS MARKET, BY ROBOT TYPE, 2020-2029 (USD MILLION)
TABLE 136 SOUTH KOREA FEMUR IN ORTHOPEDIC SURGICAL ROBOTS MARKET, BY ROBOT TYPE, VOLUME, 2020-2029 (UNITS)
TABLE 137 SOUTH KOREA PELVIS IN ORTHOPEDIC SURGICAL ROBOTS MARKET, BY SURGERY TYPE, 2020-2029 (USD MILLION)
TABLE 138 SOUTH KOREA PELVIS IN ORTHOPEDIC SURGICAL ROBOTS MARKET, BY ROBOT TYPE, 2020-2029 (USD MILLION)
TABLE 139 SOUTH KOREA PELVIS IN ORTHOPEDIC SURGICAL ROBOTS MARKET, BY ROBOT TYPE, VOLUME, 2020-2029 (UNITS)
TABLE 140 SOUTH KOREA HAND IN ORTHOPEDIC SURGICAL ROBOTS MARKET, BY SURGERY TYPE, 2020-2029 (USD MILLION)
TABLE 141 SOUTH KOREA HAND IN ORTHOPEDIC SURGICAL ROBOTS MARKET, BY ROBOT TYPE, 2020-2029 (USD MILLION)
TABLE 142 SOUTH KOREA HAND IN ORTHOPEDIC SURGICAL ROBOTS MARKET, BY ROBOT TYPE, VOLUME, 2020-2029 (UNITS)
TABLE 143 SOUTH KOREA ELBOW IN ORTHOPEDIC SURGICAL ROBOTS MARKET, BY SURGERY TYPE, 2020-2029 (USD MILLION)
TABLE 144 SOUTH KOREA ELBOW IN ORTHOPEDIC SURGICAL ROBOTS MARKET, BY ROBOT TYPE, 2020-2029 (USD MILLION)
TABLE 145 SOUTH KOREA ELBOW IN ORTHOPEDIC SURGICAL ROBOTS MARKET, BY ROBOT TYPE, VOLUME, 2020-2029 (UNITS)
TABLE 146 SOUTH KOREA ORTHOPEDIC SURGICAL ROBOTS MARKET, BY END USER, 2020-2029 (USD MILLION)
TABLE 147 SOUTH KOREA ORTHOPEDIC SURGICAL ROBOTS MARKET, BY END USER, 2020-2029 (USD MILLION)
TABLE 148 SOUTH KOREA ORTHOPEDIC SURGICAL ROBOTS MARKET, BY DISTRIBUTION CHANNEL, 2020-2029 (USD MILLION)
TABLE 149 INDIA ORTHOPEDIC SURGICAL ROBOTS MARKET, BY PRODUCT TYPE, 2020-2029 (USD MILLION)
TABLE 150 INDIA ROBOTIC SYSTEMS IN ORTHOPEDIC SURGICAL ROBOTS MARKET, BY APPLICATION, 2020-2029 (USD MILLION)
TABLE 151 INDIA KNEE IN ORTHOPEDIC SURGICAL ROBOTS MARKET, BY SURGERY TYPE, 2020-2029 (USD MILLION)
TABLE 152 INDIA KNEE IN ORTHOPEDIC SURGICAL ROBOTS MARKET, BY ROBOT TYPE, 2020-2029 (USD MILLION)
TABLE 153 INDIA KNEE IN ORTHOPEDIC SURGICAL ROBOTS MARKET, BY ROBOT TYPE, VOLUME, 2020-2029 (UNITS)
TABLE 154 INDIA HIP IN ORTHOPEDIC SURGICAL ROBOTS MARKET, BY SURGERY TYPE, 2020-2029 (USD MILLION)
TABLE 155 INDIA HIP IN ORTHOPEDIC SURGICAL ROBOTS MARKET, BY ROBOT TYPE, 2020-2029 (USD MILLION)
TABLE 156 INDIA HIP IN ORTHOPEDIC SURGICAL ROBOTS MARKET, BY ROBOT TYPE, VOLUME, 2020-2029 (UNITS)
TABLE 157 INDIA SPINE IN ORTHOPEDIC SURGICAL ROBOTS MARKET, BY SURGERY TYPE, 2020-2029 (USD MILLION)
TABLE 158 INDIA SPINE IN ORTHOPEDIC SURGICAL ROBOTS MARKET, BY ROBOT TYPE, 2020-2029 (USD MILLION)
TABLE 159 INDIA SPINE IN ORTHOPEDIC SURGICAL ROBOTS MARKET, BY ROBOT TYPE, VOLUME, 2020-2029 (UNITS)
TABLE 160 INDIA MAZOR IN ORTHOPEDIC SURGICAL ROBOTS MARKET, BY ROBOT TYPE, 2020-2029 (USD MILLION)
TABLE 161 INDIA MAZOR IN ORTHOPEDIC SURGICAL ROBOTS MARKET, BY ROBOT TYPE, VOLUME, 2020-2029 (UNITS)
TABLE 162 INDIA FEMUR IN ORTHOPEDIC SURGICAL ROBOTS MARKET, BY SURGERY TYPE, 2020-2029 (USD MILLION)
TABLE 163 INDIA FEMUR IN ORTHOPEDIC SURGICAL ROBOTS MARKET, BY ROBOT TYPE, 2020-2029 (USD MILLION)
TABLE 164 INDIA FEMUR IN ORTHOPEDIC SURGICAL ROBOTS MARKET, BY ROBOT TYPE, VOLUME, 2020-2029 (UNITS)
TABLE 165 INDIA PELVIS IN ORTHOPEDIC SURGICAL ROBOTS MARKET, BY SURGERY TYPE, 2020-2029 (USD MILLION)
TABLE 166 INDIA PELVIS IN ORTHOPEDIC SURGICAL ROBOTS MARKET, BY ROBOT TYPE, 2020-2029 (USD MILLION)
TABLE 167 INDIA PELVIS IN ORTHOPEDIC SURGICAL ROBOTS MARKET, BY ROBOT TYPE, VOLUME, 2020-2029 (UNITS)
TABLE 168 INDIA HAND IN ORTHOPEDIC SURGICAL ROBOTS MARKET, BY SURGERY TYPE, 2020-2029 (USD MILLION)
TABLE 169 INDIA HAND IN ORTHOPEDIC SURGICAL ROBOTS MARKET, BY ROBOT TYPE, 2020-2029 (USD MILLION)
TABLE 170 INDIA HAND IN ORTHOPEDIC SURGICAL ROBOTS MARKET, BY ROBOT TYPE, VOLUME, 2020-2029 (UNITS)
TABLE 171 INDIA ELBOW IN ORTHOPEDIC SURGICAL ROBOTS MARKET, BY SURGERY TYPE, 2020-2029 (USD MILLION)
TABLE 172 INDIA ELBOW IN ORTHOPEDIC SURGICAL ROBOTS MARKET, BY ROBOT TYPE, 2020-2029 (USD MILLION)
TABLE 173 INDIA ELBOW IN ORTHOPEDIC SURGICAL ROBOTS MARKET, BY ROBOT TYPE, VOLUME, 2020-2029 (UNITS)
TABLE 174 INDIA ORTHOPEDIC SURGICAL ROBOTS MARKET, BY END USER, 2020-2029 (USD MILLION)
TABLE 175 INDIA ORTHOPEDIC SURGICAL ROBOTS MARKET, BY END USER, 2020-2029 (USD MILLION)
TABLE 176 INDIA ORTHOPEDIC SURGICAL ROBOTS MARKET, BY DISTRIBUTION CHANNEL, 2020-2029 (USD MILLION)
TABLE 177 AUSTRALIA ORTHOPEDIC SURGICAL ROBOTS MARKET, BY PRODUCT TYPE, 2020-2029 (USD MILLION)
TABLE 178 AUSTRALIA ROBOTIC SYSTEMS IN ORTHOPEDIC SURGICAL ROBOTS MARKET, BY APPLICATION, 2020-2029 (USD MILLION)
TABLE 179 AUSTRALIA KNEE IN ORTHOPEDIC SURGICAL ROBOTS MARKET, BY SURGERY TYPE, 2020-2029 (USD MILLION)
TABLE 180 AUSTRALIA KNEE IN ORTHOPEDIC SURGICAL ROBOTS MARKET, BY ROBOT TYPE, 2020-2029 (USD MILLION)
TABLE 181 AUSTRALIA KNEE IN ORTHOPEDIC SURGICAL ROBOTS MARKET, BY ROBOT TYPE, VOLUME, 2020-2029 (UNITS)
TABLE 182 AUSTRALIA HIP IN ORTHOPEDIC SURGICAL ROBOTS MARKET, BY SURGERY TYPE, 2020-2029 (USD MILLION)
TABLE 183 AUSTRALIA HIP IN ORTHOPEDIC SURGICAL ROBOTS MARKET, BY ROBOT TYPE, 2020-2029 (USD MILLION)
TABLE 184 AUSTRALIA HIP IN ORTHOPEDIC SURGICAL ROBOTS MARKET, BY ROBOT TYPE, VOLUME, 2020-2029 (UNITS)
TABLE 185 AUSTRALIA SPINE IN ORTHOPEDIC SURGICAL ROBOTS MARKET, BY SURGERY TYPE, 2020-2029 (USD MILLION)
TABLE 186 AUSTRALIA SPINE IN ORTHOPEDIC SURGICAL ROBOTS MARKET, BY ROBOT TYPE, 2020-2029 (USD MILLION)
TABLE 187 AUSTRALIA SPINE IN ORTHOPEDIC SURGICAL ROBOTS MARKET, BY ROBOT TYPE, VOLUME, 2020-2029 (UNITS)
TABLE 188 AUSTRALIA MAZOR IN ORTHOPEDIC SURGICAL ROBOTS MARKET, BY ROBOT TYPE, 2020-2029 (USD MILLION)
TABLE 189 AUSTRALIA MAZOR IN ORTHOPEDIC SURGICAL ROBOTS MARKET, BY ROBOT TYPE, VOLUME, 2020-2029 (UNITS)
TABLE 190 AUSTRALIA FEMUR IN ORTHOPEDIC SURGICAL ROBOTS MARKET, BY SURGERY TYPE, 2020-2029 (USD MILLION)
TABLE 191 AUSTRALIA FEMUR IN ORTHOPEDIC SURGICAL ROBOTS MARKET, BY ROBOT TYPE, 2020-2029 (USD MILLION)
TABLE 192 AUSTRALIA FEMUR IN ORTHOPEDIC SURGICAL ROBOTS MARKET, BY ROBOT TYPE, VOLUME, 2020-2029 (UNITS)
TABLE 193 AUSTRALIA PELVIS IN ORTHOPEDIC SURGICAL ROBOTS MARKET, BY SURGERY TYPE, 2020-2029 (USD MILLION)
TABLE 194 AUSTRALIA PELVIS IN ORTHOPEDIC SURGICAL ROBOTS MARKET, BY ROBOT TYPE, 2020-2029 (USD MILLION)
TABLE 195 AUSTRALIA PELVIS IN ORTHOPEDIC SURGICAL ROBOTS MARKET, BY ROBOT TYPE, VOLUME, 2020-2029 (UNITS)
TABLE 196 AUSTRALIA HAND IN ORTHOPEDIC SURGICAL ROBOTS MARKET, BY SURGERY TYPE, 2020-2029 (USD MILLION)
TABLE 197 AUSTRALIA HAND IN ORTHOPEDIC SURGICAL ROBOTS MARKET, BY ROBOT TYPE, 2020-2029 (USD MILLION)
TABLE 198 AUSTRALIA HAND IN ORTHOPEDIC SURGICAL ROBOTS MARKET, BY ROBOT TYPE, VOLUME, 2020-2029 (UNITS)
TABLE 199 AUSTRALIA ELBOW IN ORTHOPEDIC SURGICAL ROBOTS MARKET, BY SURGERY TYPE, 2020-2029 (USD MILLION)
TABLE 200 AUSTRALIA ELBOW IN ORTHOPEDIC SURGICAL ROBOTS MARKET, BY ROBOT TYPE, 2020-2029 (USD MILLION)
TABLE 201 AUSTRALIA ELBOW IN ORTHOPEDIC SURGICAL ROBOTS MARKET, BY ROBOT TYPE, VOLUME, 2020-2029 (UNITS)
TABLE 202 AUSTRALIA ORTHOPEDIC SURGICAL ROBOTS MARKET, BY END USER, 2020-2029 (USD MILLION)
TABLE 203 AUSTRALIA ORTHOPEDIC SURGICAL ROBOTS MARKET, BY END USER, 2020-2029 (USD MILLION)
TABLE 204 AUSTRALIA ORTHOPEDIC SURGICAL ROBOTS MARKET, BY DISTRIBUTION CHANNEL, 2020-2029 (USD MILLION)
TABLE 205 SINGAPORE ORTHOPEDIC SURGICAL ROBOTS MARKET, BY PRODUCT TYPE, 2020-2029 (USD MILLION)
TABLE 206 SINGAPORE ROBOTIC SYSTEMS IN ORTHOPEDIC SURGICAL ROBOTS MARKET, BY APPLICATION, 2020-2029 (USD MILLION)
TABLE 207 SINGAPORE KNEE IN ORTHOPEDIC SURGICAL ROBOTS MARKET, BY SURGERY TYPE, 2020-2029 (USD MILLION)
TABLE 208 SINGAPORE KNEE IN ORTHOPEDIC SURGICAL ROBOTS MARKET, BY ROBOT TYPE, 2020-2029 (USD MILLION)
TABLE 209 SINGAPORE KNEE IN ORTHOPEDIC SURGICAL ROBOTS MARKET, BY ROBOT TYPE, VOLUME, 2020-2029 (UNITS)
TABLE 210 SINGAPORE HIP IN ORTHOPEDIC SURGICAL ROBOTS MARKET, BY SURGERY TYPE, 2020-2029 (USD MILLION)
TABLE 211 SINGAPORE HIP IN ORTHOPEDIC SURGICAL ROBOTS MARKET, BY ROBOT TYPE, 2020-2029 (USD MILLION)
TABLE 212 SINGAPORE HIP IN ORTHOPEDIC SURGICAL ROBOTS MARKET, BY ROBOT TYPE, VOLUME, 2020-2029 (UNITS)
TABLE 213 SINGAPORE SPINE IN ORTHOPEDIC SURGICAL ROBOTS MARKET, BY SURGERY TYPE, 2020-2029 (USD MILLION)
TABLE 214 SINGAPORE SPINE IN ORTHOPEDIC SURGICAL ROBOTS MARKET, BY ROBOT TYPE, 2020-2029 (USD MILLION)
TABLE 215 SINGAPORE SPINE IN ORTHOPEDIC SURGICAL ROBOTS MARKET, BY ROBOT TYPE, VOLUME, 2020-2029 (UNITS)
TABLE 216 SINGAPORE MAZOR IN ORTHOPEDIC SURGICAL ROBOTS MARKET, BY ROBOT TYPE, 2020-2029 (USD MILLION)
TABLE 217 SINGAPORE MAZOR IN ORTHOPEDIC SURGICAL ROBOTS MARKET, BY ROBOT TYPE, VOLUME, 2020-2029 (UNITS)
TABLE 218 SINGAPORE FEMUR IN ORTHOPEDIC SURGICAL ROBOTS MARKET, BY SURGERY TYPE, 2020-2029 (USD MILLION)
TABLE 219 SINGAPORE FEMUR IN ORTHOPEDIC SURGICAL ROBOTS MARKET, BY ROBOT TYPE, 2020-2029 (USD MILLION)
TABLE 220 SINGAPORE FEMUR IN ORTHOPEDIC SURGICAL ROBOTS MARKET, BY ROBOT TYPE, VOLUME, 2020-2029 (UNITS)
TABLE 221 SINGAPORE PELVIS IN ORTHOPEDIC SURGICAL ROBOTS MARKET, BY SURGERY TYPE, 2020-2029 (USD MILLION)
TABLE 222 SINGAPORE PELVIS IN ORTHOPEDIC SURGICAL ROBOTS MARKET, BY ROBOT TYPE, 2020-2029 (USD MILLION)
TABLE 223 SINGAPORE PELVIS IN ORTHOPEDIC SURGICAL ROBOTS MARKET, BY ROBOT TYPE, VOLUME, 2020-2029 (UNITS)
TABLE 224 SINGAPORE HAND IN ORTHOPEDIC SURGICAL ROBOTS MARKET, BY SURGERY TYPE, 2020-2029 (USD MILLION)
TABLE 225 SINGAPORE HAND IN ORTHOPEDIC SURGICAL ROBOTS MARKET, BY ROBOT TYPE, 2020-2029 (USD MILLION)
TABLE 226 SINGAPORE HAND IN ORTHOPEDIC SURGICAL ROBOTS MARKET, BY ROBOT TYPE, VOLUME, 2020-2029 (UNITS)
TABLE 227 SINGAPORE ELBOW IN ORTHOPEDIC SURGICAL ROBOTS MARKET, BY SURGERY TYPE, 2020-2029 (USD MILLION)
TABLE 228 SINGAPORE ELBOW IN ORTHOPEDIC SURGICAL ROBOTS MARKET, BY ROBOT TYPE, 2020-2029 (USD MILLION)
TABLE 229 SINGAPORE ELBOW IN ORTHOPEDIC SURGICAL ROBOTS MARKET, BY ROBOT TYPE, VOLUME, 2020-2029 (UNITS)
TABLE 230 SINGAPORE ORTHOPEDIC SURGICAL ROBOTS MARKET, BY END USER, 2020-2029 (USD MILLION)
TABLE 231 SINGAPORE ORTHOPEDIC SURGICAL ROBOTS MARKET, BY END USER, 2020-2029 (USD MILLION)
TABLE 232 SINGAPORE ORTHOPEDIC SURGICAL ROBOTS MARKET, BY DISTRIBUTION CHANNEL, 2020-2029 (USD MILLION)
TABLE 233 THAILAND ORTHOPEDIC SURGICAL ROBOTS MARKET, BY PRODUCT TYPE, 2020-2029 (USD MILLION)
TABLE 234 THAILAND ROBOTIC SYSTEMS IN ORTHOPEDIC SURGICAL ROBOTS MARKET, BY APPLICATION, 2020-2029 (USD MILLION)
TABLE 235 THAILAND KNEE IN ORTHOPEDIC SURGICAL ROBOTS MARKET, BY SURGERY TYPE, 2020-2029 (USD MILLION)
TABLE 236 THAILAND KNEE IN ORTHOPEDIC SURGICAL ROBOTS MARKET, BY ROBOT TYPE, 2020-2029 (USD MILLION)
TABLE 237 THAILAND KNEE IN ORTHOPEDIC SURGICAL ROBOTS MARKET, BY ROBOT TYPE, VOLUME, 2020-2029 (UNITS)
TABLE 238 THAILAND HIP IN ORTHOPEDIC SURGICAL ROBOTS MARKET, BY SURGERY TYPE, 2020-2029 (USD MILLION)
TABLE 239 THAILAND HIP IN ORTHOPEDIC SURGICAL ROBOTS MARKET, BY ROBOT TYPE, 2020-2029 (USD MILLION)
TABLE 240 THAILAND HIP IN ORTHOPEDIC SURGICAL ROBOTS MARKET, BY ROBOT TYPE, VOLUME, 2020-2029 (UNITS)
TABLE 241 THAILAND SPINE IN ORTHOPEDIC SURGICAL ROBOTS MARKET, BY SURGERY TYPE, 2020-2029 (USD MILLION)
TABLE 242 THAILAND SPINE IN ORTHOPEDIC SURGICAL ROBOTS MARKET, BY ROBOT TYPE, 2020-2029 (USD MILLION)
TABLE 243 THAILAND SPINE IN ORTHOPEDIC SURGICAL ROBOTS MARKET, BY ROBOT TYPE, VOLUME, 2020-2029 (UNITS)
TABLE 244 THAILAND MAZOR IN ORTHOPEDIC SURGICAL ROBOTS MARKET, BY ROBOT TYPE, 2020-2029 (USD MILLION)
TABLE 245 THAILAND MAZOR IN ORTHOPEDIC SURGICAL ROBOTS MARKET, BY ROBOT TYPE, VOLUME, 2020-2029 (UNITS)
TABLE 246 THAILAND FEMUR IN ORTHOPEDIC SURGICAL ROBOTS MARKET, BY SURGERY TYPE, 2020-2029 (USD MILLION)
TABLE 247 THAILAND FEMUR IN ORTHOPEDIC SURGICAL ROBOTS MARKET, BY ROBOT TYPE, 2020-2029 (USD MILLION)
TABLE 248 THAILAND FEMUR IN ORTHOPEDIC SURGICAL ROBOTS MARKET, BY ROBOT TYPE, VOLUME, 2020-2029 (UNITS)
TABLE 249 THAILAND PELVIS IN ORTHOPEDIC SURGICAL ROBOTS MARKET, BY SURGERY TYPE, 2020-2029 (USD MILLION)
TABLE 250 THAILAND PELVIS IN ORTHOPEDIC SURGICAL ROBOTS MARKET, BY ROBOT TYPE, 2020-2029 (USD MILLION)
TABLE 251 THAILAND PELVIS IN ORTHOPEDIC SURGICAL ROBOTS MARKET, BY ROBOT TYPE, VOLUME, 2020-2029 (UNITS)
TABLE 252 THAILAND HAND IN ORTHOPEDIC SURGICAL ROBOTS MARKET, BY SURGERY TYPE, 2020-2029 (USD MILLION)
TABLE 253 THAILAND HAND IN ORTHOPEDIC SURGICAL ROBOTS MARKET, BY ROBOT TYPE, 2020-2029 (USD MILLION)
TABLE 254 THAILAND HAND IN ORTHOPEDIC SURGICAL ROBOTS MARKET, BY ROBOT TYPE, VOLUME, 2020-2029 (UNITS)
TABLE 255 THAILAND ELBOW IN ORTHOPEDIC SURGICAL ROBOTS MARKET, BY SURGERY TYPE, 2020-2029 (USD MILLION)
TABLE 256 THAILAND ELBOW IN ORTHOPEDIC SURGICAL ROBOTS MARKET, BY ROBOT TYPE, 2020-2029 (USD MILLION)
TABLE 257 THAILAND ELBOW IN ORTHOPEDIC SURGICAL ROBOTS MARKET, BY ROBOT TYPE, VOLUME, 2020-2029 (UNITS)
TABLE 258 THAILAND ORTHOPEDIC SURGICAL ROBOTS MARKET, BY END USER, 2020-2029 (USD MILLION)
TABLE 259 THAILAND ORTHOPEDIC SURGICAL ROBOTS MARKET, BY END USER, 2020-2029 (USD MILLION)
TABLE 260 THAILAND ORTHOPEDIC SURGICAL ROBOTS MARKET, BY DISTRIBUTION CHANNEL, 2020-2029 (USD MILLION)
TABLE 261 MALAYSIA ORTHOPEDIC SURGICAL ROBOTS MARKET, BY PRODUCT TYPE, 2020-2029 (USD MILLION)
TABLE 262 MALAYSIA ROBOTIC SYSTEMS IN ORTHOPEDIC SURGICAL ROBOTS MARKET, BY APPLICATION, 2020-2029 (USD MILLION)
TABLE 263 MALAYSIA KNEE IN ORTHOPEDIC SURGICAL ROBOTS MARKET, BY SURGERY TYPE, 2020-2029 (USD MILLION)
TABLE 264 MALAYSIA KNEE IN ORTHOPEDIC SURGICAL ROBOTS MARKET, BY ROBOT TYPE, 2020-2029 (USD MILLION)
TABLE 265 MALAYSIA KNEE IN ORTHOPEDIC SURGICAL ROBOTS MARKET, BY ROBOT TYPE, VOLUME, 2020-2029 (UNITS)
TABLE 266 MALAYSIA HIP IN ORTHOPEDIC SURGICAL ROBOTS MARKET, BY SURGERY TYPE, 2020-2029 (USD MILLION)
TABLE 267 MALAYSIA HIP IN ORTHOPEDIC SURGICAL ROBOTS MARKET, BY ROBOT TYPE, 2020-2029 (USD MILLION)
TABLE 268 MALAYSIA HIP IN ORTHOPEDIC SURGICAL ROBOTS MARKET, BY ROBOT TYPE, VOLUME, 2020-2029 (UNITS)
TABLE 269 MALAYSIA SPINE IN ORTHOPEDIC SURGICAL ROBOTS MARKET, BY SURGERY TYPE, 2020-2029 (USD MILLION)
TABLE 270 MALAYSIA SPINE IN ORTHOPEDIC SURGICAL ROBOTS MARKET, BY ROBOT TYPE, 2020-2029 (USD MILLION)
TABLE 271 MALAYSIA SPINE IN ORTHOPEDIC SURGICAL ROBOTS MARKET, BY ROBOT TYPE, VOLUME, 2020-2029 (UNITS)
TABLE 272 MALAYSIA MAZOR IN ORTHOPEDIC SURGICAL ROBOTS MARKET, BY ROBOT TYPE, 2020-2029 (USD MILLION)
TABLE 273 MALAYSIA MAZOR IN ORTHOPEDIC SURGICAL ROBOTS MARKET, BY ROBOT TYPE, VOLUME, 2020-2029 (UNITS)
TABLE 274 MALAYSIA FEMUR IN ORTHOPEDIC SURGICAL ROBOTS MARKET, BY SURGERY TYPE, 2020-2029 (USD MILLION)
TABLE 275 MALAYSIA FEMUR IN ORTHOPEDIC SURGICAL ROBOTS MARKET, BY ROBOT TYPE, 2020-2029 (USD MILLION)
TABLE 276 MALAYSIA FEMUR IN ORTHOPEDIC SURGICAL ROBOTS MARKET, BY ROBOT TYPE, VOLUME, 2020-2029 (UNITS)
TABLE 277 MALAYSIA PELVIS IN ORTHOPEDIC SURGICAL ROBOTS MARKET, BY SURGERY TYPE, 2020-2029 (USD MILLION)
TABLE 278 MALAYSIA PELVIS IN ORTHOPEDIC SURGICAL ROBOTS MARKET, BY ROBOT TYPE, 2020-2029 (USD MILLION)
TABLE 279 MALAYSIA PELVIS IN ORTHOPEDIC SURGICAL ROBOTS MARKET, BY ROBOT TYPE, VOLUME, 2020-2029 (UNITS)
TABLE 280 MALAYSIA HAND IN ORTHOPEDIC SURGICAL ROBOTS MARKET, BY SURGERY TYPE, 2020-2029 (USD MILLION)
TABLE 281 MALAYSIA HAND IN ORTHOPEDIC SURGICAL ROBOTS MARKET, BY ROBOT TYPE, 2020-2029 (USD MILLION)
TABLE 282 MALAYSIA HAND IN ORTHOPEDIC SURGICAL ROBOTS MARKET, BY ROBOT TYPE, VOLUME, 2020-2029 (UNITS)
TABLE 283 MALAYSIA ELBOW IN ORTHOPEDIC SURGICAL ROBOTS MARKET, BY SURGERY TYPE, 2020-2029 (USD MILLION)
TABLE 284 MALAYSIA ELBOW IN ORTHOPEDIC SURGICAL ROBOTS MARKET, BY ROBOT TYPE, 2020-2029 (USD MILLION)
TABLE 285 MALAYSIA ELBOW IN ORTHOPEDIC SURGICAL ROBOTS MARKET, BY ROBOT TYPE, VOLUME, 2020-2029 (UNITS)
TABLE 286 MALAYSIA ORTHOPEDIC SURGICAL ROBOTS MARKET, BY END USER, 2020-2029 (USD MILLION)
TABLE 287 MALAYSIA ORTHOPEDIC SURGICAL ROBOTS MARKET, BY END USER, 2020-2029 (USD MILLION)
TABLE 288 MALAYSIA ORTHOPEDIC SURGICAL ROBOTS MARKET, BY DISTRIBUTION CHANNEL, 2020-2029 (USD MILLION)
TABLE 289 INDONESIA ORTHOPEDIC SURGICAL ROBOTS MARKET, BY PRODUCT TYPE, 2020-2029 (USD MILLION)
TABLE 290 INDONESIA ROBOTIC SYSTEMS IN ORTHOPEDIC SURGICAL ROBOTS MARKET, BY APPLICATION, 2020-2029 (USD MILLION)
TABLE 291 INDONESIA KNEE IN ORTHOPEDIC SURGICAL ROBOTS MARKET, BY SURGERY TYPE, 2020-2029 (USD MILLION)
TABLE 292 INDONESIA KNEE IN ORTHOPEDIC SURGICAL ROBOTS MARKET, BY ROBOT TYPE, 2020-2029 (USD MILLION)
TABLE 293 INDONESIA KNEE IN ORTHOPEDIC SURGICAL ROBOTS MARKET, BY ROBOT TYPE, VOLUME, 2020-2029 (UNITS)
TABLE 294 INDONESIA HIP IN ORTHOPEDIC SURGICAL ROBOTS MARKET, BY SURGERY TYPE, 2020-2029 (USD MILLION)
TABLE 295 INDONESIA HIP IN ORTHOPEDIC SURGICAL ROBOTS MARKET, BY ROBOT TYPE, 2020-2029 (USD MILLION)
TABLE 296 INDONESIA HIP IN ORTHOPEDIC SURGICAL ROBOTS MARKET, BY ROBOT TYPE, VOLUME, 2020-2029 (UNITS)
TABLE 297 INDONESIA SPINE IN ORTHOPEDIC SURGICAL ROBOTS MARKET, BY SURGERY TYPE, 2020-2029 (USD MILLION)
TABLE 298 INDONESIA SPINE IN ORTHOPEDIC SURGICAL ROBOTS MARKET, BY ROBOT TYPE, 2020-2029 (USD MILLION)
TABLE 299 INDONESIA SPINE IN ORTHOPEDIC SURGICAL ROBOTS MARKET, BY ROBOT TYPE, VOLUME, 2020-2029 (UNITS)
TABLE 300 INDONESIA MAZOR IN ORTHOPEDIC SURGICAL ROBOTS MARKET, BY ROBOT TYPE, 2020-2029 (USD MILLION)
TABLE 301 INDONESIA MAZOR IN ORTHOPEDIC SURGICAL ROBOTS MARKET, BY ROBOT TYPE, VOLUME, 2020-2029 (UNITS)
TABLE 302 INDONESIA FEMUR IN ORTHOPEDIC SURGICAL ROBOTS MARKET, BY SURGERY TYPE, 2020-2029 (USD MILLION)
TABLE 303 INDONESIA FEMUR IN ORTHOPEDIC SURGICAL ROBOTS MARKET, BY ROBOT TYPE, 2020-2029 (USD MILLION)
TABLE 304 INDONESIA FEMUR IN ORTHOPEDIC SURGICAL ROBOTS MARKET, BY ROBOT TYPE, VOLUME, 2020-2029 (UNITS)
TABLE 305 INDONESIA PELVIS IN ORTHOPEDIC SURGICAL ROBOTS MARKET, BY SURGERY TYPE, 2020-2029 (USD MILLION)
TABLE 306 INDONESIA PELVIS IN ORTHOPEDIC SURGICAL ROBOTS MARKET, BY ROBOT TYPE, 2020-2029 (USD MILLION)
TABLE 307 INDONESIA PELVIS IN ORTHOPEDIC SURGICAL ROBOTS MARKET, BY ROBOT TYPE, VOLUME, 2020-2029 (UNITS)
TABLE 308 INDONESIA HAND IN ORTHOPEDIC SURGICAL ROBOTS MARKET, BY SURGERY TYPE, 2020-2029 (USD MILLION)
TABLE 309 INDONESIA HAND IN ORTHOPEDIC SURGICAL ROBOTS MARKET, BY ROBOT TYPE, 2020-2029 (USD MILLION)
TABLE 310 INDONESIA HAND IN ORTHOPEDIC SURGICAL ROBOTS MARKET, BY ROBOT TYPE, ASP, 2020-2029 (USD)
TABLE 311 INDONESIA ELBOW IN ORTHOPEDIC SURGICAL ROBOTS MARKET, BY SURGERY TYPE, 2020-2029 (USD MILLION)
TABLE 312 INDONESIA ELBOW IN ORTHOPEDIC SURGICAL ROBOTS MARKET, BY ROBOT TYPE, 2020-2029 (USD MILLION)
TABLE 313 INDONESIA ELBOW IN ORTHOPEDIC SURGICAL ROBOTS MARKET, BY ROBOT TYPE, VOLUME, 2020-2029 (UNITS)
TABLE 314 IINDONESIA ORTHOPEDIC SURGICAL ROBOTS MARKET, BY END USER, 2020-2029 (USD MILLION)
TABLE 315 INDONESIA HOSPITALS IN ORTHOPEDIC SURGICAL ROBOTS MARKET, BY END USER, 2020-2029 (USD MILLION)
TABLE 316 INDONESIA ORTHOPEDIC SURGICAL ROBOTS MARKET, BY DISTRIBUTION CHANNEL, 2020-2029 (USD MILLION)
TABLE 317 PHILIPPINES ORTHOPEDIC SURGICAL ROBOTS MARKET, BY PRODUCT TYPE, 2020-2029 (USD MILLION)
TABLE 318 PHILIPPINES ROBOTIC SYSTEMS IN ORTHOPEDIC SURGICAL ROBOTS MARKET, BY APPLICATION, 2020-2029 (USD MILLION)
TABLE 319 PHILIPPINES KNEE IN ORTHOPEDIC SURGICAL ROBOTS MARKET, BY SURGERY TYPE, 2020-2029 (USD MILLION)
TABLE 320 PHILIPPINES KNEE IN ORTHOPEDIC SURGICAL ROBOTS MARKET, BY ROBOT TYPE, 2020-2029 (USD MILLION)
TABLE 321 PHILIPPINES KNEE IN ORTHOPEDIC SURGICAL ROBOTS MARKET, BY ROBOT TYPE, VOLUME, 2020-2029 (UNITS)
TABLE 322 PHILIPPINES HIP IN ORTHOPEDIC SURGICAL ROBOTS MARKET, BY SURGERY TYPE, 2020-2029 (USD MILLION)
TABLE 323 PHILIPPINES HIP IN ORTHOPEDIC SURGICAL ROBOTS MARKET, BY ROBOT TYPE, 2020-2029 (USD MILLION)
TABLE 324 PHILIPPINES HIP IN ORTHOPEDIC SURGICAL ROBOTS MARKET, BY ROBOT TYPE, VOLUME, 2020-2029 (UNITS)
TABLE 325 PHILIPPINES SPINE IN ORTHOPEDIC SURGICAL ROBOTS MARKET, BY SURGERY TYPE, 2020-2029 (USD MILLION)
TABLE 326 PHILIPPINES SPINE IN ORTHOPEDIC SURGICAL ROBOTS MARKET, BY ROBOT TYPE, 2020-2029 (USD MILLION)
TABLE 327 PHILIPPINES SPINE IN ORTHOPEDIC SURGICAL ROBOTS MARKET, BY ROBOT TYPE, VOLUME, 2020-2029 (UNITS)
TABLE 328 PHILIPPINES MAZOR IN ORTHOPEDIC SURGICAL ROBOTS MARKET, BY ROBOT TYPE, 2020-2029 (USD MILLION)
TABLE 329 PHILIPPINES MAZOR IN ORTHOPEDIC SURGICAL ROBOTS MARKET, BY ROBOT TYPE, VOLUME, 2020-2029 (UNITS)
TABLE 330 PHILIPPINES FEMUR IN ORTHOPEDIC SURGICAL ROBOTS MARKET, BY SURGERY TYPE, 2020-2029 (USD MILLION)
TABLE 331 PHILIPPINES FEMUR IN ORTHOPEDIC SURGICAL ROBOTS MARKET, BY ROBOT TYPE, 2020-2029 (USD MILLION)
TABLE 332 PHILIPPINES FEMUR IN ORTHOPEDIC SURGICAL ROBOTS MARKET, BY ROBOT TYPE, VOLUME, 2020-2029 (UNITS)
TABLE 333 PHILIPPINES PELVIS IN ORTHOPEDIC SURGICAL ROBOTS MARKET, BY SURGERY TYPE, 2020-2029 (USD MILLION)
TABLE 334 PHILIPPINES PELVIS IN ORTHOPEDIC SURGICAL ROBOTS MARKET, BY ROBOT TYPE, 2020-2029 (USD MILLION)
TABLE 335 PHILIPPINES PELVIS IN ORTHOPEDIC SURGICAL ROBOTS MARKET, BY ROBOT TYPE, VOLUME, 2020-2029 (UNITS)
TABLE 336 PHILIPPINES HAND IN ORTHOPEDIC SURGICAL ROBOTS MARKET, BY SURGERY TYPE, 2020-2029 (USD MILLION)
TABLE 337 PHILIPPINES HAND IN ORTHOPEDIC SURGICAL ROBOTS MARKET, BY ROBOT TYPE, 2020-2029 (USD MILLION)
TABLE 338 PHILIPPINES HAND IN ORTHOPEDIC SURGICAL ROBOTS MARKET, BY ROBOT TYPE, VOLUME, 2020-2029 (UNITS)
TABLE 339 PHILIPPINES ELBOW IN ORTHOPEDIC SURGICAL ROBOTS MARKET, BY SURGERY TYPE, 2020-2029 (USD MILLION)
TABLE 340 PHILIPPINES ELBOW IN ORTHOPEDIC SURGICAL ROBOTS MARKET, BY ROBOT TYPE, 2020-2029 (USD MILLION)
TABLE 341 PHILIPPINES ELBOW IN ORTHOPEDIC SURGICAL ROBOTS MARKET, BY ROBOT TYPE, VOLUME, 2020-2029 (UNITS)
TABLE 342 PHILIPPINES ORTHOPEDIC SURGICAL ROBOTS MARKET, BY END USER, 2020-2029 (USD MILLION)
TABLE 343 PHILIPPINES ORTHOPEDIC SURGICAL ROBOTS MARKET, BY END USER, 2020-2029 (USD MILLION)
TABLE 344 PHILIPPINES ORTHOPEDIC SURGICAL ROBOTS MARKET, BY DISTRIBUTION CHANNEL, 2020-2029 (USD MILLION)
TABLE 345 REST OF ASIA-PACIFIC ORTHOPEDIC SURGICAL ROBOTS MARKET, BY PRODUCT TYPE, 2020-2029 (USD MILLION)
Lista de Figura
FIGURE 1 ASIA PACIFIC ORTHOPEDIC SURGICAL ROBOTS MARKET: SEGMENTATION
FIGURE 2 ASIA PACIFIC ORTHOPEDIC SURGICAL ROBOTS MARKET: DATA TRIANGULATION
FIGURE 3 ASIA PACIFIC ORTHOPEDIC SURGICAL ROBOTS MARKET: DROC ANALYSIS
FIGURE 4 ASIA PACIFIC ORTHOPEDIC SURGICAL ROBOTS MARKET: ASIA PACIFIC VS REGIONAL MARKET ANALYSIS
FIGURE 5 ASIA PACIFIC ORTHOPEDIC SURGICAL ROBOTS MARKET: COMPANY RESEARCH ANALYSIS
FIGURE 6 ASIA PACIFIC ORTHOPEDIC SURGICAL ROBOTS MARKET: INTERVIEW DEMOGRAPHICS
FIGURE 7 ASIA PACIFIC ORTHOPEDIC SURGICAL ROBOTS MARKET: DBMR MARKET POSITION GRID
FIGURE 8 ASIA PACIFIC ORTHOPEDIC SURGICAL ROBOTS MARKET: MARKET END USER GRID
FIGURE 9 ASIA PACIFIC ORTHOPEDIC SURGICAL ROBOTS MARKET: VENDOR SHARE ANALYSIS
FIGURE 10 ASIA PACIFIC ORTHOPEDIC SURGICAL ROBOTS MARKET: SEGMENTATION
FIGURE 11 INCREASING PREVELANCE OF OESTOPOROSIS AND INCREASE INCIDENCE OF SPORTS AND TRAUMA INJURY IS EXPECTED TO DRIVE THE ASIA PACIFIC ORTHOPEDIC SURGICAL ROBOTS MARKET IN THE FORECAST PERIOD OF 2020 TO 2027
FIGURE 12 PRODUCT TYPE IS EXPECTED TO ACCOUNT FOR THE LARGEST SHARE OF THE ASIA PACIFIC ORTHOPEDIC SURGICAL ROBOTS MARKET IN 2022 & 2029
FIGURE 13 DRIVERS, RESTRAINTS, OPPORTUNITIES, AND CHALLENGES OF THE ASIA PACIFIC ORTHOPEDIC SURGICAL ROBOTS MARKET
FIGURE 14 CURRENT HEALTHCARE EXPENDITURE (% OF GDP) 2018-2019-
FIGURE 15 ASIA PACIFIC ORTHOPEDIC SURGICAL ROBOTS MARKET : BY PRODUCT TYPE, 2021
FIGURE 16 ASIA PACIFIC ORTHOPEDIC SURGICAL ROBOTS MARKET : BY PRODUCT TYPE, 2021-2029 (USD MILLION)
FIGURE 17 ASIA PACIFIC ORTHOPEDIC SURGICAL ROBOTS MARKET : BY PRODUCT TYPE, CAGR (2021-2029)
FIGURE 18 ASIA PACIFIC ORTHOPEDIC SURGICAL ROBOTS MARKET: BY PRODUCT TYPE, LIFELINE CURVE
FIGURE 19 ASIA PACIFIC ORTHOPEDIC SURGICAL ROBOTS MARKET: BY END USER, 2021
FIGURE 20 ASIA PACIFIC ORTHOPEDIC SURGICAL ROBOTS MARKET: BY END USER, 2020-2029 (USD MILLION)
FIGURE 21 ASIA PACIFIC ORTHOPEDIC SURGICAL ROBOTS MARKET: BY END USER, CAGR (2022-2029)
FIGURE 22 ASIA PACIFIC ORTHOPEDIC SURGICAL ROBOTS MARKET: BY END USER, LIFELINE CURVE
FIGURE 23 ASIA PACIFIC ORTHOPEDIC SURGICAL ROBOTS MARKET: BY DISTRIBUTION CHANNEL, 2021
FIGURE 24 ASIA PACIFIC ORTHOPEDIC SURGICAL ROBOTS MARKET: BY DISTRIBUTION CHANNEL, 2022-2029 (USD MILLION)
FIGURE 25 ASIA PACIFIC ORTHOPEDIC SURGICAL ROBOTS MARKET: BY DISTRIBUTION CHANNEL, CAGR (2022-2029)
FIGURE 26 ASIA PACIFIC ORTHOPEDIC SURGICAL ROBOTS MARKET: BY DISTRIBUTION CHANNEL, LIFELINE CURVE
FIGURE 27 ASIA-PACIFIC ORTHOPAEDIC SURGICAL ROBOTS MARKET: SNAPSHOT (2021)
FIGURE 28 ASIA-PACIFIC ORTHOPAEDIC SURGICAL ROBOTS MARKET: BY COUNTRY (2021)
FIGURE 29 ASIA-PACIFIC ORTHOPAEDIC SURGICAL ROBOTS MARKET: BY COUNTRY (2022 & 2029)
FIGURE 30 ASIA-PACIFIC ORTHOPAEDIC SURGICAL ROBOTS MARKET: BY COUNTRY (2021 & 2029)
FIGURE 31 ASIA-PACIFIC ORTHOPAEDIC SURGICAL ROBOTS MARKET: BY PRODUCT TYPE (2022-2029)
FIGURE 32 ASIA PACIFIC ORTHOPEDIC SURGICAL ROBOTS MARKET: COMPANY SHARE 2021 (%)
Metodologia de Investigação
A recolha de dados e a análise do ano base são feitas através de módulos de recolha de dados com amostras grandes. A etapa inclui a obtenção de informações de mercado ou dados relacionados através de diversas fontes e estratégias. Inclui examinar e planear antecipadamente todos os dados adquiridos no passado. Da mesma forma, envolve o exame de inconsistências de informação observadas em diferentes fontes de informação. Os dados de mercado são analisados e estimados utilizando modelos estatísticos e coerentes de mercado. Além disso, a análise da quota de mercado e a análise das principais tendências são os principais fatores de sucesso no relatório de mercado. Para saber mais, solicite uma chamada de analista ou abra a sua consulta.
A principal metodologia de investigação utilizada pela equipa de investigação do DBMR é a triangulação de dados que envolve a mineração de dados, a análise do impacto das variáveis de dados no mercado e a validação primária (especialista do setor). Os modelos de dados incluem grelha de posicionamento de fornecedores, análise da linha de tempo do mercado, visão geral e guia de mercado, grelha de posicionamento da empresa, análise de patentes, análise de preços, análise da quota de mercado da empresa, normas de medição, análise global versus regional e de participação dos fornecedores. Para saber mais sobre a metodologia de investigação, faça uma consulta para falar com os nossos especialistas do setor.
Personalização disponível
A Data Bridge Market Research é líder em investigação formativa avançada. Orgulhamo-nos de servir os nossos clientes novos e existentes com dados e análises que correspondem e atendem aos seus objetivos. O relatório pode ser personalizado para incluir análise de tendências de preços de marcas-alvo, compreensão do mercado para países adicionais (solicite a lista de países), dados de resultados de ensaios clínicos, revisão de literatura, mercado remodelado e análise de base de produtos . A análise de mercado dos concorrentes-alvo pode ser analisada desde análises baseadas em tecnologia até estratégias de carteira de mercado. Podemos adicionar quantos concorrentes necessitar de dados no formato e estilo de dados que procura. A nossa equipa de analistas também pode fornecer dados em tabelas dinâmicas de ficheiros Excel em bruto (livro de factos) ou pode ajudá-lo a criar apresentações a partir dos conjuntos de dados disponíveis no relatório.

