

Asia-Pacific Food Flavors Market, By Product Type (Natural Extract, Flavor Ingredient), Type (Fruit Flavors, Spice Flavors, Herbal Flavors, Citrus Flavors, Dairy Flavors, Nutty Flavors, Vegetable Extracts, Coffee Flavors, Chocolate Flavor, Date Derivatives, Vegetable Oils, Carob Derivatives, Others), Origin (Natural, Natural Identical, Artificial), Category (Clean Label, Heat Stable, Regular, Non-Allergenic, Others), Solubility (Water Soluble, Oil Soluble, Fat Dispersible, Others), Form (Liquid, Powder, Syrup), Application (Confectionery, Bakery, Convenience Food, Snacks & Extruded Snacks, Frozen Desserts Products, Meat & Poultry Products, Breakfast Cereals, Processed Food, Baby Food, Sports Nutrition, Dietary Supplements, Beverages) - Industry Trends and Forecast to 2030.
Asia-Pacific Food Flavors Market Analysis and Insights
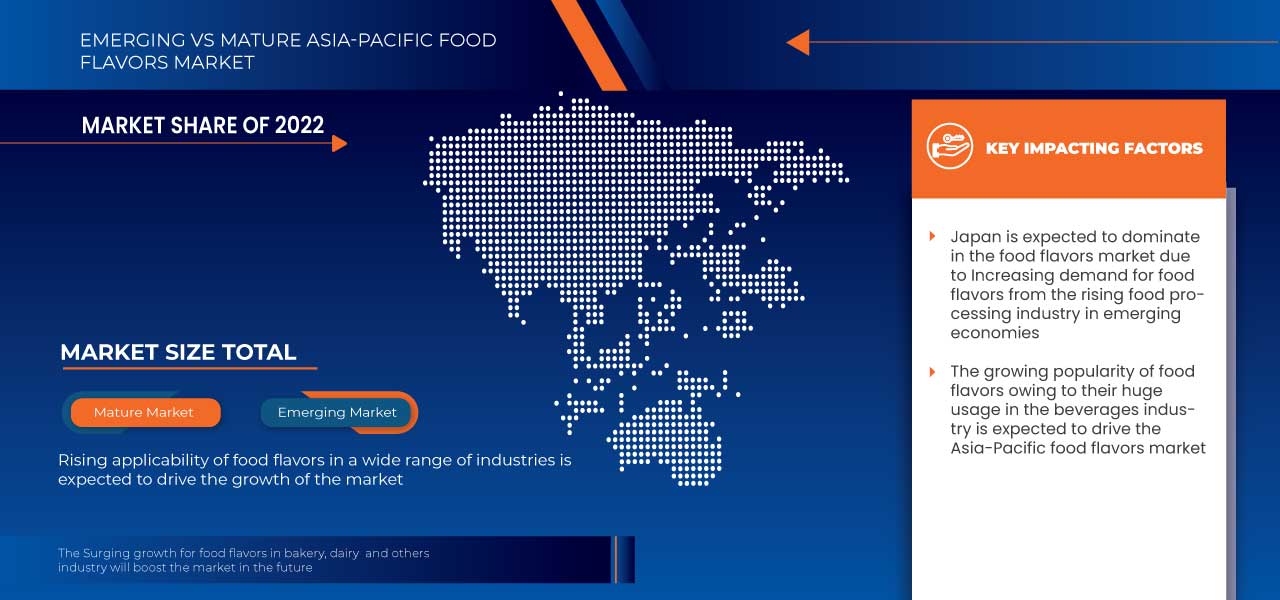
Food flavors are routinely applied to food items to enhance their flavor. The primary taste additives are synthetic and natural flavors. After processing and preserving, perishable foods tend to lose their flavor over time, which causes the need to use flavoring substances to help retain the flavor. The food and beverage industry needs flavors for various reasons, including creating new products, adding new product offerings, and modifying existing products' flavors. The food and beverage industry's high demand for new flavors and ongoing growth fuels market expansion. Additionally, during the projected period, the market for food flavors is anticipated to experience growth due to increased demand from the fast food sector.
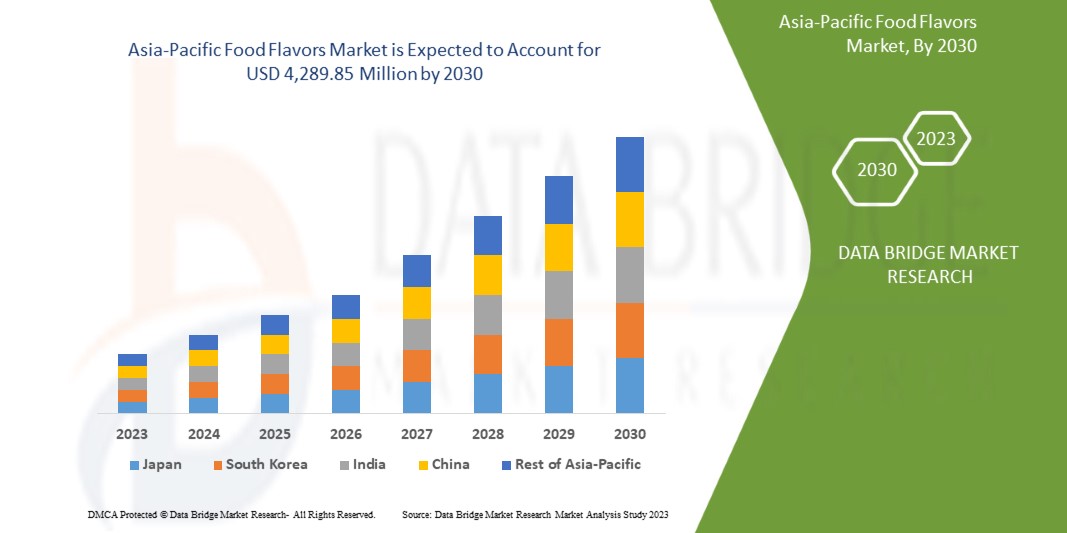
Data Bridge Market Research analyzes that the Asia-Pacific food flavors market is expected to reach a value of USD 4,289.85 million by 2030, at a CAGR of 6.9% during the forecast period. Natural extracts account for the largest product type segment in the market due to their natural taste and health benefits, whereas natural flavors often contain a combination of isolated plant compounds to re-create the taste of fresh produce or cooked food that accelerated the demand for natural extracts or flavors in the Asia-Pacific food flavors market.
|
Report Metric |
Details |
|
Forecast Period |
2023 to 2030 |
|
Base Year |
2022 |
|
Historic Years |
2021 (Customisable to 2015-2020) |
|
Quantitative Units |
Revenue in USD Million, Pricing in USD |
|
Segments Covered |
By Product Type (Natural Extract, Flavor Ingredient), Type (Fruit Flavors, Spice Flavors, Herbal Flavors, Citrus Flavors, Dairy Flavors, Nutty Flavors, Vegetable Extracts, Coffee Flavors, Chocolate Flavor, Date Derivatives, Vegetable Oils, Carob Derivatives, Others), Origin (Natural, Natural Identical, Artificial), Category (Clean Label, Heat Stable, Regular, Non-Allergenic, Others), Solubility (Water Soluble, Oil Soluble, Fat Dispersible, Others), Form (Liquid, Powder, Syrup), Application (Confectionery, Bakery, Convenience Food, Snacks & Extruded Snacks, Frozen Desserts Products, Meat & Poultry Products, Breakfast Cereals, Processed Food, Baby Food, Sports Nutrition, Dietary Supplements, Beverages) |
|
Countries Covered |
China, Japan, India, South Korea, Australia, Indonesia, Philippines, Thailand, Malaysia, Singapore, Rest of Asia-Pacific |
|
Market Players Covered |
McCormick & Company, Inc., MartinBauer, Prinova Group LLC. , Synthite Industries Ltd., AROMATICA, GOLD COAST INGREDIENTS, INC., HHOYA, Takasago International Corporation, Sensient Technologies Corporation, International Flavors & Fragrances Inc, Axxence Aromatic GmbH, Huabao International Holdings Limited, Blue Pacific Flavors, Inc, ADM, Capella Flavors, Inc., Firmenich SA., FLAVORCAN INTERNATIONAL INC., Kanegrade, Keva Flavors Pvt. Ltd., Döhler, Trilogy Flavors, Givaudan, Stringer Flavor. Lt, Cargill, Incorporate, Synergy Flavor, Kerry Group plc, Taiyo Internationa, T.Hasegawa USA Inc, Honeyberry International LLP, Essential Flavor, NutraDr, MANE and among others |
Market Definition
Food flavors are ingredients used to enhance the taste or aroma of food and beverage products. They change the food is perceived and increase consumer interest. These food additives play a significant role in product acceptance and have thus gained immense traction worldwide.
Innovative flavor to cater to the change in customer taste requirements. The applications of advanced technologies provide innovative and novel tastes in food. The Asia-Pacific Food Flavors market is expected to grow in the forecast year due to the rise in market players and the availability of advanced services. Along with this, manufacturers are engaged in R&D activity for launching new flavoring agents in the market. The increasing research in the field of the food industry is expected to boost market growth further. However, stringent government regulations and adverse effects of synthetic flavors on human health are expected to hamper the market growth of the Asia-Pacific food flavors market in the forecast period.
Asia-Pacific Food Flavors Market Dynamics
This section deals with understanding the market drivers, advantages, opportunities, restraints, and challenges. All of this is discussed in detail below:
Drivers
- Increasing demand FOR different flavors in food and bEverage, bakery and other several industries due to their health benefits
Food and beverage manufacturers have used artificial flavors for decades, and they provide important benefits. They also allow people to enjoy a variety of food flavors even when they are out of season. Flavors can help to keep food pleasurable, with a truly authentic taste and without any off-notes. Different fruity and natural food flavors have become more popular in food industries because of their different taste and fragrance and their health benefits. Artificial flavors are those not extracted from nature but rather re-produced in the lab. It’s generally assumed that “natural” is better, but the science of flavoring is so advanced that many artificial flavors actually have the exact same chemical structure as the naturally occurring ones. Flavors are often not one chemical but a combination of chemicals.
Fruity flavors are coming in high demand in the food and beverages industries, is mainly due to the chemical compound Ethyl propionate. The fruit flavor is a combination of aroma and taste sensations. Conjugation of sugars, acids, phenolics and hundreds of volatile compounds contribute to the fruit flavor. These include citrus type flavors and berry type flavors. These include grapefruit, orange, apple, banana etc. Here I would like to provide an example of fruit flavored infused water available in the market that are of great demand as they provide various health benefits:
Thus, the rising demand for different flavors in all age groups by their health beneficial properties and tastes is increasing in demand of flavors in the food market, and hence it is expected to drive the Asia-Pacific food flavors market.
- Consumer Inclination toward floral and natural flavors
Different floral and fruity natural flavors are added to the bakery products, which gives a natural aroma and taste to the consumers. Fruit flavors are usually prepared by natural products and paired with botanical flavors to give a natural aroma to edible products. Over the last few years, the floral and natural flavors have risen from a niche sector to a large one. A majority of floral essences are used in baked goods and the growth rate of these aromas.
For examples of the flavors used in the bakery products are lemon-lavender cookies, honey-lavender gelato, lemon-violent granola, blackberry-rose marshmallows, and others. The adoption of floral flavors as a trend is attributed to the consumer’s willingness to spend on natural food products and ingredients.
As the rising demand of different flavors is increasing, and the adoption of different flavors by the large population size, is attributed to the consumer’s willingness to spend on natural food products and ingredients. The demand of new flavors are comprehensively increasing by the population and hence expected to drive the Asia-Pacific food flavors market.
Opportunity
-
INCREASE IN THE NUMBER OF LAUNCHES OF NEW FLAVORS IN NUTRITIONAL FOOD AND BEVERAGES
Nutritional beverages is overgrowing in Asia-Pacific due to their variety of flavors, health benefits and excellent taste. The market players in the Asia-Pacific food flavors market. In addition, the players are consistently launching new flavors for foods in the market.
An essential part of the launch plan is validating the product and its benefits quickly. This is done by using the Net Promoter Score (NPS), and the Customer Satisfaction Score (CSAT) can be corrupted when you get negative feedback from users who are not meant to test the first version of your product or feature. In this way, manufacturers of new flavors for food consistently create new launch strategies that help the company grow.
Thus, the new launch strategies are applied in the globe to drive the market. This is an outstanding opportunity for manufacturers as these launches explain the content and quality of the products, enabling consumers to buy more flavors for food.
Thus, the increase in the number of launches of new flavors for nutritional food and beverages is expected to create opportunities for the Asia-Pacific food flavors market in the forecast period.
-
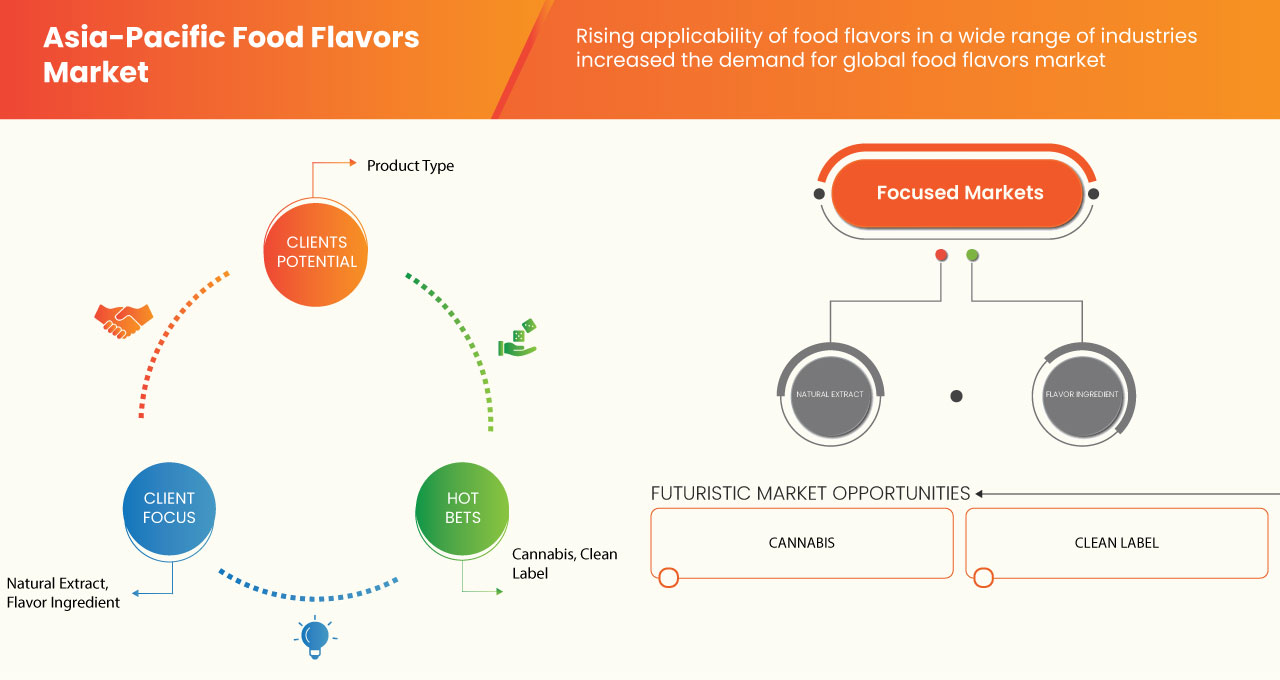
Adoption of cannabis as a natural ingredient for flavor development
Terpenes and cannabinoids like tetrahydrocannabinol (THC) and cannabinol (CBD) have enormous potential for application in medicine and health. Additionally, cannabis-derived chemicals have unique characteristics that can impact distinctive flavors to meals and beverages. Studies are being conducted to prove that cannabis can improve taste response and increase food sensory attractiveness. Moreover, combining cannabis with botanicals, such as ginseng, ashwagandha and citrus fruits, not only creates novel flavor profiles but also improves the effect of cannabis on focus, sleep and stress relief. The adaption of cannabis as a flavor ingredient may create an opportunity for the food flavor market to grow exponentially.
-
Thus, the adoption of cannabis as a natural ingredient for flavor development is expected to fuel up the business in various dimensions and lead the food flavors market growth.
Restraint/Challenge
- Side Effects Caused by synthetic flavors
Artificial substances known as synthetic flavors are added to food to enhance its flavor, shelf life, freshness, and nutritional value. In addition to yogurt, chips, bread, salad dressings, and baked products, they can be found in many different foods. Yet, evidence from numerous scientific studies indicates that artificial food additives may cause cancer. Particularly, nitrites and nitrates, which are frequently present in processed meats, have been associated with an elevated risk of colorectal cancer when consumed in increased amounts. Research is being conducted related to the impact of artificial food additives on children’s behavioral problems or neurodevelopmental abnormalities. The detrimental effects of synthetic flavors may thus restrain the growth of the food flavors market.
Some other risks of artificial flavors include their ability to trick our brains into preferring their taste over that of whole foods. Neglecting nutrient-dense foods can lead to a number of nutrient deficiencies, which are linked to a whole host of health problems.
The harmful side-effects can give rise to fear in the population related to food flavors. Moreover, it impacts the credibility of synthetic food flavors manufacturers which affects the products sales. Thus, due to the side effects caused by synthetic flavors may hamper the growth of the food flavors market.
Recent Developments
- In February 2022, Kerry, announced that it has made two significant biotechnology acquisitions that will expand its expertise, technology portfolio and manufacturing capabilities. The company has announced that it has reached agreement to acquire the leading biotechnology innovation company, c-LEcta while also confirming that it has acquired the Mexican based enzyme manufacturer, Enmex. This strategically compelling combination with Kerry will accelerate the innovation capabilities in enzyme engineering, fermentation and bio-process development
- In May 2022, Givaudan announces the development of Customer Foresight. Combining the most advanced data technologies with the insights and knowledge of Givaudan experts to help customers meet future consumer needs
- In May 2022, Symrise reveals an overview of current and future developments in food and beverages. The study combines qualitative and quantitative research methods and serves as an important basis for the development of consumer-preferred taste, nutrition, and health solutions. This identifies the current customer trends in food and beverages
- In November 2022, Mane announced the new set up flavor innovation centre in Hyderabad. The innovation center spread over 13,900 sq. ft in hitech city area, will focus on end to end flavor development to cater to the food & beverage market in India and other Asia-Pacific markets
Asia-Pacific Food Flavors Market Scope
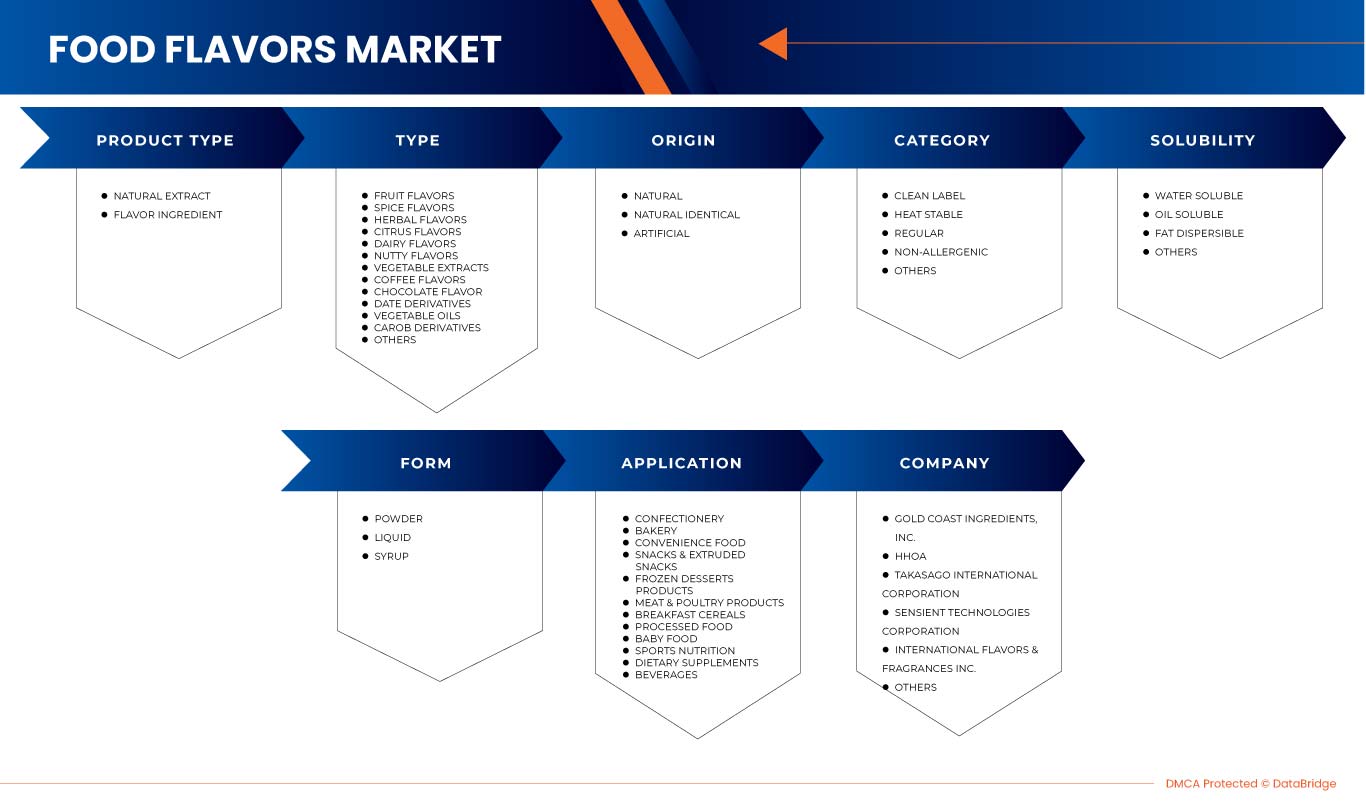
The Asia-Pacific food flavors market is segmented into six notable segments based on product type, type, origin, category, solubility and application. The growth among segments helps you analyze niche pockets of growth and strategies to approach the market and determine your core application areas and the difference in your target markets.
BY PRODUCT TYPE
- Natural Extract
- Flavor Ingredient
On the basis of product type, the Asia-Pacific food flavors market is segmented into Natural extract and flavor ingredient.
BY TYPE
- Fruit Flavors
- Spice Flavors
- Herbal Flavors
- Citrus Flavors
- Dairy Flavors
- Nutty Flavors
- Vegetable Extracts
- Coffee Flavors
- Chocolate Flavor
- Date Derivatives
- Vegetable Oils
- Carob Derivatives
- Others
On the basis of type, the Asia-Pacific food flavors market is segmented into fruit flavors, spice flavors, herbal flavors, citrus flavors, dairy flavors, nutty flavors, vegetable extracts, coffee flavors, chocolate flavor, date derivatives, vegetable oils, carob derivatives and others.
BY ORIGIN
- Natural
- Natural Identical
- Artificial
On the basis of origin, the Asia-Pacific food flavors market is segmented into natural, natural identical and artificial.
BY CATEGORY
- Clean Label
- Heat Stable
- Regular
- Non-Allergenic
- Others
On the basis of category, the Asia-Pacific food flavors market is segmented into clean label, heat stable, regular, non-allergenic, and others.
BY SOLUBILITY
- Water Soluble
- Oil Soluble
- Fat Dispersible
- Others
On the basis of solubility, the Asia-Pacific food flavors market is segmented into water soluble, oil soluble, fat dispersible and others.
BY APPLICATION
- Confectionery
- Bakery
- Convenience Food
- Snacks & Extruded Snacks
- Frozen Desserts Products
- Meat & Poultry Products
- Breakfast Cereals
- Processed Food
- Baby Food
- Sports Nutrition
- Dietary Supplements
- Beverages
On the basis of application, the Asia-Pacific food flavors market is segmented into confectioner, baker, convenience food, snacks & extruded snacks, frozen desserts product, meat & poultry products, breakfast cereal, processed food, baby food, sports nutrition, dietary supplements, beverages.
Asia-Pacific Food Flavors Market Regional Analysis/Insights
The Asia-Pacific food flavors market is segmented into six notable segments based on product type, type, origin, category, solubility and application.
Some countries covered in this Asia-Pacific market report are China, Japan, India, South Korea, Australia, Indonesia, Philippines, Thailand, Malaysia, Singapore, Rest of Asia-Pacific.
Japan is expected to grow due to the rise in new product launches of food flavors in the food industry.
The country section of the report also provides individual market-impacting factors and domestic regulation changes that impact the current and future trends of the market. Data points such as new sales, replacement sales, country demographics, regulatory acts, and import-export tariffs are some of the major pointers used to forecast the market scenario for individual countries. Also, the presence and availability of Asia-Pacific brands and their challenges faced due to large or scarce competition from local and domestic brands, and the impact of sales channels are considered while providing forecast analysis of the country data.
Competitive Landscape and Asia-Pacific Food Flavors Market Share Analysis
The Asia-Pacific food flavors market competitive landscape provides details by the competitor. Details included are company overview, company financials, revenue generated, market potential, investment in R&D, new market initiatives, production sites and facilities, company strengths and weaknesses, product launch, product approvals, product width and breadth, application dominance, product type lifeline curve. The above data points provided are only related to the company's focus on the food flavors market.
Some of the major players operating in the market are McCormick & Company, Inc., MartinBauer, Prinova Group LLC. , Synthite Industries Ltd., AROMATICA, GOLD COAST INGREDIENTS, INC., HHOYA , Takasago International Corporation, Sensient Technologies Corporation, International Flavors & Fragrances Inc, Axxence Aromatic GmbH, Huabao International Holdings Limited, Blue Pacific Flavors, Inc, ADM, Capella Flavors, Inc., Firmenich SA., , FLAVORCAN INTERNATIONAL INC., Kanegrade, Keva Flavors Pvt. Ltd., Döhler, Trilogy Flavors, Givaudan, Stringer Flavor. Lt, Cargill, Incorporate, Synergy Flavor, Kerry Group plc, Taiyo Internationa, T.Hasegawa USA Inc, Honeyberry International LLP, Essential Flavor, NutraDr, MANE and among others.
SKU-
Obtenha acesso online ao relatório sobre a primeira nuvem de inteligência de mercado do mundo

- Painel interativo de análise de dados
- Painel de análise da empresa para oportunidades de elevado potencial de crescimento
- Acesso de analista de pesquisa para personalização e customização. consultas
- Análise da concorrência com painel interativo
- Últimas notícias, atualizações e atualizações Análise de tendências
- Aproveite o poder da análise de benchmark para um rastreio abrangente da concorrência
Índice
1 INTRODUCTION
1.1 OBJECTIVES OF THE STUDY
1.2 MARKET DEFINITION
1.3 OVERVIEW OF THE ASIA PACIFIC FOOD FLAVORS MARKET
1.4 LIMITATIONS
1.5 MARKETS COVERED
2 MARKET SEGMENTATION
2.1 MARKETS COVERED
2.2 GEOGRAPHICAL SCOPE
2.3 YEARS CONSIDERED FOR THE STUDY
2.4 CURRENCY AND PRICING
2.5 DBMR TRIPOD DATA VALIDATION MODEL
2.6 MULTIVARIATE MODELLING
2.7 PRODUCT LIFELINE CURVE
2.8 PRIMARY INTERVIEWS WITH KEY OPINION LEADERS
2.9 DBMR MARKET POSITION GRID
2.1 VENDOR SHARE ANALYSIS
2.11 MARKET END COVERAGE GRID
2.12 SECONDARY SOURCES
2.13 ASSUMPTIONS
3 EXECUTIVE SUMMARY
4 PREMIUM INSIGHT
4.1 VALUE CHAIN ANALYSIS
4.2 SUPPLY CHAIN ANALYSIS
4.2.1 MAJOR FUNCTIONARIES INVOLVED IN THE SUPPLY CHAIN OF SPICES.
4.2.1.1 PRODUCER:
4.2.1.2 COMMISSION AGENT:
4.2.1.3 TRADER/EXPORTER:
4.2.1.4 WHOLESALER:
4.2.1.5 PROCESSOR:
4.2.1.6 RETAILER:
4.2.1.7 FINAL USERS:
4.3 IMPORT-EXPORT ANALYSIS
4.3.1 IMPORT (AUGUST 2022)
4.3.1.1 VIETNAM (FEBRUARY 2023)
4.3.1.2 INDIA (FEBRUARY 2023)
4.3.1.3 PHILIPPINES (FEBRUARY 2023)
4.3.2 EXPORT (TILL AUGUST 2022)
4.3.2.1 THAILAND (FEBRUARY 2023)
4.3.2.2 INDONESIA (FEBRUARY 2023)
4.3.2.3 SINGAPORE (FEBRUARY 2023)
4.4 PORTER’S FIVE FORCES
4.4.1 BARGAINING POWER OF BUYERS/CONSUMERS
4.4.2 BARGAINING POWER OF SUPPLIERS
4.4.3 THREAT OF NEW ENTRANTS
4.4.4 THREAT OF SUBSTITUTES
4.4.5 RIVALRY AMONG EXISTING COMPETITORS
4.5 RAW MATERIAL SOURCING ANALYSIS
4.5.1 FLAVOR INDUSTRY
4.5.1.1 NATURAL FLAVORING MATERIALS
4.6 OVERVIEW OF TECHNOLOGICAL INNOVATIONS
4.7 INDUSTRY TRENDS AND FUTURE PERSPECTIVE
4.8 GROWTH STRATEGIES ADOPTED BY KEY MARKET PLAYERS
4.9 FACTORS INFLUENCING PURCHASING DECISION OF END-USER
4.9.1 NEW FLAVOURS
4.9.2 ONLINE PLATFORMS
4.9.3 QUALITY INGREDIENTS
4.1 LIST OF COMPANIES PRODUCING NATURAL EXTRACT
4.11 IMPACT OF ECONOMIC SLOWDOWN ON MARKET
4.12 OVERVIEW
4.12.1 IMPACT ON PRICE
4.12.2 IMPACT ON SUPPLY CHAIN
4.12.3 IMPACT ON SHIPMENT
4.12.4 IMPACT ON COMPANY’S STRATEGIC DECISIONS
4.13 LIST OF KEY CUSTOMERS BY GEOGRAPHY
4.13.1 NORTH AMERICA
4.13.2 EUROPE
4.13.3 ASIA- PACIFIC
4.13.4 MIDDLE EAST AND AFRICA
4.13.5 SOUTH AFRICA
5 NATURAL INGREDIENTS USED AS FOOD FLAVORS CAN ALSO BE USED IN FEED FLAVORS
5.1 OVERVIEW
5.2 PRICING INDEX
5.3 OVERVIEW
5.4 PRICE AT B2B
5.5 PRICE AT FOB
5.6 PRODUCTION CAPACITY OF KEY MANUFACTURERS
5.7 OVERVIEW
6 REGULATORY FRAMEWORK AND GUIDELINES
6.1 EUROPE
6.2 U.S.
6.3 INDIA
6.4 JAPAN
6.5 IN CHINA
6.6 IN MALAYSIA
7 MARKET OVERVIEW
7.1 DRIVERS
7.1.1 INCREASING DEMAND FOR DIFFERENT FLAVORS IN FOOD AND BEVERAGE, BAKERY AND OTHER SEVERAL INDUSTRIES DUE TO THEIR HEALTH BENEFITS
7.1.2 CONSUMER INCLINATION TOWARD FLORAL AND NATURAL FLAVOURS
7.1.3 EXPANSION OF FOOD & BEVERAGE, BAKERY, AMONG OTHER INDUSTRIES
7.1.4 INCREASING DEMAND FOR FLAVOR-BASED VEGAN OR PLANT-BASED NUTRITIONAL FOOD AND BEVERAGES
7.2 RESTRAINTS
7.2.1 INCREASING REGULATION ON FLAVORED FORTIFIED FOOD
7.2.2 HIGHER PRICES OF FLAVORED NUTRITIONAL PRODUCTS
7.3 OPPORTUNITIES
7.3.1 INCREASE IN THE NUMBER OF LAUNCHES OF NEW FLAVOURS IN NUTRITIONAL FOOD AND BEVERAGES
7.3.2 ADOPTION OF CANNABIS AS A NATURAL INGREDIENT FOR FLAVOR DEVELOPMENT
7.4 CHALLENGES
7.4.1 SIDE EFFECTS CAUSED BY SYNTHETIC FLAVORS
8 ASIA PACIFIC FOOD FLAVORS MARKET, BY PRODUCT TYPE
8.1 OVERVIEW
8.2 NATURAL EXTRACT
8.3 FLAVOR INGREDIENT
9 ASIA PACIFIC FOOD FLAVORS MARKET, BY TYPE
9.1 OVERVIEW
9.2 FRUIT FLAVORS
9.2.1 TYPE
9.2.1.1 BERRIES
9.2.1.1.1 STRAWBERRY
9.2.1.1.2 BLUEBERRY
9.2.1.1.3 RASPBERRY STRAWBERRY
9.2.1.1.4 BLACKCURRANT
9.2.1.1.5 RED RASPBERRY
9.2.1.1.6 BLACK RASPBERRY
9.2.1.1.7 GRAPES
9.2.1.1.8 CRANBERRY
9.2.1.1.9 GOOSEBERRY
9.2.1.1.10 ACAI BERRY
9.2.1.1.11 GOJI BERRY
9.2.1.1.12 MARIONBERRY
9.2.1.1.13 MULBERRY
9.2.1.1.14 ARONIA BERRY
9.2.1.1.15 CITRUS BERRY
9.2.1.2 APPLE
9.2.1.3 BANANA
9.2.1.4 MANGO
9.2.1.5 PLUM
9.2.1.6 NECTARINES
9.2.1.7 PAPAYA
9.2.1.8 CANTALOUPE
9.2.1.9 HONEYDEW
9.2.1.10 APRICOT
9.2.1.11 PASSIONFRUIT
9.2.2 PRODUCT TYPE
9.2.2.1 NATURAL EXTRACT
9.2.2.2 FLAVOR INGREDIENT
9.2.3 SPICE FLAVORS
9.2.3.1 GINGER
9.2.3.2 PEPPER
9.2.3.3 CINNAMON
9.2.3.4 MUSTARD
9.2.3.5 TURMERIC
9.2.3.6 CARDAMOM
9.2.3.7 CUMIN
9.2.3.8 CORIANDER
9.2.3.9 CLOVES
9.2.3.10 NUTMEG
9.2.3.11 FENNEL
9.2.3.12 FENUGREEK
9.2.3.13 SAFFRON
9.2.3.14 OTHERS
9.2.4 PRODUCT TYPE
9.2.4.1 NATURAL EXTRACT
9.2.4.2 FLAVOR INGREDIENT
9.2.5 HERBAL FLAVORS
9.2.5.1 MINT
9.2.5.2 PEPPERMINT
9.2.5.3 SPEARMINT
9.2.5.4 WINTERGREEN
9.2.5.5 MENTHOL
9.2.5.6 BASIL
9.2.5.7 OREGANO
9.2.5.8 THYM
9.2.5.9 SAGE
9.2.5.10 ROSE ROSEMARY
9.2.5.11 LAVENDER
9.2.5.12 CHAMOMILE
9.2.5.13 GREEN TEA
9.2.5.14 HIBISCUS JASMINE
9.2.5.15 BERGAMOT
9.2.5.16 ORANGE BLOSSOM
9.2.5.17 VERBENA
9.2.5.18 SARSAPARILLA
9.2.5.19 SASSAFRAS
9.2.5.20 ALOE VERA
9.2.5.21 BLACK TEA
9.2.5.22 EUCALYPTUS
9.2.5.23 OTHERS
9.2.6 PRODUCT TYPE
9.2.6.1 NATURAL EXTRACT
9.2.6.2 FLAVOR INGREDIENT
9.2.7 CITRUS FLAVORS
9.2.7.1 ORANGE
9.2.7.2 LEMON
9.2.7.3 LIME MANDARIN ORANGE
9.2.7.4 TANGERINE
9.2.7.5 GRAPEFRUIT
9.2.7.6 BLOOD ORANGE
9.2.7.7 KEY LIMEKUMQUAT
9.2.7.8 OTHERS
9.2.8 PRODUCT TYPE
9.2.8.1 NATURAL EXTRACT
9.2.8.2 FLAVOR INGREDIENT
9.2.9 DAIRY FLAVORS
9.2.9.1 CREAM
9.2.9.2 BUTTER FLAVOR
9.2.9.2.1 MEDIUM BUTTERY FLAVOR NOTES
9.2.9.2.2 MEDIUM STRONG BUTTERY FLAVOR NOTES
9.2.9.2.3 STRONG BUTTERY FLAVOR NOTES
9.2.9.2.4 OTHERS
9.2.9.3 WHIPPED CREAM
9.2.9.4 BAVARIAN CREAM
9.2.9.5 CREAM CHEESE ICE CREAM
9.2.9.6 NUTELLA TYPE SWEET CREAM
9.2.9.7 YOGURT TYPE
9.2.9.8 WHITE CHOCOLATE
9.2.9.9 IRISH CREAM
9.2.9.10 MOCHA
9.2.9.11 OTHERS
9.2.10 PRODUCT TYPE
9.2.10.1 NATURAL EXTRACT
9.2.10.2 FLAVOR INGREDIENT
9.2.11 NUTTY FLAVORS
9.2.11.1 ALMOND
9.2.11.2 CASHEW
9.2.11.3 HAZELNUT MACADAMIA NUT
9.2.11.4 PEANUT
9.2.11.5 PISTACHIO
9.2.11.6 WALNUT
9.2.11.7 PECAN PINE NUT
9.2.11.8 OTHERS
9.2.12 PRODUCT TYPE
9.2.12.1 NATURAL EXTRACT
9.2.12.2 FLAVOR INGREDIENT
9.2.13 VEGETABLE FLAVORS
9.2.13.1 GARLIC
9.2.13.2 TOMATO
9.2.13.3 MUSHROOM
9.2.13.4 ONION
9.2.13.5 CUCUMBER
9.2.13.6 WATERMELON
9.2.13.7 CHERRY TOMATO
9.2.13.8 TOMATO BASIL
9.2.13.9 OTHERS
9.2.14 PRODUCT TYPE
9.2.14.1 NATURAL EXTRACT
9.2.14.2 FLAVOR INGREDIENT
9.3 COFFEE FLAVORS
9.3.1 PRODUCT TYPE
9.3.1.1 NATURAL EXTRACT
9.3.1.2 FLAVOR INGREDIENT
9.4 CHOCOLATE FLAVORS
9.4.1 PRODUCT TYPE
9.4.1.1 NATURAL EXTRACT
9.4.1.2 FLAVOR INGREDIENT
9.5 DATE DERIVATIVES
9.5.1 PRODUCT TYPE
9.5.1.1 NATURAL EXTRACT
9.5.1.2 FLAVOR INGREDIENT
9.5.2 VEGETABLE OILS
9.5.2.1 CULINARY ARGON OIL
9.5.2.2 POMEGRANATE SEED OIL
9.5.2.3 NIGELLA SEEDS OIL
9.5.2.4 MELON SEEDS OIL
9.5.3 PRODUCT TYPE
9.5.3.1 NATURAL EXTRACT
9.5.3.2 FLAVOR INGREDIENT
9.5.4 CANOB DERIVATIVES
9.5.5 OTHERS
9.5.5.1 FLORAL HYDROLATES
9.5.5.2 OTHERS
10 ASIA PACIFIC FOOD FLAVORS MARKET, BY ORIGIN
10.1 OVERVIEW
10.2 NATURAL
10.3 NATURAL IDENTICAL
10.4 ARTIFICIAL
11 ASIA PACIFIC FOOD FLAVORS MARKET, BY CATEGORY
11.1 OVERVIEW
11.2 CLEAN LABEL
11.3 HEAT STABLE
11.4 REGULAR
11.5 NON-ALLERGIC
11.6 OTHERS
12 ASIA PACIFIC FOOD FLAVORS MARKET, BY SOLUBILITY
12.1 OVERVIEW
12.2 WATER SOLUBLE
12.3 OIL SOLUBLE
12.4 FAT SOLUBLE
12.5 OTHERS
13 ASIA PACIFIC FOOD FLAVORS MARKET, BY FORM
13.1 OVERVIEW
13.2 LIQUID
13.3 POWDER
13.4 SYRUP
14 ASIA PACIFIC FOOD FLAVORS MARKET, BY APPLICATION
14.1 OVERVIEW
14.2 CONFECTIONERY
14.2.1 TYPE
14.2.1.1 HARD-BOILED SWEETS
14.2.1.2 GUMS & JELLIES
14.2.1.3 CHOCOLATE
14.2.1.4 MINTS
14.2.1.5 CARAMELS & TOFFEES
14.2.1.6 CHOCOLATE SYRUPS
14.2.1.7 OTHERS
14.2.2 FLAVOR TYPE
14.2.2.1 FRUIT FLAVORS
14.2.2.2 CITRUS FLAVORS
14.2.2.3 CHOCOLATE FLAVORS
14.2.2.4 DAIRY FLAVORS
14.2.2.5 SPICE FLAVORS
14.2.2.6 HERABL FLAVORS
14.2.2.7 NUTTY FLAVORS
14.2.2.8 COFFEE FLAVORS
14.2.2.9 DATE DERIVATIVES
14.2.2.10 VEGETABLE EXTRACTS
14.2.2.11 VEGETABLE OILS
14.2.2.12 OTHERS
14.2.3 PRODUCT TYPE
14.2.3.1 NATURAL EXTRACT
14.2.3.2 FLAVOR INGREDIENT
14.3 BAKERY
14.3.1 TYPE
14.3.1.1 BREAD & ROLLS
14.3.1.2 CAKES, PASTRIES & TRUFFLE
14.3.1.3 BISCUIT
14.3.1.4 TART & PIES
14.3.1.5 BROWNIES
14.3.1.6 COOKIES & CRACKERS
14.3.1.7 TORTILLA
14.3.1.8 OTHERS
14.3.2 FLAVORS TYPE
14.3.2.1 FRUIT FLAVORS
14.3.2.2 CHOCOLATE FLAVOR
14.3.2.3 SPICE FLAVORS
14.3.2.4 CITRUS FLAVORS
14.3.2.5 NUTTY FLAVORS
14.3.2.6 COFFEE FLAVORS
14.3.2.7 HERBAL FLAVORS
14.3.2.8 DAIRY FLAVORS
14.3.2.9 VEGETABLE EXTRACTS
14.3.2.10 DATE DERIVATIVES
14.3.2.11 VEGETABLE OILS
14.3.2.12 OTHERS
14.3.3 PRODUCT TYPE
14.3.3.1 NATURAL EXTRACT
14.3.3.2 FLAVOR INGREDIENT
14.4 CONVENIENCE FOOD
14.4.1 TYPE
14.4.1.1 INSTANT NOODLES
14.4.1.2 PIZZA & PASTA
14.4.1.3 FRENCH FRIES
14.4.1.4 NUGGETS
14.4.1.5 WEDGES
14.4.1.6 OTHERS
14.4.2 FLAVOR TYPE
14.4.2.1 DAIRY FLAVORS
14.4.2.2 FRUIT FLAVORS
14.4.2.3 CHOCOLATE FLAVOR
14.4.2.4 COFFEE FLAVORS
14.4.2.5 SPICE FLAVORS
14.4.2.6 CITRUS FLAVORS
14.4.2.7 HERBAL FLAVORS
14.4.2.8 NUTTY FLAVORS
14.4.2.9 VEGETABLE EXTRACTS
14.4.2.10 DATE DERIVATIVES
14.4.2.11 VEGETABLE OILS
14.4.2.12 OTHERS
14.4.3 PRODUCT TYPE
14.4.3.1 NATURAL EXTRACT
14.4.3.2 FLAVOR INGREDIENT
14.5 SNACKS & EXTRUDED SNACKS
14.5.1 FLAVOR TYPE
14.5.1.1 SPICE FLAVORS
14.5.1.2 DAIRY FLAVORS
14.5.1.3 VEGETABLE EXTRACTS
14.5.1.4 FRUIT FLAVORS
14.5.1.5 NUTTY FLAVORS
14.5.1.6 CITRUS FLAVORS
14.5.1.7 HERBAL FLAVORS
14.5.1.8 CHOCOLATE FLAVOR
14.5.1.9 COFFEE FLAVORS
14.5.1.10 DATE DERIVATIVES
14.5.1.11 VEGETABLE OILS
14.5.1.12 OTHERS
14.5.2 PRODUCT TYPE
14.5.2.1 NATURAL EXTRACT
14.5.2.2 FLAVOR INGREDIENT
14.6 FROZEN DESSERTS
14.6.1 TYPE
14.6.1.1 GELATO
14.6.1.2 FROZEN CUSTARD
14.6.1.3 SHERBETS
14.6.1.4 OTHERS
14.6.2 FLAVOR TYPE
14.6.2.1 FRUIT FLAVORS
14.6.2.2 DAIRY FLAVORS
14.6.2.3 CHOCOLATE FLAVOR
14.6.2.4 NUTTY FLAVORS
14.6.2.5 CITRUS FLAVORS
14.6.2.6 VEGETABLE EXTRACTS
14.6.2.7 COFFEE FLAVORS
14.6.2.8 SPICE FLAVORS
14.6.2.9 HERBAL FLAVORS
14.6.2.10 DATE DERIVATIVES
14.6.2.11 VEGETABLE OILS
14.6.2.12 OTHERS
14.6.3 PRODUCT TYPE
14.6.3.1 NATURAL EXTRACT
14.6.3.2 FLAVOR INGREDIENT
14.7 MEAT & POULTRY PRODUCTS
14.7.1 TYPE
14.7.1.1 CHICKEN
14.7.1.2 BEEF
14.7.1.3 PORK
14.7.1.4 SEAFOOD
14.7.1.5 LAMB
14.7.1.6 OTHERS
14.7.2 FLAVOR TYPE
14.7.2.1 SPICE FLAVORS
14.7.2.2 CITRUS FLAVORS
14.7.2.3 DAIRY FLAVORS
14.7.2.4 VEGETABLE EXTRACTS
14.7.2.5 NUTTY FLAVORS
14.7.2.6 CHOCOLATE FLAVOR
14.7.2.7 HERBAL FLAVORS
14.7.2.8 COFFEE FLAVORS
14.7.2.9 FRUIT FLAVORS
14.7.2.10 DATE DERIVATIVES
14.7.2.11 VEGETABLE OILS
14.7.2.12 OTHERS
14.7.3 PRODUCT TYPE
14.7.3.1 NATURAL EXTRACT
14.7.3.2 FLAVOR INGREDIENT
14.8 BREAKFAST CEREALS
14.8.1 FLAVOR TYPE
14.8.1.1 FRUIT FLAVORS
14.8.1.2 SPICE FLAVORS
14.8.1.3 DAIRY FLAVORS
14.8.1.4 NUTTY FLAVORS
14.8.1.5 HERBAL FLAVORS
14.8.1.6 CITRUS FLAVORS
14.8.1.7 VEGETABLE EXTRACTS
14.8.1.8 COFFEE FLAVORS
14.8.1.9 CHOCOLATE FLAVOR
14.8.1.10 DATE DERIVATIVES
14.8.1.11 VEGETABLE OILS
14.8.1.12 OTHERS
14.8.2 PRODUCT TYPE
14.8.2.1 NATURAL EXTRACT
14.8.2.2 FLAVOR INGREDIENT
14.9 PROCESSED FOOD
14.9.1 TYPE
14.9.1.1 READY MEALS
14.9.1.2 SAUCES, DRESSINGS AND CONDIMENTS
14.9.1.3 SOUPS
14.9.1.4 JAMS, PRESERVES & MARMALADES
14.9.1.5 CANNED FRUITS & VEGETABLES
14.9.1.6 FRUIT & VEGETABLE PUREE
14.9.1.7 PICKLES
14.9.1.8 OTHERS
14.9.2 FLAVOR TYPE
14.9.2.1 FRUIT FLAVORS
14.9.2.2 DAIRY FLAVORS
14.9.2.3 VEGETABLE EXTRACTS
14.9.2.4 SPICE FLAVORS
14.9.2.5 CITRUS FLAVORS
14.9.2.6 CHOCOLATE FLAVOR
14.9.2.7 COFFEE FLAVORS
14.9.2.8 NUTTY FLAVORS
14.9.2.9 HERBAL FLAVORS
14.9.2.10 DATE DERIVATIVES
14.9.2.11 VEGETABLE OILS
14.9.2.12 OTHERS
14.9.3 PRODUCT TYPE
14.9.3.1 NATURAL EXTRACT
14.9.3.2 FLAVOR INGREDIENT
14.1 BABY FOOD
14.10.1 FLAVOR TYPE
14.10.1.1 FRUIT FLAVORS
14.10.1.2 VEGETABLE EXTRACTS
14.10.1.3 DAIRY FLAVORS
14.10.1.4 SPICE FLAVORS
14.10.1.5 HERBAL FLAVORS
14.10.1.6 CITRUS FLAVORS
14.10.1.7 NUTTY FLAVORS
14.10.1.8 CHOCOLATE FLAVOR
14.10.1.9 COFFEE FLAVORS
14.10.1.10 DATE DERIVATIVES
14.10.1.11 VEGETABLE OILS
14.10.1.12 OTHERS
14.10.2 PRODUCT TYPE
14.10.2.1 NATURAL EXTRACT
14.10.2.2 FLAVOR INGREDIENT
14.11 SPORTS NUTRITION
14.11.1 TYPE
14.11.1.1 PROTEIN POWDERS
14.11.1.2 SPORT DRINKS
14.11.1.3 OTHERS
14.11.2 FLAVOR TYPE
14.11.2.1 CHOCOLATE FLAVOR
14.11.2.2 FRUIT FLAVORS
14.11.2.3 NUTTY FLAVORS
14.11.2.4 COFFEE FLAVORS
14.11.2.5 SPICE FLAVORS
14.11.2.6 CITRUS FLAVORS
14.11.2.7 DAIRY FLAVORS
14.11.2.8 HERBAL FLAVORS
14.11.2.9 DATE DERIVATIVES
14.11.2.10 VEGETABLE OILS
14.11.2.11 VEGETABLE EXTRACTS
14.11.2.12 OTHERS
14.11.3 PRODUCT TYPE
14.11.3.1 NATURAL EXTRACT
14.11.3.2 FLAVOR INGREDIENT
14.12 DIETARY SUPPLEMENTS
14.12.1 TYPE
14.12.1.1 CAPSULES
14.12.1.2 TABLETS
14.12.1.3 POWDER SUPPLEMENTS
14.12.1.4 GUMMIES
14.12.1.5 OTHERS
14.12.2 FLAVOR TYPE
14.12.2.1 CHOCOLATE FLAVOR
14.12.2.2 FRUIT FLAVORS
14.12.2.3 CITRUS FLAVORS
14.12.2.4 HERBAL FLAVORS
14.12.2.5 NUTTY FLAVORS
14.12.2.6 SPICE FLAVORS
14.12.2.7 DAIRY FLAVORS
14.12.2.8 VEGETABLE EXTRACTS
14.12.2.9 COFFEE FLAVORS
14.12.2.10 DATE DERIVATIVES
14.12.2.11 VEGETABLE OILS
14.12.2.12 OTHERS
14.12.3 PRODUCT TYPE
14.12.3.1 NATURAL EXTRACT
14.12.3.2 FLAVOR INGREDIENT
14.13 BEVERAGES
14.13.1 TYPE
14.13.1.1 CARBONATED DRINKS
14.13.1.2 TEA
14.13.1.3 COFFEE
14.13.1.4 PLANT-BASED MILK
14.13.1.5 JUICES
14.13.1.6 SMOOTHIES
14.13.1.7 SOFT DRINKS
14.13.1.8 OTHERS
14.13.2 FLAVOR TYPE
14.13.2.1 FRUIT FLAVORS
14.13.2.2 CITRUS FLAVORS
14.13.2.3 HERBAL FLAVORS
14.13.2.4 SPICE FLAVORS
14.13.2.5 CHOCOLATE FLAVOR
14.13.2.6 COFFEE FLAVORS
14.13.2.7 NUTTY FLAVORS
14.13.2.8 DAIRY FLAVORS
14.13.2.9 VEGETABLE EXTRACTS
14.13.2.10 DATE DERIVATIVES
14.13.2.11 VEGETABLE OILS
14.13.2.12 OTHERS
14.13.3 PRODUCT TYPE
14.13.3.1 NATURAL EXTRACT
14.13.3.2 FLAVOR INGREDIENT
15 ASIA PACIFIC FOOD FLAVORS MARKET, BY REGION
15.1 ASIA-PACIFIC
15.1.1 JAPAN
15.1.2 CHINA
15.1.3 INDIA
15.1.4 SOUTH KOREA
15.1.5 AUSTRALIA
15.1.6 SINGAPORE
15.1.7 THAILAND
15.1.8 MALAYSIA
15.1.9 INDONESIA
15.1.10 PHILIPPINES
15.1.11 REST OF ASIA PACIFIC
16 ASIA PACIFIC FOOD AND FLAVORS MARKET, COMPANY LANDSCAPE
16.1 COMPANY SHARE ANALYSIS: ASIA PACIFIC
17 SWOT ANALYSIS
18 COMPANY PROFILE
18.1 GIVAUDAN (2022)
18.1.1 COMPANY SNAPSHOT
18.1.2 REVENUE ANALYSIS
18.1.3 COMPANY SHARE ANALYSIS
18.1.4 PRODUCT PORTFOLIO
18.1.5 RECENT DEVELOPMENT
18.2 SYMRISE (2022)
18.2.1 COMPANY SNAPSHOT
18.2.2 REVENUE ANALYSIS
18.2.3 COMPANY SHARE ANALYSIS
18.2.4 PRODUCT PORTFOLIO
18.2.5 RECENT DEVELOPMENT
18.3 MANE
18.3.1 COMPANY SNAPSHOT
18.3.2 COMPANY SHARE ANALYSIS
18.3.3 PRODUCT PORTFOLIO
18.3.4 RECENT DEVELOPMENTS
18.4 FIRMENISCH SA
18.4.1 COMPANY SNAPSHOT
18.4.2 REVENUE ANALYSIS
18.4.3 COMPANY SHARE ANALYSIS
18.4.4 PRODUCT PORTFOLIO
18.4.5 RECENT DEVELOPMENTS
18.5 KERRY GROUP PLC (2022)
18.5.1 COMPANY SNAPSHOT
18.5.2 REVENUE ANALYSIS
18.5.3 COMPANY SHARE ANALYSIS
18.5.4 PRODUCT PORTFOLIO
18.5.5 RECENT DEVELOPMENT
18.6 ABELEI INC.
18.6.1 COMPANY SNAPSHOT
18.6.2 PRODUCT PORTFOLIO
18.6.3 RECENT DEVELOPMENT
18.7 ADM (2022)
18.7.1 COMPANY SNAPSHOT
18.7.2 REVENUE ANALYSIS
18.7.3 PRODUCT PORTFOLIO
18.7.4 RECENT DEVELOPMENTS
18.8 AROMATICA
18.8.1 COMPANY SNAPSHOT
18.8.2 PRODUCT PORTFOLIO
18.8.3 RECENT DEVELOPMENT
18.9 AXXENCE AROMATIC GMBH
18.9.1 COMPANY SNAPSHOT
18.9.2 PRODUCT PORTFOLIO
18.9.3 RECENT DEVELOPMENT
18.1 BLUE PACIFIC FLAVORS INC
18.10.1 COMPANY SNAPSHOT
18.10.2 PRODUCT PORTFOLIO
18.10.3 RECENT DEVELOPMENT
18.11 CARGILL, INCORPORATED.
18.11.1 COMPANY SNAPSHOT
18.11.2 PRODUCT PORTFOLIO
18.11.3 RECENT DEVELOPMENTS
18.12 CAPELLA FLAVORS
18.12.1 COMPANY SNAPSHOT
18.12.2 PRODUCT PORTFOLIO
18.12.3 RECENT DEVELOPMENT
18.13 CUSTOM FLAVORS
18.13.1 COMPANY SNAPSHOT
18.13.2 PRODUCT PORTFOLIO
18.13.3 RECENT DEVELOPMENT
18.14 DÖHLER
18.14.1 COMPANY SNAPSHOT
18.14.2 PRODUCT PORTFOLIO
18.14.3 RECENT DEVELOPMENT
18.15 ESSENTIAL FLAVORS
18.15.1 COMPANY SNAPSHOT
18.15.2 PRODUCT PORTFOLIO
18.15.3 RECENT DEVELOPMENT
18.16 FLAVORCAN INTERNATIONAL INC.
18.16.1 COMPANY SNAPSHOT
18.16.2 PRODUCT PORTFOLIO
18.16.3 RECENT DEVELOPMENT
18.17 FLAVOR PRODUCERS, LLC
18.17.1 COMPANY SNAPSHOT
18.17.2 PRODUCT PORTFOLIO
18.17.3 RECENT DEVELOPMENTS
18.18 FLAVORCHEM & ORCHIDIA FRAGRANCES
18.18.1 COMPANY SNAPSHOT
18.18.2 PRODUCT PORTFOLIO
18.18.3 RECENT DEVELOPMENTS
18.19 GOLD COAST INGREDIENTS
18.19.1 COMPANY SNAPSHOT
18.19.2 PRODUCT PORTFOLIO
18.19.3 RECENT DEVELOPMENT
18.2 HHOYA
18.20.1 COMPANY SNAPSHOT
18.20.2 PRODUCT PORTFOLIO
18.20.3 RECENT DEVELOPMENT
18.21 HONEYBERRY INTERNATIONAL LLP
18.21.1 COMPANY SNAPSHOT
18.21.2 PRODUCT PORTFOLIO
18.21.3 RECENT DEVELOPMENT
18.22 HUABAO INTERNATIONAL HOLDING LIMITED.
18.22.1 COMPANY SNAPSHOT
18.22.2 REVENUE ANALYSIS
18.22.3 PRODUCT PORTFOLIO
18.22.4 RECENT DEVELOPMENT
18.23 INTERNATIONAL FLAVORS & FRAGRANCES INC.
18.23.1 COMPANY SNAPSHOT
18.23.2 REVENUE ANALYSIS
18.23.3 PRODUCT PORTFOLIO
18.23.4 RECENT DEVELOPMENTS
18.24 KANEGRADE.
18.24.1 COMPANY SNAPSHOT
18.24.2 PRODUCT PORTFOLIO
18.24.3 RECENT DEVELOPMENT
18.25 KEVA FLAVOURS PVT. LTD.
18.25.1 COMPANY SNAPSHOT
18.25.2 PRODUCT PORTFOLIO
18.25.3 RECENT DEVELOPMENTS
18.26 MARTINBAUER
18.26.1 COMPANY SNAPSHOT
18.26.2 PRODUCT PORTFOLIO
18.26.3 RECENT DEVELOPMENT
18.27 MCCORMICK & COMPANY, INC.
18.27.1 COMPANY SNAPSHOT
18.27.2 REVENUE ANALYSIS
18.27.3 PRODUCT PORTFOLIO
18.27.4 RECENT DEVELOPMENT
18.28 NUTRADRY
18.28.1 COMPANY SNAPSHOT
18.28.2 PRODUCT PORTFOLIO
18.28.3 RECENT DEVELOPMENTS
18.29 PRINOVA GROUP LLC.
18.29.1 COMPANY SNAPSHOT
18.29.2 PRODUCT PORTFOLIO
18.29.3 RECENT DEVELOPMENTS
18.3 SYNTHITE INDUSTRIES
18.30.1 COMPANY SNAPSHOT
18.30.2 PRODUCT PORTFOLIO
18.30.3 RECENT DEVELOPMENT
18.31 SYNERGY FLAVORS, INC.,
18.31.1 COMPANY SNAPSHOT
18.31.2 PRODUCT PORTFOLIO
18.31.3 RECENT DEVELOPMENTS
18.32 SAN-EI GEN F.F.I, INC.
18.32.1 COMPANY SNAPSHOT
18.32.2 PRODUCT PORTFOLIO
18.32.3 RECENT DEVELOPMENT
18.33 STRINGER FLAVOR LTD.
18.33.1 COMPANY SNAPSHOT
18.33.2 PRODUCT PORTFOLIO
18.33.3 RECENT DEVELOPMENT
18.34 SENSIENT TECHNOLOGIES CORPORATION
18.34.1 COMPANY SNAPSHOT
18.34.2 REVENUE ANALYSIS
18.34.3 PRODUCT PORTFOLIO
18.34.4 RECENT DEVELOPMENT
18.35 T.HASEGAWA USA INC.
18.35.1 COMPANY SNAPSHOT
18.35.2 PRODUCT PORTFOLIO
18.35.3 RECENT DEVELOPMENTS
18.36 TAIYO INTERNATIONAL
18.36.1 COMPANY SNAPSHOT
18.36.2 PRODUCT PORTFOLIO
18.36.3 RECENT DEVELOPMENT
18.37 TAKASAGO INTERNATIONAL CORPORATION
18.37.1 COMPANY SNAPSHOT
18.37.2 REVENUE ANALYSIS
18.37.3 PRODUCT PORTFOLIO
18.37.4 RECENT DEVELOPMENT
18.38 TRILOGY FLAVORS
18.38.1 COMPANY SNAPSHOT
18.38.2 PRODUCT PORTFOLIO
18.38.3 RECENT DEVELOPMENT
19 QUESTIONNAIRE
20 RELATED REPORTS
Lista de Tabela
TABLE 1 COMPANY LIST FOR FEED FLAVORS
TABLE 2 COMPANY LIST FOR FOOD FLAVORS
TABLE 3 FREE ON BOARD (FOB)
TABLE 4 PRODUCTION CAPACITY OF KEY MARKET PLAYERS IN THE FOOD FLAVOR INDUSTRY
TABLE 5 ASIA PACIFIC FOOD FLAVORS MARKET, BY PRODUCT TYPE, 2021-2030 (USD MILLION)
TABLE 6 ASIA PACIFIC NATURAL EXTRACT IN FOOD FLAVORS MARKET, BY REGION, 2021-2030 (USD MILLION)
TABLE 7 ASIA PACIFIC FLAVOR INGREDIENTS IN FOOD FLAVORS MARKET, BY REGION, 2021-2030 (USD MILLION)
TABLE 8 ASIA PACIFIC FOOD FLAVORS MARKET, BY TYPE, 2021-2030 (USD MILLION)
TABLE 9 ASIA PACIFIC FRUIT FLAVORS IN FOOD FLAVORS MARKET, BY REGION, 2021-2030 (USD MILLION)
TABLE 10 ASIA PACIFIC FRUIT FLAVORS IN FOOD FLAVORS MARKET, BY TYPE, 2021-2030 (USD MILLION)
TABLE 11 ASIA PACIFIC BERRIES IN FOOD FLAVORS MARKET, BY TYPE, 2021-2030 (USD MILLION)
TABLE 12 ASIA PACIFIC FRUIT FLAVORS IN FOOD FLAVORS MARKET, BY PRODUCT TYPE, 2021-2030 (USD MILLION)
TABLE 13 ASIA PACIFIC SPICES FLAVOS IN FOOD FLAVORS MARKET, BY REGION, 2021-2030 (USD MILLION)
TABLE 14 ASIA PACIFIC SPICE FLAVORS IN FOOD FLAVORS MARKET, BY TYPE, 2021-2030 (USD MILLION)
TABLE 15 ASIA PACIFIC SPICE FLAVORS IN FOOD FLAVORS MARKET, BY PRODUCT TYPE, 2021-2030 (USD MILLION)
TABLE 16 ASIA PACIFIC HERBAL FLAVORS IN FOOD FLAVORS MARKET, BY REGION, 2021-2030 (USD MILLION)
TABLE 17 ASIA PACIFIC HERBAL FLAVORS IN FOOD FLAVORS MARKET, BY TYPE, 2021-2030 (USD MILLION)
TABLE 18 ASIA PACIFIC HERBAL FLAVORS IN FOOD FLAVORS MARKET, BY PRODUCT TYPE, 2021-2030 (USD MILLION)
TABLE 19 ASIA PACIFIC CITRUS FLAVORS IN FOOD FLAVORS MARKET, BY REGION, 2021-2030 (USD MILLION)
TABLE 20 ASIA PACIFIC CITRUS FLAVORS IN FOOD FLAVORS MARKET, BY TYPE, 2021-2030 (USD MILLION)
TABLE 21 ASIA PACIFIC CITRUS FLAVORS IN FOOD FLAVORS MARKET, BY PRODUCT TYPE, 2021-2030 (USD MILLION)
TABLE 22 ASIA PACIFIC DAIRY FLAVORS IN FOOD FLAVORS MARKET, BY REGION, 2021-2030 (USD MILLION)
TABLE 23 ASIA PACIFIC DAIRY FLAVORS IN FOOD FLAVORS MARKET, BY TYPE, 2021-2030 (USD MILLION)
TABLE 24 ASIA PACIFIC BUTTER FLAVOR IN FOOD FLAVORS MARKET, BY TYPE, 2021-2030 (USD MILLION)
TABLE 25 ASIA PACIFIC DAIRY FLAVORS IN FOOD FLAVORS MARKET, BY PRODUCT TYPE, 2021-2030 (USD MILLION)
TABLE 26 ASIA PACIFIC NUTTY FLAVORS IN FOOD FLAVORS MARKET, BY REGION, 2021-2030 (USD MILLION)
TABLE 27 ASIA PACIFIC NUTTY FLAVORS IN FOOD FLAVORS MARKET, BY TYPE, 2021-2030 (USD MILLION)
TABLE 28 ASIA PACIFIC NUTTY FLAVORS IN FOOD FLAVORS MARKET, BY PRODUCT TYPE, 2021-2030 (USD MILLION)
TABLE 29 ASIA PACIFIC VEGETABLE FLAVORS IN FOOD FLAVORS MARKET, BY REGION, 2021-2030 (USD MILLION)
TABLE 30 ASIA PACIFIC VEGETABLE FLAVORS IN FOOD FLAVORS MARKET, BY TYPE, 2021-2030 (USD MILLION)
TABLE 31 ASIA PACIFIC VEGETABLE FLAVORS IN FOOD FLAVORS MARKET, BY PRODUCT TYPE, 2021-2030 (USD MILLION)
TABLE 32 ASIA PACIFIC COFFEE FLAVORS IN FOOD FLAVORS MARKET, BY REGION, 2021-2030 (USD MILLION)
TABLE 33 ASIA PACIFIC COFFEE FLAVORS IN FOOD FLAVORS MARKET, BY PRODUCT TYPE, 2021-2030 (USD MILLION)
TABLE 34 ASIA PACIFIC CHOCOLATE FLAVORS IN FOOD FLAVORS MARKET, BY REGION, 2021-2030 (USD MILLION)
TABLE 35 ASIA PACIFIC CHOCOLATE FLAVORS IN FOOD FLAVORS MARKET, BY PRODUCT TYPE, 2021-2030 (USD MILLION)
TABLE 36 ASIA PACIFIC DATE DERIVATIVES IN FOOD FLAVORS MARKET, BY REGION, 2021-2030 (USD MILLION)
TABLE 37 ASIA PACIFIC DATE DERIVATIVES IN FOOD FLAVORS MARKET, BY PRODUCT TYPE, 2021-2030 (USD MILLION)
TABLE 38 ASIA PACIFIC DATE DERIVATIVES IN FOOD FLAVORS MARKET, BY REGION, 2021-2030 (USD MILLION)
TABLE 39 ASIA PACIFIC VEGETABLE OILS IN FOOD FLAVORS MARKET, BY PRODUCT TYPE, 2021-2030 (USD MILLION)
TABLE 40 ASIA PACIFIC VEGETABLE OILS IN FOOD FLAVORS MARKET, BY PRODUCT TYPE, 2021-2030 (USD MILLION)
TABLE 41 ASIA PACIFIC CANOB DERIVATIVES IN FOOD FLAVORS MARKET, BY REGION, 2021-2030 (USD MILLION)
TABLE 42 ASIA PACIFIC OTHERS IN FOOD FLAVORS MARKET, BY REGION, 2021-2030 (USD MILLION)
TABLE 43 ASIA PACIFIC OTHERS IN FOOD FLAVORS MARKET, BY PRODUCT TYPE, 2021-2030 (USD MILLION)
TABLE 44 ASIA PACIFIC FOOD FLAVORS MARKET, BY ORIGIN, 2021-2030 (USD MILLION)
TABLE 45 ASIA PACIFIC NATURAL IN FOOD FLAVORS MARKET, BY REGION, 2021-2030 (USD MILLION)
TABLE 46 ASIA PACIFIC NATURAL IDENTICAL IN FOOD FLAVORS MARKET, BY REGION, 2021-2030 (USD MILLION)
TABLE 47 ASIA PACIFIC ARTIFICIAL IN FOOD FLAVORS MARKET, BY REGION, 2021-2030 (USD MILLION)
TABLE 48 ASIA PACIFIC FOOD FLAVORS MARKET, BY CATEGORY, 2021-2030 (USD MILLION)
TABLE 49 ASIA PACIFIC CLEAN LABEL IN FOOD FLAVORS MARKET, BY REGION, 2021-2030 (USD MILLION)
TABLE 50 ASIA PACIFIC HEAT STABLE IN FOOD FLAVORS MARKET, BY REGION, 2021-2030 (USD MILLION)
TABLE 51 ASIA PACIFIC REGULAR IN FOOD FLAVORS MARKET, BY REGION, 2021-2030 (USD MILLION)
TABLE 52 ASIA PACIFIC NON-ALLERGIC IN FOOD FLAVORS MARKET, BY REGION, 2021-2030 (USD MILLION)
TABLE 53 ASIA PACIFIC OTHERS IN FOOD FLAVORS MARKET, BY REGION, 2021-2030 (USD MILLION)
TABLE 54 ASIA PACIFIC FOOD FLAVORS MARKET, BY SOLUBILITY, 2021-2030 (USD MILLION)
TABLE 55 ASIA PACIFIC WATER SOLUBLE IN FOOD FLAVORS MARKET, BY REGION, 2021-2030 (USD MILLION)
TABLE 56 ASIA PACIFIC OIL SOLUBLE IN FOOD FLAVORS MARKET, BY REGION, 2021-2030 (USD MILLION)
TABLE 57 ASIA PACIFIC FAT DISPERSIBLE IN FOOD FLAVORS MARKET, BY REGION, 2021-2030 (USD MILLION)
TABLE 58 ASIA PACIFIC OTHERS IN FOOD FLAVORS MARKET, BY REGION, 2021-2030 (USD MILLION)
TABLE 59 ASIA PACIFIC FOOD FLAVORS MARKET, BY FORM, 2021-2030 (USD MILLION)
TABLE 60 ASIA PACIFIC LIQUID IN FOOD FLAVORS MARKET, BY REGION, 2021-2030 (USD MILLION)
TABLE 61 ASIA PACIFIC POWDER IN FOOD FLAVORS MARKET, BY REGION, 2021-2030 (USD MILLION)
TABLE 62 ASIA PACIFIC SYRUP IN FOOD FLAVORS MARKET, BY REGION, 2021-2030 (USD MILLION)
TABLE 63 ASIA PACIFIC FOOD FLAVORS MARKET, BY APPLICATION, 2021-2030 (USD MILLION)
TABLE 64 ASIA PACIFIC CONFECTIONERY IN FOOD FLAVORS MARKET, BY REGION, 2021-2030 (USD MILLION)
TABLE 65 ASIA PACIFIC CONFECTIONERY IN FOOD FLAVORS MARKET, BY TYPE, 2021-2030 (USD MILLION)
TABLE 66 ASIA PACIFIC CONFECTIONERY IN FOOD FLAVORS MARKET, BY FLAVOR TYPE, 2021-2030 (USD MILLION)
TABLE 67 ASIA PACIFIC CONFECTIONERY IN FOOD FLAVORS MARKET, BY PRODUCT TYPE, 2021-2030 (USD MILLION)
TABLE 68 ASIA PACIFIC BAKERY IN FOOD FLAVORS MARKET, BY REGION, 2021-2030 (USD MILLION)
TABLE 69 ASIA PACIFIC BAKERY IN FOOD FLAVORS MARKET, BY TYPE, 2021-2030 (USD MILLION)
TABLE 70 ASIA PACIFIC BAKERY IN FOOD FLAVORS MARKET, BY FLAVORS TYPE, 2021-2030 (USD MILLION)
TABLE 71 ASIA PACIFIC BAKERY IN FOOD FLAVORS MARKET, BY PRODUCT TYPE, 2021-2030 (USD MILLION)
TABLE 72 ASIA PACIFIC CONVENIENCE FOOD IN FOOD FLAVORS MARKET, BY REGION, 2021-2030 (USD MILLION)
TABLE 73 ASIA PACIFIC CONVENIENCE FOOD IN FOOD FLAVORS MARKET, BY TYPE, 2021-2030 (USD MILLION)
TABLE 74 ASIA PACIFIC CONVENIENCE FOOD IN FOOD FLAVORS MARKET, BY FLAVOR TYPE, 2021-2030 (USD MILLION)
TABLE 75 ASIA PACIFIC CONVENIENCE FOOD IN FOOD FLAVORS MARKET, BY PRODUCT TYPE, 2021-2030 (USD MILLION)
TABLE 76 ASIA PACIFIC SNACKS & EXTRUDED SNACKS IN FOOD FLAVORS MARKET, BY REGION, 2021-2030 (USD MILLION)
TABLE 77 ASIA PACIFIC SNACKS & EXTRUDED SNACKS IN FOOD FLAVORS MARKET, BY FLAVOR TYPE, 2021-2030 (USD MILLION)
TABLE 78 ASIA PACIFIC SNACKS & EXTRUDED SNACKS IN FOOD FLAVORS MARKET, BY PRODUCT TYPE, 2021-2030 (USD MILLION)
TABLE 79 ASIA PACIFIC FROZEN DESSERTS PRODUCTS IN FOOD FLAVORS MARKET, BY REGION, 2021-2030 (USD MILLION)
TABLE 80 ASIA PACIFIC FROZEN DESSERTS IN FOOD FLAVORS MARKET, BY TYPE, 2021-2030 (USD MILLION)
TABLE 81 ASIA PACIFIC FROZEN DESSERTS IN FOOD FLAVORS MARKET, BY FLAVOR TYPE, 2021-2030 (USD MILLION)
TABLE 82 ASIA PACIFIC FROZEN DESSERTS IN FOOD FLAVORS MARKET, BY PRODUCT TYPE, 2021-2030 (USD MILLION)
TABLE 83 ASIA PACIFIC MEAT & POULTRY PRODUCTS IN FOOD FLAVORS MARKET, BY REGION, 2021-2030 (USD MILLION)
TABLE 84 ASIA PACIFIC MEAT AND POULTRY PRODUCTS IN FOOD FLAVORS MARKET, BY TYPE, 2021-2030 (USD MILLION)
TABLE 85 ASIA PACIFIC MEAT AND POULTRY PRODUCTS IN FOOD FLAVORS MARKET, BY FLAVOR TYPE, 2021-2030 (USD MILLION)
TABLE 86 ASIA PACIFIC MEAT AND POULTRY PRODUCTS IN FOOD FLAVORS MARKET, BY PRODUCT TYPE, 2021-2030 (USD MILLION)
TABLE 87 ASIA PACIFIC BREAKFAST CEREALS IN FOOD FLAVORS MARKET, BY REGION, 2021-2030 (USD MILLION)
TABLE 88 ASIA PACIFIC BREAKFAST CEREALS IN FOOD FLAVORS MARKET, BY FLAVOR TYPE, 2021-2030 (USD MILLION)
TABLE 89 ASIA PACIFIC BREAKFAST CEREALS IN FOOD FLAVORS MARKET, BY PRODUCT TYPE, 2021-2030 (USD MILLION)
TABLE 90 ASIA PACIFIC PROCESSED FOOD IN FOOD FLAVORS MARKET, BY REGION, 2021-2030 (USD MILLION)
TABLE 91 ASIA PACIFIC PROCESSED FOOD IN FOOD FLAVORS MARKET, BY TYPE, 2021-2030 (USD MILLION)
TABLE 92 ASIA PACIFIC PROCESSED FOOD IN FOOD FLAVORS MARKET, BY FLAVOR TYPE, 2021-2030 (USD MILLION)
TABLE 93 ASIA PACIFIC PROCESSED FOOD IN FOOD FLAVORS MARKET, BY PRODUCT TYPE, 2021-2030 (USD MILLION)
TABLE 94 ASIA PACIFIC BABY FOOD IN FOOD FLAVORS MARKET, BY REGION, 2021-2030 (USD MILLION)
TABLE 95 ASIA PACIFIC BABY FOOD IN FOOD FLAVORS MARKET, BY FLAVOR TYPE, 2021-2030 (USD MILLION)
TABLE 96 ASIA PACIFIC BABY FOOD IN FOOD FLAVORS MARKET, BY PRODUCT TYPE, 2021-2030 (USD MILLION)
TABLE 97 ASIA PACIFIC SPORTS NUTRITION IN FOOD FLAVORS MARKET, BY REGION, 2021-2030 (USD MILLION)
TABLE 98 ASIA PACIFIC SPORTS NUTRITION IN FOOD FLAVORS MARKET, BY TYPE, 2021-2030 (USD MILLION)
TABLE 99 ASIA PACIFIC SPORTS NUTRITION IN FOOD FLAVORS MARKET, BY FLAVOR TYPE, 2021-2030 (USD MILLION)
TABLE 100 ASIA PACIFIC SPORTS NUTRITION IN FOOD FLAVORS MARKET, BY PRODUCT TYPE, 2021-2030 (USD MILLION)
TABLE 101 ASIA PACIFIC DIETARY SUPPLEMENTS IN FOOD FLAVORS MARKET, BY REGION, 2021-2030 (USD MILLION)
TABLE 102 ASIA PACIFIC DIETARY SUPPLEMENTS IN FOOD FLAVORS MARKET, BY TYPE, 2021-2030 (USD MILLION)
TABLE 103 ASIA PACIFIC DIETARY SUPPLEMENTS IN FOOD FLAVORS MARKET, BY FLAVOR TYPE, 2021-2030 (USD MILLION)
TABLE 104 ASIA PACIFIC DIETARY SUPPLEMENTS IN FOOD FLAVORS MARKET, BY PRODUCT TYPE, 2021-2030 (USD MILLION)
TABLE 105 ASIA PACIFIC BEVERAGES IN FOOD FLAVORS MARKET, BY REGION, 2021-2030 (USD MILLION)
TABLE 106 ASIA PACIFIC BEVERAGES IN FOOD FLAVORS MARKET, BY TYPE, 2021-2030 (USD MILLION)
TABLE 107 ASIA PACIFIC BEVERAGES IN FOOD FLAVORS MARKET, BY FLAVOR TYPE, 2021-2030 (USD MILLION)
TABLE 108 ASIA PACIFIC BEVERAGES IN FOOD FLAVORS MARKET, BY PRODUCT TYPE, 2021-2030 (USD MILLION)
TABLE 109 ASIA-PACIFIC FOOD FLAVORS MARKET, BY COUNTRY, 2021-2030 (USD MILLION)
TABLE 110 ASIA-PACIFIC FOOD FLAVORS MARKET, BY PRODUCT TYPE, 2021-2030 (USD MILLION)
TABLE 111 ASIA-PACIFIC FOOD FLAVORS MARKET, BY TYPE, 2021-2030 (USD MILLION)
TABLE 112 ASIA-PACIFIC FRUIT FLAVORS IN FOOD FLAVORS MARKET, BY TYPE, 2021-2030 (USD MILLION)
TABLE 113 ASIA-PACIFIC FRUIT FLAVORS IN FOOD FLAVORS MARKET, BY PRODUCT TYPE, 2021-2030, VOLUME (KILO LITERS)
TABLE 114 ASIA-PACIFIC BERRIES IN FOOD FLAVORS MARKET, BY TYPE, 2021-2030 (USD MILLION)
TABLE 115 ASIA-PACIFIC BERRIES IN FOOD FLAVORS MARKET, BY PRODUCT TYPE, 2021-2030, VOLUME (KILO LITERS)
TABLE 116 ASIA-PACIFIC FRUIT FLAVORS IN FOOD FLAVORS MARKET, BY PRODUCT TYPE, 2021-2030 (USD MILLION)
TABLE 117 ASIA-PACIFIC SPICE FLAVORS IN FOOD FLAVORS MARKET, BY TYPE, 2021-2030 (USD MILLION)
TABLE 118 ASIA-PACIFIC SPICE FLAVORS IN FOOD FLAVORS MARKET, BY PRODUCT TYPE, 2021-2030, VOLUME (KILO LITERS)
TABLE 119 ASIA-PACIFIC SPICE FLAVORS IN FOOD FLAVORS MARKET, BY PRODUCT TYPE, 2021-2030 (USD MILLION)
TABLE 120 ASIA-PACIFIC HERBAL FLAVORS IN FOOD FLAVORS MARKET, BY TYPE, 2021-2030 (USD MILLION)
TABLE 121 ASIA-PACIFIC HERBAL FLAVORS IN FOOD FLAVORS MARKET, BY PRODUCT TYPE, 2021-2030, VOLUME (KILO LITERS)
TABLE 122 ASIA-PACIFIC HERBAL FLAVORS IN FOOD FLAVORS MARKET, BY PRODUCT TYPE, 2021-2030 (USD MILLION)
TABLE 123 ASIA-PACIFIC CITRUS FLAVORS IN FOOD FLAVORS MARKET, BY TYPE, 2021-2030 (USD MILLION)
TABLE 124 ASIA-PACIFIC CITRUS FLAVORS IN FOOD FLAVORS MARKET, BY PRODUCT TYPE, 2021-2030, VOLUME (KILO LITERS)
TABLE 125 ASIA-PACIFIC CITRUS FLAVORS IN FOOD FLAVORS MARKET, BY PRODUCT TYPE, 2021-2030 (USD MILLION)
TABLE 126 ASIA-PACIFIC DAIRY FLAVORS IN FOOD FLAVORS MARKET, BY TYPE, 2021-2030 (USD MILLION)
TABLE 127 ASIA-PACIFIC DAIRY FLAVORS IN FOOD FLAVORS MARKET, BY PRODUCT TYPE, 2021-2030, VOLUME (KILO LITERS)
TABLE 128 ASIA-PACIFIC BUTTER FLAVOR IN FOOD FLAVORS MARKET, BY TYPE, 2021-2030 (USD MILLION)
TABLE 129 ASIA-PACIFIC DAIRY FLAVORS IN FOOD FLAVORS MARKET, BY PRODUCT TYPE, 2021-2030 (USD MILLION)
TABLE 130 ASIA-PACIFIC NUTTY FLAVORS IN FOOD FLAVORS MARKET, BY TYPE, 2021-2030 (USD MILLION)
TABLE 131 ASIA-PACIFIC NUTTY FLAVORS IN FOOD FLAVORS MARKET, BY PRODUCT TYPE, 2021-2030, VOLUME (KILO LITERS)
TABLE 132 ASIA-PACIFIC NUTTY FLAVORS IN FOOD FLAVORS MARKET, BY PRODUCT TYPE, 2021-2030 (USD MILLION)
TABLE 133 ASIA-PACIFIC VEGETABLE EXTRACTS IN FOOD FLAVORS MARKET, BY TYPE, 2021-2030 (USD MILLION)
TABLE 134 ASIA-PACIFIC VEGETABLE EXTRACT IN FOOD FLAVORS MARKET, BY PRODUCT TYPE, 2021-2030, VOLUME (KILO LITERS)
TABLE 135 ASIA-PACIFIC VEGETABLE EXTRACTS IN FOOD FLAVORS MARKET, BY PRODUCT TYPE, 2021-2030 (USD MILLION)
TABLE 136 ASIA-PACIFIC COFFEE FLAVORS IN FOOD FLAVORS MARKET, BY PRODUCT TYPE, 2021-2030 (USD MILLION)
TABLE 137 ASIA-PACIFIC COFFEE FLAVORS IN FOOD FLAVORS MARKET, BY PRODUCT TYPE, 2021-2030, VOLUME (KILO LITERS)
TABLE 138 ASIA-PACIFIC CHOCOLATE FLAVORS IN FOOD FLAVORS MARKET, BY PRODUCT TYPE, 2021-2030 (USD MILLION)
TABLE 139 ASIA-PACIFIC CHOCOLATE FLAVORS IN FOOD FLAVORS MARKET, BY PRODUCT TYPE, 2021-2030, VOLUME (KILO LITERS)
TABLE 140 ASIA-PACIFIC DATE DERIVATIVES IN FOOD FLAVORS MARKET, BY PRODUCT TYPE, 2021-2030 (USD MILLION)
TABLE 141 ASIA-PACIFIC VEGETABLE OILS IN FOOD FLAVORS MARKET, BY TYPE, 2021-2030 (USD MILLION)
TABLE 142 ASIA-PACIFIC VEGETABLE OILS IN FOOD FLAVORS MARKET, BY PRODUCT TYPE, 2021-2030, VOLUME (KILO LITERS)
TABLE 143 ASIA-PACIFIC VEGETABLE OILS IN FOOD FLAVORS MARKET, BY PRODUCT TYPE, 2021-2030 (USD MILLION)
TABLE 144 ASIA-PACIFIC OTHERS IN FOOD FLAVORS MARKET, BY TYPE, 2021-2030 (USD MILLION)
TABLE 145 ASIA-PACIFIC FOOD FLAVORS MARKET, BY ORIGIN, 2021-2030 (USD MILLION)
TABLE 146 ASIA-PACIFIC FOOD FLAVORS MARKET, BY CATEGORY, 2021-2030 (USD MILLION)
TABLE 147 ASIA-PACIFIC FOOD FLAVORS MARKET, BY SOLUBILITY, 2021-2030 (USD MILLION)
TABLE 148 ASIA-PACIFIC FOOD FLAVORS MARKET, BY FORM, 2021-2030 (USD MILLION)
TABLE 149 ASIA-PACIFIC FOOD FLAVORS MARKET, BY APPLICATION, 2021-2030 (USD MILLION)
TABLE 150 ASIA-PACIFIC CONFECTIONERY IN FOOD FLAVORS MARKET, BY TYPE, 2021-2030 (USD MILLION)
TABLE 151 ASIA-PACIFIC CONFECTIONERY IN FOOD FLAVORS MARKET, BY FLAVOR TYPE, 2021-2030 (USD MILLION)
TABLE 152 ASIA-PACIFIC CONFECTIONERY IN FOOD FLAVORS MARKET, BY PRODUCT TYPE, 2021-2030 (USD MILLION)
TABLE 153 ASIA-PACIFIC BAKERY IN FOOD FLAVORS MARKET, BY TYPE, 2021-2030 (USD MILLION)
TABLE 154 ASIA-PACIFIC BAKERY IN FOOD FLAVORS MARKET, BY FLAVOR TYPE, 2021-2030 (USD MILLION)
TABLE 155 ASIA-PACIFIC BAKERY IN FOOD FLAVORS MARKET, BY PRODUCT TYPE, 2021-2030 (USD MILLION)
TABLE 156 ASIA-PACIFIC CONVENIENCE FOOD IN FOOD FLAVORS MARKET, BY TYPE, 2021-2030 (USD MILLION)
TABLE 157 ASIA-PACIFIC CONVENIENCE FOOD IN FOOD FLAVORS MARKET, BY FLAVOR TYPE, 2021-2030 (USD MILLION)
TABLE 158 ASIA-PACIFIC CONVENIENCE FOOD IN FOOD FLAVORS MARKET, BY PRODUCT TYPE, 2021-2030 (USD MILLION)
TABLE 159 ASIA-PACIFIC SNACKS & EXTRUDED SNACKS IN FOOD FLAVORS MARKET, BY FLAVOR TYPE, 2021-2030 (USD MILLION)
TABLE 160 ASIA-PACIFIC SNACKS & EXTRUDED SNACKS IN FOOD FLAVORS MARKET, BY PRODUCT TYPE, 2021-2030 (USD MILLION)
TABLE 161 ASIA-PACIFIC FROZEN DESSERTS IN FOOD FLAVORS MARKET, BY TYPE, 2021-2030 (USD MILLION)
TABLE 162 ASIA-PACIFIC FROZEN DESSERTS IN FOOD FLAVORS MARKET, BY FLAVOR TYPE, 2021-2030 (USD MILLION)
TABLE 163 ASIA-PACIFIC FROZEN DESSERTS IN FOOD FLAVORS MARKET, BY PRODUCT TYPE, 2021-2030 (USD MILLION)
TABLE 164 ASIA-PACIFIC MEAT AND POULTRY PRODUCTS IN FOOD FLAVORS MARKET, BY TYPE, 2021-2030 (USD MILLION)
TABLE 165 ASIA-PACIFIC MEAT AND POULTRY PRODUCTS IN FOOD FLAVORS MARKET, BY FLAVOR TYPE, 2021-2030 (USD MILLION)
TABLE 166 ASIA-PACIFIC MEAT AND POULTRY PRODUCTS IN FOOD FLAVORS MARKET, BY PRODUCT TYPE, 2021-2030 (USD MILLION)
TABLE 167 ASIA-PACIFIC BREAKFAST CEREALS IN FOOD FLAVORS MARKET, BY FLAVOR TYPE, 2021-2030 (USD MILLION)
TABLE 168 ASIA-PACIFIC BREAKFAST CEREALS IN FOOD FLAVORS MARKET, BY PRODUCT TYPE, 2021-2030 (USD MILLION)
TABLE 169 ASIA-PACIFIC PROCESSED FOOD IN FOOD FLAVORS MARKET, BY TYPE, 2021-2030 (USD MILLION)
TABLE 170 ASIA-PACIFIC PROCESSED FOOD IN FOOD FLAVORS MARKET, BY FLAVOR TYPE, 2021-2030 (USD MILLION)
TABLE 171 ASIA-PACIFIC PROCESSED FOOD IN FOOD FLAVORS MARKET, BY PRODUCT TYPE, 2021-2030 (USD MILLION)
TABLE 172 ASIA-PACIFIC BABY FOOD IN FOOD FLAVORS MARKET, BY FLAVOR TYPE, 2021-2030 (USD MILLION)
TABLE 173 ASIA-PACIFIC BABY FOOD IN FOOD FLAVORS MARKET, BY PRODUCT TYPE, 2021-2030 (USD MILLION)
TABLE 174 ASIA-PACIFIC SPORTS NUTRITION IN FOOD FLAVORS MARKET, BY TYPE, 2021-2030 (USD MILLION)
TABLE 175 ASIA-PACIFIC SPORTS NUTRITION IN FOOD FLAVORS MARKET, BY FLAVOR TYPE, 2021-2030 (USD MILLION)
TABLE 176 ASIA-PACIFIC SPORTS NUTRITION IN FOOD FLAVORS MARKET, BY PRODUCT TYPE, 2021-2030 (USD MILLION)
TABLE 177 ASIA-PACIFIC DIETARY SUPPLEMENTS IN FOOD FLAVORS MARKET, BY TYPE, 2021-2030 (USD MILLION)
TABLE 178 ASIA-PACIFIC DIETARY SUPPLEMENTS IN FOOD FLAVORS MARKET, BY FLAVOR TYPE, 2021-2030 (USD MILLION)
TABLE 179 ASIA-PACIFIC DIETARY SUPPLEMENTS IN FOOD FLAVORS MARKET, BY PRODUCT TYPE, 2021-2030 (USD MILLION)
TABLE 180 ASIA-PACIFIC BEVERAGES IN FOOD FLAVORS MARKET, BY TYPE, 2021-2030 (USD MILLION)
TABLE 181 ASIA-PACIFIC BEVERAGES IN FOOD FLAVORS MARKET, BY FLAVOR TYPE, 2021-2030 (USD MILLION)
TABLE 182 ASIA-PACIFIC BEVERAGES IN FOOD FLAVORS MARKET, BY PRODUCT TYPE, 2021-2030 (USD MILLION)
TABLE 183 JAPAN FOOD FLAVORS MARKET, BY PRODUCT TYPE, 2021-2030 (USD MILLION)
TABLE 184 JAPAN FOOD FLAVORS MARKET, BY TYPE, 2021-2030 (USD MILLION)
TABLE 185 JAPAN FRUIT FLAVORS IN FOOD FLAVORS MARKET, BY TYPE, 2021-2030 (USD MILLION)
TABLE 186 JAPAN FRUIT FLAVORS IN FOOD FLAVORS MARKET, BY PRODUCT TYPE, 2021-2030, VOLUME (KILO LITERS)
TABLE 187 JAPAN FRUIT FLAVORS IN FOOD FLAVORS MARKET, BY PRODUCT TYPE, 2021-2030 (ASP)
TABLE 188 JAPAN BERRIES IN FOOD FLAVORS MARKET, BY TYPE, 2021-2030 (USD MILLION)
TABLE 189 JAPAN BERRIES IN FOOD FLAVORS MARKET, BY PRODUCT TYPE, 2021-2030, VOLUME (KILO LITERS)
TABLE 190 JAPAN BERRIES IN FOOD FLAVORS MARKET, BY PRODUCT TYPE, 2021-2030 (ASP)
TABLE 191 JAPAN FRUIT FLAVORS IN FOOD FLAVORS MARKET, BY PRODUCT TYPE, 2021-2030 (USD MILLION)
TABLE 192 JAPAN SPICE FLAVORS IN FOOD FLAVORS MARKET, BY TYPE, 2021-2030 (USD MILLION)
TABLE 193 JAPAN SPICE FLAVORS IN FOOD FLAVORS MARKET, BY PRODUCT TYPE, 2021-2030, VOLUME (KILO LITERS)
TABLE 194 JAPAN SPICE FLAVORS IN FOOD FLAVORS MARKET, BY PRODUCT TYPE, 2021-2030 (ASP)
TABLE 195 JAPAN SPICE FLAVORS IN FOOD FLAVORS MARKET, BY PRODUCT TYPE, 2021-2030 (USD MILLION)
TABLE 196 JAPAN HERBAL FLAVORS IN FOOD FLAVORS MARKET, BY TYPE, 2021-2030 (USD MILLION)
TABLE 197 JAPAN HERBAL FLAVORS IN FOOD FLAVORS MARKET, BY PRODUCT TYPE, 2021-2030, VOLUME (KILO LITERS)
TABLE 198 JAPAN HERBAL FLAVORS IN FOOD FLAVORS MARKET, BY PRODUCT TYPE, 2021-2030 (ASP)
TABLE 199 JAPAN HERBAL FLAVORS IN FOOD FLAVORS MARKET, BY PRODUCT TYPE, 2021-2030 (USD MILLION)
TABLE 200 JAPAN CITRUS FLAVORS IN FOOD FLAVORS MARKET, BY TYPE, 2021-2030 (USD MILLION)
TABLE 201 JAPAN CITRUS FLAVORS IN FOOD FLAVORS MARKET, BY PRODUCT TYPE, 2021-2030, VOLUME (KILO LITERS)
TABLE 202 JAPAN CITRUS FLAVORS IN FOOD FLAVORS MARKET, BY PRODUCT TYPE, 2021-2030 (ASP)
TABLE 203 JAPAN CITRUS FLAVORS IN FOOD FLAVORS MARKET, BY PRODUCT TYPE, 2021-2030 (USD MILLION)
TABLE 204 JAPAN DAIRY FLAVORS IN FOOD FLAVORS MARKET, BY TYPE, 2021-2030 (USD MILLION)
TABLE 205 JAPAN DAIRY FLAVORS IN FOOD FLAVORS MARKET, BY PRODUCT TYPE, 2021-2030, VOLUME (KILO LITERS)
TABLE 206 JAPAN DAIRY FLAVORS IN FOOD FLAVORS MARKET, BY PRODUCT TYPE, 2021-2030 (ASP)
TABLE 207 JAPAN BUTTER FLAVOR IN FOOD FLAVORS MARKET, BY TYPE, 2021-2030 (USD MILLION)
TABLE 208 JAPAN DAIRY FLAVORS IN FOOD FLAVORS MARKET, BY PRODUCT TYPE, 2021-2030 (USD MILLION)
TABLE 209 JAPAN NUTTY FLAVORS IN FOOD FLAVORS MARKET, BY TYPE, 2021-2030 (USD MILLION)
TABLE 210 JAPAN NUTTY FLAVORS IN FOOD FLAVORS MARKET, BY PRODUCT TYPE, 2021-2030, VOLUME (KILO LITERS)
TABLE 211 JAPAN NUTTY FLAVORS IN FOOD FLAVORS MARKET, BY PRODUCT TYPE, 2021-2030 (ASP)
TABLE 212 JAPAN NUTTY FLAVORS IN FOOD FLAVORS MARKET, BY PRODUCT TYPE, 2021-2030 (USD MILLION)
TABLE 213 JAPAN VEGETABLE EXTRACTS IN FOOD FLAVORS MARKET, BY TYPE, 2021-2030 (USD MILLION)
TABLE 214 JAPAN VEGETABLE EXTRACT IN FOOD FLAVORS MARKET, BY PRODUCT TYPE, 2021-2030, VOLUME (KILO LITERS)
TABLE 215 JAPAN VEGETABLE EXTRACT IN FOOD FLAVORS MARKET, BY PRODUCT TYPE, 2021-2030 (ASP)
TABLE 216 JAPAN VEGETABLE EXTRACTS IN FOOD FLAVORS MARKET, BY PRODUCT TYPE, 2021-2030 (USD MILLION)
TABLE 217 JAPAN COFFEE FLAVORS IN FOOD FLAVORS MARKET, BY PRODUCT TYPE, 2021-2030 (USD MILLION)
TABLE 218 JAPAN COFFEE FLAVORS IN FOOD FLAVORS MARKET, BY PRODUCT TYPE, 2021-2030, VOLUME (KILO LITERS)
TABLE 219 JAPAN COFFEE FLAVORS IN FOOD FLAVORS MARKET, BY PRODUCT TYPE, 2021-2030 (ASP)
TABLE 220 JAPAN CHOCOLATE FLAVORS IN FOOD FLAVORS MARKET, BY PRODUCT TYPE, 2021-2030 (USD MILLION)
TABLE 221 JAPAN CHOCOLATE FLAVORS IN FOOD FLAVORS MARKET, BY PRODUCT TYPE, 2021-2030, VOLUME (KILO LITERS)
TABLE 222 JAPAN CHOCOLATE FLAVORS IN FOOD FLAVORS MARKET, BY PRODUCT TYPE, 2021-2030 (ASP)
TABLE 223 JAPAN DATE DERIVATIVES IN FOOD FLAVORS MARKET, BY PRODUCT TYPE, 2021-2030 (USD MILLION)
TABLE 224 JAPAN VEGETABLE OILS IN FOOD FLAVORS MARKET, BY TYPE, 2021-2030 (USD MILLION)
TABLE 225 JAPAN VEGETABLE OILS IN FOOD FLAVORS MARKET, BY PRODUCT TYPE, 2021-2030, VOLUME (KILO LITERS)
TABLE 226 JAPAN VEGETABLE OILS IN FOOD FLAVORS MARKET, BY PRODUCT TYPE, 2021-2030 (ASP)
TABLE 227 JAPAN VEGETABLE OILS IN FOOD FLAVORS MARKET, BY PRODUCT TYPE, 2021-2030 (USD MILLION)
TABLE 228 JAPAN OTHERS IN FOOD FLAVORS MARKET, BY TYPE, 2021-2030 (USD MILLION)
TABLE 229 JAPAN FOOD FLAVORS MARKET, BY ORIGIN, 2021-2030 (USD MILLION)
TABLE 230 JAPAN FOOD FLAVORS MARKET, BY CATEGORY, 2021-2030 (USD MILLION)
TABLE 231 JAPAN FOOD FLAVORS MARKET, BY SOLUBILITY, 2021-2030 (USD MILLION)
TABLE 232 JAPAN FOOD FLAVORS MARKET, BY FORM, 2021-2030 (USD MILLION)
TABLE 233 JAPAN FOOD FLAVORS MARKET, BY APPLICATION, 2021-2030 (USD MILLION)
TABLE 234 JAPAN CONFECTIONERY IN FOOD FLAVORS MARKET, BY TYPE, 2021-2030 (USD MILLION)
TABLE 235 JAPAN CONFECTIONERY IN FOOD FLAVORS MARKET, BY FLAVOR TYPE, 2021-2030 (USD MILLION)
TABLE 236 JAPAN CONFECTIONERY IN FOOD FLAVORS MARKET, BY PRODUCT TYPE, 2021-2030 (USD MILLION)
TABLE 237 JAPAN BAKERY IN FOOD FLAVORS MARKET, BY TYPE, 2021-2030 (USD MILLION)
TABLE 238 JAPAN BAKERY IN FOOD FLAVORS MARKET, BY FLAVOR TYPE, 2021-2030 (USD MILLION)
TABLE 239 JAPAN BAKERY IN FOOD FLAVORS MARKET, BY PRODUCT TYPE, 2021-2030 (USD MILLION)
TABLE 240 JAPAN CONVENIENCE FOOD IN FOOD FLAVORS MARKET, BY TYPE, 2021-2030 (USD MILLION)
TABLE 241 JAPAN CONVENIENCE FOOD IN FOOD FLAVORS MARKET, BY FLAVOR TYPE, 2021-2030 (USD MILLION)
TABLE 242 JAPAN CONVENIENCE FOOD IN FOOD FLAVORS MARKET, BY PRODUCT TYPE, 2021-2030 (USD MILLION)
TABLE 243 JAPAN SNACKS & EXTRUDED SNACKS IN FOOD FLAVORS MARKET, BY FLAVOR TYPE, 2021-2030 (USD MILLION)
TABLE 244 JAPAN SNACKS & EXTRUDED SNACKS IN FOOD FLAVORS MARKET, BY PRODUCT TYPE, 2021-2030 (USD MILLION)
TABLE 245 JAPAN FROZEN DESSERTS IN FOOD FLAVORS MARKET, BY TYPE, 2021-2030 (USD MILLION)
TABLE 246 JAPAN FROZEN DESSERTS IN FOOD FLAVORS MARKET, BY FLAVOR TYPE, 2021-2030 (USD MILLION)
TABLE 247 JAPAN FROZEN DESSERTS IN FOOD FLAVORS MARKET, BY PRODUCT TYPE, 2021-2030 (USD MILLION)
TABLE 248 JAPAN MEAT AND POULTRY PRODUCTS IN FOOD FLAVORS MARKET, BY TYPE, 2021-2030 (USD MILLION)
TABLE 249 JAPAN MEAT AND POULTRY PRODUCTS IN FOOD FLAVORS MARKET, BY FLAVOR TYPE, 2021-2030 (USD MILLION)
TABLE 250 JAPAN MEAT AND POULTRY PRODUCTS IN FOOD FLAVORS MARKET, BY PRODUCT TYPE, 2021-2030 (USD MILLION)
TABLE 251 JAPAN BREAKFAST CEREALS IN FOOD FLAVORS MARKET, BY FLAVOR TYPE, 2021-2030 (USD MILLION)
TABLE 252 JAPAN BREAKFAST CEREALS IN FOOD FLAVORS MARKET, BY PRODUCT TYPE, 2021-2030 (USD MILLION)
TABLE 253 JAPAN PROCESSED FOOD IN FOOD FLAVORS MARKET, BY TYPE, 2021-2030 (USD MILLION)
TABLE 254 JAPAN PROCESSED FOOD IN FOOD FLAVORS MARKET, BY FLAVOR TYPE, 2021-2030 (USD MILLION)
TABLE 255 JAPAN PROCESSED FOOD IN FOOD FLAVORS MARKET, BY PRODUCT TYPE, 2021-2030 (USD MILLION)
TABLE 256 JAPAN BABY FOOD IN FOOD FLAVORS MARKET, BY FLAVOR TYPE, 2021-2030 (USD MILLION)
TABLE 257 JAPAN BABY FOOD IN FOOD FLAVORS MARKET, BY PRODUCT TYPE, 2021-2030 (USD MILLION)
TABLE 258 JAPAN SPORTS NUTRITION IN FOOD FLAVORS MARKET, BY TYPE, 2021-2030 (USD MILLION)
TABLE 259 JAPAN SPORTS NUTRITION IN FOOD FLAVORS MARKET, BY FLAVOR TYPE, 2021-2030 (USD MILLION)
TABLE 260 JAPAN SPORTS NUTRITION IN FOOD FLAVORS MARKET, BY PRODUCT TYPE, 2021-2030 (USD MILLION)
TABLE 261 JAPAN DIETARY SUPPLEMENTS IN FOOD FLAVORS MARKET, BY TYPE, 2021-2030 (USD MILLION)
TABLE 262 JAPAN DIETARY SUPPLEMENTS IN FOOD FLAVORS MARKET, BY FLAVOR TYPE, 2021-2030 (USD MILLION)
TABLE 263 JAPAN DIETARY SUPPLEMENTS IN FOOD FLAVORS MARKET, BY PRODUCT TYPE, 2021-2030 (USD MILLION)
TABLE 264 JAPAN BEVERAGES IN FOOD FLAVORS MARKET, BY TYPE, 2021-2030 (USD MILLION)
TABLE 265 JAPAN BEVERAGES IN FOOD FLAVORS MARKET, BY FLAVOR TYPE, 2021-2030 (USD MILLION)
TABLE 266 JAPAN BEVERAGES IN FOOD FLAVORS MARKET, BY PRODUCT TYPE, 2021-2030 (USD MILLION)
TABLE 267 CHINA FOOD FLAVORS MARKET, BY PRODUCT TYPE, 2021-2030 (USD MILLION)
TABLE 268 CHINA FOOD FLAVORS MARKET, BY TYPE, 2021-2030 (USD MILLION)
TABLE 269 CHINA FRUIT FLAVORS IN FOOD FLAVORS MARKET, BY TYPE, 2021-2030 (USD MILLION)
TABLE 270 CHINA FRUIT FLAVORS IN FOOD FLAVORS MARKET, BY PRODUCT TYPE, 2021-2030, VOLUME (KILO LITERS)
TABLE 271 CHINA FRUIT FLAVORS IN FOOD FLAVORS MARKET, BY PRODUCT TYPE, 2021-2030 (ASP)
TABLE 272 CHINA BERRIES IN FOOD FLAVORS MARKET, BY TYPE, 2021-2030 (USD MILLION)
TABLE 273 CHINA BERRIES IN FOOD FLAVORS MARKET, BY PRODUCT TYPE, 2021-2030, VOLUME (KILO LITERS)
TABLE 274 CHINA BERRIES IN FOOD FLAVORS MARKET, BY PRODUCT TYPE, 2021-2030 (ASP)
TABLE 275 CHINA FRUIT FLAVORS IN FOOD FLAVORS MARKET, BY PRODUCT TYPE, 2021-2030 (USD MILLION)
TABLE 276 CHINA SPICE FLAVORS IN FOOD FLAVORS MARKET, BY TYPE, 2021-2030 (USD MILLION)
TABLE 277 CHINA SPICE FLAVORS IN FOOD FLAVORS MARKET, BY PRODUCT TYPE, 2021-2030, VOLUME (KILO LITERS)
TABLE 278 CHINA SPICE FLAVORS IN FOOD FLAVORS MARKET, BY PRODUCT TYPE, 2021-2030 (ASP)
TABLE 279 CHINA SPICE FLAVORS IN FOOD FLAVORS MARKET, BY PRODUCT TYPE, 2021-2030 (USD MILLION)
TABLE 280 CHINA HERBAL FLAVORS IN FOOD FLAVORS MARKET, BY TYPE, 2021-2030 (USD MILLION)
TABLE 281 CHINA HERBAL FLAVORS IN FOOD FLAVORS MARKET, BY PRODUCT TYPE, 2021-2030, VOLUME (KILO LITERS)
TABLE 282 CHINA HERBAL FLAVORS IN FOOD FLAVORS MARKET, BY PRODUCT TYPE, 2021-2030 (ASP)
TABLE 283 CHINA HERBAL FLAVORS IN FOOD FLAVORS MARKET, BY PRODUCT TYPE, 2021-2030 (USD MILLION)
TABLE 284 CHINA CITRUS FLAVORS IN FOOD FLAVORS MARKET, BY TYPE, 2021-2030 (USD MILLION)
TABLE 285 CHINA CITRUS FLAVORS IN FOOD FLAVORS MARKET, BY PRODUCT TYPE, 2021-2030, VOLUME (KILO LITERS)
TABLE 286 CHINA CITRUS FLAVORS IN FOOD FLAVORS MARKET, BY PRODUCT TYPE, 2021-2030 (ASP)
TABLE 287 CHINA CITRUS FLAVORS IN FOOD FLAVORS MARKET, BY PRODUCT TYPE, 2021-2030 (USD MILLION)
TABLE 288 CHINA DAIRY FLAVORS IN FOOD FLAVORS MARKET, BY TYPE, 2021-2030 (USD MILLION)
TABLE 289 CHINA DAIRY FLAVORS IN FOOD FLAVORS MARKET, BY PRODUCT TYPE, 2021-2030, VOLUME (KILO LITERS)
TABLE 290 CHINA DAIRY FLAVORS IN FOOD FLAVORS MARKET, BY PRODUCT TYPE, 2021-2030 (ASP)
TABLE 291 CHINA BUTTER FLAVOR IN FOOD FLAVORS MARKET, BY TYPE, 2021-2030 (USD MILLION)
TABLE 292 CHINA DAIRY FLAVORS IN FOOD FLAVORS MARKET, BY PRODUCT TYPE, 2021-2030 (USD MILLION)
TABLE 293 CHINA NUTTY FLAVORS IN FOOD FLAVORS MARKET, BY TYPE, 2021-2030 (USD MILLION)
TABLE 294 CHINA NUTTY FLAVORS IN FOOD FLAVORS MARKET, BY PRODUCT TYPE, 2021-2030, VOLUME (KILO LITERS)
TABLE 295 CHINA NUTTY FLAVORS IN FOOD FLAVORS MARKET, BY PRODUCT TYPE, 2021-2030 (ASP)
TABLE 296 CHINA NUTTY FLAVORS IN FOOD FLAVORS MARKET, BY PRODUCT TYPE, 2021-2030 (USD MILLION)
TABLE 297 CHINA VEGETABLE EXTRACTS IN FOOD FLAVORS MARKET, BY TYPE, 2021-2030 (USD MILLION)
TABLE 298 CHINA VEGETABLE EXTRACT IN FOOD FLAVORS MARKET, BY PRODUCT TYPE, 2021-2030, VOLUME (KILO LITERS)
TABLE 299 CHINA VEGETABLE EXTRACT IN FOOD FLAVORS MARKET, BY PRODUCT TYPE, 2021-2030 (ASP)
TABLE 300 CHINA VEGETABLE EXTRACTS IN FOOD FLAVORS MARKET, BY PRODUCT TYPE, 2021-2030 (USD MILLION)
TABLE 301 CHINA COFFEE FLAVORS IN FOOD FLAVORS MARKET, BY PRODUCT TYPE, 2021-2030 (USD MILLION)
TABLE 302 CHINA COFFEE FLAVORS IN FOOD FLAVORS MARKET, BY PRODUCT TYPE, 2021-2030, VOLUME (KILO LITERS)
TABLE 303 CHINA COFFEE FLAVORS IN FOOD FLAVORS MARKET, BY PRODUCT TYPE, 2021-2030 (ASP)
TABLE 304 CHINA CHOCOLATE FLAVORS IN FOOD FLAVORS MARKET, BY PRODUCT TYPE, 2021-2030 (USD MILLION)
TABLE 305 CHINA CHOCOLATE FLAVORS IN FOOD FLAVORS MARKET, BY PRODUCT TYPE, 2021-2030, VOLUME (KILO LITERS)
TABLE 306 CHINA CHOCOLATE FLAVORS IN FOOD FLAVORS MARKET, BY PRODUCT TYPE, 2021-2030 (ASP)
TABLE 307 CHINA DATE DERIVATIVES IN FOOD FLAVORS MARKET, BY PRODUCT TYPE, 2021-2030 (USD MILLION)
TABLE 308 CHINA VEGETABLE OILS IN FOOD FLAVORS MARKET, BY TYPE, 2021-2030 (USD MILLION)
TABLE 309 CHINA VEGETABLE OILS IN FOOD FLAVORS MARKET, BY PRODUCT TYPE, 2021-2030, VOLUME (KILO LITERS)
TABLE 310 CHINA VEGETABLE OILS IN FOOD FLAVORS MARKET, BY PRODUCT TYPE, 2021-2030 (ASP)
TABLE 311 CHINA VEGETABLE OILS IN FOOD FLAVORS MARKET, BY PRODUCT TYPE, 2021-2030 (USD MILLION)
TABLE 312 CHINA OTHERS IN FOOD FLAVORS MARKET, BY TYPE, 2021-2030 (USD MILLION)
TABLE 313 CHINA FOOD FLAVORS MARKET, BY ORIGIN, 2021-2030 (USD MILLION)
TABLE 314 CHINA FOOD FLAVORS MARKET, BY CATEGORY, 2021-2030 (USD MILLION)
TABLE 315 CHINA FOOD FLAVORS MARKET, BY SOLUBILITY, 2021-2030 (USD MILLION)
TABLE 316 CHINA FOOD FLAVORS MARKET, BY FORM, 2021-2030 (USD MILLION)
TABLE 317 CHINA FOOD FLAVORS MARKET, BY APPLICATION, 2021-2030 (USD MILLION)
TABLE 318 CHINA CONFECTIONERY IN FOOD FLAVORS MARKET, BY TYPE, 2021-2030 (USD MILLION)
TABLE 319 CHINA CONFECTIONERY IN FOOD FLAVORS MARKET, BY FLAVOR TYPE, 2021-2030 (USD MILLION)
TABLE 320 CHINA CONFECTIONERY IN FOOD FLAVORS MARKET, BY PRODUCT TYPE, 2021-2030 (USD MILLION)
TABLE 321 CHINA BAKERY IN FOOD FLAVORS MARKET, BY TYPE, 2021-2030 (USD MILLION)
TABLE 322 CHINA BAKERY IN FOOD FLAVORS MARKET, BY FLAVOR TYPE, 2021-2030 (USD MILLION)
TABLE 323 CHINA BAKERY IN FOOD FLAVORS MARKET, BY PRODUCT TYPE, 2021-2030 (USD MILLION)
TABLE 324 CHINA CONVENIENCE FOOD IN FOOD FLAVORS MARKET, BY TYPE, 2021-2030 (USD MILLION)
TABLE 325 CHINA CONVENIENCE FOOD IN FOOD FLAVORS MARKET, BY FLAVOR TYPE, 2021-2030 (USD MILLION)
TABLE 326 CHINA CONVENIENCE FOOD IN FOOD FLAVORS MARKET, BY PRODUCT TYPE, 2021-2030 (USD MILLION)
TABLE 327 CHINA SNACKS & EXTRUDED SNACKS IN FOOD FLAVORS MARKET, BY FLAVOR TYPE, 2021-2030 (USD MILLION)
TABLE 328 CHINA SNACKS & EXTRUDED SNACKS IN FOOD FLAVORS MARKET, BY PRODUCT TYPE, 2021-2030 (USD MILLION)
TABLE 329 CHINA FROZEN DESSERTS IN FOOD FLAVORS MARKET, BY TYPE, 2021-2030 (USD MILLION)
TABLE 330 CHINA FROZEN DESSERTS IN FOOD FLAVORS MARKET, BY FLAVOR TYPE, 2021-2030 (USD MILLION)
TABLE 331 CHINA FROZEN DESSERTS IN FOOD FLAVORS MARKET, BY PRODUCT TYPE, 2021-2030 (USD MILLION)
TABLE 332 CHINA MEAT AND POULTRY PRODUCTS IN FOOD FLAVORS MARKET, BY TYPE, 2021-2030 (USD MILLION)
TABLE 333 CHINA MEAT AND POULTRY PRODUCTS IN FOOD FLAVORS MARKET, BY FLAVOR TYPE, 2021-2030 (USD MILLION)
TABLE 334 CHINA MEAT AND POULTRY PRODUCTS IN FOOD FLAVORS MARKET, BY PRODUCT TYPE, 2021-2030 (USD MILLION)
TABLE 335 CHINA BREAKFAST CEREALS IN FOOD FLAVORS MARKET, BY FLAVOR TYPE, 2021-2030 (USD MILLION)
TABLE 336 CHINA BREAKFAST CEREALS IN FOOD FLAVORS MARKET, BY PRODUCT TYPE, 2021-2030 (USD MILLION)
TABLE 337 CHINA PROCESSED FOOD IN FOOD FLAVORS MARKET, BY TYPE, 2021-2030 (USD MILLION)
TABLE 338 CHINA PROCESSED FOOD IN FOOD FLAVORS MARKET, BY FLAVOR TYPE, 2021-2030 (USD MILLION)
TABLE 339 CHINA PROCESSED FOOD IN FOOD FLAVORS MARKET, BY PRODUCT TYPE, 2021-2030 (USD MILLION)
TABLE 340 CHINA BABY FOOD IN FOOD FLAVORS MARKET, BY FLAVOR TYPE, 2021-2030 (USD MILLION)
TABLE 341 CHINA BABY FOOD IN FOOD FLAVORS MARKET, BY PRODUCT TYPE, 2021-2030 (USD MILLION)
TABLE 342 CHINA SPORTS NUTRITION IN FOOD FLAVORS MARKET, BY TYPE, 2021-2030 (USD MILLION)
TABLE 343 CHINA SPORTS NUTRITION IN FOOD FLAVORS MARKET, BY FLAVOR TYPE, 2021-2030 (USD MILLION)
TABLE 344 CHINA SPORTS NUTRITION IN FOOD FLAVORS MARKET, BY PRODUCT TYPE, 2021-2030 (USD MILLION)
TABLE 345 CHINA DIETARY SUPPLEMENTS IN FOOD FLAVORS MARKET, BY TYPE, 2021-2030 (USD MILLION)
TABLE 346 CHINA DIETARY SUPPLEMENTS IN FOOD FLAVORS MARKET, BY FLAVOR TYPE, 2021-2030 (USD MILLION)
TABLE 347 CHINA DIETARY SUPPLEMENTS IN FOOD FLAVORS MARKET, BY PRODUCT TYPE, 2021-2030 (USD MILLION)
TABLE 348 CHINA BEVERAGES IN FOOD FLAVORS MARKET, BY TYPE, 2021-2030 (USD MILLION)
TABLE 349 CHINA BEVERAGES IN FOOD FLAVORS MARKET, BY FLAVOR TYPE, 2021-2030 (USD MILLION)
TABLE 350 CHINA BEVERAGES IN FOOD FLAVORS MARKET, BY PRODUCT TYPE, 2021-2030 (USD MILLION)
TABLE 351 INDIA FOOD FLAVORS MARKET, BY PRODUCT TYPE, 2021-2030 (USD MILLION)
TABLE 352 INDIA FOOD FLAVORS MARKET, BY TYPE, 2021-2030 (USD MILLION)
TABLE 353 INDIA FRUIT FLAVORS IN FOOD FLAVORS MARKET, BY TYPE, 2021-2030 (USD MILLION)
TABLE 354 INDIA FRUIT FLAVORS IN FOOD FLAVORS MARKET, BY PRODUCT TYPE, 2021-2030, VOLUME (KILO LITERS)
TABLE 355 INDIA FRUIT FLAVORS IN FOOD FLAVORS MARKET, BY PRODUCT TYPE, 2021-2030 (ASP)
TABLE 356 INDIA BERRIES IN FOOD FLAVORS MARKET, BY TYPE, 2021-2030 (USD MILLION)
TABLE 357 INDIA BERRIES IN FOOD FLAVORS MARKET, BY PRODUCT TYPE, 2021-2030, VOLUME (KILO LITERS)
TABLE 358 INDIA BERRIES IN FOOD FLAVORS MARKET, BY PRODUCT TYPE, 2021-2030 (ASP)
TABLE 359 INDIA FRUIT FLAVORS IN FOOD FLAVORS MARKET, BY PRODUCT TYPE, 2021-2030 (USD MILLION)
TABLE 360 INDIA SPICE FLAVORS IN FOOD FLAVORS MARKET, BY TYPE, 2021-2030 (USD MILLION)
TABLE 361 INDIA SPICE FLAVORS IN FOOD FLAVORS MARKET, BY PRODUCT TYPE, 2021-2030, VOLUME (KILO LITERS)
TABLE 362 INDIA SPICE FLAVORS IN FOOD FLAVORS MARKET, BY PRODUCT TYPE, 2021-2030 (ASP)
TABLE 363 INDIA SPICE FLAVORS IN FOOD FLAVORS MARKET, BY PRODUCT TYPE, 2021-2030 (USD MILLION)
TABLE 364 INDIA HERBAL FLAVORS IN FOOD FLAVORS MARKET, BY TYPE, 2021-2030 (USD MILLION)
TABLE 365 INDIA HERBAL FLAVORS IN FOOD FLAVORS MARKET, BY PRODUCT TYPE, 2021-2030, VOLUME (KILO LITERS)
TABLE 366 INDIA HERBAL FLAVORS IN FOOD FLAVORS MARKET, BY PRODUCT TYPE, 2021-2030 (ASP)
TABLE 367 INDIA HERBAL FLAVORS IN FOOD FLAVORS MARKET, BY PRODUCT TYPE, 2021-2030 (USD MILLION)
TABLE 368 INDIA CITRUS FLAVORS IN FOOD FLAVORS MARKET, BY TYPE, 2021-2030 (USD MILLION)
TABLE 369 INDIA CITRUS FLAVORS IN FOOD FLAVORS MARKET, BY PRODUCT TYPE, 2021-2030, VOLUME (KILO LITERS)
TABLE 370 INDIA CITRUS FLAVORS IN FOOD FLAVORS MARKET, BY PRODUCT TYPE, 2021-2030 (ASP)
TABLE 371 INDIA CITRUS FLAVORS IN FOOD FLAVORS MARKET, BY PRODUCT TYPE, 2021-2030 (USD MILLION)
TABLE 372 INDIA DAIRY FLAVORS IN FOOD FLAVORS MARKET, BY TYPE, 2021-2030 (USD MILLION)
TABLE 373 INDIA DAIRY FLAVORS IN FOOD FLAVORS MARKET, BY PRODUCT TYPE, 2021-2030, VOLUME (KILO LITERS)
TABLE 374 INDIA DAIRY FLAVORS IN FOOD FLAVORS MARKET, BY PRODUCT TYPE, 2021-2030 (ASP)
TABLE 375 INDIA BUTTER FLAVOR IN FOOD FLAVORS MARKET, BY TYPE, 2021-2030 (USD MILLION)
TABLE 376 INDIA DAIRY FLAVORS IN FOOD FLAVORS MARKET, BY PRODUCT TYPE, 2021-2030 (USD MILLION)
TABLE 377 INDIA NUTTY FLAVORS IN FOOD FLAVORS MARKET, BY TYPE, 2021-2030 (USD MILLION)
TABLE 378 INDIA NUTTY FLAVORS IN FOOD FLAVORS MARKET, BY PRODUCT TYPE, 2021-2030, VOLUME (KILO LITERS)
TABLE 379 INDIA NUTTY FLAVORS IN FOOD FLAVORS MARKET, BY PRODUCT TYPE, 2021-2030 (ASP)
TABLE 380 INDIA NUTTY FLAVORS IN FOOD FLAVORS MARKET, BY PRODUCT TYPE, 2021-2030 (USD MILLION)
TABLE 381 INDIA VEGETABLE EXTRACTS IN FOOD FLAVORS MARKET, BY TYPE, 2021-2030 (USD MILLION)
TABLE 382 INDIA VEGETABLE EXTRACT IN FOOD FLAVORS MARKET, BY PRODUCT TYPE, 2021-2030, VOLUME (KILO LITERS)
TABLE 383 INDIA VEGETABLE EXTRACT IN FOOD FLAVORS MARKET, BY PRODUCT TYPE, 2021-2030 (ASP)
TABLE 384 INDIA VEGETABLE EXTRACTS IN FOOD FLAVORS MARKET, BY PRODUCT TYPE, 2021-2030 (USD MILLION)
TABLE 385 INDIA COFFEE FLAVORS IN FOOD FLAVORS MARKET, BY PRODUCT TYPE, 2021-2030 (USD MILLION)
TABLE 386 INDIA COFFEE FLAVORS IN FOOD FLAVORS MARKET, BY PRODUCT TYPE, 2021-2030, VOLUME (KILO LITERS)
TABLE 387 INDIA COFFEE FLAVORS IN FOOD FLAVORS MARKET, BY PRODUCT TYPE, 2021-2030 (ASP)
TABLE 388 INDIA CHOCOLATE FLAVORS IN FOOD FLAVORS MARKET, BY PRODUCT TYPE, 2021-2030 (USD MILLION)
TABLE 389 INDIA CHOCOLATE FLAVORS IN FOOD FLAVORS MARKET, BY PRODUCT TYPE, 2021-2030, VOLUME (KILO LITERS)
TABLE 390 INDIA CHOCOLATE FLAVORS IN FOOD FLAVORS MARKET, BY PRODUCT TYPE, 2021-2030 (ASP)
TABLE 391 INDIA DATE DERIVATIVES IN FOOD FLAVORS MARKET, BY PRODUCT TYPE, 2021-2030 (USD MILLION)
TABLE 392 INDIA VEGETABLE OILS IN FOOD FLAVORS MARKET, BY TYPE, 2021-2030 (USD MILLION)
TABLE 393 INDIA VEGETABLE OILS IN FOOD FLAVORS MARKET, BY PRODUCT TYPE, 2021-2030, VOLUME (KILO LITERS)
TABLE 394 INDIA VEGETABLE OILS IN FOOD FLAVORS MARKET, BY PRODUCT TYPE, 2021-2030 (ASP)
TABLE 395 INDIA VEGETABLE OILS IN FOOD FLAVORS MARKET, BY PRODUCT TYPE, 2021-2030 (USD MILLION)
TABLE 396 INDIA OTHERS IN FOOD FLAVORS MARKET, BY TYPE, 2021-2030 (USD MILLION)
TABLE 397 INDIA FOOD FLAVORS MARKET, BY ORIGIN, 2021-2030 (USD MILLION)
TABLE 398 INDIA FOOD FLAVORS MARKET, BY CATEGORY, 2021-2030 (USD MILLION)
TABLE 399 INDIA FOOD FLAVORS MARKET, BY SOLUBILITY, 2021-2030 (USD MILLION)
TABLE 400 INDIA FOOD FLAVORS MARKET, BY FORM, 2021-2030 (USD MILLION)
TABLE 401 INDIA FOOD FLAVORS MARKET, BY APPLICATION, 2021-2030 (USD MILLION)
TABLE 402 INDIA CONFECTIONERY IN FOOD FLAVORS MARKET, BY TYPE, 2021-2030 (USD MILLION)
TABLE 403 INDIA CONFECTIONERY IN FOOD FLAVORS MARKET, BY FLAVOR TYPE, 2021-2030 (USD MILLION)
TABLE 404 INDIA CONFECTIONERY IN FOOD FLAVORS MARKET, BY PRODUCT TYPE, 2021-2030 (USD MILLION)
TABLE 405 INDIA BAKERY IN FOOD FLAVORS MARKET, BY TYPE, 2021-2030 (USD MILLION)
TABLE 406 INDIA BAKERY IN FOOD FLAVORS MARKET, BY FLAVOR TYPE, 2021-2030 (USD MILLION)
TABLE 407 INDIA BAKERY IN FOOD FLAVORS MARKET, BY PRODUCT TYPE, 2021-2030 (USD MILLION)
TABLE 408 INDIA CONVENIENCE FOOD IN FOOD FLAVORS MARKET, BY TYPE, 2021-2030 (USD MILLION)
TABLE 409 INDIA CONVENIENCE FOOD IN FOOD FLAVORS MARKET, BY FLAVOR TYPE, 2021-2030 (USD MILLION)
TABLE 410 INDIA CONVENIENCE FOOD IN FOOD FLAVORS MARKET, BY PRODUCT TYPE, 2021-2030 (USD MILLION)
TABLE 411 INDIA SNACKS & EXTRUDED SNACKS IN FOOD FLAVORS MARKET, BY FLAVOR TYPE, 2021-2030 (USD MILLION)
TABLE 412 INDIA SNACKS & EXTRUDED SNACKS IN FOOD FLAVORS MARKET, BY PRODUCT TYPE, 2021-2030 (USD MILLION)
TABLE 413 INDIA FROZEN DESSERTS IN FOOD FLAVORS MARKET, BY TYPE, 2021-2030 (USD MILLION)
TABLE 414 INDIA FROZEN DESSERTS IN FOOD FLAVORS MARKET, BY FLAVOR TYPE, 2021-2030 (USD MILLION)
TABLE 415 SOUTH KOREA FOOD FLAVORS MARKET, BY PRODUCT TYPE, 2021-2030 (USD MILLION)
TABLE 416 SOUTH KOREA FOOD FLAVORS MARKET, BY TYPE, 2021-2030 (USD MILLION)
TABLE 417 SOUTH KOREA FRUIT FLAVORS IN FOOD FLAVORS MARKET, BY TYPE, 2021-2030 (USD MILLION)
TABLE 418 SOUTH KOREA FRUIT FLAVORS IN FOOD FLAVORS MARKET, BY PRODUCT TYPE, 2021-2030, VOLUME (KILO LITERS)
TABLE 419 SOUTH KOREA FRUIT FLAVORS IN FOOD FLAVORS MARKET, BY PRODUCT TYPE, 2021-2030 (ASP)
TABLE 420 SOUTH KOREA BERRIES IN FOOD FLAVORS MARKET, BY TYPE, 2021-2030 (USD MILLION)
TABLE 421 SOUTH KOREA BERRIES IN FOOD FLAVORS MARKET, BY PRODUCT TYPE, 2021-2030, VOLUME (KILO LITERS)
TABLE 422 SOUTH KOREA BERRIES IN FOOD FLAVORS MARKET, BY PRODUCT TYPE, 2021-2030 (ASP)
TABLE 423 SOUTH KOREA FRUIT FLAVORS IN FOOD FLAVORS MARKET, BY PRODUCT TYPE, 2021-2030 (USD MILLION)
TABLE 424 SOUTH KOREA SPICE FLAVORS IN FOOD FLAVORS MARKET, BY TYPE, 2021-2030 (USD MILLION)
TABLE 425 SOUTH KOREA SPICE FLAVORS IN FOOD FLAVORS MARKET, BY PRODUCT TYPE, 2021-2030, VOLUME (KILO LITERS)
TABLE 426 SOUTH KOREA SPICE FLAVORS IN FOOD FLAVORS MARKET, BY PRODUCT TYPE, 2021-2030 (ASP)
TABLE 427 SOUTH KOREA SPICE FLAVORS IN FOOD FLAVORS MARKET, BY PRODUCT TYPE, 2021-2030 (USD MILLION)
TABLE 428 SOUTH KOREA HERBAL FLAVORS IN FOOD FLAVORS MARKET, BY TYPE, 2021-2030 (USD MILLION)
TABLE 429 SOUTH KOREA HERBAL FLAVORS IN FOOD FLAVORS MARKET, BY PRODUCT TYPE, 2021-2030, VOLUME (KILO LITERS)
TABLE 430 SOUTH KOREA HERBAL FLAVORS IN FOOD FLAVORS MARKET, BY PRODUCT TYPE, 2021-2030 (ASP)
TABLE 431 SOUTH KOREA HERBAL FLAVORS IN FOOD FLAVORS MARKET, BY PRODUCT TYPE, 2021-2030 (USD MILLION)
TABLE 432 SOUTH KOREA CITRUS FLAVORS IN FOOD FLAVORS MARKET, BY TYPE, 2021-2030 (USD MILLION)
TABLE 433 SOUTH KOREA CITRUS FLAVORS IN FOOD FLAVORS MARKET, BY PRODUCT TYPE, 2021-2030, VOLUME (KILO LITERS)
TABLE 434 SOUTH KOREA CITRUS FLAVORS IN FOOD FLAVORS MARKET, BY PRODUCT TYPE, 2021-2030 (ASP)
TABLE 435 SOUTH KOREA CITRUS FLAVORS IN FOOD FLAVORS MARKET, BY PRODUCT TYPE, 2021-2030 (USD MILLION)
TABLE 436 SOUTH KOREA DAIRY FLAVORS IN FOOD FLAVORS MARKET, BY TYPE, 2021-2030 (USD MILLION)
TABLE 437 SOUTH KOREA DAIRY FLAVORS IN FOOD FLAVORS MARKET, BY PRODUCT TYPE, 2021-2030, VOLUME (KILO LITERS)
TABLE 438 SOUTH KOREA DAIRY FLAVORS IN FOOD FLAVORS MARKET, BY PRODUCT TYPE, 2021-2030 (ASP)
TABLE 439 SOUTH KOREA BUTTER FLAVOR IN FOOD FLAVORS MARKET, BY TYPE, 2021-2030 (USD MILLION)
TABLE 440 SOUTH KOREA DAIRY FLAVORS IN FOOD FLAVORS MARKET, BY PRODUCT TYPE, 2021-2030 (USD MILLION)
TABLE 441 SOUTH KOREA NUTTY FLAVORS IN FOOD FLAVORS MARKET, BY TYPE, 2021-2030 (USD MILLION)
TABLE 442 SOUTH KOREA NUTTY FLAVORS IN FOOD FLAVORS MARKET, BY PRODUCT TYPE, 2021-2030, VOLUME (KILO LITERS)
TABLE 443 SOUTH KOREA NUTTY FLAVORS IN FOOD FLAVORS MARKET, BY PRODUCT TYPE, 2021-2030 (ASP)
TABLE 444 SOUTH KOREA NUTTY FLAVORS IN FOOD FLAVORS MARKET, BY PRODUCT TYPE, 2021-2030 (USD MILLION)
TABLE 445 SOUTH KOREA VEGETABLE EXTRACTS IN FOOD FLAVORS MARKET, BY TYPE, 2021-2030 (USD MILLION)
TABLE 446 SOUTH KOREA VEGETABLE EXTRACT IN FOOD FLAVORS MARKET, BY PRODUCT TYPE, 2021-2030, VOLUME (KILO LITERS)
TABLE 447 SOUTH KOREA VEGETABLE EXTRACT IN FOOD FLAVORS MARKET, BY PRODUCT TYPE, 2021-2030 (ASP)
TABLE 448 SOUTH KOREA VEGETABLE EXTRACTS IN FOOD FLAVORS MARKET, BY PRODUCT TYPE, 2021-2030 (USD MILLION)
TABLE 449 SOUTH KOREA COFFEE FLAVORS IN FOOD FLAVORS MARKET, BY PRODUCT TYPE, 2021-2030 (USD MILLION)
TABLE 450 SOUTH KOREA COFFEE FLAVORS IN FOOD FLAVORS MARKET, BY PRODUCT TYPE, 2021-2030, VOLUME (KILO LITERS)
TABLE 451 SOUTH KOREA COFFEE FLAVORS IN FOOD FLAVORS MARKET, BY PRODUCT TYPE, 2021-2030 (ASP)
TABLE 452 SOUTH KOREA CHOCOLATE FLAVORS IN FOOD FLAVORS MARKET, BY PRODUCT TYPE, 2021-2030 (USD MILLION)
TABLE 453 SOUTH KOREA CHOCOLATE FLAVORS IN FOOD FLAVORS MARKET, BY PRODUCT TYPE, 2021-2030, VOLUME (KILO LITERS)
TABLE 454 SOUTH KOREA CHOCOLATE FLAVORS IN FOOD FLAVORS MARKET, BY PRODUCT TYPE, 2021-2030 (ASP)
TABLE 455 SOUTH KOREA DATE DERIVATIVES IN FOOD FLAVORS MARKET, BY PRODUCT TYPE, 2021-2030 (USD MILLION)
TABLE 456 SOUTH KOREA VEGETABLE OILS IN FOOD FLAVORS MARKET, BY TYPE, 2021-2030 (USD MILLION)
TABLE 457 SOUTH KOREA VEGETABLE OILS IN FOOD FLAVORS MARKET, BY PRODUCT TYPE, 2021-2030, VOLUME (KILO LITERS)
TABLE 458 SOUTH KOREA VEGETABLE OILS IN FOOD FLAVORS MARKET, BY PRODUCT TYPE, 2021-2030 (ASP)
TABLE 459 SOUTH KOREA VEGETABLE OILS IN FOOD FLAVORS MARKET, BY PRODUCT TYPE, 2021-2030 (USD MILLION)
TABLE 460 SOUTH KOREA OTHERS IN FOOD FLAVORS MARKET, BY TYPE, 2021-2030 (USD MILLION)
TABLE 461 SOUTH KOREA FOOD FLAVORS MARKET, BY ORIGIN, 2021-2030 (USD MILLION)
TABLE 462 SOUTH KOREA FOOD FLAVORS MARKET, BY CATEGORY, 2021-2030 (USD MILLION)
TABLE 463 SOUTH KOREA FOOD FLAVORS MARKET, BY SOLUBILITY, 2021-2030 (USD MILLION)
TABLE 464 SOUTH KOREA FOOD FLAVORS MARKET, BY FORM, 2021-2030 (USD MILLION)
TABLE 465 SOUTH KOREA FOOD FLAVORS MARKET, BY APPLICATION, 2021-2030 (USD MILLION)
TABLE 466 SOUTH KOREA CONFECTIONERY IN FOOD FLAVORS MARKET, BY TYPE, 2021-2030 (USD MILLION)
TABLE 467 SOUTH KOREA CONFECTIONERY IN FOOD FLAVORS MARKET, BY FLAVOR TYPE, 2021-2030 (USD MILLION)
TABLE 468 SOUTH KOREA CONFECTIONERY IN FOOD FLAVORS MARKET, BY PRODUCT TYPE, 2021-2030 (USD MILLION)
TABLE 469 SOUTH KOREA BAKERY IN FOOD FLAVORS MARKET, BY TYPE, 2021-2030 (USD MILLION)
TABLE 470 SOUTH KOREA BAKERY IN FOOD FLAVORS MARKET, BY FLAVOR TYPE, 2021-2030 (USD MILLION)
TABLE 471 SOUTH KOREA BAKERY IN FOOD FLAVORS MARKET, BY PRODUCT TYPE, 2021-2030 (USD MILLION)
TABLE 472 SOUTH KOREA CONVENIENCE FOOD IN FOOD FLAVORS MARKET, BY TYPE, 2021-2030 (USD MILLION)
TABLE 473 SOUTH KOREA CONVENIENCE FOOD IN FOOD FLAVORS MARKET, BY FLAVOR TYPE, 2021-2030 (USD MILLION)
TABLE 474 SOUTH KOREA CONVENIENCE FOOD IN FOOD FLAVORS MARKET, BY PRODUCT TYPE, 2021-2030 (USD MILLION)
TABLE 475 SOUTH KOREA SNACKS & EXTRUDED SNACKS IN FOOD FLAVORS MARKET, BY FLAVOR TYPE, 2021-2030 (USD MILLION)
TABLE 476 SOUTH KOREA SNACKS & EXTRUDED SNACKS IN FOOD FLAVORS MARKET, BY PRODUCT TYPE, 2021-2030 (USD MILLION)
TABLE 477 SOUTH KOREA FROZEN DESSERTS IN FOOD FLAVORS MARKET, BY TYPE, 2021-2030 (USD MILLION)
TABLE 478 SOUTH KOREA FROZEN DESSERTS IN FOOD FLAVORS MARKET, BY FLAVOR TYPE, 2021-2030 (USD MILLION)
TABLE 479 SOUTH KOREA FROZEN DESSERTS IN FOOD FLAVORS MARKET, BY PRODUCT TYPE, 2021-2030 (USD MILLION)
TABLE 480 SOUTH KOREA MEAT AND POULTRY PRODUCTS IN FOOD FLAVORS MARKET, BY TYPE, 2021-2030 (USD MILLION)
TABLE 481 SOUTH KOREA MEAT AND POULTRY PRODUCTS IN FOOD FLAVORS MARKET, BY FLAVOR TYPE, 2021-2030 (USD MILLION)
TABLE 482 SOUTH KOREA MEAT AND POULTRY PRODUCTS IN FOOD FLAVORS MARKET, BY PRODUCT TYPE, 2021-2030 (USD MILLION)
TABLE 483 SOUTH KOREA BREAKFAST CEREALS IN FOOD FLAVORS MARKET, BY FLAVOR TYPE, 2021-2030 (USD MILLION)
TABLE 484 SOUTH KOREA BREAKFAST CEREALS IN FOOD FLAVORS MARKET, BY PRODUCT TYPE, 2021-2030 (USD MILLION)
TABLE 485 SOUTH KOREA PROCESSED FOOD IN FOOD FLAVORS MARKET, BY TYPE, 2021-2030 (USD MILLION)
TABLE 486 SOUTH KOREA PROCESSED FOOD IN FOOD FLAVORS MARKET, BY FLAVOR TYPE, 2021-2030 (USD MILLION)
TABLE 487 SOUTH KOREA PROCESSED FOOD IN FOOD FLAVORS MARKET, BY PRODUCT TYPE, 2021-2030 (USD MILLION)
TABLE 488 SOUTH KOREA BABY FOOD IN FOOD FLAVORS MARKET, BY FLAVOR TYPE, 2021-2030 (USD MILLION)
TABLE 489 SOUTH KOREA BABY FOOD IN FOOD FLAVORS MARKET, BY PRODUCT TYPE, 2021-2030 (USD MILLION)
TABLE 490 SOUTH KOREA SPORTS NUTRITION IN FOOD FLAVORS MARKET, BY TYPE, 2021-2030 (USD MILLION)
TABLE 491 SOUTH KOREA SPORTS NUTRITION IN FOOD FLAVORS MARKET, BY FLAVOR TYPE, 2021-2030 (USD MILLION)
TABLE 492 SOUTH KOREA SPORTS NUTRITION IN FOOD FLAVORS MARKET, BY PRODUCT TYPE, 2021-2030 (USD MILLION)
TABLE 493 SOUTH KOREA DIETARY SUPPLEMENTS IN FOOD FLAVORS MARKET, BY TYPE, 2021-2030 (USD MILLION)
TABLE 494 SOUTH KOREA DIETARY SUPPLEMENTS IN FOOD FLAVORS MARKET, BY FLAVOR TYPE, 2021-2030 (USD MILLION)
TABLE 495 SOUTH KOREA DIETARY SUPPLEMENTS IN FOOD FLAVORS MARKET, BY PRODUCT TYPE, 2021-2030 (USD MILLION)
TABLE 496 SOUTH KOREA BEVERAGES IN FOOD FLAVORS MARKET, BY TYPE, 2021-2030 (USD MILLION)
TABLE 497 SOUTH KOREA BEVERAGES IN FOOD FLAVORS MARKET, BY FLAVOR TYPE, 2021-2030 (USD MILLION)
TABLE 498 SOUTH KOREA BEVERAGES IN FOOD FLAVORS MARKET, BY PRODUCT TYPE, 2021-2030 (USD MILLION)
TABLE 499 AUSTRALIA FOOD FLAVORS MARKET, BY PRODUCT TYPE, 2021-2030 (USD MILLION)
TABLE 500 AUSTRALIA FOOD FLAVORS MARKET, BY TYPE, 2021-2030 (USD MILLION)
TABLE 501 AUSTRALIA FRUIT FLAVORS IN FOOD FLAVORS MARKET, BY TYPE, 2021-2030 (USD MILLION)
TABLE 502 AUSTRALIA FRUIT FLAVORS IN FOOD FLAVORS MARKET, BY PRODUCT TYPE, 2021-2030, VOLUME (KILO LITERS)
TABLE 503 AUSTRALIA FRUIT FLAVORS IN FOOD FLAVORS MARKET, BY PRODUCT TYPE, 2021-2030 (ASP)
TABLE 504 AUSTRALIA BERRIES IN FOOD FLAVORS MARKET, BY TYPE, 2021-2030 (USD MILLION)
TABLE 505 AUSTRALIA BERRIES IN FOOD FLAVORS MARKET, BY PRODUCT TYPE, 2021-2030, VOLUME (KILO LITERS)
TABLE 506 AUSTRALIA BERRIES IN FOOD FLAVORS MARKET, BY PRODUCT TYPE, 2021-2030 (ASP)
TABLE 507 AUSTRALIA FRUIT FLAVORS IN FOOD FLAVORS MARKET, BY PRODUCT TYPE, 2021-2030 (USD MILLION)
TABLE 508 AUSTRALIA SPICE FLAVORS IN FOOD FLAVORS MARKET, BY TYPE, 2021-2030 (USD MILLION)
TABLE 509 AUSTRALIA SPICE FLAVORS IN FOOD FLAVORS MARKET, BY PRODUCT TYPE, 2021-2030, VOLUME (KILO LITERS)
TABLE 510 AUSTRALIA SPICE FLAVORS IN FOOD FLAVORS MARKET, BY PRODUCT TYPE, 2021-2030 (ASP)
TABLE 511 AUSTRALIA SPICE FLAVORS IN FOOD FLAVORS MARKET, BY PRODUCT TYPE, 2021-2030 (USD MILLION)
TABLE 512 AUSTRALIA HERBAL FLAVORS IN FOOD FLAVORS MARKET, BY TYPE, 2021-2030 (USD MILLION)
TABLE 513 AUSTRALIA HERBAL FLAVORS IN FOOD FLAVORS MARKET, BY PRODUCT TYPE, 2021-2030, VOLUME (KILO LITERS)
TABLE 514 AUSTRALIA HERBAL FLAVORS IN FOOD FLAVORS MARKET, BY PRODUCT TYPE, 2021-2030 (ASP)
TABLE 515 AUSTRALIA HERBAL FLAVORS IN FOOD FLAVORS MARKET, BY PRODUCT TYPE, 2021-2030 (USD MILLION)
TABLE 516 AUSTRALIA CITRUS FLAVORS IN FOOD FLAVORS MARKET, BY TYPE, 2021-2030 (USD MILLION)
TABLE 517 AUSTRALIA CITRUS FLAVORS IN FOOD FLAVORS MARKET, BY PRODUCT TYPE, 2021-2030, VOLUME (KILO LITERS)
TABLE 518 AUSTRALIA CITRUS FLAVORS IN FOOD FLAVORS MARKET, BY PRODUCT TYPE, 2021-2030 (ASP)
TABLE 519 AUSTRALIA CITRUS FLAVORS IN FOOD FLAVORS MARKET, BY PRODUCT TYPE, 2021-2030 (USD MILLION)
TABLE 520 AUSTRALIA DAIRY FLAVORS IN FOOD FLAVORS MARKET, BY TYPE, 2021-2030 (USD MILLION)
TABLE 521 AUSTRALIA DAIRY FLAVORS IN FOOD FLAVORS MARKET, BY PRODUCT TYPE, 2021-2030, VOLUME (KILO LITERS)
TABLE 522 AUSTRALIA DAIRY FLAVORS IN FOOD FLAVORS MARKET, BY PRODUCT TYPE, 2021-2030 (ASP)
TABLE 523 AUSTRALIA BUTTER FLAVOR IN FOOD FLAVORS MARKET, BY TYPE, 2021-2030 (USD MILLION)
TABLE 524 AUSTRALIA DAIRY FLAVORS IN FOOD FLAVORS MARKET, BY PRODUCT TYPE, 2021-2030 (USD MILLION)
TABLE 525 AUSTRALIA NUTTY FLAVORS IN FOOD FLAVORS MARKET, BY TYPE, 2021-2030 (USD MILLION)
TABLE 526 AUSTRALIA NUTTY FLAVORS IN FOOD FLAVORS MARKET, BY PRODUCT TYPE, 2021-2030, VOLUME (KILO LITERS)
TABLE 527 AUSTRALIA NUTTY FLAVORS IN FOOD FLAVORS MARKET, BY PRODUCT TYPE, 2021-2030 (ASP)
TABLE 528 AUSTRALIA NUTTY FLAVORS IN FOOD FLAVORS MARKET, BY PRODUCT TYPE, 2021-2030 (USD MILLION)
TABLE 529 AUSTRALIA VEGETABLE EXTRACTS IN FOOD FLAVORS MARKET, BY TYPE, 2021-2030 (USD MILLION)
TABLE 530 AUSTRALIA VEGETABLE EXTRACT IN FOOD FLAVORS MARKET, BY PRODUCT TYPE, 2021-2030, VOLUME (KILO LITERS)
TABLE 531 AUSTRALIA VEGETABLE EXTRACT IN FOOD FLAVORS MARKET, BY PRODUCT TYPE, 2021-2030 (ASP)
TABLE 532 AUSTRALIA VEGETABLE EXTRACTS IN FOOD FLAVORS MARKET, BY PRODUCT TYPE, 2021-2030 (USD MILLION)
TABLE 533 AUSTRALIA COFFEE FLAVORS IN FOOD FLAVORS MARKET, BY PRODUCT TYPE, 2021-2030 (USD MILLION)
TABLE 534 AUSTRALIA COFFEE FLAVORS IN FOOD FLAVORS MARKET, BY PRODUCT TYPE, 2021-2030, VOLUME (KILO LITERS)
TABLE 535 AUSTRALIA COFFEE FLAVORS IN FOOD FLAVORS MARKET, BY PRODUCT TYPE, 2021-2030 (ASP)
TABLE 536 AUSTRALIA CHOCOLATE FLAVORS IN FOOD FLAVORS MARKET, BY PRODUCT TYPE, 2021-2030 (USD MILLION)
TABLE 537 AUSTRALIA CHOCOLATE FLAVORS IN FOOD FLAVORS MARKET, BY PRODUCT TYPE, 2021-2030, VOLUME (KILO LITERS)
TABLE 538 AUSTRALIA CHOCOLATE FLAVORS IN FOOD FLAVORS MARKET, BY PRODUCT TYPE, 2021-2030 (ASP)
TABLE 539 AUSTRALIA DATE DERIVATIVES IN FOOD FLAVORS MARKET, BY PRODUCT TYPE, 2021-2030 (USD MILLION)
TABLE 540 AUSTRALIA VEGETABLE OILS IN FOOD FLAVORS MARKET, BY TYPE, 2021-2030 (USD MILLION)
TABLE 541 AUSTRALIA VEGETABLE OILS IN FOOD FLAVORS MARKET, BY PRODUCT TYPE, 2021-2030, VOLUME (KILO LITERS)
TABLE 542 AUSTRALIA VEGETABLE OILS IN FOOD FLAVORS MARKET, BY PRODUCT TYPE, 2021-2030 (ASP)
TABLE 543 AUSTRALIA VEGETABLE OILS IN FOOD FLAVORS MARKET, BY PRODUCT TYPE, 2021-2030 (USD MILLION)
TABLE 544 AUSTRALIA OTHERS IN FOOD FLAVORS MARKET, BY TYPE, 2021-2030 (USD MILLION)
TABLE 545 AUSTRALIA FOOD FLAVORS MARKET, BY ORIGIN, 2021-2030 (USD MILLION)
TABLE 546 AUSTRALIA FOOD FLAVORS MARKET, BY CATEGORY, 2021-2030 (USD MILLION)
TABLE 547 AUSTRALIA FOOD FLAVORS MARKET, BY SOLUBILITY, 2021-2030 (USD MILLION)
TABLE 548 AUSTRALIA FOOD FLAVORS MARKET, BY FORM, 2021-2030 (USD MILLION)
TABLE 549 AUSTRALIA FOOD FLAVORS MARKET, BY APPLICATION, 2021-2030 (USD MILLION)
TABLE 550 AUSTRALIA CONFECTIONERY IN FOOD FLAVORS MARKET, BY TYPE, 2021-2030 (USD MILLION)
TABLE 551 AUSTRALIA CONFECTIONERY IN FOOD FLAVORS MARKET, BY FLAVOR TYPE, 2021-2030 (USD MILLION)
TABLE 552 AUSTRALIA CONFECTIONERY IN FOOD FLAVORS MARKET, BY PRODUCT TYPE, 2021-2030 (USD MILLION)
TABLE 553 AUSTRALIA BAKERY IN FOOD FLAVORS MARKET, BY TYPE, 2021-2030 (USD MILLION)
TABLE 554 AUSTRALIA BAKERY IN FOOD FLAVORS MARKET, BY FLAVOR TYPE, 2021-2030 (USD MILLION)
TABLE 555 AUSTRALIA BAKERY IN FOOD FLAVORS MARKET, BY PRODUCT TYPE, 2021-2030 (USD MILLION)
TABLE 556 AUSTRALIA CONVENIENCE FOOD IN FOOD FLAVORS MARKET, BY TYPE, 2021-2030 (USD MILLION)
TABLE 557 AUSTRALIA CONVENIENCE FOOD IN FOOD FLAVORS MARKET, BY FLAVOR TYPE, 2021-2030 (USD MILLION)
TABLE 558 AUSTRALIA CONVENIENCE FOOD IN FOOD FLAVORS MARKET, BY PRODUCT TYPE, 2021-2030 (USD MILLION)
TABLE 559 AUSTRALIA SNACKS & EXTRUDED SNACKS IN FOOD FLAVORS MARKET, BY FLAVOR TYPE, 2021-2030 (USD MILLION)
TABLE 560 AUSTRALIA SNACKS & EXTRUDED SNACKS IN FOOD FLAVORS MARKET, BY PRODUCT TYPE, 2021-2030 (USD MILLION)
TABLE 561 AUSTRALIA FROZEN DESSERTS IN FOOD FLAVORS MARKET, BY TYPE, 2021-2030 (USD MILLION)
TABLE 562 AUSTRALIA FROZEN DESSERTS IN FOOD FLAVORS MARKET, BY FLAVOR TYPE, 2021-2030 (USD MILLION)
TABLE 563 AUSTRALIA FROZEN DESSERTS IN FOOD FLAVORS MARKET, BY PRODUCT TYPE, 2021-2030 (USD MILLION)
TABLE 564 AUSTRALIA MEAT AND POULTRY PRODUCTS IN FOOD FLAVORS MARKET, BY TYPE, 2021-2030 (USD MILLION)
TABLE 565 AUSTRALIA MEAT AND POULTRY PRODUCTS IN FOOD FLAVORS MARKET, BY FLAVOR TYPE, 2021-2030 (USD MILLION)
TABLE 566 AUSTRALIA MEAT AND POULTRY PRODUCTS IN FOOD FLAVORS MARKET, BY PRODUCT TYPE, 2021-2030 (USD MILLION)
TABLE 567 AUSTRALIA BREAKFAST CEREALS IN FOOD FLAVORS MARKET, BY FLAVOR TYPE, 2021-2030 (USD MILLION)
TABLE 568 AUSTRALIA BREAKFAST CEREALS IN FOOD FLAVORS MARKET, BY PRODUCT TYPE, 2021-2030 (USD MILLION)
TABLE 569 AUSTRALIA PROCESSED FOOD IN FOOD FLAVORS MARKET, BY TYPE, 2021-2030 (USD MILLION)
TABLE 570 AUSTRALIA PROCESSED FOOD IN FOOD FLAVORS MARKET, BY FLAVOR TYPE, 2021-2030 (USD MILLION)
TABLE 571 AUSTRALIA PROCESSED FOOD IN FOOD FLAVORS MARKET, BY PRODUCT TYPE, 2021-2030 (USD MILLION)
TABLE 572 AUSTRALIA BABY FOOD IN FOOD FLAVORS MARKET, BY FLAVOR TYPE, 2021-2030 (USD MILLION)
TABLE 573 AUSTRALIA BABY FOOD IN FOOD FLAVORS MARKET, BY PRODUCT TYPE, 2021-2030 (USD MILLION)
TABLE 574 AUSTRALIA SPORTS NUTRITION IN FOOD FLAVORS MARKET, BY TYPE, 2021-2030 (USD MILLION)
TABLE 575 AUSTRALIA SPORTS NUTRITION IN FOOD FLAVORS MARKET, BY FLAVOR TYPE, 2021-2030 (USD MILLION)
TABLE 576 AUSTRALIA SPORTS NUTRITION IN FOOD FLAVORS MARKET, BY PRODUCT TYPE, 2021-2030 (USD MILLION)
TABLE 577 AUSTRALIA DIETARY SUPPLEMENTS IN FOOD FLAVORS MARKET, BY TYPE, 2021-2030 (USD MILLION)
TABLE 578 AUSTRALIA DIETARY SUPPLEMENTS IN FOOD FLAVORS MARKET, BY FLAVOR TYPE, 2021-2030 (USD MILLION)
TABLE 579 AUSTRALIA DIETARY SUPPLEMENTS IN FOOD FLAVORS MARKET, BY PRODUCT TYPE, 2021-2030 (USD MILLION)
TABLE 580 AUSTRALIA BEVERAGES IN FOOD FLAVORS MARKET, BY TYPE, 2021-2030 (USD MILLION)
TABLE 581 AUSTRALIA BEVERAGES IN FOOD FLAVORS MARKET, BY FLAVOR TYPE, 2021-2030 (USD MILLION)
TABLE 582 AUSTRALIA BEVERAGES IN FOOD FLAVORS MARKET, BY PRODUCT TYPE, 2021-2030 (USD MILLION)
TABLE 583 SINGAPORE FOOD FLAVORS MARKET, BY PRODUCT TYPE, 2021-2030 (USD MILLION)
TABLE 584 SINGAPORE FOOD FLAVORS MARKET, BY TYPE, 2021-2030 (USD MILLION)
TABLE 585 SINGAPORE FRUIT FLAVORS IN FOOD FLAVORS MARKET, BY TYPE, 2021-2030 (USD MILLION)
TABLE 586 SINGAPORE FRUIT FLAVORS IN FOOD FLAVORS MARKET, BY PRODUCT TYPE, 2021-2030, VOLUME (KILO LITERS)
TABLE 587 SINGAPORE FRUIT FLAVORS IN FOOD FLAVORS MARKET, BY PRODUCT TYPE, 2021-2030 (ASP)
TABLE 588 SINGAPORE BERRIES IN FOOD FLAVORS MARKET, BY TYPE, 2021-2030 (USD MILLION)
TABLE 589 SINGAPORE BERRIES IN FOOD FLAVORS MARKET, BY PRODUCT TYPE, 2021-2030, VOLUME (KILO LITERS)
TABLE 590 SINGAPORE BERRIES IN FOOD FLAVORS MARKET, BY PRODUCT TYPE, 2021-2030 (ASP)
TABLE 591 SINGAPORE FRUIT FLAVORS IN FOOD FLAVORS MARKET, BY PRODUCT TYPE, 2021-2030 (USD MILLION)
TABLE 592 SINGAPORE SPICE FLAVORS IN FOOD FLAVORS MARKET, BY TYPE, 2021-2030 (USD MILLION)
TABLE 593 SINGAPORE SPICE FLAVORS IN FOOD FLAVORS MARKET, BY PRODUCT TYPE, 2021-2030, VOLUME (KILO LITERS)
TABLE 594 SINGAPORE SPICE FLAVORS IN FOOD FLAVORS MARKET, BY PRODUCT TYPE, 2021-2030 (ASP)
TABLE 595 SINGAPORE SPICE FLAVORS IN FOOD FLAVORS MARKET, BY PRODUCT TYPE, 2021-2030 (USD MILLION)
TABLE 596 SINGAPORE HERBAL FLAVORS IN FOOD FLAVORS MARKET, BY TYPE, 2021-2030 (USD MILLION)
TABLE 597 SINGAPORE HERBAL FLAVORS IN FOOD FLAVORS MARKET, BY PRODUCT TYPE, 2021-2030, VOLUME (KILO LITERS)
TABLE 598 SINGAPORE HERBAL FLAVORS IN FOOD FLAVORS MARKET, BY PRODUCT TYPE, 2021-2030 (ASP)
TABLE 599 SINGAPORE HERBAL FLAVORS IN FOOD FLAVORS MARKET, BY PRODUCT TYPE, 2021-2030 (USD MILLION)
TABLE 600 SINGAPORE CITRUS FLAVORS IN FOOD FLAVORS MARKET, BY TYPE, 2021-2030 (USD MILLION)
TABLE 601 SINGAPORE CITRUS FLAVORS IN FOOD FLAVORS MARKET, BY PRODUCT TYPE, 2021-2030, VOLUME (KILO LITERS)
TABLE 602 SINGAPORE CITRUS FLAVORS IN FOOD FLAVORS MARKET, BY PRODUCT TYPE, 2021-2030 (ASP)
TABLE 603 SINGAPORE CITRUS FLAVORS IN FOOD FLAVORS MARKET, BY PRODUCT TYPE, 2021-2030 (USD MILLION)
TABLE 604 SINGAPORE DAIRY FLAVORS IN FOOD FLAVORS MARKET, BY TYPE, 2021-2030 (USD MILLION)
TABLE 605 SINGAPORE DAIRY FLAVORS IN FOOD FLAVORS MARKET, BY PRODUCT TYPE, 2021-2030, VOLUME (KILO LITERS)
TABLE 606 SINGAPORE DAIRY FLAVORS IN FOOD FLAVORS MARKET, BY PRODUCT TYPE, 2021-2030 (ASP)
TABLE 607 SINGAPORE BUTTER FLAVOR IN FOOD FLAVORS MARKET, BY TYPE, 2021-2030 (USD MILLION)
TABLE 608 SINGAPORE DAIRY FLAVORS IN FOOD FLAVORS MARKET, BY PRODUCT TYPE, 2021-2030 (USD MILLION)
TABLE 609 SINGAPORE NUTTY FLAVORS IN FOOD FLAVORS MARKET, BY TYPE, 2021-2030 (USD MILLION)
TABLE 610 SINGAPORE NUTTY FLAVORS IN FOOD FLAVORS MARKET, BY PRODUCT TYPE, 2021-2030, VOLUME (KILO LITERS)
TABLE 611 SINGAPORE NUTTY FLAVORS IN FOOD FLAVORS MARKET, BY PRODUCT TYPE, 2021-2030 (ASP)
TABLE 612 SINGAPORE NUTTY FLAVORS IN FOOD FLAVORS MARKET, BY PRODUCT TYPE, 2021-2030 (USD MILLION)
TABLE 613 SINGAPORE VEGETABLE EXTRACTS IN FOOD FLAVORS MARKET, BY TYPE, 2021-2030 (USD MILLION)
TABLE 614 SINGAPORE VEGETABLE EXTRACT IN FOOD FLAVORS MARKET, BY PRODUCT TYPE, 2021-2030, VOLUME (KILO LITERS)
TABLE 615 SINGAPORE VEGETABLE EXTRACT IN FOOD FLAVORS MARKET, BY PRODUCT TYPE, 2021-2030 (ASP)
TABLE 616 SINGAPORE VEGETABLE EXTRACTS IN FOOD FLAVORS MARKET, BY PRODUCT TYPE, 2021-2030 (USD MILLION)
TABLE 617 SINGAPORE COFFEE FLAVORS IN FOOD FLAVORS MARKET, BY PRODUCT TYPE, 2021-2030 (USD MILLION)
TABLE 618 SINGAPORE COFFEE FLAVORS IN FOOD FLAVORS MARKET, BY PRODUCT TYPE, 2021-2030, VOLUME (KILO LITERS)
TABLE 619 SINGAPORE COFFEE FLAVORS IN FOOD FLAVORS MARKET, BY PRODUCT TYPE, 2021-2030 (ASP)
TABLE 620 SINGAPORE CHOCOLATE FLAVORS IN FOOD FLAVORS MARKET, BY PRODUCT TYPE, 2021-2030 (USD MILLION)
TABLE 621 SINGAPORE CHOCOLATE FLAVORS IN FOOD FLAVORS MARKET, BY PRODUCT TYPE, 2021-2030, VOLUME (KILO LITERS)
TABLE 622 SINGAPORE CHOCOLATE FLAVORS IN FOOD FLAVORS MARKET, BY PRODUCT TYPE, 2021-2030 (ASP)
TABLE 623 SINGAPORE DATE DERIVATIVES IN FOOD FLAVORS MARKET, BY PRODUCT TYPE, 2021-2030 (USD MILLION)
TABLE 624 SINGAPORE VEGETABLE OILS IN FOOD FLAVORS MARKET, BY TYPE, 2021-2030 (USD MILLION)
TABLE 625 SINGAPORE VEGETABLE OILS IN FOOD FLAVORS MARKET, BY PRODUCT TYPE, 2021-2030, VOLUME (KILO LITERS)
TABLE 626 SINGAPORE VEGETABLE OILS IN FOOD FLAVORS MARKET, BY PRODUCT TYPE, 2021-2030 (ASP)
TABLE 627 SINGAPORE VEGETABLE OILS IN FOOD FLAVORS MARKET, BY PRODUCT TYPE, 2021-2030 (USD MILLION)
TABLE 628 SINGAPORE OTHERS IN FOOD FLAVORS MARKET, BY TYPE, 2021-2030 (USD MILLION)
TABLE 629 SINGAPORE FOOD FLAVORS MARKET, BY ORIGIN, 2021-2030 (USD MILLION)
TABLE 630 SINGAPORE FOOD FLAVORS MARKET, BY CATEGORY, 2021-2030 (USD MILLION)
TABLE 631 SINGAPORE FOOD FLAVORS MARKET, BY SOLUBILITY, 2021-2030 (USD MILLION)
TABLE 632 SINGAPORE FOOD FLAVORS MARKET, BY FORM, 2021-2030 (USD MILLION)
TABLE 633 SINGAPORE FOOD FLAVORS MARKET, BY APPLICATION, 2021-2030 (USD MILLION)
TABLE 634 SINGAPORE CONFECTIONERY IN FOOD FLAVORS MARKET, BY TYPE, 2021-2030 (USD MILLION)
TABLE 635 SINGAPORE CONFECTIONERY IN FOOD FLAVORS MARKET, BY FLAVOR TYPE, 2021-2030 (USD MILLION)
TABLE 636 SINGAPORE CONFECTIONERY IN FOOD FLAVORS MARKET, BY PRODUCT TYPE, 2021-2030 (USD MILLION)
TABLE 637 SINGAPORE BAKERY IN FOOD FLAVORS MARKET, BY TYPE, 2021-2030 (USD MILLION)
TABLE 638 SINGAPORE BAKERY IN FOOD FLAVORS MARKET, BY FLAVOR TYPE, 2021-2030 (USD MILLION)
TABLE 639 SINGAPORE BAKERY IN FOOD FLAVORS MARKET, BY PRODUCT TYPE, 2021-2030 (USD MILLION)
TABLE 640 SINGAPORE CONVENIENCE FOOD IN FOOD FLAVORS MARKET, BY TYPE, 2021-2030 (USD MILLION)
TABLE 641 SINGAPORE CONVENIENCE FOOD IN FOOD FLAVORS MARKET, BY FLAVOR TYPE, 2021-2030 (USD MILLION)
TABLE 642 SINGAPORE CONVENIENCE FOOD IN FOOD FLAVORS MARKET, BY PRODUCT TYPE, 2021-2030 (USD MILLION)
TABLE 643 SINGAPORE SNACKS & EXTRUDED SNACKS IN FOOD FLAVORS MARKET, BY FLAVOR TYPE, 2021-2030 (USD MILLION)
TABLE 644 SINGAPORE SNACKS & EXTRUDED SNACKS IN FOOD FLAVORS MARKET, BY PRODUCT TYPE, 2021-2030 (USD MILLION)
TABLE 645 SINGAPORE FROZEN DESSERTS IN FOOD FLAVORS MARKET, BY TYPE, 2021-2030 (USD MILLION)
TABLE 646 SINGAPORE FROZEN DESSERTS IN FOOD FLAVORS MARKET, BY FLAVOR TYPE, 2021-2030 (USD MILLION)
TABLE 647 SINGAPORE FROZEN DESSERTS IN FOOD FLAVORS MARKET, BY PRODUCT TYPE, 2021-2030 (USD MILLION)
TABLE 648 SINGAPORE MEAT AND POULTRY PRODUCTS IN FOOD FLAVORS MARKET, BY TYPE, 2021-2030 (USD MILLION)
TABLE 649 SINGAPORE MEAT AND POULTRY PRODUCTS IN FOOD FLAVORS MARKET, BY FLAVOR TYPE, 2021-2030 (USD MILLION)
TABLE 650 SINGAPORE MEAT AND POULTRY PRODUCTS IN FOOD FLAVORS MARKET, BY PRODUCT TYPE, 2021-2030 (USD MILLION)
TABLE 651 SINGAPORE BREAKFAST CEREALS IN FOOD FLAVORS MARKET, BY FLAVOR TYPE, 2021-2030 (USD MILLION)
TABLE 652 SINGAPORE BREAKFAST CEREALS IN FOOD FLAVORS MARKET, BY PRODUCT TYPE, 2021-2030 (USD MILLION)
TABLE 653 SINGAPORE PROCESSED FOOD IN FOOD FLAVORS MARKET, BY TYPE, 2021-2030 (USD MILLION)
TABLE 654 SINGAPORE PROCESSED FOOD IN FOOD FLAVORS MARKET, BY FLAVOR TYPE, 2021-2030 (USD MILLION)
TABLE 655 SINGAPORE PROCESSED FOOD IN FOOD FLAVORS MARKET, BY PRODUCT TYPE, 2021-2030 (USD MILLION)
TABLE 656 SINGAPORE BABY FOOD IN FOOD FLAVORS MARKET, BY FLAVOR TYPE, 2021-2030 (USD MILLION)
TABLE 657 SINGAPORE BABY FOOD IN FOOD FLAVORS MARKET, BY PRODUCT TYPE, 2021-2030 (USD MILLION)
TABLE 658 SINGAPORE SPORTS NUTRITION IN FOOD FLAVORS MARKET, BY TYPE, 2021-2030 (USD MILLION)
TABLE 659 SINGAPORE SPORTS NUTRITION IN FOOD FLAVORS MARKET, BY FLAVOR TYPE, 2021-2030 (USD MILLION)
TABLE 660 SINGAPORE SPORTS NUTRITION IN FOOD FLAVORS MARKET, BY PRODUCT TYPE, 2021-2030 (USD MILLION)
TABLE 661 SINGAPORE DIETARY SUPPLEMENTS IN FOOD FLAVORS MARKET, BY TYPE, 2021-2030 (USD MILLION)
TABLE 662 SINGAPORE DIETARY SUPPLEMENTS IN FOOD FLAVORS MARKET, BY FLAVOR TYPE, 2021-2030 (USD MILLION)
TABLE 663 SINGAPORE DIETARY SUPPLEMENTS IN FOOD FLAVORS MARKET, BY PRODUCT TYPE, 2021-2030 (USD MILLION)
TABLE 664 SINGAPORE BEVERAGES IN FOOD FLAVORS MARKET, BY TYPE, 2021-2030 (USD MILLION)
TABLE 665 SINGAPORE BEVERAGES IN FOOD FLAVORS MARKET, BY FLAVOR TYPE, 2021-2030 (USD MILLION)
TABLE 666 SINGAPORE BEVERAGES IN FOOD FLAVORS MARKET, BY PRODUCT TYPE, 2021-2030 (USD MILLION)
TABLE 667 THAILAND FOOD FLAVORS MARKET, BY PRODUCT TYPE, 2021-2030 (USD MILLION)
TABLE 668 THAILAND FOOD FLAVORS MARKET, BY TYPE, 2021-2030 (USD MILLION)
TABLE 669 THAILAND FRUIT FLAVORS IN FOOD FLAVORS MARKET, BY TYPE, 2021-2030 (USD MILLION)
TABLE 670 THAILAND FRUIT FLAVORS IN FOOD FLAVORS MARKET, BY PRODUCT TYPE, 2021-2030, VOLUME (KILO LITERS)
TABLE 671 THAILAND FRUIT FLAVORS IN FOOD FLAVORS MARKET, BY PRODUCT TYPE, 2021-2030 (ASP)
TABLE 672 THAILAND BERRIES IN FOOD FLAVORS MARKET, BY TYPE, 2021-2030 (USD MILLION)
TABLE 673 THAILAND BERRIES IN FOOD FLAVORS MARKET, BY PRODUCT TYPE, 2021-2030, VOLUME (KILO LITERS)
TABLE 674 THAILAND BERRIES IN FOOD FLAVORS MARKET, BY PRODUCT TYPE, 2021-2030 (ASP)
TABLE 675 THAILAND FRUIT FLAVORS IN FOOD FLAVORS MARKET, BY PRODUCT TYPE, 2021-2030 (USD MILLION)
TABLE 676 THAILAND SPICE FLAVORS IN FOOD FLAVORS MARKET, BY TYPE, 2021-2030 (USD MILLION)
TABLE 677 THAILAND SPICE FLAVORS IN FOOD FLAVORS MARKET, BY PRODUCT TYPE, 2021-2030, VOLUME (KILO LITERS)
TABLE 678 THAILAND SPICE FLAVORS IN FOOD FLAVORS MARKET, BY PRODUCT TYPE, 2021-2030 (ASP)
TABLE 679 THAILAND SPICE FLAVORS IN FOOD FLAVORS MARKET, BY PRODUCT TYPE, 2021-2030 (USD MILLION)
TABLE 680 THAILAND HERBAL FLAVORS IN FOOD FLAVORS MARKET, BY TYPE, 2021-2030 (USD MILLION)
TABLE 681 THAILAND HERBAL FLAVORS IN FOOD FLAVORS MARKET, BY PRODUCT TYPE, 2021-2030, VOLUME (KILO LITERS)
TABLE 682 THAILAND HERBAL FLAVORS IN FOOD FLAVORS MARKET, BY PRODUCT TYPE, 2021-2030 (ASP)
TABLE 683 THAILAND HERBAL FLAVORS IN FOOD FLAVORS MARKET, BY PRODUCT TYPE, 2021-2030 (USD MILLION)
TABLE 684 THAILAND CITRUS FLAVORS IN FOOD FLAVORS MARKET, BY TYPE, 2021-2030 (USD MILLION)
TABLE 685 THAILAND CITRUS FLAVORS IN FOOD FLAVORS MARKET, BY PRODUCT TYPE, 2021-2030, VOLUME (KILO LITERS)
TABLE 686 THAILAND CITRUS FLAVORS IN FOOD FLAVORS MARKET, BY PRODUCT TYPE, 2021-2030 (ASP)
TABLE 687 THAILAND CITRUS FLAVORS IN FOOD FLAVORS MARKET, BY PRODUCT TYPE, 2021-2030 (USD MILLION)
TABLE 688 THAILAND DAIRY FLAVORS IN FOOD FLAVORS MARKET, BY TYPE, 2021-2030 (USD MILLION)
TABLE 689 THAILAND DAIRY FLAVORS IN FOOD FLAVORS MARKET, BY PRODUCT TYPE, 2021-2030, VOLUME (KILO LITERS)
TABLE 690 THAILAND DAIRY FLAVORS IN FOOD FLAVORS MARKET, BY PRODUCT TYPE, 2021-2030 (ASP)
TABLE 691 THAILAND BUTTER FLAVOR IN FOOD FLAVORS MARKET, BY TYPE, 2021-2030 (USD MILLION)
TABLE 692 THAILAND DAIRY FLAVORS IN FOOD FLAVORS MARKET, BY PRODUCT TYPE, 2021-2030 (USD MILLION)
TABLE 693 THAILAND NUTTY FLAVORS IN FOOD FLAVORS MARKET, BY TYPE, 2021-2030 (USD MILLION)
TABLE 694 THAILAND NUTTY FLAVORS IN FOOD FLAVORS MARKET, BY PRODUCT TYPE, 2021-2030, VOLUME (KILO LITERS)
TABLE 695 THAILAND NUTTY FLAVORS IN FOOD FLAVORS MARKET, BY PRODUCT TYPE, 2021-2030 (ASP)
TABLE 696 MALAYSIA FOOD FLAVORS MARKET, BY PRODUCT TYPE, 2021-2030 (USD MILLION)
TABLE 697 MALAYSIA FOOD FLAVORS MARKET, BY TYPE, 2021-2030 (USD MILLION)
TABLE 698 MALAYSIA FRUIT FLAVORS IN FOOD FLAVORS MARKET, BY TYPE, 2021-2030 (USD MILLION)
TABLE 699 MALAYSIA FRUIT FLAVORS IN FOOD FLAVORS MARKET, BY PRODUCT TYPE, 2021-2030, VOLUME (KILO LITERS)
TABLE 700 MALAYSIA FRUIT FLAVORS IN FOOD FLAVORS MARKET, BY PRODUCT TYPE, 2021-2030 (ASP)
TABLE 701 MALAYSIA BERRIES IN FOOD FLAVORS MARKET, BY TYPE, 2021-2030 (USD MILLION)
TABLE 702 MALAYSIA BERRIES IN FOOD FLAVORS MARKET, BY PRODUCT TYPE, 2021-2030, VOLUME (KILO LITERS)
TABLE 703 MALAYSIA BERRIES IN FOOD FLAVORS MARKET, BY PRODUCT TYPE, 2021-2030 (ASP)
TABLE 704 MALAYSIA FRUIT FLAVORS IN FOOD FLAVORS MARKET, BY PRODUCT TYPE, 2021-2030 (USD MILLION)
TABLE 705 MALAYSIA SPICE FLAVORS IN FOOD FLAVORS MARKET, BY TYPE, 2021-2030 (USD MILLION)
TABLE 706 MALAYSIA SPICE FLAVORS IN FOOD FLAVORS MARKET, BY PRODUCT TYPE, 2021-2030, VOLUME (KILO LITERS)
TABLE 707 MALAYSIA SPICE FLAVORS IN FOOD FLAVORS MARKET, BY PRODUCT TYPE, 2021-2030 (ASP)
TABLE 708 MALAYSIA SPICE FLAVORS IN FOOD FLAVORS MARKET, BY PRODUCT TYPE, 2021-2030 (USD MILLION)
TABLE 709 MALAYSIA HERBAL FLAVORS IN FOOD FLAVORS MARKET, BY TYPE, 2021-2030 (USD MILLION)
TABLE 710 MALAYSIA HERBAL FLAVORS IN FOOD FLAVORS MARKET, BY PRODUCT TYPE, 2021-2030, VOLUME (KILO LITERS)
TABLE 711 MALAYSIA HERBAL FLAVORS IN FOOD FLAVORS MARKET, BY PRODUCT TYPE, 2021-2030 (ASP)
TABLE 712 MALAYSIA HERBAL FLAVORS IN FOOD FLAVORS MARKET, BY PRODUCT TYPE, 2021-2030 (USD MILLION)
TABLE 713 MALAYSIA CITRUS FLAVORS IN FOOD FLAVORS MARKET, BY TYPE, 2021-2030 (USD MILLION)
TABLE 714 MALAYSIA CITRUS FLAVORS IN FOOD FLAVORS MARKET, BY PRODUCT TYPE, 2021-2030, VOLUME (KILO LITERS)
TABLE 715 MALAYSIA CITRUS FLAVORS IN FOOD FLAVORS MARKET, BY PRODUCT TYPE, 2021-2030 (ASP)
TABLE 716 MALAYSIA CITRUS FLAVORS IN FOOD FLAVORS MARKET, BY PRODUCT TYPE, 2021-2030 (USD MILLION)
TABLE 717 MALAYSIA DAIRY FLAVORS IN FOOD FLAVORS MARKET, BY TYPE, 2021-2030 (USD MILLION)
TABLE 718 MALAYSIA DAIRY FLAVORS IN FOOD FLAVORS MARKET, BY PRODUCT TYPE, 2021-2030, VOLUME (KILO LITERS)
TABLE 719 MALAYSIA DAIRY FLAVORS IN FOOD FLAVORS MARKET, BY PRODUCT TYPE, 2021-2030 (ASP)
TABLE 720 MALAYSIA BUTTER FLAVOR IN FOOD FLAVORS MARKET, BY TYPE, 2021-2030 (USD MILLION)
TABLE 721 MALAYSIA DAIRY FLAVORS IN FOOD FLAVORS MARKET, BY PRODUCT TYPE, 2021-2030 (USD MILLION)
TABLE 722 MALAYSIA NUTTY FLAVORS IN FOOD FLAVORS MARKET, BY TYPE, 2021-2030 (USD MILLION)
TABLE 723 MALAYSIA NUTTY FLAVORS IN FOOD FLAVORS MARKET, BY PRODUCT TYPE, 2021-2030, VOLUME (KILO LITERS)
TABLE 724 MALAYSIA NUTTY FLAVORS IN FOOD FLAVORS MARKET, BY PRODUCT TYPE, 2021-2030 (ASP)
TABLE 725 MALAYSIA NUTTY FLAVORS IN FOOD FLAVORS MARKET, BY PRODUCT TYPE, 2021-2030 (USD MILLION)
TABLE 726 MALAYSIA VEGETABLE EXTRACTS IN FOOD FLAVORS MARKET, BY TYPE, 2021-2030 (USD MILLION)
TABLE 727 MALAYSIA VEGETABLE EXTRACT IN FOOD FLAVORS MARKET, BY PRODUCT TYPE, 2021-2030, VOLUME (KILO LITERS)
TABLE 728 MALAYSIA VEGETABLE EXTRACT IN FOOD FLAVORS MARKET, BY PRODUCT TYPE, 2021-2030 (ASP)
TABLE 729 MALAYSIA VEGETABLE EXTRACTS IN FOOD FLAVORS MARKET, BY PRODUCT TYPE, 2021-2030 (USD MILLION)
TABLE 730 MALAYSIA COFFEE FLAVORS IN FOOD FLAVORS MARKET, BY PRODUCT TYPE, 2021-2030 (USD MILLION)
TABLE 731 MALAYSIA COFFEE FLAVORS IN FOOD FLAVORS MARKET, BY PRODUCT TYPE, 2021-2030, VOLUME (KILO LITERS)
TABLE 732 MALAYSIA COFFEE FLAVORS IN FOOD FLAVORS MARKET, BY PRODUCT TYPE, 2021-2030 (ASP)
TABLE 733 MALAYSIA CHOCOLATE FLAVORS IN FOOD FLAVORS MARKET, BY PRODUCT TYPE, 2021-2030 (USD MILLION)
TABLE 734 MALAYSIA CHOCOLATE FLAVORS IN FOOD FLAVORS MARKET, BY PRODUCT TYPE, 2021-2030, VOLUME (KILO LITERS)
TABLE 735 MALAYSIA CHOCOLATE FLAVORS IN FOOD FLAVORS MARKET, BY PRODUCT TYPE, 2021-2030 (ASP)
TABLE 736 MALAYSIA DATE DERIVATIVES IN FOOD FLAVORS MARKET, BY PRODUCT TYPE, 2021-2030 (USD MILLION)
TABLE 737 MALAYSIA VEGETABLE OILS IN FOOD FLAVORS MARKET, BY TYPE, 2021-2030 (USD MILLION)
TABLE 738 MALAYSIA VEGETABLE OILS IN FOOD FLAVORS MARKET, BY PRODUCT TYPE, 2021-2030, VOLUME (KILO LITERS)
TABLE 739 MALAYSIA VEGETABLE OILS IN FOOD FLAVORS MARKET, BY PRODUCT TYPE, 2021-2030 (ASP)
TABLE 740 MALAYSIA VEGETABLE OILS IN FOOD FLAVORS MARKET, BY PRODUCT TYPE, 2021-2030 (USD MILLION)
TABLE 741 MALAYSIA OTHERS IN FOOD FLAVORS MARKET, BY TYPE, 2021-2030 (USD MILLION)
TABLE 742 MALAYSIA FOOD FLAVORS MARKET, BY ORIGIN, 2021-2030 (USD MILLION)
TABLE 743 MALAYSIA FOOD FLAVORS MARKET, BY CATEGORY, 2021-2030 (USD MILLION)
TABLE 744 MALAYSIA FOOD FLAVORS MARKET, BY SOLUBILITY, 2021-2030 (USD MILLION)
TABLE 745 MALAYSIA FOOD FLAVORS MARKET, BY FORM, 2021-2030 (USD MILLION)
TABLE 746 MALAYSIA FOOD FLAVORS MARKET, BY APPLICATION, 2021-2030 (USD MILLION)
TABLE 747 MALAYSIA CONFECTIONERY IN FOOD FLAVORS MARKET, BY TYPE, 2021-2030 (USD MILLION)
TABLE 748 MALAYSIA CONFECTIONERY IN FOOD FLAVORS MARKET, BY FLAVOR TYPE, 2021-2030 (USD MILLION)
TABLE 749 MALAYSIA CONFECTIONERY IN FOOD FLAVORS MARKET, BY PRODUCT TYPE, 2021-2030 (USD MILLION)
TABLE 750 MALAYSIA BAKERY IN FOOD FLAVORS MARKET, BY TYPE, 2021-2030 (USD MILLION)
TABLE 751 MALAYSIA BAKERY IN FOOD FLAVORS MARKET, BY FLAVOR TYPE, 2021-2030 (USD MILLION)
TABLE 752 MALAYSIA BAKERY IN FOOD FLAVORS MARKET, BY PRODUCT TYPE, 2021-2030 (USD MILLION)
TABLE 753 MALAYSIA CONVENIENCE FOOD IN FOOD FLAVORS MARKET, BY TYPE, 2021-2030 (USD MILLION)
TABLE 754 MALAYSIA CONVENIENCE FOOD IN FOOD FLAVORS MARKET, BY FLAVOR TYPE, 2021-2030 (USD MILLION)
TABLE 755 MALAYSIA CONVENIENCE FOOD IN FOOD FLAVORS MARKET, BY PRODUCT TYPE, 2021-2030 (USD MILLION)
TABLE 756 MALAYSIA SNACKS & EXTRUDED SNACKS IN FOOD FLAVORS MARKET, BY FLAVOR TYPE, 2021-2030 (USD MILLION)
TABLE 757 MALAYSIA SNACKS & EXTRUDED SNACKS IN FOOD FLAVORS MARKET, BY PRODUCT TYPE, 2021-2030 (USD MILLION)
TABLE 758 MALAYSIA FROZEN DESSERTS IN FOOD FLAVORS MARKET, BY TYPE, 2021-2030 (USD MILLION)
TABLE 759 MALAYSIA FROZEN DESSERTS IN FOOD FLAVORS MARKET, BY FLAVOR TYPE, 2021-2030 (USD MILLION)
TABLE 760 MALAYSIA FROZEN DESSERTS IN FOOD FLAVORS MARKET, BY PRODUCT TYPE, 2021-2030 (USD MILLION)
TABLE 761 MALAYSIA MEAT AND POULTRY PRODUCTS IN FOOD FLAVORS MARKET, BY TYPE, 2021-2030 (USD MILLION)
TABLE 762 MALAYSIA MEAT AND POULTRY PRODUCTS IN FOOD FLAVORS MARKET, BY FLAVOR TYPE, 2021-2030 (USD MILLION)
TABLE 763 MALAYSIA MEAT AND POULTRY PRODUCTS IN FOOD FLAVORS MARKET, BY PRODUCT TYPE, 2021-2030 (USD MILLION)
TABLE 764 MALAYSIA BREAKFAST CEREALS IN FOOD FLAVORS MARKET, BY FLAVOR TYPE, 2021-2030 (USD MILLION)
TABLE 765 MALAYSIA BREAKFAST CEREALS IN FOOD FLAVORS MARKET, BY PRODUCT TYPE, 2021-2030 (USD MILLION)
TABLE 766 MALAYSIA PROCESSED FOOD IN FOOD FLAVORS MARKET, BY TYPE, 2021-2030 (USD MILLION)
TABLE 767 MALAYSIA PROCESSED FOOD IN FOOD FLAVORS MARKET, BY FLAVOR TYPE, 2021-2030 (USD MILLION)
TABLE 768 MALAYSIA PROCESSED FOOD IN FOOD FLAVORS MARKET, BY PRODUCT TYPE, 2021-2030 (USD MILLION)
TABLE 769 MALAYSIA BABY FOOD IN FOOD FLAVORS MARKET, BY FLAVOR TYPE, 2021-2030 (USD MILLION)
TABLE 770 MALAYSIA BABY FOOD IN FOOD FLAVORS MARKET, BY PRODUCT TYPE, 2021-2030 (USD MILLION)
TABLE 771 MALAYSIA SPORTS NUTRITION IN FOOD FLAVORS MARKET, BY TYPE, 2021-2030 (USD MILLION)
TABLE 772 MALAYSIA SPORTS NUTRITION IN FOOD FLAVORS MARKET, BY FLAVOR TYPE, 2021-2030 (USD MILLION)
TABLE 773 MALAYSIA SPORTS NUTRITION IN FOOD FLAVORS MARKET, BY PRODUCT TYPE, 2021-2030 (USD MILLION)
TABLE 774 MALAYSIA DIETARY SUPPLEMENTS IN FOOD FLAVORS MARKET, BY TYPE, 2021-2030 (USD MILLION)
TABLE 775 MALAYSIA DIETARY SUPPLEMENTS IN FOOD FLAVORS MARKET, BY FLAVOR TYPE, 2021-2030 (USD MILLION)
TABLE 776 MALAYSIA DIETARY SUPPLEMENTS IN FOOD FLAVORS MARKET, BY PRODUCT TYPE, 2021-2030 (USD MILLION)
TABLE 777 MALAYSIA BEVERAGES IN FOOD FLAVORS MARKET, BY TYPE, 2021-2030 (USD MILLION)
TABLE 778 MALAYSIA BEVERAGES IN FOOD FLAVORS MARKET, BY FLAVOR TYPE, 2021-2030 (USD MILLION)
TABLE 779 MALAYSIA BEVERAGES IN FOOD FLAVORS MARKET, BY PRODUCT TYPE, 2021-2030 (USD MILLION)
TABLE 780 INDONESIA FOOD FLAVORS MARKET, BY PRODUCT TYPE, 2021-2030 (USD MILLION)
TABLE 781 INDONESIA FOOD FLAVORS MARKET, BY TYPE, 2021-2030 (USD MILLION)
TABLE 782 INDONESIA FRUIT FLAVORS IN FOOD FLAVORS MARKET, BY TYPE, 2021-2030 (USD MILLION)
TABLE 783 INDONESIA FRUIT FLAVORS IN FOOD FLAVORS MARKET, BY PRODUCT TYPE, 2021-2030, VOLUME (KILO LITERS)
TABLE 784 INDONESIA FRUIT FLAVORS IN FOOD FLAVORS MARKET, BY PRODUCT TYPE, 2021-2030 (ASP)
TABLE 785 INDONESIA BERRIES IN FOOD FLAVORS MARKET, BY TYPE, 2021-2030 (USD MILLION)
TABLE 786 INDONESIA BERRIES IN FOOD FLAVORS MARKET, BY PRODUCT TYPE, 2021-2030, VOLUME (KILO LITERS)
TABLE 787 INDONESIA BERRIES IN FOOD FLAVORS MARKET, BY PRODUCT TYPE, 2021-2030 (ASP)
TABLE 788 INDONESIA FRUIT FLAVORS IN FOOD FLAVORS MARKET, BY PRODUCT TYPE, 2021-2030 (USD MILLION)
TABLE 789 INDONESIA SPICE FLAVORS IN FOOD FLAVORS MARKET, BY TYPE, 2021-2030 (USD MILLION)
TABLE 790 INDONESIA SPICE FLAVORS IN FOOD FLAVORS MARKET, BY PRODUCT TYPE, 2021-2030, VOLUME (KILO LITERS)
TABLE 791 INDONESIA SPICE FLAVORS IN FOOD FLAVORS MARKET, BY PRODUCT TYPE, 2021-2030 (ASP)
TABLE 792 INDONESIA SPICE FLAVORS IN FOOD FLAVORS MARKET, BY PRODUCT TYPE, 2021-2030 (USD MILLION)
TABLE 793 INDONESIA HERBAL FLAVORS IN FOOD FLAVORS MARKET, BY TYPE, 2021-2030 (USD MILLION)
TABLE 794 INDONESIA HERBAL FLAVORS IN FOOD FLAVORS MARKET, BY PRODUCT TYPE, 2021-2030, VOLUME (KILO LITERS)
TABLE 795 INDONESIA HERBAL FLAVORS IN FOOD FLAVORS MARKET, BY PRODUCT TYPE, 2021-2030 (ASP)
TABLE 796 INDONESIA HERBAL FLAVORS IN FOOD FLAVORS MARKET, BY PRODUCT TYPE, 2021-2030 (USD MILLION)
TABLE 797 INDONESIA CITRUS FLAVORS IN FOOD FLAVORS MARKET, BY TYPE, 2021-2030 (USD MILLION)
TABLE 798 INDONESIA CITRUS FLAVORS IN FOOD FLAVORS MARKET, BY PRODUCT TYPE, 2021-2030, VOLUME (KILO LITERS)
TABLE 799 INDONESIA CITRUS FLAVORS IN FOOD FLAVORS MARKET, BY PRODUCT TYPE, 2021-2030 (ASP)
TABLE 800 INDONESIA CITRUS FLAVORS IN FOOD FLAVORS MARKET, BY PRODUCT TYPE, 2021-2030 (USD MILLION)
TABLE 801 INDONESIA DAIRY FLAVORS IN FOOD FLAVORS MARKET, BY TYPE, 2021-2030 (USD MILLION)
TABLE 802 INDONESIA DAIRY FLAVORS IN FOOD FLAVORS MARKET, BY PRODUCT TYPE, 2021-2030, VOLUME (KILO LITERS)
TABLE 803 INDONESIA DAIRY FLAVORS IN FOOD FLAVORS MARKET, BY PRODUCT TYPE, 2021-2030 (ASP)
TABLE 804 INDONESIA BUTTER FLAVOR IN FOOD FLAVORS MARKET, BY TYPE, 2021-2030 (USD MILLION)
TABLE 805 INDONESIA DAIRY FLAVORS IN FOOD FLAVORS MARKET, BY PRODUCT TYPE, 2021-2030 (USD MILLION)
TABLE 806 INDONESIA NUTTY FLAVORS IN FOOD FLAVORS MARKET, BY TYPE, 2021-2030 (USD MILLION)
TABLE 807 INDONESIA NUTTY FLAVORS IN FOOD FLAVORS MARKET, BY PRODUCT TYPE, 2021-2030, VOLUME (KILO LITERS)
TABLE 808 INDONESIA NUTTY FLAVORS IN FOOD FLAVORS MARKET, BY PRODUCT TYPE, 2021-2030 (ASP)
TABLE 809 INDONESIA NUTTY FLAVORS IN FOOD FLAVORS MARKET, BY PRODUCT TYPE, 2021-2030 (USD MILLION)
TABLE 810 INDONESIA VEGETABLE EXTRACTS IN FOOD FLAVORS MARKET, BY TYPE, 2021-2030 (USD MILLION)
TABLE 811 INDONESIA VEGETABLE EXTRACT IN FOOD FLAVORS MARKET, BY PRODUCT TYPE, 2021-2030, VOLUME (KILO LITERS)
TABLE 812 INDONESIA VEGETABLE EXTRACT IN FOOD FLAVORS MARKET, BY PRODUCT TYPE, 2021-2030 (ASP)
TABLE 813 INDONESIA VEGETABLE EXTRACTS IN FOOD FLAVORS MARKET, BY PRODUCT TYPE, 2021-2030 (USD MILLION)
TABLE 814 INDONESIA COFFEE FLAVORS IN FOOD FLAVORS MARKET, BY PRODUCT TYPE, 2021-2030 (USD MILLION)
TABLE 815 INDONESIA COFFEE FLAVORS IN FOOD FLAVORS MARKET, BY PRODUCT TYPE, 2021-2030, VOLUME (KILO LITERS)
TABLE 816 INDONESIA COFFEE FLAVORS IN FOOD FLAVORS MARKET, BY PRODUCT TYPE, 2021-2030 (ASP)
TABLE 817 INDONESIA CHOCOLATE FLAVORS IN FOOD FLAVORS MARKET, BY PRODUCT TYPE, 2021-2030 (USD MILLION)
TABLE 818 INDONESIA CHOCOLATE FLAVORS IN FOOD FLAVORS MARKET, BY PRODUCT TYPE, 2021-2030, VOLUME (KILO LITERS)
TABLE 819 INDONESIA CHOCOLATE FLAVORS IN FOOD FLAVORS MARKET, BY PRODUCT TYPE, 2021-2030 (ASP)
TABLE 820 INDONESIA DATE DERIVATIVES IN FOOD FLAVORS MARKET, BY PRODUCT TYPE, 2021-2030 (USD MILLION)
TABLE 821 INDONESIA VEGETABLE OILS IN FOOD FLAVORS MARKET, BY TYPE, 2021-2030 (USD MILLION)
TABLE 822 INDONESIA VEGETABLE OILS IN FOOD FLAVORS MARKET, BY PRODUCT TYPE, 2021-2030, VOLUME (KILO LITERS)
TABLE 823 INDONESIA VEGETABLE OILS IN FOOD FLAVORS MARKET, BY PRODUCT TYPE, 2021-2030 (ASP)
TABLE 824 INDONESIA VEGETABLE OILS IN FOOD FLAVORS MARKET, BY PRODUCT TYPE, 2021-2030 (USD MILLION)
TABLE 825 INDONESIA OTHERS IN FOOD FLAVORS MARKET, BY TYPE, 2021-2030 (USD MILLION)
TABLE 826 INDONESIA FOOD FLAVORS MARKET, BY ORIGIN, 2021-2030 (USD MILLION)
TABLE 827 INDONESIA FOOD FLAVORS MARKET, BY CATEGORY, 2021-2030 (USD MILLION)
TABLE 828 INDONESIA FOOD FLAVORS MARKET, BY SOLUBILITY, 2021-2030 (USD MILLION)
TABLE 829 INDONESIA FOOD FLAVORS MARKET, BY FORM, 2021-2030 (USD MILLION)
TABLE 830 INDONESIA FOOD FLAVORS MARKET, BY APPLICATION, 2021-2030 (USD MILLION)
TABLE 831 INDONESIA CONFECTIONERY IN FOOD FLAVORS MARKET, BY TYPE, 2021-2030 (USD MILLION)
TABLE 832 INDONESIA CONFECTIONERY IN FOOD FLAVORS MARKET, BY FLAVOR TYPE, 2021-2030 (USD MILLION)
TABLE 833 INDONESIA CONFECTIONERY IN FOOD FLAVORS MARKET, BY PRODUCT TYPE, 2021-2030 (USD MILLION)
TABLE 834 INDONESIA BAKERY IN FOOD FLAVORS MARKET, BY TYPE, 2021-2030 (USD MILLION)
TABLE 835 INDONESIA BAKERY IN FOOD FLAVORS MARKET, BY FLAVOR TYPE, 2021-2030 (USD MILLION)
TABLE 836 INDONESIA BAKERY IN FOOD FLAVORS MARKET, BY PRODUCT TYPE, 2021-2030 (USD MILLION)
TABLE 837 INDONESIA CONVENIENCE FOOD IN FOOD FLAVORS MARKET, BY TYPE, 2021-2030 (USD MILLION)
TABLE 838 INDONESIA CONVENIENCE FOOD IN FOOD FLAVORS MARKET, BY FLAVOR TYPE, 2021-2030 (USD MILLION)
TABLE 839 INDONESIA CONVENIENCE FOOD IN FOOD FLAVORS MARKET, BY PRODUCT TYPE, 2021-2030 (USD MILLION)
TABLE 840 INDONESIA SNACKS & EXTRUDED SNACKS IN FOOD FLAVORS MARKET, BY FLAVOR TYPE, 2021-2030 (USD MILLION)
TABLE 841 INDONESIA SNACKS & EXTRUDED SNACKS IN FOOD FLAVORS MARKET, BY PRODUCT TYPE, 2021-2030 (USD MILLION)
TABLE 842 INDONESIA FROZEN DESSERTS IN FOOD FLAVORS MARKET, BY TYPE, 2021-2030 (USD MILLION)
TABLE 843 INDONESIA FROZEN DESSERTS IN FOOD FLAVORS MARKET, BY FLAVOR TYPE, 2021-2030 (USD MILLION)
TABLE 844 INDONESIA FROZEN DESSERTS IN FOOD FLAVORS MARKET, BY PRODUCT TYPE, 2021-2030 (USD MILLION)
TABLE 845 INDONESIA MEAT AND POULTRY PRODUCTS IN FOOD FLAVORS MARKET, BY TYPE, 2021-2030 (USD MILLION)
TABLE 846 INDONESIA MEAT AND POULTRY PRODUCTS IN FOOD FLAVORS MARKET, BY FLAVOR TYPE, 2021-2030 (USD MILLION)
TABLE 847 INDONESIA MEAT AND POULTRY PRODUCTS IN FOOD FLAVORS MARKET, BY PRODUCT TYPE, 2021-2030 (USD MILLION)
TABLE 848 INDONESIA BREAKFAST CEREALS IN FOOD FLAVORS MARKET, BY FLAVOR TYPE, 2021-2030 (USD MILLION)
TABLE 849 INDONESIA BREAKFAST CEREALS IN FOOD FLAVORS MARKET, BY PRODUCT TYPE, 2021-2030 (USD MILLION)
TABLE 850 INDONESIA PROCESSED FOOD IN FOOD FLAVORS MARKET, BY TYPE, 2021-2030 (USD MILLION)
TABLE 851 INDONESIA PROCESSED FOOD IN FOOD FLAVORS MARKET, BY FLAVOR TYPE, 2021-2030 (USD MILLION)
TABLE 852 INDONESIA PROCESSED FOOD IN FOOD FLAVORS MARKET, BY PRODUCT TYPE, 2021-2030 (USD MILLION)
TABLE 853 INDONESIA BABY FOOD IN FOOD FLAVORS MARKET, BY FLAVOR TYPE, 2021-2030 (USD MILLION)
TABLE 854 INDONESIA BABY FOOD IN FOOD FLAVORS MARKET, BY PRODUCT TYPE, 2021-2030 (USD MILLION)
TABLE 855 INDONESIA SPORTS NUTRITION IN FOOD FLAVORS MARKET, BY TYPE, 2021-2030 (USD MILLION)
TABLE 856 INDONESIA SPORTS NUTRITION IN FOOD FLAVORS MARKET, BY FLAVOR TYPE, 2021-2030 (USD MILLION)
TABLE 857 INDONESIA SPORTS NUTRITION IN FOOD FLAVORS MARKET, BY PRODUCT TYPE, 2021-2030 (USD MILLION)
TABLE 858 INDONESIA DIETARY SUPPLEMENTS IN FOOD FLAVORS MARKET, BY TYPE, 2021-2030 (USD MILLION)
TABLE 859 INDONESIA DIETARY SUPPLEMENTS IN FOOD FLAVORS MARKET, BY FLAVOR TYPE, 2021-2030 (USD MILLION)
TABLE 860 INDONESIA DIETARY SUPPLEMENTS IN FOOD FLAVORS MARKET, BY PRODUCT TYPE, 2021-2030 (USD MILLION)
TABLE 861 INDONESIA BEVERAGES IN FOOD FLAVORS MARKET, BY TYPE, 2021-2030 (USD MILLION)
TABLE 862 INDONESIA BEVERAGES IN FOOD FLAVORS MARKET, BY FLAVOR TYPE, 2021-2030 (USD MILLION)
TABLE 863 INDONESIA BEVERAGES IN FOOD FLAVORS MARKET, BY PRODUCT TYPE, 2021-2030 (USD MILLION)
TABLE 864 PHILIPPINES FOOD FLAVORS MARKET, BY PRODUCT TYPE, 2021-2030 (USD MILLION)
TABLE 865 PHILIPPINES FOOD FLAVORS MARKET, BY TYPE, 2021-2030 (USD MILLION)
TABLE 866 PHILIPPINES FRUIT FLAVORS IN FOOD FLAVORS MARKET, BY TYPE, 2021-2030 (USD MILLION)
TABLE 867 PHILIPPINES FRUIT FLAVORS IN FOOD FLAVORS MARKET, BY PRODUCT TYPE, 2021-2030, VOLUME (KILO LITERS)
TABLE 868 PHILIPPINES FRUIT FLAVORS IN FOOD FLAVORS MARKET, BY PRODUCT TYPE, 2021-2030 (ASP)
TABLE 869 PHILIPPINES BERRIES IN FOOD FLAVORS MARKET, BY TYPE, 2021-2030 (USD MILLION)
TABLE 870 PHILIPPINES BERRIES IN FOOD FLAVORS MARKET, BY PRODUCT TYPE, 2021-2030, VOLUME (KILO LITERS)
TABLE 871 PHILIPPINES BERRIES IN FOOD FLAVORS MARKET, BY PRODUCT TYPE, 2021-2030 (ASP)
TABLE 872 PHILIPPINES FRUIT FLAVORS IN FOOD FLAVORS MARKET, BY PRODUCT TYPE, 2021-2030 (USD MILLION)
TABLE 873 PHILIPPINES SPICE FLAVORS IN FOOD FLAVORS MARKET, BY TYPE, 2021-2030 (USD MILLION)
TABLE 874 PHILIPPINES SPICE FLAVORS IN FOOD FLAVORS MARKET, BY PRODUCT TYPE, 2021-2030, VOLUME (KILO LITERS)
TABLE 875 PHILIPPINES SPICE FLAVORS IN FOOD FLAVORS MARKET, BY PRODUCT TYPE, 2021-2030 (ASP)
TABLE 876 PHILIPPINES SPICE FLAVORS IN FOOD FLAVORS MARKET, BY PRODUCT TYPE, 2021-2030 (USD MILLION)
TABLE 877 PHILIPPINES HERBAL FLAVORS IN FOOD FLAVORS MARKET, BY TYPE, 2021-2030 (USD MILLION)
TABLE 878 PHILIPPINES HERBAL FLAVORS IN FOOD FLAVORS MARKET, BY PRODUCT TYPE, 2021-2030, VOLUME (KILO LITERS)
TABLE 879 PHILIPPINES HERBAL FLAVORS IN FOOD FLAVORS MARKET, BY PRODUCT TYPE, 2021-2030 (ASP)
TABLE 880 PHILIPPINES HERBAL FLAVORS IN FOOD FLAVORS MARKET, BY PRODUCT TYPE, 2021-2030 (USD MILLION)
TABLE 881 PHILIPPINES CITRUS FLAVORS IN FOOD FLAVORS MARKET, BY TYPE, 2021-2030 (USD MILLION)
TABLE 882 PHILIPPINES CITRUS FLAVORS IN FOOD FLAVORS MARKET, BY PRODUCT TYPE, 2021-2030, VOLUME (KILO LITERS)
TABLE 883 PHILIPPINES CITRUS FLAVORS IN FOOD FLAVORS MARKET, BY PRODUCT TYPE, 2021-2030 (ASP)
TABLE 884 PHILIPPINES CITRUS FLAVORS IN FOOD FLAVORS MARKET, BY PRODUCT TYPE, 2021-2030 (USD MILLION)
TABLE 885 PHILIPPINES DAIRY FLAVORS IN FOOD FLAVORS MARKET, BY TYPE, 2021-2030 (USD MILLION)
TABLE 886 PHILIPPINES DAIRY FLAVORS IN FOOD FLAVORS MARKET, BY PRODUCT TYPE, 2021-2030, VOLUME (KILO LITERS)
TABLE 887 PHILIPPINES DAIRY FLAVORS IN FOOD FLAVORS MARKET, BY PRODUCT TYPE, 2021-2030 (ASP)
TABLE 888 PHILIPPINES BUTTER FLAVOR IN FOOD FLAVORS MARKET, BY TYPE, 2021-2030 (USD MILLION)
TABLE 889 PHILIPPINES DAIRY FLAVORS IN FOOD FLAVORS MARKET, BY PRODUCT TYPE, 2021-2030 (USD MILLION)
TABLE 890 PHILIPPINES NUTTY FLAVORS IN FOOD FLAVORS MARKET, BY TYPE, 2021-2030 (USD MILLION)
TABLE 891 PHILIPPINES NUTTY FLAVORS IN FOOD FLAVORS MARKET, BY PRODUCT TYPE, 2021-2030, VOLUME (KILO LITERS)
TABLE 892 PHILIPPINES NUTTY FLAVORS IN FOOD FLAVORS MARKET, BY PRODUCT TYPE, 2021-2030 (ASP)
TABLE 893 PHILIPPINES NUTTY FLAVORS IN FOOD FLAVORS MARKET, BY PRODUCT TYPE, 2021-2030 (USD MILLION)
TABLE 894 PHILIPPINES VEGETABLE EXTRACTS IN FOOD FLAVORS MARKET, BY TYPE, 2021-2030 (USD MILLION)
TABLE 895 PHILIPPINES VEGETABLE EXTRACT IN FOOD FLAVORS MARKET, BY PRODUCT TYPE, 2021-2030, VOLUME (KILO LITERS)
TABLE 896 PHILIPPINES VEGETABLE EXTRACT IN FOOD FLAVORS MARKET, BY PRODUCT TYPE, 2021-2030 (ASP)
TABLE 897 PHILIPPINES VEGETABLE EXTRACTS IN FOOD FLAVORS MARKET, BY PRODUCT TYPE, 2021-2030 (USD MILLION)
TABLE 898 PHILIPPINES COFFEE FLAVORS IN FOOD FLAVORS MARKET, BY PRODUCT TYPE, 2021-2030 (USD MILLION)
TABLE 899 PHILIPPINES COFFEE FLAVORS IN FOOD FLAVORS MARKET, BY PRODUCT TYPE, 2021-2030, VOLUME (KILO LITERS)
TABLE 900 PHILIPPINES COFFEE FLAVORS IN FOOD FLAVORS MARKET, BY PRODUCT TYPE, 2021-2030 (ASP)
TABLE 901 PHILIPPINES CHOCOLATE FLAVORS IN FOOD FLAVORS MARKET, BY PRODUCT TYPE, 2021-2030 (USD MILLION)
TABLE 902 PHILIPPINES CHOCOLATE FLAVORS IN FOOD FLAVORS MARKET, BY PRODUCT TYPE, 2021-2030, VOLUME (KILO LITERS)
TABLE 903 PHILIPPINES CHOCOLATE FLAVORS IN FOOD FLAVORS MARKET, BY PRODUCT TYPE, 2021-2030 (ASP)
TABLE 904 PHILIPPINES DATE DERIVATIVES IN FOOD FLAVORS MARKET, BY PRODUCT TYPE, 2021-2030 (USD MILLION)
TABLE 905 PHILIPPINES VEGETABLE OILS IN FOOD FLAVORS MARKET, BY TYPE, 2021-2030 (USD MILLION)
TABLE 906 PHILIPPINES VEGETABLE OILS IN FOOD FLAVORS MARKET, BY PRODUCT TYPE, 2021-2030, VOLUME (KILO LITERS)
TABLE 907 PHILIPPINES VEGETABLE OILS IN FOOD FLAVORS MARKET, BY PRODUCT TYPE, 2021-2030 (ASP)
TABLE 908 PHILIPPINES VEGETABLE OILS IN FOOD FLAVORS MARKET, BY PRODUCT TYPE, 2021-2030 (USD MILLION)
TABLE 909 PHILIPPINES OTHERS IN FOOD FLAVORS MARKET, BY TYPE, 2021-2030 (USD MILLION)
TABLE 910 PHILIPPINES FOOD FLAVORS MARKET, BY ORIGIN, 2021-2030 (USD MILLION)
TABLE 911 PHILIPPINES FOOD FLAVORS MARKET, BY CATEGORY, 2021-2030 (USD MILLION)
TABLE 912 PHILIPPINES FOOD FLAVORS MARKET, BY SOLUBILITY, 2021-2030 (USD MILLION)
TABLE 913 PHILIPPINES FOOD FLAVORS MARKET, BY FORM, 2021-2030 (USD MILLION)
TABLE 914 PHILIPPINES FOOD FLAVORS MARKET, BY APPLICATION, 2021-2030 (USD MILLION)
TABLE 915 PHILIPPINES CONFECTIONERY IN FOOD FLAVORS MARKET, BY TYPE, 2021-2030 (USD MILLION)
TABLE 916 PHILIPPINES CONFECTIONERY IN FOOD FLAVORS MARKET, BY FLAVOR TYPE, 2021-2030 (USD MILLION)
TABLE 917 PHILIPPINES CONFECTIONERY IN FOOD FLAVORS MARKET, BY PRODUCT TYPE, 2021-2030 (USD MILLION)
TABLE 918 PHILIPPINES BAKERY IN FOOD FLAVORS MARKET, BY TYPE, 2021-2030 (USD MILLION)
TABLE 919 PHILIPPINES BAKERY IN FOOD FLAVORS MARKET, BY FLAVOR TYPE, 2021-2030 (USD MILLION)
TABLE 920 PHILIPPINES BAKERY IN FOOD FLAVORS MARKET, BY PRODUCT TYPE, 2021-2030 (USD MILLION)
TABLE 921 PHILIPPINES CONVENIENCE FOOD IN FOOD FLAVORS MARKET, BY TYPE, 2021-2030 (USD MILLION)
TABLE 922 PHILIPPINES CONVENIENCE FOOD IN FOOD FLAVORS MARKET, BY FLAVOR TYPE, 2021-2030 (USD MILLION)
TABLE 923 PHILIPPINES CONVENIENCE FOOD IN FOOD FLAVORS MARKET, BY PRODUCT TYPE, 2021-2030 (USD MILLION)
TABLE 924 PHILIPPINES SNACKS & EXTRUDED SNACKS IN FOOD FLAVORS MARKET, BY FLAVOR TYPE, 2021-2030 (USD MILLION)
TABLE 925 PHILIPPINES SNACKS & EXTRUDED SNACKS IN FOOD FLAVORS MARKET, BY PRODUCT TYPE, 2021-2030 (USD MILLION)
TABLE 926 PHILIPPINES FROZEN DESSERTS IN FOOD FLAVORS MARKET, BY TYPE, 2021-2030 (USD MILLION)
TABLE 927 PHILIPPINES FROZEN DESSERTS IN FOOD FLAVORS MARKET, BY FLAVOR TYPE, 2021-2030 (USD MILLION)
TABLE 928 PHILIPPINES FROZEN DESSERTS IN FOOD FLAVORS MARKET, BY PRODUCT TYPE, 2021-2030 (USD MILLION)
TABLE 929 PHILIPPINES MEAT AND POULTRY PRODUCTS IN FOOD FLAVORS MARKET, BY TYPE, 2021-2030 (USD MILLION)
TABLE 930 PHILIPPINES MEAT AND POULTRY PRODUCTS IN FOOD FLAVORS MARKET, BY FLAVOR TYPE, 2021-2030 (USD MILLION)
TABLE 931 PHILIPPINES MEAT AND POULTRY PRODUCTS IN FOOD FLAVORS MARKET, BY PRODUCT TYPE, 2021-2030 (USD MILLION)
TABLE 932 PHILIPPINES BREAKFAST CEREALS IN FOOD FLAVORS MARKET, BY FLAVOR TYPE, 2021-2030 (USD MILLION)
TABLE 933 PHILIPPINES BREAKFAST CEREALS IN FOOD FLAVORS MARKET, BY PRODUCT TYPE, 2021-2030 (USD MILLION)
TABLE 934 PHILIPPINES PROCESSED FOOD IN FOOD FLAVORS MARKET, BY TYPE, 2021-2030 (USD MILLION)
TABLE 935 PHILIPPINES PROCESSED FOOD IN FOOD FLAVORS MARKET, BY FLAVOR TYPE, 2021-2030 (USD MILLION)
TABLE 936 PHILIPPINES PROCESSED FOOD IN FOOD FLAVORS MARKET, BY PRODUCT TYPE, 2021-2030 (USD MILLION)
TABLE 937 PHILIPPINES BABY FOOD IN FOOD FLAVORS MARKET, BY FLAVOR TYPE, 2021-2030 (USD MILLION)
TABLE 938 PHILIPPINES BABY FOOD IN FOOD FLAVORS MARKET, BY PRODUCT TYPE, 2021-2030 (USD MILLION)
TABLE 939 PHILIPPINES SPORTS NUTRITION IN FOOD FLAVORS MARKET, BY TYPE, 2021-2030 (USD MILLION)
TABLE 940 PHILIPPINES SPORTS NUTRITION IN FOOD FLAVORS MARKET, BY FLAVOR TYPE, 2021-2030 (USD MILLION)
TABLE 941 PHILIPPINES SPORTS NUTRITION IN FOOD FLAVORS MARKET, BY PRODUCT TYPE, 2021-2030 (USD MILLION)
TABLE 942 PHILIPPINES DIETARY SUPPLEMENTS IN FOOD FLAVORS MARKET, BY TYPE, 2021-2030 (USD MILLION)
TABLE 943 PHILIPPINES DIETARY SUPPLEMENTS IN FOOD FLAVORS MARKET, BY FLAVOR TYPE, 2021-2030 (USD MILLION)
TABLE 944 PHILIPPINES DIETARY SUPPLEMENTS IN FOOD FLAVORS MARKET, BY PRODUCT TYPE, 2021-2030 (USD MILLION)
TABLE 945 PHILIPPINES BEVERAGES IN FOOD FLAVORS MARKET, BY TYPE, 2021-2030 (USD MILLION)
TABLE 946 PHILIPPINES BEVERAGES IN FOOD FLAVORS MARKET, BY FLAVOR TYPE, 2021-2030 (USD MILLION)
TABLE 947 PHILIPPINES BEVERAGES IN FOOD FLAVORS MARKET, BY PRODUCT TYPE, 2021-2030 (USD MILLION)
TABLE 948 REST OF ASIA-PACIFIC FOOD FLAVORS MARKET, BY PRODUCT TYPE, 2021-2030 (USD MILLION)
Lista de Figura
FIGURE 1 ASIA PACIFIC FOOD FLAVORS MARKET: SEGMENTATION
FIGURE 2 ASIA PACIFIC FOOD FLAVORS MARKET: DATA TRIANGULATION
FIGURE 3 ASIA PACIFIC FOOD FLAVORS MARKET: DROC ANALYSIS
FIGURE 4 ASIA PACIFIC FOOD FLAVORS MARKET: ASIA PACIFIC VS. REGIONAL MARKET ANALYSIS
FIGURE 5 ASIA PACIFIC FOOD FLAVORS MARKET: COMPANY RESEARCH ANALYSIS
FIGURE 6 ASIA PACIFIC FOOD FLAVORS MARKET: MULTIVARIATE MODELLING
FIGURE 7 ASIA PACIFIC FOOD FLAVORS MARKET: INTERVIEW DEMOGRAPHICS
FIGURE 8 ASIA PACIFIC FOOD FLAVORS MARKET: DBMR MARKET POSITION GRID
FIGURE 9 ASIA PACIFIC FOOD FLAVORS MARKET: VENDOR SHARE ANALYSIS
FIGURE 10 ASIA PACIFIC FOOD FLAVORS MARKET: MARKET END COVERAGE GRID
FIGURE 11 ASIA PACIFIC FOOD FLAVORS MARKET: SEGMENTATION
FIGURE 12 AN INCREASE IN THE INCIDENCE OF GASTROINTESTINAL TUMORS, LYMPHOMA, AND ADENOCARCINOMA IS EXPECTED TO DRIVE THE ASIA PACIFIC FOOD FLAVORS MARKET GROWTH IN THE FORECAST PERIOD OF 2023 TO 2030
FIGURE 13 APPLICATION SEGMENT IS EXPECTED TO ACCOUNT FOR THE LARGEST SHARE OF THE ASIA PACIFIC FOOD FLAVORS MARKET IN 2023 & 2030
FIGURE 14 FLAVORS AND FRAGRANCES VALUE CHAIN
FIGURE 15 DRIVERS, RESTRAINTS, OPPORTUNITIES AND CHALLENGES OF THE ASIA PACIFIC FOOD FLAVORS MARKET
FIGURE 16 ASIA PACIFIC FOOD FLAVORS MARKET: BY PRODUCT TYPE, 2022
FIGURE 17 ASIA PACIFIC FOOD FLAVORS MARKET: BY PRODUCT TYPE, 2023-2030 (USD MILLION)
FIGURE 18 ASIA PACIFIC FOOD FLAVORS MARKET: BY PRODUCT TYPE, CAGR (2023-2030)
FIGURE 19 ASIA PACIFIC FOOD FLAVORS MARKET: BY PRODUCT TYPE, LIFELINE CURVE
FIGURE 20 ASIA PACIFIC FOOD FLAVORS MARKET: BY TYPE, 2022
FIGURE 21 ASIA PACIFIC FOOD FLAVORS MARKET: BY TYPE, 2023-2030 (USD MILLION)
FIGURE 22 ASIA PACIFIC FOOD FLAVORS MARKET: BY TYPE, CAGR (2023-2030)
FIGURE 23 ASIA PACIFIC FOOD FLAVORS MARKET: BY TYPE, LIFELINE CURVE
FIGURE 24 ASIA PACIFIC FOOD FLAVORS MARKET: BY ORIGIN, 2022
FIGURE 25 ASIA PACIFIC FOOD FLAVORS MARKET: BY ORIGIN, 2023-2030 (USD MILLION)
FIGURE 26 ASIA PACIFIC FOOD FLAVORS MARKET: BY ORIGIN, CAGR (2023-2030)
FIGURE 27 ASIA PACIFIC FOOD FLAVORS MARKET: BY ORIGIN, LIFELINE CURVE
FIGURE 28 ASIA PACIFIC FOOD FLAVORS MARKET: BY CATEGORY, 2022
FIGURE 29 ASIA PACIFIC FOOD FLAVORS MARKET: BY CATEGORY, 2023-2030 (USD MILLION)
FIGURE 30 ASIA PACIFIC FOOD FLAVORS MARKET: BY CATEGORY, CAGR (2023-2030)
FIGURE 31 ASIA PACIFIC FOOD FLAVORS MARKET: BY CATEGORY, LIFELINE CURVE
FIGURE 32 ASIA PACIFIC FOOD FLAVORS MARKET: BY SOLUBILITY, 2022
FIGURE 33 ASIA PACIFIC FOOD FLAVORS MARKET: BY SOLUBILITY, 2023-2030 (USD MILLION)
FIGURE 34 ASIA PACIFIC FOOD FLAVORS MARKET: BY SOLUBILITY, CAGR (2023-2030)
FIGURE 35 ASIA PACIFIC FOOD FLAVORS MARKET: BY SOLUBILITY, LIFELINE CURVE
FIGURE 36 ASIA PACIFIC FOOD FLAVORS MARKET: BY FORM, 2022
FIGURE 37 ASIA PACIFIC FOOD FLAVORS MARKET: BY FORM, 2023-2030 (USD MILLION)
FIGURE 38 ASIA PACIFIC FOOD FLAVORS MARKET: BY FORM, CAGR (2023-2030)
FIGURE 39 ASIA PACIFIC FOOD FLAVORS MARKET: BY FORM, LIFELINE CURVE
FIGURE 40 ASIA PACIFIC FOOD FLAVORS MARKET: BY APPLICATION, 2022
FIGURE 41 ASIA PACIFIC FOOD FLAVORS MARKET: BY APPLICATION, 2023-2030 (USD MILLION)
FIGURE 42 ASIA PACIFIC FOOD FLAVORS MARKET: BY APPLICATION, CAGR (2023-2030)
FIGURE 43 ASIA PACIFIC FOOD FLAVORS MARKET: BY APPLICATION, LIFELINE CURVE
FIGURE 44 ASIA-PACIFIC FOOD FLAVORS MARKET: SNAPSHOT (2022)
FIGURE 45 ASIA-PACIFIC FOOD FLAVORS MARKET: BY COUNTRY (2022)
FIGURE 46 ASIA-PACIFIC FOOD FLAVORS MARKET: BY COUNTRY (2023 & 2030)
FIGURE 47 ASIA-PACIFIC FOOD FLAVORS MARKET: BY COUNTRY (2022 & 2030)
FIGURE 48 ASIA-PACIFIC FOOD FLAVORS MARKET: BY PRODUCT TYPE (2023-2030)
FIGURE 49 ASIA PACIFIC FOOD AND FLAVORS MARKET: COMPANY SHARE 2022 (%)
Metodologia de Investigação
A recolha de dados e a análise do ano base são feitas através de módulos de recolha de dados com amostras grandes. A etapa inclui a obtenção de informações de mercado ou dados relacionados através de diversas fontes e estratégias. Inclui examinar e planear antecipadamente todos os dados adquiridos no passado. Da mesma forma, envolve o exame de inconsistências de informação observadas em diferentes fontes de informação. Os dados de mercado são analisados e estimados utilizando modelos estatísticos e coerentes de mercado. Além disso, a análise da quota de mercado e a análise das principais tendências são os principais fatores de sucesso no relatório de mercado. Para saber mais, solicite uma chamada de analista ou abra a sua consulta.
A principal metodologia de investigação utilizada pela equipa de investigação do DBMR é a triangulação de dados que envolve a mineração de dados, a análise do impacto das variáveis de dados no mercado e a validação primária (especialista do setor). Os modelos de dados incluem grelha de posicionamento de fornecedores, análise da linha de tempo do mercado, visão geral e guia de mercado, grelha de posicionamento da empresa, análise de patentes, análise de preços, análise da quota de mercado da empresa, normas de medição, análise global versus regional e de participação dos fornecedores. Para saber mais sobre a metodologia de investigação, faça uma consulta para falar com os nossos especialistas do setor.
Personalização disponível
A Data Bridge Market Research é líder em investigação formativa avançada. Orgulhamo-nos de servir os nossos clientes novos e existentes com dados e análises que correspondem e atendem aos seus objetivos. O relatório pode ser personalizado para incluir análise de tendências de preços de marcas-alvo, compreensão do mercado para países adicionais (solicite a lista de países), dados de resultados de ensaios clínicos, revisão de literatura, mercado remodelado e análise de base de produtos . A análise de mercado dos concorrentes-alvo pode ser analisada desde análises baseadas em tecnologia até estratégias de carteira de mercado. Podemos adicionar quantos concorrentes necessitar de dados no formato e estilo de dados que procura. A nossa equipa de analistas também pode fornecer dados em tabelas dinâmicas de ficheiros Excel em bruto (livro de factos) ou pode ajudá-lo a criar apresentações a partir dos conjuntos de dados disponíveis no relatório.

