

Asia-Pacific Fat Replacers Market, By Type (Carbohydrate-Based, Protein-Based, And Fat-Based), Source (Plant And Animal), Category (Clean-Label And Conventional), Form (Liquid And Dry), Application (Bakery, Dairy Products, Sauces, Soups, & Dressings, Convenience Foods, Processed Food, Confectionery, Processed Meat, Functional Food And Others), Country (China, India, Japan, Australia, Indonesia, Singapore, South Korea, Malaysia, Thailand, Philippines, Rest of Asia-Pacific) Industry Trends and Forecast to 2029.
 Market Analysis and Insights : Asia-Pacific Fat Replacers Market
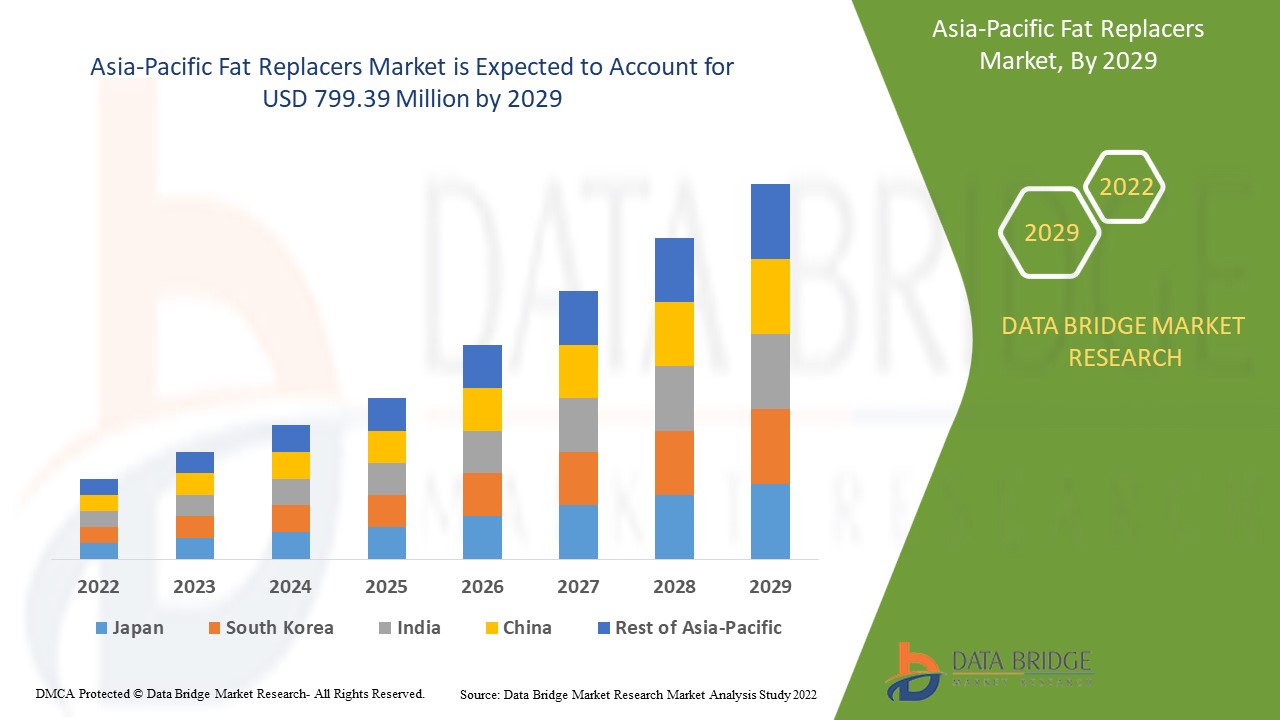
Asia-Pacific fat replacers market is expected to gain significant growth in the forecast period of 2022 to 2029. Data Bridge Market Research analyzes that the market is growing with a CAGR of 6.8% in the forecast period of 2022 to 2029 and is expected to reach USD 799.39 million by 2029. Growth in usage of fat replacers in bakery, dairy, and frozen products is expected to drive the market growth.
Fat replacers, also known as fat substitutes, are substances that replace all or portion of the fat in a diet while maintaining the same taste, texture, and mouth feel as the original full-fat food. Fat is not a single substance, but rather a collection of various substances made up of a glycerol molecule and three separate fatty acids. It is an essential component of a healthy diet. It contains the building blocks for prostaglandins, contains essential fatty acids, helps control cholesterol metabolism, transports fat-soluble vitamins and carotenoids throughout the body, and offers nine calories of energy per gram.
Fat replacers are compounds that are used to replace fat in a variety of foods and beverages. The majority of fat substitutes are reformulated versions of existing food components (starches, gums, cellulose, and others).
Fat can be found in almost any food. It imparts a distinct texture, flavor, and aroma to the dish in which it is present. While fat is necessary for life, it can be harmful to one's health if consumed in excess of physiological requirements. Diets high in fat raise the risk of heart disease, weight gain, and several cancers. The use of fat replacers in food products allows for the retention of the food's original quality characteristics while avoiding the risks associated with fat consumption. The fat replacers market is gaining significant growth due to increasing awareness among people about excessive consumption of fat, growing health consciousness among people. Increasing participation of people in weight loss management programs, growing government regulations associated with limit on daily consumption of fat, and growing usage of fat replacer in bakery, dairy, and frozen products are also boosting the growth of the global fat replacers market. However, unfavorable taste when compared to fats, and nutrition problems associated with fat substitutes are expected to restrain the growth of fat replacers market during the forecast period. Increase in consumption of convenience food and a large number of people opting dairy-free diets, and increase in research & development of fat replacers will create opportunity for the market in the forecast period. However, high prices of fat replacer products and adverse effects of fat replacers can create a massive challenge for the market.
The Asia-Pacific fat replacers market report provides details of market share, new developments, and product pipeline analysis, impact of domestic and localized market players, analyses opportunities in terms of emerging revenue pockets, changes in market regulations, product approvals, strategic decisions, product launches, geographic expansions, and technological innovations in the market. To understand the analysis and the Fat replacers market scenario contact Data Bridge Market Research for an Analyst Brief, our team will help you create a revenue impact solution to achieve your desired goal.
Asia-Pacific Fat Replacers Market Scope and Market Size
Asia-Pacific fat replacers market is segmented into five notable segments based on type, source, category, form, and application. The growth among segments helps you analyze niche pockets of growth and strategies to approach the market and determine your core application areas and the difference in your target markets.
- On the basis of type, the Asia-Pacific fat replacers market is segmented into carbohydrate-based, protein-based, and fat-based. In 2022, the carbohydrate-based segment is expected to dominate the fat replacers market due to growing demand for carbohydrate based fat replacer to mimic some of the properties of conventional fats.
- On the basis of source, the Asia-Pacific fat replacers market is segmented into plant and animal. In 2022, plant segment is expected to dominate the market due to growing vegan and vegetarian population across the globe.
- On the basis of category, the Asia-Pacific fat replacers market is segmented into clean label and conventional. In 2022, the clean label segment is expected to dominate the fat replacers market due to growing consumption of clean label ingredients.
- On the basis of form, the Asia-Pacific fat replacers market is segmented into liquid and dry. In 2022, dry segment is expected to dominate the fat replacers market as dry form fat replacers are easy to use and maintain as compared to liquid form fat replacers.
- On the basis of application, the Asia-Pacific fat replacers market is segmented into bakery, dairy products, sauces, soups, & dressings, convenience food, processed food, confectionery, processed meat, functional food, and others. In 2022, the bakery segment is expected to dominate the fat replacers market due to increasing demand for healthy snack foods with reduced fat content.
Dry segment in China is expected to grow with the highest growth rate in the forecast period of 2022 to 2029 owing to growing consumption and production of food applications that utilize fat replacers. Dry segment in Japan is growing at a significant rate due to increase in participation of people in weight loss management programs. India is fastest growing country of the Asia-Pacific market and dry segment is dominating in this country owing to rising health consciousness among people.
The country section of the report also provides individual market impacting factors and changes in regulation in the market domestically that impacts the current and future trends of the market. Data points such as new sales, replacement sales, country demographics, regulatory acts and import-export tariffs are some of the major pointers used to forecast the market scenario for individual countries. Also, presence and availability of Asia-Pacific brands and their challenges faced due to large or scarce competition from local and domestic brands, impact of sales channels are considered while providing forecast analysis of the country data.
Growing Strategic Activities by Major Players to Enhance Awareness for Fat Replacers is Boosting the Market Growth
The Asia-Pacific fat replacers market also provides you with detailed market analysis for every country growth in particular market. Additionally, it provides the detail information regarding the market players’ strategy and their geographical presence. The data is available for historic period 2010 to 2019.
Competitive Landscape and Fat Replacers Market Share Analysis
Asia-Pacific fat replacers market competitive landscape provides details by competitor. Details included are company overview, company financials, revenue generated, market potential, investment in research and development, new market initiatives, production sites and facilities, company strengths and weaknesses, product launch, product trials pipelines, product approvals, patents, product width and breadth, application dominance, and technology lifeline curve. The above data points provided are only related to the company’s focus related to fat replacers market.
The major companies which are dealing in the Asia-Pacific fat replacers market are Cargill, Incorporated, ULRICK&SHORT, Ingredion Incorporated, CP Kelco U.S., Inc, BENEO, Wilmar International Ltd, JELU-WERK J. Ehrler GmbH & Co. KG, Grain Processing Corporation, Corbion, Dupont, AVEBE, Ashland, Tate & Lyle, Kerry, among others domestic players. DBMR analysts understand competitive strengths and provide competitive analysis for each competitor separately.
Many contracts and agreements are also initiated by the companies worldwide, which are further accelerating the Asia-Pacific fat replacers market growth.
For instance,
- In October 2021, Tate & Lyle made distribution agreement with IMCD, a global leader in the sales, marketing, and distribution of specialty food ingredients and flavors in Italy. This agreement has helped the company in regional expansion
Collaborations, product launches, business expansions, awards and recognitions, joint ventures, and other strategies by the market players are enhancing the companies’ footprints in the Asia-Pacific fat replacers market.
SKU-
Obtenha acesso online ao relatório sobre a primeira nuvem de inteligência de mercado do mundo

- Painel interativo de análise de dados
- Painel de análise da empresa para oportunidades de elevado potencial de crescimento
- Acesso de analista de pesquisa para personalização e customização. consultas
- Análise da concorrência com painel interativo
- Últimas notícias, atualizações e atualizações Análise de tendências
- Aproveite o poder da análise de benchmark para um rastreio abrangente da concorrência
Índice
1 INTRODUCTION
1.1 OBJECTIVES OF THE STUDY
1.2 MARKET DEFINITION
1.3 OVERVIEW OF ASIA PACIFIC FAT REPLACERS MARKET
1.4 LIMITATIONS
1.5 MARKETS COVERED
2 MARKET SEGMENTATION
2.1 MARKETS COVERED
2.2 GEOGRAPHICAL SCOPE
2.3 YEARS CONSIDERED FOR THE STUDY
2.4 CURRENCY AND PRICING
2.5 DBMR TRIPOD DATA VALIDATION MODEL
2.6 MULTIVARIATE MODELLING
2.7 TYPE LIFELINE CURVE
2.8 PRIMARY INTERVIEWS WITH KEY OPINION LEADERS
2.9 DBMR MARKET POSITION GRID
2.1 VENDOR SHARE ANALYSIS
2.11 SECONDARY SOURCES
2.12 ASSUMPTIONS
3 EXECUTIVE SUMMARY
4 PREMIUM INSIGHTS
4.1 ASIA PACIFIC FAT REPLACERS MARKET: GROWTH STRATEGIES
4.2 ASIA PACIFIC FAT REPLACERS MARKET: INDUSTRIAL INSIGHTS
5 ASIA PACIFIC FAT REPLACERS MARKET: REGULATORY FRAMEWORK
5.1 FDA
5.1.1 LABELLING REGULATIONS
5.1.2 OLESTRA
5.1.3 MALTODEXTRINS
5.1.4 ALLERGEN LABELING
5.2 EU
5.2.1 EU ALLERGEN LABELING
5.2.2 EU NUTRITIONAL VALUE
5.2.3 EU HEALTH CLAIM: ‘CARBOHYDRATES CONTRIBUTE TO THE MAINTENANCE OF NORMAL BRAIN FUNCTION’
5.2.4 EU HEALTH CLAIM: ‘CARBOHYDRATE-ELECTROLYTE SOLUTIONS ENHANCE THE ABSORPTION OF WATER DURING PHYSICAL EXERCISE’
5.2.5 EU HEALTH CLAIM: ‘CARBOHYDRATE-ELECTROLYTE SOLUTIONS CAN CONTRIBUTE TO THE MAINTENANCE OF ENDURANCE PERFORMANCE DURING PROLONGED ENDURANCE EXERCISE’
5.2.6 EU HEALTH CLAIM: ‘GLYCEMIC CARBOHYDRATES CONTRIBUTE TO RECOVERY OF NORMAL MUSCLE FUNCTION (CONTRACTION) AFTER STRENUOUS EXERCISE’
5.2.7 EU INFANT NUTRITION REGULATION
6 MARKET OVERVIEW
6.1 DRIVERS
6.1.1 INCREASE IN AWARENESS AMONG PEOPLE ABOUT EXCESSIVE CONSUMPTION OF FAT
6.1.2 GROWING HEALTH CONSCIOUSNESS AMONG PEOPLE
6.1.3 INCREASE IN PARTICIPATION OF PEOPLE IN WEIGHT LOSS MANAGEMENT PROGRAMS
6.1.4 GROWING GOVERNMENT REGULATIONS ASSOCIATED WITH LIMIT ON DAILY CONSUMPTION OF FAT
6.1.5 GROWING USAGE OF FAT REPLACER IN BAKERY, DAIRY, AND FROZEN PRODUCTS
6.2 RESTRAINTS
6.2.1 UNFAVORABLE TASTE WHEN COMPARED TO FATS
6.2.2 NUTRITION PROBLEMS ASSOCIATED WITH FAT SUBSTITUTES
6.3 OPPORTUNITIES
6.3.1 INCREASE IN CONSUMPTION OF CONVENIENCE FOOD
6.3.2 A LARGE NUMBER OF PEOPLE TURNING TO DAIRY-FREE DIETS
6.3.3 INCREASE IN RESEARCH & DEVELOPMENT OF FAT REPLACER
6.4 CHALLENGES
6.4.1 HIGH PRICES OF FAT REPLACER PRODUCTS
6.4.2 ADVERSE EFFECTS OF FAT REPLACERS
7 IMPACT OF COVID-19 ON THE ASIA PACIFIC FAT REPLACERSS MARKET
7.1 AFTERMATH OF COVID-19 AND GOVERNMENT INITIATIVES TO BOOST THE ASIA PACIFIC FAT REPLACERS MARKET
7.2 STRATEGIC DECISIONS FOR MANUFACTURERS AFTER COVID-19 TO GAIN COMPETITIVE MARKET SHARE
7.3 IMPACT ON PRICE
7.4 IMPACT ON DEMAND
7.5 IMPACT ON SUPPLY CHAIN
7.6 CONCLUSION
8 ASIA PACIFIC FAT REPLACERS MARKET, BY TYPE
8.1 OVERVIEW
8.2 CARBOHYDRATE-BASED
8.2.1 STARCH
8.2.2 CELLULOSE
8.2.3 GUM
8.2.4 GELATIN
8.2.5 OTHERS
8.3 PROTEIN-BASED
8.3.1 WHEY PROTEIN
8.3.2 SOY PROTEIN
8.3.3 MILK PROTEIN
8.3.4 EGG PROTEIN
8.3.5 OTHERS
8.4 FAT-BASED
8.4.1 OLESTRA
8.4.2 SALATRIM
8.4.3 CAPRENIN
8.4.4 OTHERS
9 ASIA PACIFIC FAT REPLACERS MARKET, BY SOURCE
9.1 OVERVIEW
9.2 PLANT
9.3 ANIMAL
10 ASIA PACIFIC FAT REPLACERS MARKET, BY CATEGORY
10.1 OVERVIEW
10.2 CLEAN LABEL
10.3 CONVENTIONAL
11 ASIA PACIFIC FAT REPLACERS MARKET, BY FORM
11.1 OVERVIEW
11.2 DRY
11.3 LIQUID
12 ASIA PACIFIC FAT REPLACERS MARKET, BY APPLICATION
12.1 OVERVIEW
12.2 BAKERY
12.2.1 BAKERY, BY PRODUCT TYPE
12.2.1.1 BREADS & ROLLS
12.2.1.2 CAKES, PASTRIES, & TRUFFLES
12.2.1.3 COOKIES & BISCUIT
12.2.1.4 TART & PIES
12.2.1.5 BROWNIES
12.2.1.6 TORTILLA
12.2.1.7 OTHERS
12.2.2 BAKERY, BY TYPE
12.2.2.1 CARBOHYDRATE-BASED
12.2.2.2 PROTEIN-BASED
12.2.2.3 FAT-BASED
12.3 DAIRY PRODUCTS
12.3.1 DAIRY PRODUCTS, BY PRODUCT TYPE
12.3.1.1 ICE CREAM
12.3.1.2 YOGURT
12.3.1.2.1 FRESH
12.3.1.2.2 FROZEN
12.3.1.3 MILK
12.3.1.3.1 REGULAR PROCESSED MILK
12.3.1.3.2 FLAVORED MILK
12.3.1.4 CHEESE
12.3.1.5 OTHERS
12.3.2 DAIRY PRODUCTS, BY TYPE
12.3.2.1 CARBOHYDRATE-BASED
12.3.2.2 PROTEIN-BASED
12.3.2.3 FAT-BASED
12.4 CONVENIENCE FOOD
12.4.1 CONVENIENCE FOOD, BY PRODUCT TYPE
12.4.1.1 FROZEN FOOD
12.4.1.2 RTE
12.4.1.3 CANNED FOOD
12.4.1.4 NOODLE AND PASTA
12.4.1.5 CEREALS & SNACKS
12.4.1.6 OTHERS
12.4.2 CONVENIENCE FOOD, BY TYPE
12.4.2.1 CARBOHYDRATE-BASED
12.4.2.2 PROTEIN-BASED
12.4.2.3 FAT-BASED
12.5 PROCESSED MEAT
12.5.1 PROCESSED MEAT, BY TYPE
12.5.1.1 CARBOHYDRATE-BASED
12.5.1.2 PROTEIN-BASED
12.5.1.3 FAT-BASED
12.6 CONFECTIONERY
12.6.1 CONFECTIONERY, BY PRODUCT TYPE
12.6.1.1 CHOCOLATE
12.6.1.2 HARD-BOILED SWEETS
12.6.1.3 GUMS & JELLIES
12.6.1.4 CHOCOLATE SYRUPS
12.6.1.5 CARAMELS & TOFFEES
12.6.1.6 MINTS
12.6.1.7 OTHERS
12.6.2 CONFECTIONERY, BY TYPE
12.6.2.1 CARBOHYDRATE-BASED
12.6.2.2 PROTEIN-BASED
12.6.2.3 FAT-BASED
12.7 FUNCTIONAL FOOD
12.7.1 FUNCTIONAL FOOD, BY TYPE
12.7.1.1 CARBOHYDRATE-BASED
12.7.1.2 PROTEIN-BASED
12.7.1.3 FAT-BASED
12.8 SAUCES, SOUPS, & DRESSINGS
12.8.1 SAUCES, SOUPS, & DRESSINGS, BY TYPE
12.8.1.1 CARBOHYDRATE-BASED
12.8.1.2 PROTEIN-BASED
12.8.1.3 FAT-BASED
12.9 BEVERAGES
12.9.1 BEVERAGES, BY TYPE
12.9.1.1 CARBOHYDRATE-BASED
12.9.1.2 PROTEIN-BASED
12.9.1.3 FAT-BASED
12.1 OTHERS
12.10.1 OTHERS, BY TYPE
12.10.1.1 CARBOHYDRATE-BASED
12.10.1.2 PROTEIN-BASED
12.10.1.3 FAT-BASED
13 ASIA PACIFIC FAT REPLACERS MARKET, BY REGION
13.1 ASIA-PACIFIC
13.1.1 CHINA
13.1.2 INDIA
13.1.3 JAPAN
13.1.4 AUSTRALIA
13.1.5 INDONESIA
13.1.6 SINGAPORE
13.1.7 SOUTH KOREA
13.1.8 MALAYSIA
13.1.9 THAILAND
13.1.10 PHILIPPINES
13.1.11 REST OF ASIA-PACIFIC
14 ASIA PACIFIC FAT REPLACERS MARKET: COMPANY LANDSCAPE
14.1 COMPANY SHARE ANALYSIS: ASIA PACIFIC
15 SWOT ANALYSIS
16 COMPANY PROFILE
16.1 CARGILL, INCORPORATED
16.1.1 COMPANY SNAPSHOT
16.1.2 REVENUE ANALYSIS
16.1.3 COMPANY SHARE ANALYSIS
16.1.4 PRODUCT PORTFOLIO
16.1.5 RECENT DEVELOPMENTS
16.2 WILMAR INTERNATIONAL LTD
16.2.1 COMPANY SNAPSHOT
16.2.2 REVENUS ANALYSIS
16.2.3 COMPANY SHARE ANALYSIS
16.2.4 PRODUCT PORTFOLIO
16.2.5 RECENT DEVELOPMENT
16.3 DUPONT
16.3.1 COMPANY SNAPSHOT
16.3.2 REVENUE ANALYSIS
16.3.3 COMPANY SHARE ANALYSIS
16.3.4 PRODUCT PORTFOLIO
16.3.5 RECENT DEVELOPMENT
16.4 INGREDION INCORPORATED
16.4.1 COMPANY SNAPSHOT
16.4.2 REVENUE ANALYSIS
16.4.3 COMPANY SHARE ANALYSIS
16.4.4 PRODUCT PORTFOLIO
16.4.5 RECENT DEVELOPMENT
16.5 ASHLAND
16.5.1 COMPANY SNAPSHOT
16.5.2 REVENUE ANALYSIS
16.5.3 COMPANY SHARE ANALYSIS
16.5.4 PRODUCT PORTFOLIO
16.5.5 RECENT DEVELOPMENT
16.6 CORBION
16.6.1 COMPANY SNAPSHOT
16.6.2 REVENUE ANALYSIS
16.6.3 PRODUCT PORTFOLIO
16.6.4 RECENT DEVELOPMENTS
16.7 KERRY
16.7.1 COMPANY SNAPSHOT
16.7.2 REVENUE ANALYSIS
16.7.3 PRODUCT PORTFOLIO
16.7.4 RECENT DEVELOPMENTS
16.8 CP KELCO U.S., INC.
16.8.1 COMPANY SNAPSHOT
16.8.2 PRODUCT PORTFOLIO
16.8.3 RECENT DEVELOPMENTS
16.9 AVEBE
16.9.1 COMPANY SNAPSHOT
16.9.2 PRODUCT PORTFOLIO
16.9.3 RECENT DEVELOPMENT
16.1 TATE & LYLE
16.10.1 COMPANY SNAPSHOT
16.10.2 REVENUE ANALYSIS
16.10.3 PRODUCT PORTFOLIO
16.10.4 RECENT DEVELOPMENTS
16.11 BENEO
16.11.1 COMPANY SNAPSHOT
16.11.2 PRODUCT PORTFOLIO
16.11.3 RECENT DEVELOPMENT
16.12 EPOGEE
16.12.1 COMPANY SNAPSHOT
16.12.2 PRODUCT PORTFOLIO
16.12.3 RECENT DEVELOPMENTS
16.13 GRAIN PROCESSING CORPORATION
16.13.1 COMPANY SNAPSHOT
16.13.2 PRODUCT PORTFOLIO
16.13.3 RECENT DEVELOPMENT
16.14 JELU-WERK J. EHRLER GMBH & CO. KG
16.14.1 COMPANY SNAPSHOT
16.14.2 PRODUCT PORTFOLIO
16.14.3 RECENT DEVELOPMENTS
16.15 ULRICK&SHORT
16.15.1 COMPANY SNAPSHOT
16.15.2 PRODUCT PORTFOLIO
16.15.3 RECENT DEVELOPMENTS
17 QUESTIONNAIRE
18 RELATED REPORTS
Lista de Tabela
TABLE 1 ASIA PACIFIC FAT REPLACERS MARKET, BY TYPE, 2020-2029 (USD MILLION)
TABLE 2 ASIA PACIFIC CARBOHYDRATE-BASED IN FAT REPLACERS MARKET, BY REGION, 2020-2029 (USD MILLION)
TABLE 3 ASIA PACIFIC CARBOHYDRATE-BASED IN FAT REPLACERS MARKET, BY TYPE, 2020-2029 (USD MILLION)
TABLE 4 ASIA PACIFIC PROTEIN-BASED IN FAT REPLACERS MARKET, BY REGION, 2020-2029 (USD MILLION)
TABLE 5 ASIA PACIFIC PROTEIN-BASED IN FAT REPLACERS MARKET, BY TYPE, 2020-2029 (USD MILLION)
TABLE 6 ASIA PACIFIC FAT-BASED IN FAT REPLACERS MARKET, BY REGION, 2020-2029 (USD MILLION)
TABLE 7 ASIA PACIFIC FAT-BASED IN FAT REPLACERS MARKET, BY TYPE, 2020-2029 (USD MILLION)
TABLE 8 ASIA PACIFIC FAT REPLACERS MARKET, BY SOURCE, 2020-2029 (USD MILLION)
TABLE 9 ASIA PACIFIC PLANT IN FAT REPLACERS MARKET, BY REGION, 2020-2029 (USD MILLION)
TABLE 10 ASIA PACIFIC ANIMAL IN FAT REPLACERS MARKET, BY REGION, 2020-2029 (USD MILLION)
TABLE 11 ASIA PACIFIC FAT REPLACERS MARKET, BY CATEGORY, 2020-2029 (USD MILLION)
TABLE 12 ASIA PACIFIC CLEAN LABEL IN FAT REPLACERS MARKET, BY REGION, 2020-2029 (USD MILLION)
TABLE 13 ASIA PACIFIC CONVENTIONAL IN FAT REPLACERS MARKET, BY REGION, 2020-2029 (USD MILLION)
TABLE 14 ASIA PACIFIC FAT REPLACERS MARKET, BY FORM, 2020-2029 (USD MILLION)
TABLE 15 ASIA PACIFIC DRY IN FAT REPLACERS MARKET, BY REGION, 2020-2029 (USD MILLION)
TABLE 16 ASIA PACIFIC LIQUID IN FAT REPLACERS MARKET, BY REGION, 2020-2029 (USD MILLION)
TABLE 17 ASIA PACIFIC FAT REPLACERS MARKET, BY APPLICATION, 2020-2029 (USD MILLION)
TABLE 18 ASIA PACIFIC BAKERY IN FAT REPLACERS MARKET, BY REGION, 2020-2029 (USD MILLION)
TABLE 19 ASIA PACIFIC BAKERY IN FAT REPLACERS MARKET, BY PRODUCT TYPE, 2020-2029 (USD MILLION)
TABLE 20 ASIA PACIFIC BAKERY IN FAT REPLACERS MARKET, BY TYPE, 2020-2029 (USD MILLION)
TABLE 21 ASIA PACIFIC DAIRY PRODUCTS IN FAT REPLACERS MARKET, BY REGION, 2020-2029 (USD MILLION)
TABLE 22 ASIA PACIFIC DAIRY PRODUCTS IN FAT REPLACERS MARKET, BY PRODUCT TYPE, 2020-2029 (USD MILLION)
TABLE 23 ASIA PACIFIC YOGURT IN FAT REPLACERS MARKET, BY PRODUCT TYPE, 2020-2029 (USD MILLION)
TABLE 24 ASIA PACIFIC MILK IN FAT REPLACERS MARKET, BY PRODUCT TYPE, 2020-2029 (USD MILLION)
TABLE 25 ASIA PACIFIC DAIRY PRODUCT IN FAT REPLACERS MARKET, BY TYPE, 2020-2029 (USD MILLION)
TABLE 26 ASIA PACIFIC CONVENIENCE FOOD IN FAT REPLACERS MARKET, BY REGION, 2020-2029 (USD MILLION)
TABLE 27 ASIA PACIFIC CONVENIENCE FOOD IN FAT REPLACERS MARKET, BY PRODUCT TYPE, 2020-2029 (USD MILLION)
TABLE 28 ASIA PACIFIC CONVENIENCE FOOD IN FAT REPLACERS MARKET, BY TYPE, 2020-2029 (USD MILLION)
TABLE 29 ASIA PACIFIC PROCESSED MEAT IN FAT REPLACERS MARKET, BY REGION, 2020-2029 (USD MILLION)
TABLE 30 ASIA PACIFIC PROCESSED MEAT IN FAT REPLACERS MARKET, BY TYPE, 2020-2029 (USD MILLION)
TABLE 31 ASIA PACIFIC CONFECTIONARY IN FAT REPLACERS MARKET, BY REGION, 2020-2029 (USD MILLION)
TABLE 32 ASIA PACIFIC CONFECTIONERY IN FAT REPLACERS MARKET, BY PRODUCT TYPE, 2020-2029 (USD MILLION)
TABLE 33 ASIA PACIFIC CONFECTIONERY IN FAT REPLACERS MARKET, BY TYPE, 2020-2029 (USD MILLION)
TABLE 34 ASIA PACIFIC FUNCTIONAL FOOD IN FAT REPLACERS MARKET, BY REGION, 2020-2029 (USD MILLION)
TABLE 35 ASIA PACIFIC FUNCTIONAL FOOD IN FAT REPLACERS MARKET, BY TYPE, 2020-2029 (USD MILLION)
TABLE 36 ASIA PACIFIC SAUCES, SOUPS, & DRESSINGS IN FAT REPLACERS MARKET, BY REGION, 2020-2029 (USD MILLION)
TABLE 37 ASIA PACIFIC SAUCES, SOUPS, & DRESSINGS IN FAT REPLACERS MARKET, BY TYPE, 2020-2029 (USD MILLION)
TABLE 38 ASIA PACIFIC BEVERAGES IN FAT REPLACERS MARKET, BY REGION, 2020-2029 (USD MILLION)
TABLE 39 ASIA PACIFIC BEVERAGES IN FAT REPLACERS MARKET, BY TYPE, 2020-2029 (USD MILLION)
TABLE 40 ASIA PACIFIC OTHERS IN FAT REPLACERS MARKET, BY REGION, 2020-2029 (USD MILLION)
TABLE 41 ASIA PACIFIC OTHERS IN FAT REPLACERS MARKET, BY TYPE, 2020-2029 (USD MILLION)
TABLE 42 ASIA-PACIFIC FAT REPLACERS MARKET, BY COUNTRY, 2020-2029 (USD MILLION)
TABLE 43 ASIA-PACIFIC FAT REPLACERS MARKET, BY TYPE, 2020-2029 (USD MILLION)
TABLE 44 ASIA-PACIFIC CARBOHYDRATE-BASED IN FAT REPLACERS MARKET, BY TYPE, 2020-2029 (USD MILLION)
TABLE 45 ASIA-PACIFIC PROTEIN-BASED IN FAT REPLACERS MARKET, BY TYPE, 2020-2029 (USD MILLION)
TABLE 46 ASIA-PACIFIC FAT-BASED IN FAT REPLACERS MARKET, BY TYPE, 2020-2029 (USD MILLION)
TABLE 47 ASIA-PACIFIC FAT REPLACERS MARKET, BY SOURCE, 2020-2029 (USD MILLION)
TABLE 48 ASIA-PACIFIC FAT REPLACERS MARKET, BY CATEGORY, 2020-2029 (USD MILLION)
TABLE 49 ASIA-PACIFIC FAT REPLACERS MARKET, BY FORM, 2020-2029 (USD MILLION)
TABLE 50 ASIA-PACIFIC FAT REPLACERS MARKET, BY APPLICATION, 2020-2029 (USD MILLION)
TABLE 51 ASIA-PACIFIC BAKERY IN FAT REPLACERS MARKET, BY PRODUCT TYPE, 2020-2029 (USD MILLION)
TABLE 52 ASIA-PACIFIC BAKERY IN FAT REPLACERS MARKET, BY TYPE, 2020-2029 (USD MILLION)
TABLE 53 ASIA-PACIFIC DIARY PRODUCTS IN FAT REPLACERS MARKET, BY PRODUCT TYPE, 2020-2029 (USD MILLION)
TABLE 54 ASIA-PACIFIC YOGURT IN FAT REPLACERS MARKET, BY PRODUCT TYPE, 2020-2029 (USD MILLION)
TABLE 55 ASIA-PACIFIC MILK IN FAT REPLACERS MARKET, BY PRODUCT TYPE, 2020-2029 (USD MILLION)
TABLE 56 ASIA-PACIFIC DAIRY PRODUCTS IN FAT REPLACERS MARKET, BY TYPE, 2020-2029 (USD MILLION)
TABLE 57 ASIA-PACIFIC CONVENIENCE FOOD IN FAT REPLACERS MARKET, BY PRODUCT TYPE, 2020-2029 (USD MILLION)
TABLE 58 ASIA-PACIFIC CONVENIENCE FOOD IN FAT REPLACERS MARKET, BY TYPE, 2020-2029 (USD MILLION)
TABLE 59 ASIA-PACIFIC PROCESSED MEAT IN FAT REPLACERS MARKET, BY TYPE, 2020-2029 (USD MILLION)
TABLE 60 ASIA-PACIFIC CONFECTIONERY IN FAT REPLACERS MARKET, BY PRODUCT TYPE, 2020-2029 (USD MILLION)
TABLE 61 ASIA-PACIFIC CONFECTIONERY IN FAT REPLACERS MARKET, BY TYPE, 2020-2029 (USD MILLION)
TABLE 62 ASIA-PACIFIC FUNCTIONAL FOOD IN FAT REPLACERS MARKET, BY TYPE, 2020-2029 (USD MILLION)
TABLE 63 ASIA-PACIFIC SAUCES, SOUPS, & DRESSINGS IN FAT REPLACERS MARKET, BY TYPE, 2020-2029 (USD MILLION)
TABLE 64 ASIA-PACIFIC BEVERAGES IN FAT REPLACERS MARKET, BY TYPE, 2020-2029 (USD MILLION)
TABLE 65 ASIA-PACIFIC OTHERS IN FAT REPLACERS MARKET, BY TYPE, 2020-2029 (USD MILLION)
TABLE 66 CHINA FAT REPLACERS MARKET, BY TYPE, 2020-2029 (USD MILLION)
TABLE 67 CHINA CARBOHYDRATE-BASED IN FAT REPLACERS MARKET, BY TYPE, 2020-2029 (USD MILLION)
TABLE 68 CHINA PROTEIN-BASED IN FAT REPLACERS MARKET, BY TYPE, 2020-2029 (USD MILLION)
TABLE 69 CHINA FAT-BASED IN FAT REPLACERS MARKET, BY TYPE, 2020-2029 (USD MILLION)
TABLE 70 CHINA FAT REPLACERS MARKET, BY SOURCE, 2020-2029 (USD MILLION)
TABLE 71 CHINA FAT REPLACERS MARKET, BY CATEGORY, 2020-2029 (USD MILLION)
TABLE 72 CHINA FAT REPLACERS MARKET, BY FORM, 2020-2029 (USD MILLION)
TABLE 73 CHINA FAT REPLACERS MARKET, BY APPLICATION, 2020-2029 (USD MILLION)
TABLE 74 CHINA BAKERY IN FAT REPLACERS MARKET, BY PRODUCT TYPE, 2020-2029 (USD MILLION)
TABLE 75 CHINA BAKERY IN FAT REPLACERS MARKET, BY TYPE, 2020-2029 (USD MILLION)
TABLE 76 CHINA DIARY PRODUCTS IN FAT REPLACERS MARKET, BY PRODUCT TYPE, 2020-2029 (USD MILLION)
TABLE 77 CHINA YOGURT IN FAT REPLACERS MARKET, BY PRODUCT TYPE, 2020-2029 (USD MILLION)
TABLE 78 CHINA MILK IN FAT REPLACERS MARKET, BY PRODUCT TYPE, 2020-2029 (USD MILLION)
TABLE 79 CHINA DAIRY PRODUCTS IN FAT REPLACERS MARKET, BY TYPE, 2020-2029 (USD MILLION)
TABLE 80 CHINA CONVENIENCE FOOD IN FAT REPLACERS MARKET, BY PRODUCT TYPE, 2020-2029 (USD MILLION)
TABLE 81 CHINA CONVENIENCE FOOD IN FAT REPLACERS MARKET, BY TYPE, 2020-2029 (USD MILLION)
TABLE 82 CHINA PROCESSED MEAT IN FAT REPLACERS MARKET, BY TYPE, 2020-2029 (USD MILLION)
TABLE 83 CHINA CONFECTIONERY IN FAT REPLACERS MARKET, BY PRODUCT TYPE, 2020-2029 (USD MILLION)
TABLE 84 CHINA CONFECTIONERY IN FAT REPLACERS MARKET, BY TYPE, 2020-2029 (USD MILLION)
TABLE 85 CHINA FUNCTIONAL FOOD IN FAT REPLACERS MARKET, BY TYPE, 2020-2029 (USD MILLION)
TABLE 86 CHINA SAUCES, SOUPS, & DRESSINGS IN FAT REPLACERS MARKET, BY TYPE, 2020-2029 (USD MILLION)
TABLE 87 CHINA BEVERAGES IN FAT REPLACERS MARKET, BY TYPE, 2020-2029 (USD MILLION)
TABLE 88 CHINA OTHERS IN FAT REPLACERS MARKET, BY TYPE, 2020-2029 (USD MILLION)
TABLE 89 INDIA FAT REPLACERS MARKET, BY TYPE, 2020-2029 (USD MILLION)
TABLE 90 INDIA CARBOHYDRATE-BASED IN FAT REPLACERS MARKET, BY TYPE, 2020-2029 (USD MILLION)
TABLE 91 INDIA PROTEIN-BASED IN FAT REPLACERS MARKET, BY TYPE, 2020-2029 (USD MILLION)
TABLE 92 INDIA FAT-BASED IN FAT REPLACERS MARKET, BY TYPE, 2020-2029 (USD MILLION)
TABLE 93 INDIA FAT REPLACERS MARKET, BY SOURCE, 2020-2029 (USD MILLION)
TABLE 94 INDIA FAT REPLACERS MARKET, BY CATEGORY, 2020-2029 (USD MILLION)
TABLE 95 INDIA FAT REPLACERS MARKET, BY FORM, 2020-2029 (USD MILLION)
TABLE 96 INDIA FAT REPLACERS MARKET, BY APPLICATION, 2020-2029 (USD MILLION)
TABLE 97 INDIA BAKERY IN FAT REPLACERS MARKET, BY PRODUCT TYPE, 2020-2029 (USD MILLION)
TABLE 98 INDIA BAKERY IN FAT REPLACERS MARKET, BY TYPE, 2020-2029 (USD MILLION)
TABLE 99 INDIA DIARY PRODUCTS IN FAT REPLACERS MARKET, BY PRODUCT TYPE, 2020-2029 (USD MILLION)
TABLE 100 INDIA YOGURT IN FAT REPLACERS MARKET, BY PRODUCT TYPE, 2020-2029 (USD MILLION)
TABLE 101 INDIA MILK IN FAT REPLACERS MARKET, BY PRODUCT TYPE, 2020-2029 (USD MILLION)
TABLE 102 INDIA DAIRY PRODUCTS IN FAT REPLACERS MARKET, BY TYPE, 2020-2029 (USD MILLION)
TABLE 103 INDIA CONVENIENCE FOOD IN FAT REPLACERS MARKET, BY PRODUCT TYPE, 2020-2029 (USD MILLION)
TABLE 104 INDIA CONVENIENCE FOOD IN FAT REPLACERS MARKET, BY TYPE, 2020-2029 (USD MILLION)
TABLE 105 INDIA PROCESSED MEAT IN FAT REPLACERS MARKET, BY TYPE, 2020-2029 (USD MILLION)
TABLE 106 INDIA CONFECTIONERY IN FAT REPLACERS MARKET, BY PRODUCT TYPE, 2020-2029 (USD MILLION)
TABLE 107 INDIA CONFECTIONERY IN FAT REPLACERS MARKET, BY TYPE, 2020-2029 (USD MILLION)
TABLE 108 INDIA FUNCTIONAL FOOD IN FAT REPLACERS MARKET, BY TYPE, 2020-2029 (USD MILLION)
TABLE 109 INDIA SAUCES, SOUPS, & DRESSINGS IN FAT REPLACERS MARKET, BY TYPE, 2020-2029 (USD MILLION)
TABLE 110 INDIA BEVERAGES IN FAT REPLACERS MARKET, BY TYPE, 2020-2029 (USD MILLION)
TABLE 111 INDIA OTHERS IN FAT REPLACERS MARKET, BY TYPE, 2020-2029 (USD MILLION)
TABLE 112 JAPAN FAT REPLACERS MARKET, BY TYPE, 2020-2029 (USD MILLION)
TABLE 113 JAPAN CARBOHYDRATE-BASED IN FAT REPLACERS MARKET, BY TYPE, 2020-2029 (USD MILLION)
TABLE 114 JAPAN PROTEIN-BASED IN FAT REPLACERS MARKET, BY TYPE, 2020-2029 (USD MILLION)
TABLE 115 JAPAN FAT-BASED IN FAT REPLACERS MARKET, BY TYPE, 2020-2029 (USD MILLION)
TABLE 116 JAPAN FAT REPLACERS MARKET, BY SOURCE, 2020-2029 (USD MILLION)
TABLE 117 JAPAN FAT REPLACERS MARKET, BY CATEGORY, 2020-2029 (USD MILLION)
TABLE 118 JAPAN FAT REPLACERS MARKET, BY FORM, 2020-2029 (USD MILLION)
TABLE 119 JAPAN FAT REPLACERS MARKET, BY APPLICATION, 2020-2029 (USD MILLION)
TABLE 120 JAPAN BAKERY IN FAT REPLACERS MARKET, BY PRODUCT TYPE, 2020-2029 (USD MILLION)
TABLE 121 JAPAN BAKERY IN FAT REPLACERS MARKET, BY TYPE, 2020-2029 (USD MILLION)
TABLE 122 JAPAN DIARY PRODUCTS IN FAT REPLACERS MARKET, BY PRODUCT TYPE, 2020-2029 (USD MILLION)
TABLE 123 JAPAN YOGURT IN FAT REPLACERS MARKET, BY PRODUCT TYPE, 2020-2029 (USD MILLION)
TABLE 124 JAPAN MILK IN FAT REPLACERS MARKET, BY PRODUCT TYPE, 2020-2029 (USD MILLION)
TABLE 125 JAPAN DAIRY PRODUCTS IN FAT REPLACERS MARKET, BY TYPE, 2020-2029 (USD MILLION)
TABLE 126 JAPAN CONVENIENCE FOOD IN FAT REPLACERS MARKET, BY PRODUCT TYPE, 2020-2029 (USD MILLION)
TABLE 127 JAPAN CONVENIENCE FOOD IN FAT REPLACERS MARKET, BY TYPE, 2020-2029 (USD MILLION)
TABLE 128 JAPAN PROCESSED MEAT IN FAT REPLACERS MARKET, BY TYPE, 2020-2029 (USD MILLION)
TABLE 129 JAPAN CONFECTIONERY IN FAT REPLACERS MARKET, BY PRODUCT TYPE, 2020-2029 (USD MILLION)
TABLE 130 JAPAN CONFECTIONERY IN FAT REPLACERS MARKET, BY TYPE, 2020-2029 (USD MILLION)
TABLE 131 JAPAN FUNCTIONAL FOOD IN FAT REPLACERS MARKET, BY TYPE, 2020-2029 (USD MILLION)
TABLE 132 JAPAN SAUCES, SOUPS, & DRESSINGS IN FAT REPLACERS MARKET, BY TYPE, 2020-2029 (USD MILLION)
TABLE 133 JAPAN BEVERAGES IN FAT REPLACERS MARKET, BY TYPE, 2020-2029 (USD MILLION)
TABLE 134 JAPAN OTHERS IN FAT REPLACERS MARKET, BY TYPE, 2020-2029 (USD MILLION)
TABLE 135 AUSTRALIA FAT REPLACERS MARKET, BY TYPE, 2020-2029 (USD MILLION)
TABLE 136 AUSTRALIA CARBOHYDRATE-BASED IN FAT REPLACERS MARKET, BY TYPE, 2020-2029 (USD MILLION)
TABLE 137 AUSTRALIA PROTEIN-BASED IN FAT REPLACERS MARKET, BY TYPE, 2020-2029 (USD MILLION)
TABLE 138 AUSTRALIA FAT-BASED IN FAT REPLACERS MARKET, BY TYPE, 2020-2029 (USD MILLION)
TABLE 139 AUSTRALIA FAT REPLACERS MARKET, BY SOURCE, 2020-2029 (USD MILLION)
TABLE 140 AUSTRALIA FAT REPLACERS MARKET, BY CATEGORY, 2020-2029 (USD MILLION)
TABLE 141 AUSTRALIA FAT REPLACERS MARKET, BY FORM, 2020-2029 (USD MILLION)
TABLE 142 AUSTRALIA FAT REPLACERS MARKET, BY APPLICATION, 2020-2029 (USD MILLION)
TABLE 143 AUSTRALIA BAKERY IN FAT REPLACERS MARKET, BY PRODUCT TYPE, 2020-2029 (USD MILLION)
TABLE 144 AUSTRALIA BAKERY IN FAT REPLACERS MARKET, BY TYPE, 2020-2029 (USD MILLION)
TABLE 145 AUSTRALIA DIARY PRODUCTS IN FAT REPLACERS MARKET, BY PRODUCT TYPE, 2020-2029 (USD MILLION)
TABLE 146 AUSTRALIA YOGURT IN FAT REPLACERS MARKET, BY PRODUCT TYPE, 2020-2029 (USD MILLION)
TABLE 147 AUSTRALIA MILK IN FAT REPLACERS MARKET, BY PRODUCT TYPE, 2020-2029 (USD MILLION)
TABLE 148 AUSTRALIA DAIRY PRODUCTS IN FAT REPLACERS MARKET, BY TYPE, 2020-2029 (USD MILLION)
TABLE 149 AUSTRALIA CONVENIENCE FOOD IN FAT REPLACERS MARKET, BY PRODUCT TYPE, 2020-2029 (USD MILLION)
TABLE 150 AUSTRALIA CONVENIENCE FOOD IN FAT REPLACERS MARKET, BY TYPE, 2020-2029 (USD MILLION)
TABLE 151 AUSTRALIA PROCESSED MEAT IN FAT REPLACERS MARKET, BY TYPE, 2020-2029 (USD MILLION)
TABLE 152 AUSTRALIA CONFECTIONERY IN FAT REPLACERS MARKET, BY PRODUCT TYPE, 2020-2029 (USD MILLION)
TABLE 153 AUSTRALIA CONFECTIONERY IN FAT REPLACERS MARKET, BY TYPE, 2020-2029 (USD MILLION)
TABLE 154 AUSTRALIA FUNCTIONAL FOOD IN FAT REPLACERS MARKET, BY TYPE, 2020-2029 (USD MILLION)
TABLE 155 AUSTRALIA SAUCES, SOUPS, & DRESSINGS IN FAT REPLACERS MARKET, BY TYPE, 2020-2029 (USD MILLION)
TABLE 156 AUSTRALIA BEVERAGES IN FAT REPLACERS MARKET, BY TYPE, 2020-2029 (USD MILLION)
TABLE 157 AUSTRALIA OTHERS IN FAT REPLACERS MARKET, BY TYPE, 2020-2029 (USD MILLION)
TABLE 158 INDONESIA FAT REPLACERS MARKET, BY TYPE, 2020-2029 (USD MILLION)
TABLE 159 INDONESIA CARBOHYDRATE-BASED IN FAT REPLACERS MARKET, BY TYPE, 2020-2029 (USD MILLION)
TABLE 160 INDONESIA PROTEIN-BASED IN FAT REPLACERS MARKET, BY TYPE, 2020-2029 (USD MILLION)
TABLE 161 INDONESIA FAT-BASED IN FAT REPLACERS MARKET, BY TYPE, 2020-2029 (USD MILLION)
TABLE 162 INDONESIA FAT REPLACERS MARKET, BY SOURCE, 2020-2029 (USD MILLION)
TABLE 163 INDONESIA FAT REPLACERS MARKET, BY CATEGORY, 2020-2029 (USD MILLION)
TABLE 164 INDONESIA FAT REPLACERS MARKET, BY FORM, 2020-2029 (USD MILLION)
TABLE 165 INDONESIA FAT REPLACERS MARKET, BY APPLICATION, 2020-2029 (USD MILLION)
TABLE 166 INDONESIA BAKERY IN FAT REPLACERS MARKET, BY PRODUCT TYPE, 2020-2029 (USD MILLION)
TABLE 167 INDONESIA BAKERY IN FAT REPLACERS MARKET, BY TYPE, 2020-2029 (USD MILLION)
TABLE 168 INDONESIA DIARY PRODUCTS IN FAT REPLACERS MARKET, BY PRODUCT TYPE, 2020-2029 (USD MILLION)
TABLE 169 INDONESIA YOGURT IN FAT REPLACERS MARKET, BY PRODUCT TYPE, 2020-2029 (USD MILLION)
TABLE 170 INDONESIA MILK IN FAT REPLACERS MARKET, BY PRODUCT TYPE, 2020-2029 (USD MILLION)
TABLE 171 INDONESIA DAIRY PRODUCTS IN FAT REPLACERS MARKET, BY TYPE, 2020-2029 (USD MILLION)
TABLE 172 INDONESIA CONVENIENCE FOOD IN FAT REPLACERS MARKET, BY PRODUCT TYPE, 2020-2029 (USD MILLION)
TABLE 173 INDONESIA CONVENIENCE FOOD IN FAT REPLACERS MARKET, BY TYPE, 2020-2029 (USD MILLION)
TABLE 174 INDONESIA PROCESSED MEAT IN FAT REPLACERS MARKET, BY TYPE, 2020-2029 (USD MILLION)
TABLE 175 INDONESIA CONFECTIONERY IN FAT REPLACERS MARKET, BY PRODUCT TYPE, 2020-2029 (USD MILLION)
TABLE 176 INDONESIA CONFECTIONERY IN FAT REPLACERS MARKET, BY TYPE, 2020-2029 (USD MILLION)
TABLE 177 INDONESIA FUNCTIONAL FOOD IN FAT REPLACERS MARKET, BY TYPE, 2020-2029 (USD MILLION)
TABLE 178 INDONESIA SAUCES, SOUPS, & DRESSINGS IN FAT REPLACERS MARKET, BY TYPE, 2020-2029 (USD MILLION)
TABLE 179 INDONESIA BEVERAGES IN FAT REPLACERS MARKET, BY TYPE, 2020-2029 (USD MILLION)
TABLE 180 INDONESIA OTHERS IN FAT REPLACERS MARKET, BY TYPE, 2020-2029 (USD MILLION)
TABLE 181 SINGAPORE FAT REPLACERS MARKET, BY TYPE, 2020-2029 (USD MILLION)
TABLE 182 SINGAPORE CARBOHYDRATE-BASED IN FAT REPLACERS MARKET, BY TYPE, 2020-2029 (USD MILLION)
TABLE 183 SINGAPORE PROTEIN-BASED IN FAT REPLACERS MARKET, BY TYPE, 2020-2029 (USD MILLION)
TABLE 184 SINGAPORE FAT-BASED IN FAT REPLACERS MARKET, BY TYPE, 2020-2029 (USD MILLION)
TABLE 185 SINGAPORE FAT REPLACERS MARKET, BY SOURCE, 2020-2029 (USD MILLION)
TABLE 186 SINGAPORE FAT REPLACERS MARKET, BY CATEGORY, 2020-2029 (USD MILLION)
TABLE 187 SINGAPORE FAT REPLACERS MARKET, BY FORM, 2020-2029 (USD MILLION)
TABLE 188 SINGAPORE FAT REPLACERS MARKET, BY APPLICATION, 2020-2029 (USD MILLION)
TABLE 189 SINGAPORE BAKERY IN FAT REPLACERS MARKET, BY PRODUCT TYPE, 2020-2029 (USD MILLION)
TABLE 190 SINGAPORE BAKERY IN FAT REPLACERS MARKET, BY TYPE, 2020-2029 (USD MILLION)
TABLE 191 SINGAPORE DIARY PRODUCTS IN FAT REPLACERS MARKET, BY PRODUCT TYPE, 2020-2029 (USD MILLION)
TABLE 192 SINGAPORE YOGURT IN FAT REPLACERS MARKET, BY PRODUCT TYPE, 2020-2029 (USD MILLION)
TABLE 193 SINGAPORE MILK IN FAT REPLACERS MARKET, BY PRODUCT TYPE, 2020-2029 (USD MILLION)
TABLE 194 SINGAPORE DAIRY PRODUCTS IN FAT REPLACERS MARKET, BY TYPE, 2020-2029 (USD MILLION)
TABLE 195 SINGAPORE CONVENIENCE FOOD IN FAT REPLACERS MARKET, BY PRODUCT TYPE, 2020-2029 (USD MILLION)
TABLE 196 SINGAPORE CONVENIENCE FOOD IN FAT REPLACERS MARKET, BY TYPE, 2020-2029 (USD MILLION)
TABLE 197 SINGAPORE PROCESSED MEAT IN FAT REPLACERS MARKET, BY TYPE, 2020-2029 (USD MILLION)
TABLE 198 SINGAPORE CONFECTIONERY IN FAT REPLACERS MARKET, BY PRODUCT TYPE, 2020-2029 (USD MILLION)
TABLE 199 SINGAPORE CONFECTIONERY IN FAT REPLACERS MARKET, BY TYPE, 2020-2029 (USD MILLION)
TABLE 200 SINGAPORE FUNCTIONAL FOOD IN FAT REPLACERS MARKET, BY TYPE, 2020-2029 (USD MILLION)
TABLE 201 SINGAPORE SAUCES, SOUPS, & DRESSINGS IN FAT REPLACERS MARKET, BY TYPE, 2020-2029 (USD MILLION)
TABLE 202 SINGAPORE BEVERAGES IN FAT REPLACERS MARKET, BY TYPE, 2020-2029 (USD MILLION)
TABLE 203 SINGAPORE OTHERS IN FAT REPLACERS MARKET, BY TYPE, 2020-2029 (USD MILLION)
TABLE 204 SOUTH KOREA FAT REPLACERS MARKET, BY TYPE, 2020-2029 (USD MILLION)
TABLE 205 SOUTH KOREA CARBOHYDRATE-BASED IN FAT REPLACERS MARKET, BY TYPE, 2020-2029 (USD MILLION)
TABLE 206 SOUTH KOREA PROTEIN-BASED IN FAT REPLACERS MARKET, BY TYPE, 2020-2029 (USD MILLION)
TABLE 207 SOUTH KOREA FAT-BASED IN FAT REPLACERS MARKET, BY TYPE, 2020-2029 (USD MILLION)
TABLE 208 SOUTH KOREA FAT REPLACERS MARKET, BY SOURCE, 2020-2029 (USD MILLION)
TABLE 209 SOUTH KOREA FAT REPLACERS MARKET, BY CATEGORY, 2020-2029 (USD MILLION)
TABLE 210 SOUTH KOREA FAT REPLACERS MARKET, BY FORM, 2020-2029 (USD MILLION)
TABLE 211 SOUTH KOREA FAT REPLACERS MARKET, BY APPLICATION, 2020-2029 (USD MILLION)
TABLE 212 SOUTH KOREA BAKERY IN FAT REPLACERS MARKET, BY PRODUCT TYPE, 2020-2029 (USD MILLION)
TABLE 213 SOUTH KOREA BAKERY IN FAT REPLACERS MARKET, BY TYPE, 2020-2029 (USD MILLION)
TABLE 214 SOUTH KOREA DIARY PRODUCTS IN FAT REPLACERS MARKET, BY PRODUCT TYPE, 2020-2029 (USD MILLION)
TABLE 215 SOUTH KOREA YOGURT IN FAT REPLACERS MARKET, BY PRODUCT TYPE, 2020-2029 (USD MILLION)
TABLE 216 SOUTH KOREA MILK IN FAT REPLACERS MARKET, BY PRODUCT TYPE, 2020-2029 (USD MILLION)
TABLE 217 SOUTH KOREA DAIRY PRODUCTS IN FAT REPLACERS MARKET, BY TYPE, 2020-2029 (USD MILLION)
TABLE 218 SOUTH KOREA CONVENIENCE FOOD IN FAT REPLACERS MARKET, BY PRODUCT TYPE, 2020-2029 (USD MILLION)
TABLE 219 SOUTH KOREA CONVENIENCE FOOD IN FAT REPLACERS MARKET, BY TYPE, 2020-2029 (USD MILLION)
TABLE 220 SOUTH KOREA PROCESSED MEAT IN FAT REPLACERS MARKET, BY TYPE, 2020-2029 (USD MILLION)
TABLE 221 SOUTH KOREA CONFECTIONERY IN FAT REPLACERS MARKET, BY PRODUCT TYPE, 2020-2029 (USD MILLION)
TABLE 222 SOUTH KOREA CONFECTIONERY IN FAT REPLACERS MARKET, BY TYPE, 2020-2029 (USD MILLION)
TABLE 223 SOUTH KOREA FUNCTIONAL FOOD IN FAT REPLACERS MARKET, BY TYPE, 2020-2029 (USD MILLION)
TABLE 224 SOUTH KOREA SAUCES, SOUPS, & DRESSINGS IN FAT REPLACERS MARKET, BY TYPE, 2020-2029 (USD MILLION)
TABLE 225 SOUTH KOREA BEVERAGES IN FAT REPLACERS MARKET, BY TYPE, 2020-2029 (USD MILLION)
TABLE 226 SOUTH KOREA OTHERS IN FAT REPLACERS MARKET, BY TYPE, 2020-2029 (USD MILLION)
TABLE 227 MALAYSIA FAT REPLACERS MARKET, BY TYPE, 2020-2029 (USD MILLION)
TABLE 228 MALAYSIA CARBOHYDRATE-BASED IN FAT REPLACERS MARKET, BY TYPE, 2020-2029 (USD MILLION)
TABLE 229 MALAYSIA PROTEIN-BASED IN FAT REPLACERS MARKET, BY TYPE, 2020-2029 (USD MILLION)
TABLE 230 MALAYSIA FAT-BASED IN FAT REPLACERS MARKET, BY TYPE, 2020-2029 (USD MILLION)
TABLE 231 MALAYSIA FAT REPLACERS MARKET, BY SOURCE, 2020-2029 (USD MILLION)
TABLE 232 MALAYSIA FAT REPLACERS MARKET, BY CATEGORY, 2020-2029 (USD MILLION)
TABLE 233 MALAYSIA FAT REPLACERS MARKET, BY FORM, 2020-2029 (USD MILLION)
TABLE 234 MALAYSIA FAT REPLACERS MARKET, BY APPLICATION, 2020-2029 (USD MILLION)
TABLE 235 MALAYSIA BAKERY IN FAT REPLACERS MARKET, BY PRODUCT TYPE, 2020-2029 (USD MILLION)
TABLE 236 MALAYSIA BAKERY IN FAT REPLACERS MARKET, BY TYPE, 2020-2029 (USD MILLION)
TABLE 237 MALAYSIA DIARY PRODUCTS IN FAT REPLACERS MARKET, BY PRODUCT TYPE, 2020-2029 (USD MILLION)
TABLE 238 MALAYSIA YOGURT IN FAT REPLACERS MARKET, BY PRODUCT TYPE, 2020-2029 (USD MILLION)
TABLE 239 MALAYSIA MILK IN FAT REPLACERS MARKET, BY PRODUCT TYPE, 2020-2029 (USD MILLION)
TABLE 240 MALAYSIA DAIRY PRODUCTS IN FAT REPLACERS MARKET, BY TYPE, 2020-2029 (USD MILLION)
TABLE 241 MALAYSIA CONVENIENCE FOOD IN FAT REPLACERS MARKET, BY PRODUCT TYPE, 2020-2029 (USD MILLION)
TABLE 242 MALAYSIA CONVENIENCE FOOD IN FAT REPLACERS MARKET, BY TYPE, 2020-2029 (USD MILLION)
TABLE 243 MALAYSIA PROCESSED MEAT IN FAT REPLACERS MARKET, BY TYPE, 2020-2029 (USD MILLION)
TABLE 244 MALAYSIA CONFECTIONERY IN FAT REPLACERS MARKET, BY PRODUCT TYPE, 2020-2029 (USD MILLION)
TABLE 245 MALAYSIA CONFECTIONERY IN FAT REPLACERS MARKET, BY TYPE, 2020-2029 (USD MILLION)
TABLE 246 MALAYSIA FUNCTIONAL FOOD IN FAT REPLACERS MARKET, BY TYPE, 2020-2029 (USD MILLION)
TABLE 247 MALAYSIA SAUCES, SOUPS, & DRESSINGS IN FAT REPLACERS MARKET, BY TYPE, 2020-2029 (USD MILLION)
TABLE 248 MALAYSIA BEVERAGES IN FAT REPLACERS MARKET, BY TYPE, 2020-2029 (USD MILLION)
TABLE 249 MALAYSIA OTHERS IN FAT REPLACERS MARKET, BY TYPE, 2020-2029 (USD MILLION)
TABLE 250 THAILAND FAT REPLACERS MARKET, BY TYPE, 2020-2029 (USD MILLION)
TABLE 251 THAILAND CARBOHYDRATE-BASED IN FAT REPLACERS MARKET, BY TYPE, 2020-2029 (USD MILLION)
TABLE 252 THAILAND PROTEIN-BASED IN FAT REPLACERS MARKET, BY TYPE, 2020-2029 (USD MILLION)
TABLE 253 THAILAND FAT-BASED IN FAT REPLACERS MARKET, BY TYPE, 2020-2029 (USD MILLION)
TABLE 254 THAILAND FAT REPLACERS MARKET, BY SOURCE, 2020-2029 (USD MILLION)
TABLE 255 THAILAND FAT REPLACERS MARKET, BY CATEGORY, 2020-2029 (USD MILLION)
TABLE 256 THAILAND FAT REPLACERS MARKET, BY FORM, 2020-2029 (USD MILLION)
TABLE 257 THAILAND FAT REPLACERS MARKET, BY APPLICATION, 2020-2029 (USD MILLION)
TABLE 258 THAILAND BAKERY IN FAT REPLACERS MARKET, BY PRODUCT TYPE, 2020-2029 (USD MILLION)
TABLE 259 THAILAND BAKERY IN FAT REPLACERS MARKET, BY TYPE, 2020-2029 (USD MILLION)
TABLE 260 THAILAND DIARY PRODUCTS IN FAT REPLACERS MARKET, BY PRODUCT TYPE, 2020-2029 (USD MILLION)
TABLE 261 THAILAND YOGURT IN FAT REPLACERS MARKET, BY PRODUCT TYPE, 2020-2029 (USD MILLION)
TABLE 262 THAILAND MILK IN FAT REPLACERS MARKET, BY PRODUCT TYPE, 2020-2029 (USD MILLION)
TABLE 263 THAILAND DAIRY PRODUCTS IN FAT REPLACERS MARKET, BY TYPE, 2020-2029 (USD MILLION)
TABLE 264 THAILAND CONVENIENCE FOOD IN FAT REPLACERS MARKET, BY PRODUCT TYPE, 2020-2029 (USD MILLION)
TABLE 265 THAILAND CONVENIENCE FOOD IN FAT REPLACERS MARKET, BY TYPE, 2020-2029 (USD MILLION)
TABLE 266 THAILAND PROCESSED MEAT IN FAT REPLACERS MARKET, BY TYPE, 2020-2029 (USD MILLION)
TABLE 267 THAILAND CONFECTIONERY IN FAT REPLACERS MARKET, BY PRODUCT TYPE, 2020-2029 (USD MILLION)
TABLE 268 THAILAND CONFECTIONERY IN FAT REPLACERS MARKET, BY TYPE, 2020-2029 (USD MILLION)
TABLE 269 THAILAND FUNCTIONAL FOOD IN FAT REPLACERS MARKET, BY TYPE, 2020-2029 (USD MILLION)
TABLE 270 THAILAND SAUCES, SOUPS, & DRESSINGS IN FAT REPLACERS MARKET, BY TYPE, 2020-2029 (USD MILLION)
TABLE 271 THAILAND BEVERAGES IN FAT REPLACERS MARKET, BY TYPE, 2020-2029 (USD MILLION)
TABLE 272 THAILAND OTHERS IN FAT REPLACERS MARKET, BY TYPE, 2020-2029 (USD MILLION)
TABLE 273 PHILIPPINES FAT REPLACERS MARKET, BY TYPE, 2020-2029 (USD MILLION)
TABLE 274 PHILIPPINES CARBOHYDRATE-BASED IN FAT REPLACERS MARKET, BY TYPE, 2020-2029 (USD MILLION)
TABLE 275 PHILIPPINES PROTEIN-BASED IN FAT REPLACERS MARKET, BY TYPE, 2020-2029 (USD MILLION)
TABLE 276 PHILIPPINES FAT-BASED IN FAT REPLACERS MARKET, BY TYPE, 2020-2029 (USD MILLION)
TABLE 277 PHILIPPINES FAT REPLACERS MARKET, BY SOURCE, 2020-2029 (USD MILLION)
TABLE 278 PHILIPPINES FAT REPLACERS MARKET, BY CATEGORY, 2020-2029 (USD MILLION)
TABLE 279 PHILIPPINES FAT REPLACERS MARKET, BY FORM, 2020-2029 (USD MILLION)
TABLE 280 PHILIPPINES FAT REPLACERS MARKET, BY APPLICATION, 2020-2029 (USD MILLION)
TABLE 281 PHILIPPINES BAKERY IN FAT REPLACERS MARKET, BY PRODUCT TYPE, 2020-2029 (USD MILLION)
TABLE 282 PHILIPPINES BAKERY IN FAT REPLACERS MARKET, BY TYPE, 2020-2029 (USD MILLION)
TABLE 283 PHILIPPINES DIARY PRODUCTS IN FAT REPLACERS MARKET, BY PRODUCT TYPE, 2020-2029 (USD MILLION)
TABLE 284 PHILIPPINES YOGURT IN FAT REPLACERS MARKET, BY PRODUCT TYPE, 2020-2029 (USD MILLION)
TABLE 285 PHILIPPINES MILK IN FAT REPLACERS MARKET, BY PRODUCT TYPE, 2020-2029 (USD MILLION)
TABLE 286 PHILIPPINES DAIRY PRODUCTS IN FAT REPLACERS MARKET, BY TYPE, 2020-2029 (USD MILLION)
TABLE 287 PHILIPPINES CONVENIENCE FOOD IN FAT REPLACERS MARKET, BY PRODUCT TYPE, 2020-2029 (USD MILLION)
TABLE 288 PHILIPPINES CONVENIENCE FOOD IN FAT REPLACERS MARKET, BY TYPE, 2020-2029 (USD MILLION)
TABLE 289 PHILIPPINES PROCESSED MEAT IN FAT REPLACERS MARKET, BY TYPE, 2020-2029 (USD MILLION)
TABLE 290 PHILIPPINES CONFECTIONERY IN FAT REPLACERS MARKET, BY PRODUCT TYPE, 2020-2029 (USD MILLION)
TABLE 291 PHILIPPINES CONFECTIONERY IN FAT REPLACERS MARKET, BY TYPE, 2020-2029 (USD MILLION)
TABLE 292 PHILIPPINES FUNCTIONAL FOOD IN FAT REPLACERS MARKET, BY TYPE, 2020-2029 (USD MILLION)
TABLE 293 PHILIPPINES SAUCES, SOUPS, & DRESSINGS IN FAT REPLACERS MARKET, BY TYPE, 2020-2029 (USD MILLION)
TABLE 294 PHILIPPINES BEVERAGES IN FAT REPLACERS MARKET, BY TYPE, 2020-2029 (USD MILLION)
TABLE 295 PHILIPPINES OTHERS IN FAT REPLACERS MARKET, BY TYPE, 2020-2029 (USD MILLION)
TABLE 296 REST OF ASIA-PACIFIC FAT REPLACERS MARKET, BY TYPE, 2020-2029 (USD MILLION)
Lista de Figura
FIGURE 1 ASIA PACIFIC FAT REPLACERS MARKET: SEGMENTATION
FIGURE 2 ASIA PACIFIC FAT REPLACERS MARKET: DATA TRIANGULATION
FIGURE 3 ASIA PACIFIC FAT REPLACERS MARKET: DROC ANALYSIS
FIGURE 4 ASIA PACIFIC FAT REPLACERS MARKET: ASIA PACIFIC VS REGIONAL ANALYSIS
FIGURE 5 ASIA PACIFIC FAT REPLACERS MARKET: COMPANY RESEARCH ANALYSIS
FIGURE 6 ASIA PACIFIC FAT REPLACERS MARKET: INTERVIEW DEMOGRAPHICS
FIGURE 7 ASIA PACIFIC FAT REPLACERS MARKET: DBMR MARKET POSITION GRID
FIGURE 8 ASIA PACIFIC FAT REPLACERS MARKET: VENDOR SHARE ANALYSIS
FIGURE 9 ASIA PACIFIC FAT REPLACERS MARKET: SEGMENTATION
FIGURE 10 NORTH AMERICA REGION IS EXPECTED TO DOMINATE THE ASIA PACIFIC FAT REPLACERS MARKET AND GROWING WITH THE HIGHEST CAGR IN THE FORECAST PERIOD OF 2022 TO 2029
FIGURE 11 INCREASING AWARENESS AMONG PEOPLE ABOUT EXCESSIVE CONSUMPTION OF FAT IS EXPECTED TO DRIVE THE GROWTH OF THE ASIA PACIFIC FAT REPLACERS MARKET IN THE FORECAST PERIOD OF 2022 TO 2029
FIGURE 12 CARBOHYDRATE-BASED IN PRODUCT SEGMENT IS EXPECTED TO ACCOUNT FOR THE LARGEST SHARE OF THE ASIA PACIFIC FAT REPLACERS MARKET IN 2022 & 2029
FIGURE 13 DRIVERS, RESTRAINTS, OPPORTUNITIES, AND CHALLENGE OF ASIA PACIFIC FAT REPLACERS MARKET
FIGURE 14 MAJOR SOURCES OF FAT IN U.S. DIET
FIGURE 15 ASIA PACIFIC FAT REPLACERS MARKET: BY TYPE, 2021
FIGURE 16 ASIA PACIFIC FAT REPLACERS MARKET: BY SOURCE, 2021
FIGURE 17 ASIA PACIFIC FAT REPLACERS MARKET: BY CATEGORY, 2021
FIGURE 18 ASIA PACIFIC FAT REPLACERS MARKET, BY FORM, 2021
FIGURE 19 ASIA PACIFIC FAT REPLACERS MARKET: BY APPLICATION, 2021
FIGURE 20 ASIA-PACIFIC FAT REPLACERS MARKET: SNAPSHOT (2021)
FIGURE 21 ASIA-PACIFIC FAT REPLACERS MARKET: BY COUNTRY (2021)
FIGURE 22 ASIA-PACIFIC FAT REPLACERS MARKET: BY COUNTRY (2022 & 2029)
FIGURE 23 ASIA-PACIFIC FAT EPLACERS MARKET: BY COUNTRY (2021 & 2029)
FIGURE 24 ASIA-PACIFIC FAT REPLACERS MARKET: BY TYPE (2022 & 2029)
FIGURE 25 ASIA PACIFIC FAT REPLACERS MARKET: COMPANY SHARE 2021 (%)
Metodologia de Investigação
A recolha de dados e a análise do ano base são feitas através de módulos de recolha de dados com amostras grandes. A etapa inclui a obtenção de informações de mercado ou dados relacionados através de diversas fontes e estratégias. Inclui examinar e planear antecipadamente todos os dados adquiridos no passado. Da mesma forma, envolve o exame de inconsistências de informação observadas em diferentes fontes de informação. Os dados de mercado são analisados e estimados utilizando modelos estatísticos e coerentes de mercado. Além disso, a análise da quota de mercado e a análise das principais tendências são os principais fatores de sucesso no relatório de mercado. Para saber mais, solicite uma chamada de analista ou abra a sua consulta.
A principal metodologia de investigação utilizada pela equipa de investigação do DBMR é a triangulação de dados que envolve a mineração de dados, a análise do impacto das variáveis de dados no mercado e a validação primária (especialista do setor). Os modelos de dados incluem grelha de posicionamento de fornecedores, análise da linha de tempo do mercado, visão geral e guia de mercado, grelha de posicionamento da empresa, análise de patentes, análise de preços, análise da quota de mercado da empresa, normas de medição, análise global versus regional e de participação dos fornecedores. Para saber mais sobre a metodologia de investigação, faça uma consulta para falar com os nossos especialistas do setor.
Personalização disponível
A Data Bridge Market Research é líder em investigação formativa avançada. Orgulhamo-nos de servir os nossos clientes novos e existentes com dados e análises que correspondem e atendem aos seus objetivos. O relatório pode ser personalizado para incluir análise de tendências de preços de marcas-alvo, compreensão do mercado para países adicionais (solicite a lista de países), dados de resultados de ensaios clínicos, revisão de literatura, mercado remodelado e análise de base de produtos . A análise de mercado dos concorrentes-alvo pode ser analisada desde análises baseadas em tecnologia até estratégias de carteira de mercado. Podemos adicionar quantos concorrentes necessitar de dados no formato e estilo de dados que procura. A nossa equipa de analistas também pode fornecer dados em tabelas dinâmicas de ficheiros Excel em bruto (livro de factos) ou pode ajudá-lo a criar apresentações a partir dos conjuntos de dados disponíveis no relatório.

