

Asia-Pacific Eggs Market, By Product Type (Shell Egg, Processed Eggs), Source (Plant Based Egg, Animal Based Egg), Category (Conventional and Organic), Packaging Type (Trays, Boxes & Carton, Cans, Bottles, Pouches, Others), Specialty (Gluten Free, Low Cholesterol, High Protein, and Others), End User (Retail/Household, Food Service Sector), Distribution Channel (Store Based Retailer and Non-Store Based Retailer (Online)), Country (Japan, China, South Korea, India, Australia, Singapore, Thailand, Indonesia, Malaysia, Philippines, and Rest of Asia-Pacific) Industry Trends and Forecast to 2028.
 Market Analysis and Insights: Asia-Pacific Eggs Market
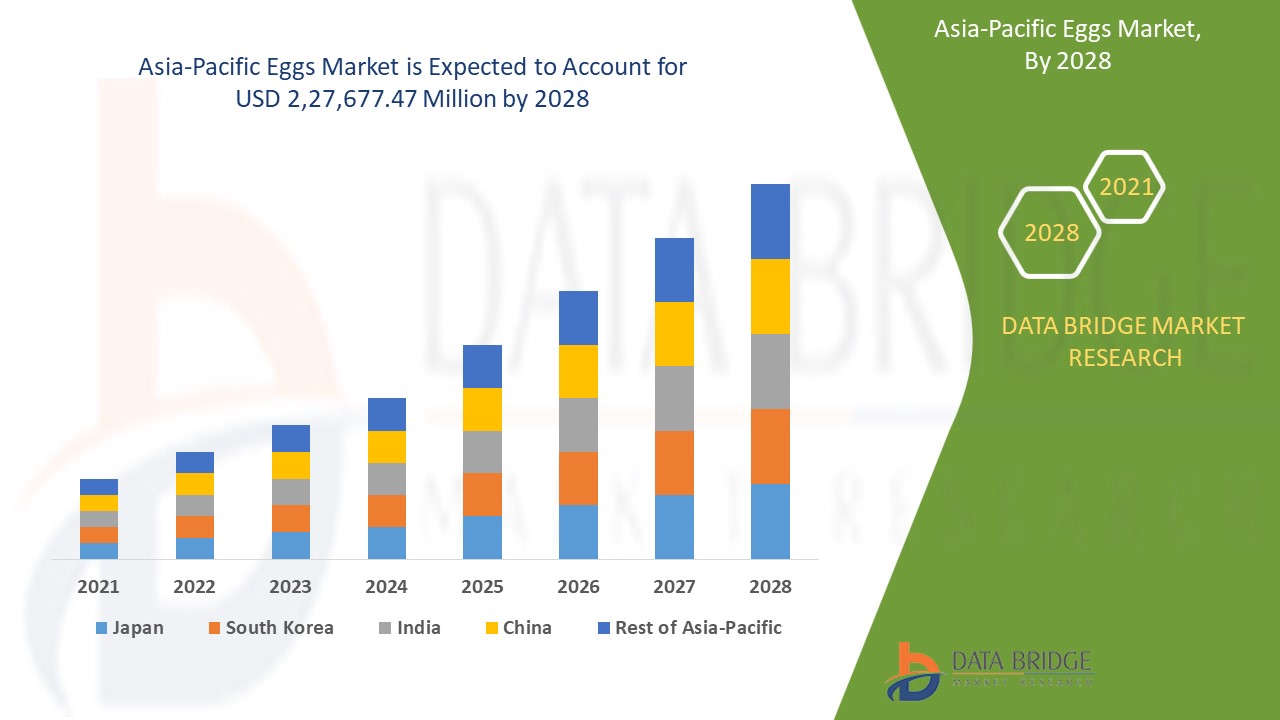
Eggs market is expected to gain market growth in the forecast period of 2021 to 2028. Data Bridge Market Research analyses that the market is growing with the CAGR of 6.9% in the forecast period of 2021 to 2028 and expected to reach USD 2,27,677.47 million by 2028. Increasing number of consumers preferring high protein diet in the region is a driving factor for the market growth.
Egg is a good source of protein and a very energy-dense with nutrients. Nowadays, people are becoming more aware of the health benefits of protein-rich foods which are expected to boost their demand in the market. Egg has several applications and usage in various foodservice sectors. Thus, the high nutrient content of these eggs is attracting health-conscious consumers towards healthy protein option.
Increasing number of health conscious consumers and increasing vegan population are is expected to drive the market’s growth. Also, the growth of fast food and restaurant chains and increasing digitalization in egg supply is expected to drive the market’s growth. However, the risk of disease transfer from animal egg sources, food allergens associated with conventional eggs may restrain the market growth. The opportunity for growth in the market is increasing automation in poultry and processing industry. Some factors that challenge the market growth are high investment cost in poultry business.
This eggs market report provides details of market share, new developments, and product pipeline analysis, impact of domestic and localised market players, analyses opportunities in terms of emerging revenue pockets, changes in market regulations, product approvals, strategic decisions, product launches, geographical expansions, and technological innovations in the market. To understand the analysis and the market scenario contact us for an Analyst Brief, our team will help you create a revenue impact solution to achieve your desired goal.
 Asia-Pacific Eggs Market Scope and Market Size
Eggs market is segmented on basis of product type, source, category, packaging type, specialty, end user and distribution channel. The growth among segments helps you analyse niche pockets of growth and strategies to approach the market and determine your core application areas and the difference in your target markets.
- On the basis of product type, the eggs market is segmented into shell egg, processed eggs. In 2021, the shell egg segment is expected to dominate the egg market as they are highly preferred by end user industries.
- On the basis of source, the eggs market is segmented into plant based egg, animal based egg. In 2021, the animal based egg segment is expected to dominate the egg market due to the availability of various animal based egg products.
- On the basis of category, the eggs market is segmented into conventional and organic. In 2021, the conventional segment is expected to dominate the egg market due to the increasing demand for conventional eggs in the market.
- On the basis of packaging type, the eggs market is segmented into trays, boxes & carton, cans, bottles, pouches, others. In 2021, the trays segment is expected to dominate the egg market as they are better to rely upon.
- On the basis of specialty, the eggs market is segmented into gluten free, low cholesterol, high protein and others. In 2021, the high protein segment is expected to dominate the egg market due to the increasing demand for high protein foods such as egg among health-conscious consumers.
- On the basis of end user, the eggs market is segmented into retail/household, food service sector. In 2021, the retail/household segment is expected to dominate the egg market due to the growing application and usage in the retail segment.
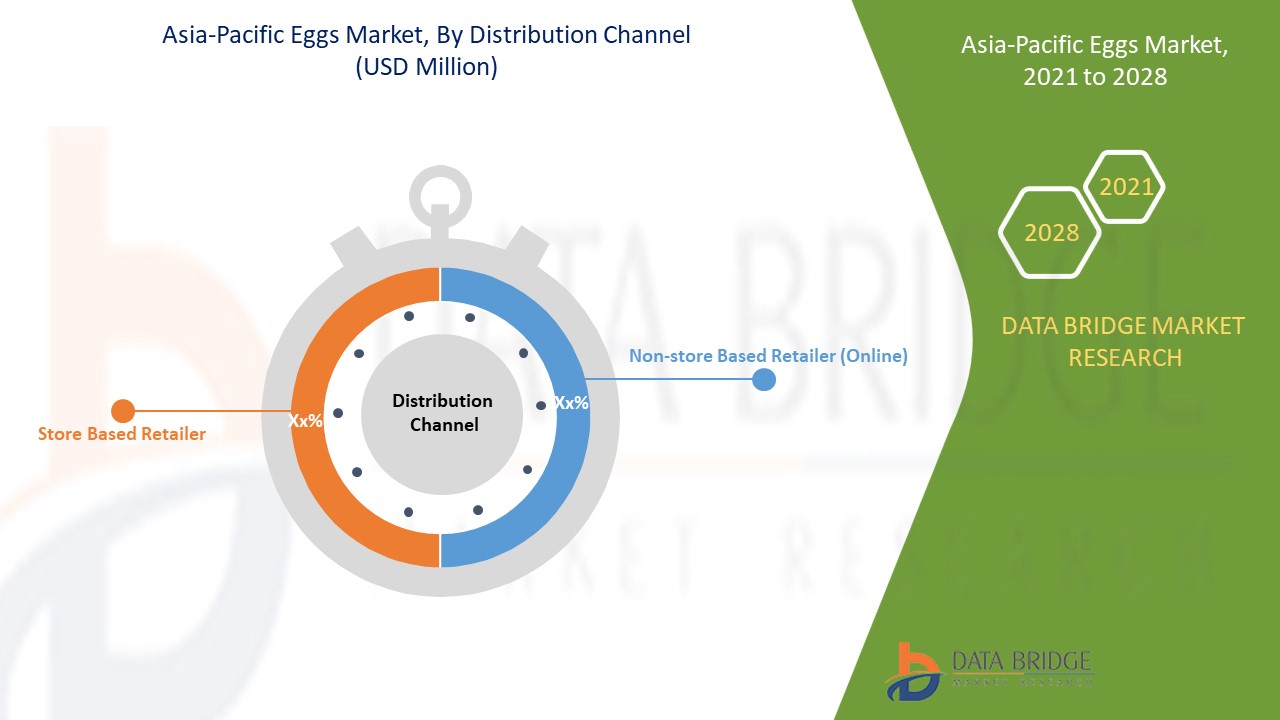
- On the basis of distribution channel, the eggs market is segmented into store based retailer and non-store based retailer (online). In 2021, the store based retailer segment is expected to dominate the plant-based egg market due to the easy availability of a plant-based product in the nearby stores.
Eggs Market Country Level Analysis
Eggs market is segmented on basis of product type, source, category, packaging type, specialty, end user and distribution channel.
The countries covered in eggs market report are Japan, China, South Korea, India, Australia, Singapore, Thailand, Indonesia, Malaysia, Philippines, and rest of Asia-Pacific.
China dominates the Asia-Pacific eggs market due to the growing number of consumer preferring high protein foods.
The country section of the report also provides individual market impacting factors and changes in regulation in the market domestically that impacts the current and future trends of the market. Data points such as new sales, replacement sales, country demographics, regulatory acts and import-export tariffs are some of the major pointers used to forecast the market scenario for individual countries. Also, presence and availability of Asia-Pacific brands and their challenges faced due to large or scarce competition from local and domestic brands, impact of sales channels are considered while providing forecast analysis of the country data.
Rising Consumption of Eggs in the Laboratories for New Experiments
Eggs market also provides you with detailed market analysis for every country growth in industry with sales, components sales, impact of technological development in eggs and changes in regulatory scenarios with their support for the eggs market. The data is available for historic period 2019 to 2021.
Competitive Landscape and Eggs Market Share Analysis
Eggs market competitive landscape provides details by competitor. Details included are company overview, company financials, revenue generated, market potential, investment in research and development, new market initiatives, Asia-Pacific presence, production sites and facilities, company strengths and weaknesses, product launch, product trials pipelines, product approvals, patents, product width and breadth, application dominance, technology lifeline curve. The above data points provided are only related to the companies’ focus related to eggs market.
The major players covered in the report are Charoen Pokphand Foods PCL, Rembrandt Foods, Mantiqueira Group, Herbruck's Poultry Ranch, Inc., and Bob’s Red Mill Natural Foods among others. DBMR analysts understand competitive strengths and provide competitive analysis for each competitor separately.
Many partnerships are also initiated by the companies worldwide which are also accelerating the growth of eggs market.
For instance,
- In March 2021, Charoen Pokphand Foods PCL passed the resolution regarding the acquisition in total of 43.30%, ordinary shares in C.P. Aquaculture (India) Private Limited from Charoen Pokphand Group Co., Ltd. and C.T. Progressive (Investment) Ltd. This acquisition will help the company to increase its profit revenue
Partnership, joint ventures and other strategies enhances the company market share with increased coverage and presence. It also provides the benefit for organisation to improve their offering for eggs through expanded range of size.
SKU-
Obtenha acesso online ao relatório sobre a primeira nuvem de inteligência de mercado do mundo

- Painel interativo de análise de dados
- Painel de análise da empresa para oportunidades de elevado potencial de crescimento
- Acesso de analista de pesquisa para personalização e customização. consultas
- Análise da concorrência com painel interativo
- Últimas notícias, atualizações e atualizações Análise de tendências
- Aproveite o poder da análise de benchmark para um rastreio abrangente da concorrência
Índice
1 INTRODUCTION
1.1 OBJECTIVES OF THE STUDY
1.2 MARKET DEFINITION
1.3 OVERVIEW OF ASIA PACIFIC EGGS MARKET
1.4 LIMITATIONS
1.5 MARKETS COVERED
2 MARKET SEGMENTATION
2.1 MARKETS COVERED
2.2 GEOGRAPHICAL SCOPE
2.3 YEARS CONSIDERED FOR THE STUDY
2.4 CURRENCY AND PRICING
2.5 DBMR TRIPOD DATA VALIDATION MODEL
2.6 PRIMARY INTERVIEWS WITH KEY OPINION LEADERS
2.7 MULTIVARIATE MODELLING
2.8 PRODUCT TYPE LIFELINE CURVE
2.9 DBMR MARKET POSITION GRID
2.1 VENDOR SHARE ANALYSIS
2.11 SECONDARY SOURCES
2.12 ASSUMPTIONS
2.13 EXECUTIVE SUMMARY
3 PREMIUM INSIGHTS
3.1 PROMOTIONAL ACTIVITIES
3.2 SHOPPING BEHAVIOR AND DYNAMICS/FACTORS INFLUENCING THE PURCHASE
3.2.1 GROWING HEALTH BENEFIT
3.2.2 PRICING OF EGG
3.2.3 GROWING CONSUMERS INTEREST IN PLANT-BASED DIETS
3.3 SUPPLY CHAIN ANALYSIS
3.3.1 RAW MATERIAL PROCUREMENT
3.3.2 PROCESSING AND PACKING
3.3.3 MARKETING AND DISTRIBUTION
3.3.4 END USERS
4 REGULATORY FRAMEWORK, LABELLING AND CLAIMS- ASIA PACIFIC EGGS MARKET
5 MARKET OVERVIEW
5.1 DRIVER
5.1.1 INCREASING NUMBER OF HEALTH CONSCIOUS CONSUMERS
5.1.2 INCREASING VEGAN POPULATION TO DRIVE MARKET GROWTH
5.1.3 GROWTH OF FAST FOOD AND RESTAURANT CHAINS
5.1.4 INCREASING DIGITALIZATION IN EGG SUPPLY
5.2 RESTRAINT
5.2.1 RISK OF DISEASE TRANSFER FROM ANIMAL EGG SOURCES
5.2.2 FOOD ALLERGENS ASSOCIATED WITH CONVENTIONAL EGGS
5.3 OPPORTUNITIES
5.3.1 INCREASING AUTOMATION IN POULTRY AND PROCESSING INDUSTRY
5.3.2 STRATERGIC COLLABORATIONS, ACQUISITIONS, AND EXPANSIONS FROM KEY PLAYERS
5.3.3 RISE IN DEMAND FOR ORGANIC INGREDIENTS
5.4 CHALLENGES
5.4.1 DISRUPTION IN SUPPLY CHAIN AND TRADE DUE TO COVID 19
5.4.2 HIGH INVESTMENT COST IN POULTRY BUSINESS
6 COVID-19 IMPACT ON ASIA PACIFIC EGGS MARKET
6.1 AFTERMATH OF COVID-19
6.2 IMPACT ON SUPPLY CHAIN
6.3 IMPACT ON DEMAND
6.4 STRATEGIC INITIATIVES BY GOVERNMENT ANDF MANUFACTURERS
6.5 IMPACT ON PRICE
6.6 CONCLUSION
7 ASIA PACIFIC EGGS MARKET, BY PRODUCT TYPE
7.1 OVERVIEW
7.2 SHELL EGGS
7.2.1 CAGED
7.2.1.1 WHITE EGGS
7.2.1.2 BROWN EGGS
7.2.2 CAGED-FREE
7.2.2.1 WHITE EGGS
7.2.2.2 BROWN EGGS
7.3 PROCESSED EGGS
7.3.1 EGGS POWDER
7.3.1.1 EGG WHITE
7.3.1.2 WHOLE EGG
7.3.1.3 EGG YOLK
7.3.2 LIQUID EGGS
7.3.2.1 EGG WHITE
7.3.2.2 WHOLE EGG
7.3.2.3 EGG YOLK
7.3.3 FROZEN EGGS
7.3.3.1 EGG WHITE
7.3.3.2 WHOLE EGG
7.3.3.3 EGG YOLK
7.3.4 DRIED EGGS
7.3.4.1 EGG WHITE
7.3.4.2 WHOLE EGG
7.3.4.3 EGG YOLK
7.3.5 SPECIALTY EGGS
7.3.5.1 EGG WHITE
7.3.5.2 WHOLE EGG
7.3.5.3 EGG YOLK
7.3.6 OTHERS
8 ASIA PACIFIC EGGS MARKET, BY END-USER
8.1 OVERVIEW
8.2 RETAIL/HOUSEHOLD
8.3 FOOD SERVICE SECTOR
8.3.1 HOTELS
8.3.2 RESTAURANTS
8.3.2.1 RESTAURANTS, BY TYPE
8.3.2.1.1 INDEPENDENT RESTAURANT
8.3.2.1.2 CHAIN RESTAURANT
8.3.2.2 RESTAURANTS, BY SERVICE CATEGORY
8.3.2.2.1 QUICK SERVICE RESTAURANTS
8.3.2.2.2 FULL SERVICE RESTAURANTS
8.3.3 CATERING
8.3.4 CAFE
8.3.5 BARS AND CLUBS
8.3.6 OTHERS
9 ASIA PACIFIC EGGS MARKET, BY SOURCE
9.1 OVERVIEW
9.2 ANIMAL BASED EGGS
9.2.1 CHICKEN
9.2.2 DUCK
9.2.3 OTHERS
9.3 PLANT BASED EGGS
9.3.1 MUNG BEANS
9.3.2 GARBANZO BEANS
9.3.3 PEA
9.3.4 SOY FLOUR
9.3.5 STARCH
9.3.6 ALGAL FLOUR
9.3.7 CHIA SEEDS
9.3.8 WHEAT FLOUR
9.3.9 OTHERS
10 ASIA PACIFIC EGGS MARKET, BY CATEGORY
10.1 OVERVIEW
10.2 CONVENTIONAL
10.3 ORGANIC
11 ASIA PACIFIC EGGS MARKET, BY PACKAGING TYPE
11.1 OVERVIEW
11.2 TRAYS
11.3 BOXES & CARTON
11.4 BOTTLES
11.5 POUCHES
11.6 CANS
11.7 OTHERS
12 ASIA PACIFIC EGGS MARKET, BY SPECIALTY
12.1 OVERVIEW
12.2 HIGH PROTEIN
12.3 LOW CHOLESTEROL
12.4 GLUTEN FREE
12.5 OTHERS
13 ASIA PACIFIC EGGS MARKET, BY DISTRIBUTION CHANNEL
13.1 OVERVIEW
13.2 STORE BASED RETAILER
13.2.1 SUPERMARKETS/HYPERMARKETS
13.2.2 CONVENIENCE STORES
13.2.3 GROCERY STORES
13.2.4 BRICK & MOTOR STORES
13.2.5 OTHER DISTRIBUTION CHANNEL
13.3 NON-STORE BASED RETAILER (ONLINE)
14 ASIA PACIFIC EGGS MARKET, BY REGION
14.1 ASIA-PACIFIC
14.1.1 JAPAN
14.1.2 CHINA
14.1.3 SOUTH KOREA
14.1.4 INDIA
14.1.5 AUSTRALIA
14.1.6 SINGAPORE
14.1.7 THAILAND
14.1.8 INDONESIA
14.1.9 PHILIPPINES
14.1.10 MALAYSIA
14.1.11 REST OF ASIA-PACIFIC
15 ASIA PACIFIC EGGS MARKET: COMPANY LANDSCAPE
15.1 COMPANY SHARE ANALYSIS: ASIA PACIFIC
16 SWOT ANALYSIS
17 COMPANY PROFILE
17.1 CAL-MAINE FOODS, INC.
17.1.1 COMPANY SNAPSHOT
17.1.2 REVENUE ANALYSIS
17.1.3 COMPANY SHARE ANALYSIS
17.1.4 PRODUCT PORTFOLIO
17.1.5 RECENT DEVELOPMENT
17.2 ROSE ACRE FARMS
17.2.1 COMPANY SNAPSHOT
17.2.2 COMPANY SHARE ANALYSIS
17.2.3 PRODUCT PORTFOLIO
17.2.4 RECENT DEVELOPMENT
17.3 CHAROEN POKPHAND FOODS PCL
17.3.1 COMPANY SNAPSHOT
17.3.2 REVENUE ANALYSIS
17.3.3 COMPANY SHARE ANALYSIS
17.3.4 PRODUCT PORTFOLIO
17.3.5 RECENT DEVELOPMENTS
17.4 VERSOVA
17.4.1 COMPANY SNAPSHOT
17.4.2 COMPANY SHARE ANALYSIS
17.4.3 PRODUCT PORTFOLIO
17.4.4 RECENT DEVELOPMENT
17.5 HILLANDALE FARMS
17.5.1 COMPANY SNAPSHOT
17.5.2 COMPANY SHARE ANALYSIS
17.5.3 PRODUCT PORTFOLIO
17.5.4 RECENT DEVELOPMENT
17.6 AGROHOLDING AVANGARD
17.6.1 COMPANY SNAPSHOT
17.6.2 PRODUCT PORTFOLIO
1.2.3 RECENT DEVELOPMENT 203
17.7 ATLANTIC NATURAL FOODS
17.7.1 COMPANY SNAPSHOT
17.7.2 PRODUCT PORTFOLIO
17.7.3 RECENT DEVELOPMENTS
17.8 AVRIL
17.8.1 COMPANY SNAPSHOT
17.8.2 REVENUE ANALYSIS
17.8.3 PRODUCT PORTFOLIO
17.8.4 RECENT DEVELOPMENTS
17.9 BACHOCO
17.9.1 COMPANY SNAPSHOT
17.9.2 REVENUE ANALYSIS
17.9.3 PRODUCT PORTFOLIO
17.9.4 RECENT DEVELOPMENT
17.1 BOB’S RED MILL NATURAL FOODS
17.10.1 COMPANY SNAPSHOT
17.10.2 PRODUCT PORTFOLIO
17.10.3 RECENT DEVELOPMENT
17.11 CALVARY EGG
17.11.1 COMPANY SNAPSHOT
17.11.2 PRODUCT PORTFOLIO
17.11.3 RECENT DEVELOPMENT
17.12 DAYBREAK FOODS, INC
17.12.1 COMPANY SNAPSHOT
17.12.2 PRODUCT PORTFOLIO
17.12.3 RECENT DEVELOPMENT
17.13 EAT JUST, INC.
17.13.1 COMPANY SNAPSHOT
17.13.2 PRODUCT PORTFOLIO
17.13.3 RECENT DEVELOPMENTS
17.14 EUREDEN
17.14.1 COMPANY SNAPSHOT
17.14.2 PRODUCT PORTFOLIO
17.14.3 RECENT DEVELOPMENT
17.15 HERBRUCK’S POULTRY RANCH, INC
17.15.1 COMPANY SNAPSHOT
17.15.2 PRODUCT PORTFOLIO
17.15.3 RECENT DEVELOPMENT
17.16 ISE FOODS INC
17.16.1 COMPANY SNAPSHOT
17.16.2 PRODUCT PORTFOLIO
17.16.3 RECENT DEVELOPMENT
17.17 KAZI FARMS GROUP
17.17.1 COMPANY SNAPSHOT
17.17.2 PRODUCT PORTFOLIO
17.17.3 RECENT DEVELOPMENT
17.18 MANTIQUEIRA GROUP
17.18.1 COMPANY SNAPSHOT
17.18.2 PRODUCT PORTFOLIO
17.18.3 RECENT DEVELOPMENT
17.19 MICHAEL FOODS, INC
17.19.1 COMPANY SNAPSHOT
17.19.2 PRODUCT PORTFOLIO
17.19.3 RECENT DEVELOPMENTS
17.2 NABATI
17.20.1 COMPANY SNAPSHOT
17.20.2 PRODUCT PORTFOLIO
17.20.3 RECENT DEVELOPMENTS
17.21 NOBLE FOODS
17.21.1 COMPANY SNAPSHOT
17.21.2 PRODUCT PORTFOLIO
17.21.3 RECENT DEVELOPMENT
17.22 OVOSTAR UNION
17.22.1 COMPANY SNAPSHOT
17.22.2 REVENUE ANALYSIS
17.22.3 PRODUCT PORTFOLIO
17.22.4 RECENT DEVELOPMENTS
17.23 REMBRANDT FOODS
17.23.1 COMPANY SNAPSHOT
17.23.2 PRODUCT PORTFOLIO
17.23.3 RECENT DEVELOPMENT
17.24 SPARBOE
17.24.1 COMPANY SNAPSHOT
17.24.2 PRODUCT PORTFOLIO
17.24.3 RECENT DEVELOPMENT
17.25 THE VEGGLETTO COMPANY PTY LTD
17.25.1 COMPANY SNAPSHOT
17.25.2 PRODUCT PORTFOLIO
17.25.3 RECENT DEVELOPMENT
17.26 VEGG
17.26.1 COMPANY SNAPSHOT
17.26.2 PRODUCT PORTFOLIO
17.26.3 RECENT DEVELOPMENT
18 QUESTIONNAIRE
19 RELATED REPORTS
Lista de Tabela
TABLE 1 THE REGULATORY FRAMEWORK, LABELLING INFORMATION FOR EGGS AS WELL AS PROCESSED EGGS ARE LISTED IN THE TABLE BELOW:
TABLE 2 ASIA PACIFIC EGGS MARKET, BY PRODUCT TYPE, 2019-2028 (USD MILLION)
TABLE 3 ASIA PACIFIC SHELL EGGS IN EGGS MARKET, BY REGION, 2019-2028 (USD MILLION)
TABLE 4 ASIA PACIFIC SHELL EGGS IN EGGS MARKET, BY TYPE, 2019-2028 (USD MILLION)
TABLE 5 ASIA PACIFIC CAGED IN EGGS MARKET, BY TYPE, 2019-2028 (USD MILLION)
TABLE 6 ASIA PACIFIC CAGED FREE IN EGGS MARKET, BY TYPE, 2019-2028 (USD MILLION)
TABLE 7 ASIA PACIFIC PROCESSED EGGS IN EGGS MARKET, BY REGION, 2019-2028 (USD MILLION)
TABLE 8 ASIA PACIFIC PROCESSED EGGS IN EGGS MARKET, BY TYPE, 2019-2028 (USD MILLION)
TABLE 9 ASIA PACIFIC EGGS POWDER IN EGGS MARKET, BY TYPE, 2019-2028 (USD MILLION)
TABLE 10 ASIA PACIFIC LIQUID EGGS IN EGGS MARKET, BY TYPE, 2019-2028 (USD MILLION)
TABLE 11 ASIA PACIFIC FROZEN EGGS IN EGGS MARKET, BY TYPE, 2019-2028 (USD MILLION)
TABLE 12 ASIA PACIFIC DRIED EGGS IN EGGS MARKET, BY TYPE, 2019-2028 (USD MILLION)
TABLE 13 ASIA PACIFIC SPECIALTY EGGS IN EGGS MARKET, BY TYPE, 2019-2028 (USD MILLION)
TABLE 14 ASIA PACIFIC EGGS MARKET, BY END USER, 2019-2028 (USD MILLION)
TABLE 15 ASIA PACIFIC RETAIL/HOUSEHOLD IN EGGS MARKET, BY REGION, 2019-2028 (USD MILLION)
TABLE 16 ASIA PACIFIC FOOD SERVICE SECTOR IN EGGS MARKET, BY REGION, 2019-2028 (USD MILLION)
TABLE 17 ASIA PACIFIC FOOD SERVICE SECTOR IN EGGS MARKET, BY TYPE, 2019-2028 (USD MILLION)
TABLE 18 ASIA PACIFIC RESTAURANTS IN EGGS MARKET, BY TYPE, 2019-2028 (USD MILLION)
TABLE 19 ASIA PACIFIC RESTAURANTS IN EGGS MARKET, BY SERVICE CATEGORY, 2019-2028 (USD MILLION)
TABLE 20 ASIA PACIFIC EGGS MARKET, BY SOURCE, 2019-2028 (USD MILLION)
TABLE 21 ASIA PACIFIC ANIMAL BASED EGGS IN EGGS MARKET, BY REGION, 2019-2028 (USD MILLION)
TABLE 22 ASIA PACIFIC ANIMAL BASED EGGS IN EGGS MARKET, BY SOURCE, 2019-2028 (USD MILLION)
TABLE 23 THE NUTRITIONAL CONTENT OF PLANT BASED EGG IS MENTIONED IN THE TABLE BELOW
TABLE 24 ASIA PACIFIC PLANT BASED EGGS IN EGGS MARKET, BY REGION, 2019-2028 (USD MILLION)
TABLE 25 ASIA PACIFIC PLANT BASED EGGS IN EGGS MARKET, BY SOURCE, 2019-2028 (USD MILLION)
TABLE 26 ASIA PACIFIC EGGS MARKET, BY CATEGORY, 2019-2028 (USD MILLION)
TABLE 27 ASIA PACIFIC CONVENTIONAL IN EGGS MARKET, BY REGION, 2019-2028 (USD MILLION)
TABLE 28 ASIA PACIFIC ORGANIC IN EGGS MARKET, BY REGION, 2019-2028 (USD MILLION)
TABLE 29 ASIA PACIFIC EGGS MARKET, BY PACKAGING TYPE, 2019-2028 (USD MILLION)
TABLE 30 ASIA PACIFIC TRAYS IN EGGS MARKET, BY REGION, 2019-2028 (USD MILLION)
TABLE 31 ASIA PACIFIC BOXES & CARTON IN EGGS MARKET, BY REGION, 2019-2028 (USD MILLION)
TABLE 32 ASIA PACIFIC BOTTLES IN EGGS MARKET, BY REGION, 2019-2028 (USD MILLION)
TABLE 33 ASIA PACIFIC POUCHES IN EGGS MARKET, BY REGION, 2019-2028 (USD MILLION)
TABLE 34 ASIA PACIFIC CANS IN EGGS MARKET, BY REGION, 2019-2028 (USD MILLION)
TABLE 35 ASIA PACIFIC OTHERS IN EGGS MARKET, BY REGION, 2019-2028 (USD MILLION)
TABLE 36 ASIA PACIFIC EGGS MARKET, BY SPECIALTY, 2019-2028 (USD MILLION)
TABLE 37 ASIA PACIFIC HIGH PROTEIN IN EGGS MARKET, BY REGION, 2019-2028 (USD MILLION)
TABLE 38 ASIA PACIFIC LOW CHOLESTEROL IN EGGS MARKET, BY REGION, 2019-2028 (USD MILLION)
TABLE 39 ASIA PACIFIC GLUTEN FREE IN EGGS MARKET, BY REGION, 2019-2028 (USD MILLION)
TABLE 40 ASIA PACIFIC OTHERS IN EGGS MARKET, BY REGION, 2019-2028 (USD MILLION)
TABLE 41 ASIA PACIFIC EGGS MARKET, BY DISTRIBUTION CHANNEL, 2019-2028 (USD MILLION)
TABLE 42 ASIA PACIFIC STORE BASED RETAILER IN EGGS MARKET, BY REGION, 2019-2028 (USD MILLION)
TABLE 43 ASIA PACIFIC STORE BASED RETAILER IN EGGS MARKET, BY TYPE, 2019-2028 (USD MILLION)
TABLE 44 ASIA PACIFIC NON-STORE BASED RETAILER (ONLINE) IN EGGS MARKET, BY REGION, 2019-2028 (USD MILLION)
TABLE 45 ASIA-PACIFIC EGGS MARKET, BY COUNTRY, 2019-2028 (USD MILLION)
TABLE 46 ASIA-PACIFIC EGGS MARKET, BY PRODUCT TYPE, 2019-2028 (USD MILLION)
TABLE 47 ASIA-PACIFIC SHELL EGGS IN EGGS MARKET, BY TYPE, 2019-2028 (USD MILLION)
TABLE 48 ASIA-PACIFIC CAGED IN EGGS MARKET, BY TYPE, 2019-2028 (USD MILLION)
TABLE 49 ASIA-PACIFIC CAGED-FREE IN EGGS MARKET, BY TYPE, 2019-2028 (USD MILLION)
TABLE 50 ASIA-PACIFIC PROCESSED EGGS IN EGGS MARKET, BY TYPE, 2019-2028 (USD MILLION)
TABLE 51 ASIA-PACIFIC EGGS POWDER IN EGGS MARKET, BY TYPE, 2019-2028 (USD MILLION)
TABLE 52 ASIA-PACIFIC LIQUID EGGS IN EGGS MARKET, BY TYPE, 2019-2028 (USD MILLION)
TABLE 53 ASIA-PACIFIC FROZEN EGGS IN EGGS MARKET, BY TYPE, 2019-2028 (USD MILLION)
TABLE 54 ASIA-PACIFIC DRIED EGGS IN EGGS MARKET, BY TYPE, 2019-2028 (USD MILLION)
TABLE 55 ASIA-PACIFIC SPECIALTY EGGS IN EGGS MARKET, BY TYPE, 2019-2028 (USD MILLION)
TABLE 56 ASIA-PACIFIC EGGS MARKET, BY SOURCE, 2019-2028 (USD MILLION)
TABLE 57 ASIA-PACIFIC PLANT-BASED EGGS IN EGGS MARKET, BY TYPE, 2019-2028 (USD MILLION)
TABLE 58 ASIA-PACIFIC ANIMAL BASED EGGS IN EGGS MARKET, BY TYPE, 2019-2028 (USD MILLION)
TABLE 59 ASIA-PACIFIC EGGS MARKET, BY CATEGORY, 2019-2028 (USD MILLION)
TABLE 60 ASIA-PACIFIC EGGS MARKET, BY PACKAGING TYPE, 2019-2028 (USD MILLION)
TABLE 61 ASIA-PACIFIC EGGS MARKET, BY SPECIALTY, 2019-2028 (USD MILLION)
TABLE 62 ASIA-PACIFIC EGGS MARKET, BY END USER, 2019-2028 (USD MILLION)
TABLE 63 ASIA-PACIFIC FOOD SERVICE SECTOR IN EGGS MARKET, BY TYPE, 2019-2028 (USD MILLION)
TABLE 64 ASIA-PACIFIC RESTAURANTS IN EGGS MARKET, BY TYPE, 2019-2028 (USD MILLION)
TABLE 65 ASIA-PACIFIC RESTAURANTS IN EGGS MARKET, BY SERVICE CATEGORY, 2019-2028 (USD MILLION)
TABLE 66 ASIA-PACIFIC EGGS MARKET, BY DISTRIBUTION CHANNEL, 2019-2028 (USD MILLION)
TABLE 67 ASIA-PACIFIC STORE BASED RETAILERS IN EGGS MARKET, BY TYPE, 2019-2028 (USD MILLION)
TABLE 68 JAPAN EGGS MARKET, BY PRODUCT TYPE, 2019-2028 (USD MILLION)
TABLE 69 JAPAN SHELL EGGS IN EGGS MARKET, BY TYPE, 2019-2028 (USD MILLION)
TABLE 70 JAPAN CAGED IN EGGS MARKET, BY TYPE, 2019-2028 (USD MILLION)
TABLE 71 JAPAN CAGED-FREE IN EGGS MARKET, BY TYPE, 2019-2028 (USD MILLION)
TABLE 72 JAPAN PROCESSED EGGS IN EGGS MARKET, BY TYPE, 2019-2028 (USD MILLION)
TABLE 73 JAPAN EGGS POWDER IN EGGS MARKET, BY TYPE, 2019-2028 (USD MILLION)
TABLE 74 JAPAN LIQUID EGGS IN EGGS MARKET, BY TYPE, 2019-2028 (USD MILLION)
TABLE 75 JAPAN FROZEN EGGS IN EGGS MARKET, BY TYPE, 2019-2028 (USD MILLION)
TABLE 76 JAPAN DRIED EGGS IN EGGS MARKET, BY TYPE, 2019-2028 (USD MILLION)
TABLE 77 JAPAN SPECIALTY EGGS IN EGGS MARKET, BY TYPE, 2019-2028 (USD MILLION)
TABLE 78 JAPAN EGGS MARKET, BY SOURCE, 2019-2028 (USD MILLION)
TABLE 79 JAPAN PLANT-BASED EGGS IN EGGS MARKET, BY TYPE, 2019-2028 (USD MILLION)
TABLE 80 JAPAN ANIMAL BASED EGGS IN EGGS MARKET, BY TYPE, 2019-2028 (USD MILLION)
TABLE 81 JAPAN EGGS MARKET, BY CATEGORY, 2019-2028 (USD MILLION)
TABLE 82 JAPAN EGGS MARKET, BY PACKAGING TYPE, 2019-2028 (USD MILLION)
TABLE 83 JAPAN EGGS MARKET, BY SPECIALTY, 2019-2028 (USD MILLION)
TABLE 84 JAPAN EGGS MARKET, BY END USER, 2019-2028 (USD MILLION)
TABLE 85 JAPAN FOOD SERVICE SECTOR IN EGGS MARKET, BY TYPE, 2019-2028 (USD MILLION)
TABLE 86 JAPAN RESTAURANTS IN EGGS MARKET, BY TYPE, 2019-2028 (USD MILLION)
TABLE 87 JAPAN RESTAURANTS IN EGGS MARKET, BY SERVICE CATEGORY, 2019-2028 (USD MILLION)
TABLE 88 JAPAN EGGS MARKET, BY DISTRIBUTION CHANNEL, 2019-2028 (USD MILLION)
TABLE 89 JAPAN STORE BASED RETAILERS IN EGGS MARKET, BY TYPE, 2019-2028 (USD MILLION)
TABLE 90 CHINA EGGS MARKET, BY PRODUCT TYPE, 2019-2028 (USD MILLION)
TABLE 91 CHINA SHELL EGGS IN EGGS MARKET, BY TYPE, 2019-2028 (USD MILLION)
TABLE 92 CHINA CAGED IN EGGS MARKET, BY TYPE, 2019-2028 (USD MILLION)
TABLE 93 CHINA CAGED-FREE IN EGGS MARKET, BY TYPE, 2019-2028 (USD MILLION)
TABLE 94 CHINA PROCESSED EGGS IN EGGS MARKET, BY TYPE, 2019-2028 (USD MILLION)
TABLE 95 CHINA EGGS POWDER IN EGGS MARKET, BY TYPE, 2019-2028 (USD MILLION)
TABLE 96 CHINA LIQUID EGGS IN EGGS MARKET, BY TYPE, 2019-2028 (USD MILLION)
TABLE 97 CHINA FROZEN EGGS IN EGGS MARKET, BY TYPE, 2019-2028 (USD MILLION)
TABLE 98 CHINA DRIED EGGS IN EGGS MARKET, BY TYPE, 2019-2028 (USD MILLION)
TABLE 99 CHINA SPECIALTY EGGS IN EGGS MARKET, BY TYPE, 2019-2028 (USD MILLION)
TABLE 100 CHINA EGGS MARKET, BY SOURCE, 2019-2028 (USD MILLION)
TABLE 101 CHINA PLANT-BASED EGGS IN EGGS MARKET, BY TYPE, 2019-2028 (USD MILLION)
TABLE 102 CHINA ANIMAL BASED EGGS IN EGGS MARKET, BY TYPE, 2019-2028 (USD MILLION)
TABLE 103 CHINA EGGS MARKET, BY CATEGORY, 2019-2028 (USD MILLION)
TABLE 104 CHINA EGGS MARKET, BY PACKAGING TYPE, 2019-2028 (USD MILLION)
TABLE 105 CHINA EGGS MARKET, BY SPECIALTY, 2019-2028 (USD MILLION)
TABLE 106 CHINA EGGS MARKET, BY END USER, 2019-2028 (USD MILLION)
TABLE 107 CHINA FOOD SERVICE SECTOR IN EGGS MARKET, BY TYPE, 2019-2028 (USD MILLION)
TABLE 108 CHINA RESTAURANTS IN EGGS MARKET, BY TYPE, 2019-2028 (USD MILLION)
TABLE 109 CHINA RESTAURANTS IN EGGS MARKET, BY SERVICE CATEGORY, 2019-2028 (USD MILLION)
TABLE 110 CHINA EGGS MARKET, BY DISTRIBUTION CHANNEL, 2019-2028 (USD MILLION)
TABLE 111 CHINA STORE BASED RETAILERS IN EGGS MARKET, BY TYPE, 2019-2028 (USD MILLION)
TABLE 112 SOUTH KOREA EGGS MARKET, BY PRODUCT TYPE, 2019-2028 (USD MILLION)
TABLE 113 SOUTH KOREA SHELL EGGS IN EGGS MARKET, BY TYPE, 2019-2028 (USD MILLION)
TABLE 114 SOUTH KOREA CAGED IN EGGS MARKET, BY TYPE, 2019-2028 (USD MILLION)
TABLE 115 SOUTH KOREA CAGED-FREE IN EGGS MARKET, BY TYPE, 2019-2028 (USD MILLION)
TABLE 116 SOUTH KOREA PROCESSED EGGS IN EGGS MARKET, BY TYPE, 2019-2028 (USD MILLION)
TABLE 117 SOUTH KOREA EGGS POWDER IN EGGS MARKET, BY TYPE, 2019-2028 (USD MILLION)
TABLE 118 SOUTH KOREA LIQUID EGGS IN EGGS MARKET, BY TYPE, 2019-2028 (USD MILLION)
TABLE 119 SOUTH KOREA FROZEN EGGS IN EGGS MARKET, BY TYPE, 2019-2028 (USD MILLION)
TABLE 120 SOUTH KOREA DRIED EGGS IN EGGS MARKET, BY TYPE, 2019-2028 (USD MILLION)
TABLE 121 SOUTH KOREA SPECIALTY EGGS IN EGGS MARKET, BY TYPE, 2019-2028 (USD MILLION)
TABLE 122 SOUTH KOREA EGGS MARKET, BY SOURCE, 2019-2028 (USD MILLION)
TABLE 123 SOUTH KOREA PLANT-BASED EGGS IN EGGS MARKET, BY TYPE, 2019-2028 (USD MILLION)
TABLE 124 SOUTH KOREA ANIMAL BASED EGGS IN EGGS MARKET, BY TYPE, 2019-2028 (USD MILLION)
TABLE 125 SOUTH KOREA EGGS MARKET, BY CATEGORY, 2019-2028 (USD MILLION)
TABLE 126 SOUTH KOREA EGGS MARKET, BY PACKAGING TYPE, 2019-2028 (USD MILLION)
TABLE 127 SOUTH KOREA EGGS MARKET, BY SPECIALTY, 2019-2028 (USD MILLION)
TABLE 128 SOUTH KOREA EGGS MARKET, BY END USER, 2019-2028 (USD MILLION)
TABLE 129 SOUTH KOREA FOOD SERVICE SECTOR IN EGGS MARKET, BY TYPE, 2019-2028 (USD MILLION)
TABLE 130 SOUTH KOREA RESTAURANTS IN EGGS MARKET, BY TYPE, 2019-2028 (USD MILLION)
TABLE 131 SOUTH KOREA RESTAURANTS IN EGGS MARKET, BY SERVICE CATEGORY, 2019-2028 (USD MILLION)
TABLE 132 SOUTH KOREA EGGS MARKET, BY DISTRIBUTION CHANNEL, 2019-2028 (USD MILLION)
TABLE 133 SOUTH KOREA STORE BASED RETAILERS IN EGGS MARKET, BY TYPE, 2019-2028 (USD MILLION)
TABLE 134 INDIA EGGS MARKET, BY PRODUCT TYPE, 2019-2028 (USD MILLION)
TABLE 135 INDIA SHELL EGGS IN EGGS MARKET, BY TYPE, 2019-2028 (USD MILLION)
TABLE 136 INDIA CAGED IN EGGS MARKET, BY TYPE, 2019-2028 (USD MILLION)
TABLE 137 INDIA CAGED-FREE IN EGGS MARKET, BY TYPE, 2019-2028 (USD MILLION)
TABLE 138 INDIA PROCESSED EGGS IN EGGS MARKET, BY TYPE, 2019-2028 (USD MILLION)
TABLE 139 INDIA EGGS POWDER IN EGGS MARKET, BY TYPE, 2019-2028 (USD MILLION)
TABLE 140 INDIA LIQUID EGGS IN EGGS MARKET, BY TYPE, 2019-2028 (USD MILLION)
TABLE 141 INDIA FROZEN EGGS IN EGGS MARKET, BY TYPE, 2019-2028 (USD MILLION)
TABLE 142 INDIA DRIED EGGS IN EGGS MARKET, BY TYPE, 2019-2028 (USD MILLION)
TABLE 143 INDIA SPECIALTY EGGS IN EGGS MARKET, BY TYPE, 2019-2028 (USD MILLION)
TABLE 144 INDIA EGGS MARKET, BY SOURCE, 2019-2028 (USD MILLION)
TABLE 145 INDIA PLANT-BASED EGGS IN EGGS MARKET, BY TYPE, 2019-2028 (USD MILLION)
TABLE 146 INDIA ANIMAL BASED EGGS IN EGGS MARKET, BY TYPE, 2019-2028 (USD MILLION)
TABLE 147 INDIA EGGS MARKET, BY CATEGORY, 2019-2028 (USD MILLION)
TABLE 148 INDIA EGGS MARKET, BY PACKAGING TYPE, 2019-2028 (USD MILLION)
TABLE 149 INDIA EGGS MARKET, BY SPECIALTY, 2019-2028 (USD MILLION)
TABLE 150 INDIA EGGS MARKET, BY END USER, 2019-2028 (USD MILLION)
TABLE 151 INDIA FOOD SERVICE SECTOR IN EGGS MARKET, BY TYPE, 2019-2028 (USD MILLION)
TABLE 152 INDIA RESTAURANTS IN EGGS MARKET, BY TYPE, 2019-2028 (USD MILLION)
TABLE 153 INDIA RESTAURANTS IN EGGS MARKET, BY SERVICE CATEGORY, 2019-2028 (USD MILLION)
TABLE 154 INDIA EGGS MARKET, BY DISTRIBUTION CHANNEL, 2019-2028 (USD MILLION)
TABLE 155 INDIA STORE BASED RETAILERS IN EGGS MARKET, BY TYPE, 2019-2028 (USD MILLION)
TABLE 156 AUSTRALIA EGGS MARKET, BY PRODUCT TYPE, 2019-2028 (USD MILLION)
TABLE 157 AUSTRALIA SHELL EGGS IN EGGS MARKET, BY TYPE, 2019-2028 (USD MILLION)
TABLE 158 AUSTRALIA CAGED IN EGGS MARKET, BY TYPE, 2019-2028 (USD MILLION)
TABLE 159 AUSTRALIA CAGED-FREE IN EGGS MARKET, BY TYPE, 2019-2028 (USD MILLION)
TABLE 160 AUSTRALIA PROCESSED EGGS IN EGGS MARKET, BY TYPE, 2019-2028 (USD MILLION)
TABLE 161 AUSTRALIA EGGS POWDER IN EGGS MARKET, BY TYPE, 2019-2028 (USD MILLION)
TABLE 162 AUSTRALIA LIQUID EGGS IN EGGS MARKET, BY TYPE, 2019-2028 (USD MILLION)
TABLE 163 AUSTRALIA FROZEN EGGS IN EGGS MARKET, BY TYPE, 2019-2028 (USD MILLION)
TABLE 164 AUSTRALIA DRIED EGGS IN EGGS MARKET, BY TYPE, 2019-2028 (USD MILLION)
TABLE 165 AUSTRALIA SPECIALTY EGGS IN EGGS MARKET, BY TYPE, 2019-2028 (USD MILLION)
TABLE 166 AUSTRALIA EGGS MARKET, BY SOURCE, 2019-2028 (USD MILLION)
TABLE 167 AUSTRALIA PLANT-BASED EGGS IN EGGS MARKET, BY TYPE, 2019-2028 (USD MILLION)
TABLE 168 AUSTRALIA ANIMAL BASED EGGS IN EGGS MARKET, BY TYPE, 2019-2028 (USD MILLION)
TABLE 169 AUSTRALIA EGGS MARKET, BY CATEGORY, 2019-2028 (USD MILLION)
TABLE 170 AUSTRALIA EGGS MARKET, BY PACKAGING TYPE, 2019-2028 (USD MILLION)
TABLE 171 AUSTRALIA EGGS MARKET, BY SPECIALTY, 2019-2028 (USD MILLION)
TABLE 172 AUSTRALIA EGGS MARKET, BY END USER, 2019-2028 (USD MILLION)
TABLE 173 AUSTRALIA FOOD SERVICE SECTOR IN EGGS MARKET, BY TYPE, 2019-2028 (USD MILLION)
TABLE 174 AUSTRALIA RESTAURANTS IN EGGS MARKET, BY TYPE, 2019-2028 (USD MILLION)
TABLE 175 AUSTRALIA RESTAURANTS IN EGGS MARKET, BY SERVICE CATEGORY, 2019-2028 (USD MILLION)
TABLE 176 AUSTRALIA EGGS MARKET, BY DISTRIBUTION CHANNEL, 2019-2028 (USD MILLION)
TABLE 177 AUSTRALIA STORE BASED RETAILERS IN EGGS MARKET, BY TYPE, 2019-2028 (USD MILLION)
TABLE 178 SINGAPORE EGGS MARKET, BY PRODUCT TYPE, 2019-2028 (USD MILLION)
TABLE 179 SINGAPORE SHELL EGGS IN EGGS MARKET, BY TYPE, 2019-2028 (USD MILLION)
TABLE 180 SINGAPORE CAGED IN EGGS MARKET, BY TYPE, 2019-2028 (USD MILLION)
TABLE 181 SINGAPORE CAGED-FREE IN EGGS MARKET, BY TYPE, 2019-2028 (USD MILLION)
TABLE 182 SINGAPORE PROCESSED EGGS IN EGGS MARKET, BY TYPE, 2019-2028 (USD MILLION)
TABLE 183 SINGAPORE EGGS POWDER IN EGGS MARKET, BY TYPE, 2019-2028 (USD MILLION)
TABLE 184 SINGAPORE LIQUID EGGS IN EGGS MARKET, BY TYPE, 2019-2028 (USD MILLION)
TABLE 185 SINGAPORE FROZEN EGGS IN EGGS MARKET, BY TYPE, 2019-2028 (USD MILLION)
TABLE 186 SINGAPORE DRIED EGGS IN EGGS MARKET, BY TYPE, 2019-2028 (USD MILLION)
TABLE 187 SINGAPORE SPECIALTY EGGS IN EGGS MARKET, BY TYPE, 2019-2028 (USD MILLION)
TABLE 188 SINGAPORE EGGS MARKET, BY SOURCE, 2019-2028 (USD MILLION)
TABLE 189 SINGAPORE PLANT-BASED EGGS IN EGGS MARKET, BY TYPE, 2019-2028 (USD MILLION)
TABLE 190 SINGAPORE ANIMAL BASED EGGS IN EGGS MARKET, BY TYPE, 2019-2028 (USD MILLION)
TABLE 191 SINGAPORE EGGS MARKET, BY CATEGORY, 2019-2028 (USD MILLION)
TABLE 192 SINGAPORE EGGS MARKET, BY PACKAGING TYPE, 2019-2028 (USD MILLION)
TABLE 193 SINGAPORE EGGS MARKET, BY SPECIALTY, 2019-2028 (USD MILLION)
TABLE 194 SINGAPORE EGGS MARKET, BY END USER, 2019-2028 (USD MILLION)
TABLE 195 SINGAPORE FOOD SERVICE SECTOR IN EGGS MARKET, BY TYPE, 2019-2028 (USD MILLION)
TABLE 196 SINGAPORE RESTAURANTS IN EGGS MARKET, BY TYPE, 2019-2028 (USD MILLION)
TABLE 197 SINGAPORE RESTAURANTS IN EGGS MARKET, BY SERVICE CATEGORY, 2019-2028 (USD MILLION)
TABLE 198 SINGAPORE EGGS MARKET, BY DISTRIBUTION CHANNEL, 2019-2028 (USD MILLION)
TABLE 199 SINGAPORE STORE BASED RETAILERS IN EGGS MARKET, BY TYPE, 2019-2028 (USD MILLION)
TABLE 200 THAILAND EGGS MARKET, BY PRODUCT TYPE, 2019-2028 (USD MILLION)
TABLE 201 THAILAND SHELL EGGS IN EGGS MARKET, BY TYPE, 2019-2028 (USD MILLION)
TABLE 202 THAILAND CAGED IN EGGS MARKET, BY TYPE, 2019-2028 (USD MILLION)
TABLE 203 THAILAND CAGED-FREE IN EGGS MARKET, BY TYPE, 2019-2028 (USD MILLION)
TABLE 204 THAILAND PROCESSED EGGS IN EGGS MARKET, BY TYPE, 2019-2028 (USD MILLION)
TABLE 205 THAILAND EGGS POWDER IN EGGS MARKET, BY TYPE, 2019-2028 (USD MILLION)
TABLE 206 THAILAND LIQUID EGGS IN EGGS MARKET, BY TYPE, 2019-2028 (USD MILLION)
TABLE 207 THAILAND FROZEN EGGS IN EGGS MARKET, BY TYPE, 2019-2028 (USD MILLION)
TABLE 208 THAILAND DRIED EGGS IN EGGS MARKET, BY TYPE, 2019-2028 (USD MILLION)
TABLE 209 THAILAND SPECIALTY EGGS IN EGGS MARKET, BY TYPE, 2019-2028 (USD MILLION)
TABLE 210 THAILAND EGGS MARKET, BY SOURCE, 2019-2028 (USD MILLION)
TABLE 211 THAILAND PLANT-BASED EGGS IN EGGS MARKET, BY TYPE, 2019-2028 (USD MILLION)
TABLE 212 THAILAND ANIMAL BASED EGGS IN EGGS MARKET, BY TYPE, 2019-2028 (USD MILLION)
TABLE 213 THAILAND EGGS MARKET, BY CATEGORY, 2019-2028 (USD MILLION)
TABLE 214 THAILAND EGGS MARKET, BY PACKAGING TYPE, 2019-2028 (USD MILLION)
TABLE 215 THAILAND EGGS MARKET, BY SPECIALTY, 2019-2028 (USD MILLION)
TABLE 216 THAILAND EGGS MARKET, BY END USER, 2019-2028 (USD MILLION)
TABLE 217 THAILAND FOOD SERVICE SECTOR IN EGGS MARKET, BY TYPE, 2019-2028 (USD MILLION)
TABLE 218 THAILAND RESTAURANTS IN EGGS MARKET, BY TYPE, 2019-2028 (USD MILLION)
TABLE 219 THAILAND RESTAURANTS IN EGGS MARKET, BY SERVICE CATEGORY, 2019-2028 (USD MILLION)
TABLE 220 THAILAND EGGS MARKET, BY DISTRIBUTION CHANNEL, 2019-2028 (USD MILLION)
TABLE 221 THAILAND STORE BASED RETAILERS IN EGGS MARKET, BY TYPE, 2019-2028 (USD MILLION)
TABLE 222 INDONESIA EGGS MARKET, BY PRODUCT TYPE, 2019-2028 (USD MILLION)
TABLE 223 INDONESIA SHELL EGGS IN EGGS MARKET, BY TYPE, 2019-2028 (USD MILLION)
TABLE 224 INDONESIA CAGED IN EGGS MARKET, BY TYPE, 2019-2028 (USD MILLION)
TABLE 225 INDONESIA CAGED-FREE IN EGGS MARKET, BY TYPE, 2019-2028 (USD MILLION)
TABLE 226 INDONESIA PROCESSED EGGS IN EGGS MARKET, BY TYPE, 2019-2028 (USD MILLION)
TABLE 227 INDONESIA EGGS POWDER IN EGGS MARKET, BY TYPE, 2019-2028 (USD MILLION)
TABLE 228 INDONESIA LIQUID EGGS IN EGGS MARKET, BY TYPE, 2019-2028 (USD MILLION)
TABLE 229 INDONESIA FROZEN EGGS IN EGGS MARKET, BY TYPE, 2019-2028 (USD MILLION)
TABLE 230 INDONESIA DRIED EGGS IN EGGS MARKET, BY TYPE, 2019-2028 (USD MILLION)
TABLE 231 INDONESIA SPECIALTY EGGS IN EGGS MARKET, BY TYPE, 2019-2028 (USD MILLION)
TABLE 232 INDONESIA EGGS MARKET, BY SOURCE, 2019-2028 (USD MILLION)
TABLE 233 INDONESIA PLANT-BASED EGGS IN EGGS MARKET, BY TYPE, 2019-2028 (USD MILLION)
TABLE 234 INDONESIA ANIMAL BASED EGGS IN EGGS MARKET, BY TYPE, 2019-2028 (USD MILLION)
TABLE 235 INDONESIA EGGS MARKET, BY CATEGORY, 2019-2028 (USD MILLION)
TABLE 236 INDONESIA EGGS MARKET, BY PACKAGING TYPE, 2019-2028 (USD MILLION)
TABLE 237 INDONESIA EGGS MARKET, BY SPECIALTY, 2019-2028 (USD MILLION)
TABLE 238 INDONESIA EGGS MARKET, BY END USER, 2019-2028 (USD MILLION)
TABLE 239 INDONESIA FOOD SERVICE SECTOR IN EGGS MARKET, BY TYPE, 2019-2028 (USD MILLION)
TABLE 240 INDONESIA RESTAURANTS IN EGGS MARKET, BY TYPE, 2019-2028 (USD MILLION)
TABLE 241 INDONESIA RESTAURANTS IN EGGS MARKET, BY SERVICE CATEGORY, 2019-2028 (USD MILLION)
TABLE 242 INDONESIA EGGS MARKET, BY DISTRIBUTION CHANNEL, 2019-2028 (USD MILLION)
TABLE 243 INDONESIA STORE BASED RETAILERS IN EGGS MARKET, BY TYPE, 2019-2028 (USD MILLION)
TABLE 244 PHILIPPINES EGGS MARKET, BY PRODUCT TYPE, 2019-2028 (USD MILLION)
TABLE 245 PHILIPPINES SHELL EGGS IN EGGS MARKET, BY TYPE, 2019-2028 (USD MILLION)
TABLE 246 PHILIPPINES CAGED IN EGGS MARKET, BY TYPE, 2019-2028 (USD MILLION)
TABLE 247 PHILIPPINES CAGED-FREE IN EGGS MARKET, BY TYPE, 2019-2028 (USD MILLION)
TABLE 248 PHILIPPINES PROCESSED EGGS IN EGGS MARKET, BY TYPE, 2019-2028 (USD MILLION)
TABLE 249 PHILIPPINES EGGS POWDER IN EGGS MARKET, BY TYPE, 2019-2028 (USD MILLION)
TABLE 250 PHILIPPINES LIQUID EGGS IN EGGS MARKET, BY TYPE, 2019-2028 (USD MILLION)
TABLE 251 PHILIPPINES FROZEN EGGS IN EGGS MARKET, BY TYPE, 2019-2028 (USD MILLION)
TABLE 252 PHILIPPINES DRIED EGGS IN EGGS MARKET, BY TYPE, 2019-2028 (USD MILLION)
TABLE 253 PHILIPPINES SPECIALTY EGGS IN EGGS MARKET, BY TYPE, 2019-2028 (USD MILLION)
TABLE 254 PHILIPPINES EGGS MARKET, BY SOURCE, 2019-2028 (USD MILLION)
TABLE 255 PHILIPPINES PLANT-BASED EGGS IN EGGS MARKET, BY TYPE, 2019-2028 (USD MILLION)
TABLE 256 PHILIPPINES ANIMAL BASED EGGS IN EGGS MARKET, BY TYPE, 2019-2028 (USD MILLION)
TABLE 257 PHILIPPINES EGGS MARKET, BY CATEGORY, 2019-2028 (USD MILLION)
TABLE 258 PHILIPPINES EGGS MARKET, BY PACKAGING TYPE, 2019-2028 (USD MILLION)
TABLE 259 PHILIPPINES EGGS MARKET, BY SPECIALTY, 2019-2028 (USD MILLION)
TABLE 260 PHILIPPINES EGGS MARKET, BY END USER, 2019-2028 (USD MILLION)
TABLE 261 PHILIPPINES FOOD SERVICE SECTOR IN EGGS MARKET, BY TYPE, 2019-2028 (USD MILLION)
TABLE 262 PHILIPPINES RESTAURANTS IN EGGS MARKET, BY TYPE, 2019-2028 (USD MILLION)
TABLE 263 PHILIPPINES RESTAURANTS IN EGGS MARKET, BY SERVICE CATEGORY, 2019-2028 (USD MILLION)
TABLE 264 PHILIPPINES EGGS MARKET, BY DISTRIBUTION CHANNEL, 2019-2028 (USD MILLION)
TABLE 265 PHILIPPINES STORE BASED RETAILERS IN EGGS MARKET, BY TYPE, 2019-2028 (USD MILLION)
TABLE 266 MALAYSIA EGGS MARKET, BY PRODUCT TYPE, 2019-2028 (USD MILLION)
TABLE 267 MALAYSIA SHELL EGGS IN EGGS MARKET, BY TYPE, 2019-2028 (USD MILLION)
TABLE 268 MALAYSIA CAGED IN EGGS MARKET, BY TYPE, 2019-2028 (USD MILLION)
TABLE 269 MALAYSIA CAGED-FREE IN EGGS MARKET, BY TYPE, 2019-2028 (USD MILLION)
TABLE 270 MALAYSIA PROCESSED EGGS IN EGGS MARKET, BY TYPE, 2019-2028 (USD MILLION)
TABLE 271 MALAYSIA EGGS POWDER IN EGGS MARKET, BY TYPE, 2019-2028 (USD MILLION)
TABLE 272 MALAYSIA LIQUID EGGS IN EGGS MARKET, BY TYPE, 2019-2028 (USD MILLION)
TABLE 273 MALAYSIA FROZEN EGGS IN EGGS MARKET, BY TYPE, 2019-2028 (USD MILLION)
TABLE 274 MALAYSIA DRIED EGGS IN EGGS MARKET, BY TYPE, 2019-2028 (USD MILLION)
TABLE 275 MALAYSIA SPECIALTY EGGS IN EGGS MARKET, BY TYPE, 2019-2028 (USD MILLION)
TABLE 276 MALAYSIA EGGS MARKET, BY SOURCE, 2019-2028 (USD MILLION)
TABLE 277 MALAYSIA PLANT-BASED EGGS IN EGGS MARKET, BY TYPE, 2019-2028 (USD MILLION)
TABLE 278 MALAYSIA ANIMAL BASED EGGS IN EGGS MARKET, BY TYPE, 2019-2028 (USD MILLION)
TABLE 279 MALAYSIA EGGS MARKET, BY CATEGORY, 2019-2028 (USD MILLION)
TABLE 280 MALAYSIA EGGS MARKET, BY PACKAGING TYPE, 2019-2028 (USD MILLION)
TABLE 281 MALAYSIA EGGS MARKET, BY SPECIALTY, 2019-2028 (USD MILLION)
TABLE 282 MALAYSIA EGGS MARKET, BY END USER, 2019-2028 (USD MILLION)
TABLE 283 MALAYSIA FOOD SERVICE SECTOR IN EGGS MARKET, BY TYPE, 2019-2028 (USD MILLION)
TABLE 284 MALAYSIA RESTAURANTS IN EGGS MARKET, BY TYPE, 2019-2028 (USD MILLION)
TABLE 285 MALAYSIA RESTAURANTS IN EGGS MARKET, BY SERVICE CATEGORY, 2019-2028 (USD MILLION)
TABLE 286 MALAYSIA EGGS MARKET, BY DISTRIBUTION CHANNEL, 2019-2028 (USD MILLION)
TABLE 287 MALAYSIA STORE BASED RETAILERS IN EGGS MARKET, BY TYPE, 2019-2028 (USD MILLION)
TABLE 288 REST OF ASIA-PACIFIC EGGS MARKET, BY PRODUCT TYPE, 2019-2028 (USD MILLION)
Lista de Figura
FIGURE 1 ASIA PACIFIC EGGS MARKET: SEGMENTATION
FIGURE 2 ASIA PACIFIC EGGS MARKET: DATA TRIANGULATION
FIGURE 3 ASIA PACIFIC EGGS MARKET: DROC ANALYSIS
FIGURE 4 ASIA PACIFIC EGGS MARKET: ASIA PACIFIC VS REGIONAL MARKET ANALYSIS
FIGURE 5 ASIA PACIFIC EGGS MARKET: COMPANY RESEARCH ANALYSIS
FIGURE 6 ASIA PACIFIC EGGS MARKET: INTERVIEW DEMOGRAPHICS
FIGURE 9 ASIA PACIFIC EGGS MARKET: SEGMENTATION
FIGURE 10 ASIA-PACIFIC IS EXPECTED TO DOMINATE AS WELL AS GROW WITH THE HIGHEST CAGR IN THE FORECAST PERIOD OF 2021 TO 2028
FIGURE 11 INCREASING NUMBER OF HEALTH-CONSCIOUS CONSUMERS AND VEGAN POPULATION ARE EXPECTED TO DRIVE ASIA PACIFIC EGGS MARKET IN THE FORECAST PERIOD OF 2021 TO 2028
FIGURE 12 SHELL EGG SEGMENT IS EXPECTED TO ACCOUNT FOR THE LARGEST SHARE OF THE ASIA PACIFIC EGGS MARKET IN 2021 & 2028
FIGURE 13 VALUE CHAIN OF ASIA PACIFIC EGGS MARKET
FIGURE 14 SUPPLY CHAIN ANALYSIS- ASIA PACIFIC EGGS MARKET
FIGURE 15 DRIVERS, RESTRAINTS, OPPORTUNITIES, AND CHALLENGES OF ASIA PACIFIC EGG MARKET
FIGURE 16 EUROPE: THE COUNTRIES WITH THE HIGHEST ORGANIC SHARES OF THE TOTAL MARKET IN 2017
FIGURE 17 ASIA PACIFIC EGGS MARKET, BY PRODUCT TYPE, 2020
FIGURE 18 ASIA PACIFIC EGGS MARKET, BY END USER, 2020
FIGURE 19 ASIA PACIFIC EGGS MARKET, BY SOURCE, 2020
FIGURE 20 ASIA PACIFIC EGGS MARKET, BY CATEGORY, 2020
FIGURE 21 ASIA PACIFIC EGGS MARKET, BY PACKAGING TYPE, 2020
FIGURE 22 ASIA PACIFIC EGGS MARKET, BY SPECIALTY, 2020
FIGURE 23 ASIA PACIFIC EGGS MARKET, BY DISTRIBUTION CHANNEL, 2020
FIGURE 24 ASIA-PACIFIC EGGS MARKET: SNAPSHOT (2020)
FIGURE 25 ASIA-PACIFIC EGGS MARKET: BY COUNTRY (2020)
FIGURE 26 ASIA-PACIFIC EGGS MARKET: BY COUNTRY (2021 & 2028)
FIGURE 27 ASIA-PACIFIC EGGS MARKET: BY COUNTRY (2020 & 2028)
FIGURE 28 ASIA-PACIFIC EGGS MARKET: BY PRODUCT TYPE (2021 & 2028)
FIGURE 29 ASIA PACIFIC EGGS MARKET: COMPANY SHARE 2020 (%)
Metodologia de Investigação
A recolha de dados e a análise do ano base são feitas através de módulos de recolha de dados com amostras grandes. A etapa inclui a obtenção de informações de mercado ou dados relacionados através de diversas fontes e estratégias. Inclui examinar e planear antecipadamente todos os dados adquiridos no passado. Da mesma forma, envolve o exame de inconsistências de informação observadas em diferentes fontes de informação. Os dados de mercado são analisados e estimados utilizando modelos estatísticos e coerentes de mercado. Além disso, a análise da quota de mercado e a análise das principais tendências são os principais fatores de sucesso no relatório de mercado. Para saber mais, solicite uma chamada de analista ou abra a sua consulta.
A principal metodologia de investigação utilizada pela equipa de investigação do DBMR é a triangulação de dados que envolve a mineração de dados, a análise do impacto das variáveis de dados no mercado e a validação primária (especialista do setor). Os modelos de dados incluem grelha de posicionamento de fornecedores, análise da linha de tempo do mercado, visão geral e guia de mercado, grelha de posicionamento da empresa, análise de patentes, análise de preços, análise da quota de mercado da empresa, normas de medição, análise global versus regional e de participação dos fornecedores. Para saber mais sobre a metodologia de investigação, faça uma consulta para falar com os nossos especialistas do setor.
Personalização disponível
A Data Bridge Market Research é líder em investigação formativa avançada. Orgulhamo-nos de servir os nossos clientes novos e existentes com dados e análises que correspondem e atendem aos seus objetivos. O relatório pode ser personalizado para incluir análise de tendências de preços de marcas-alvo, compreensão do mercado para países adicionais (solicite a lista de países), dados de resultados de ensaios clínicos, revisão de literatura, mercado remodelado e análise de base de produtos . A análise de mercado dos concorrentes-alvo pode ser analisada desde análises baseadas em tecnologia até estratégias de carteira de mercado. Podemos adicionar quantos concorrentes necessitar de dados no formato e estilo de dados que procura. A nossa equipa de analistas também pode fornecer dados em tabelas dinâmicas de ficheiros Excel em bruto (livro de factos) ou pode ajudá-lo a criar apresentações a partir dos conjuntos de dados disponíveis no relatório.

