

Asia Pacific Business Process As A Service Bpaas Market
Tamanho do mercado em biliões de dólares
CAGR :
% 
 USD
7.10 Billion
USD
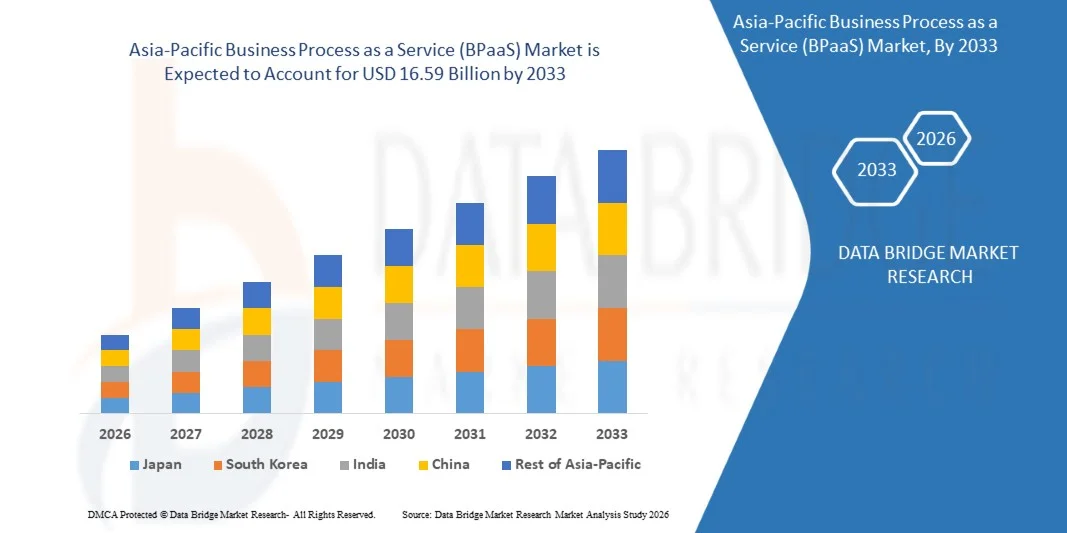
16.59 Billion
2025
2033
USD
7.10 Billion
USD
16.59 Billion
2025
2033
| 2026 –2033 | |
| USD 7.10 Billion | |
| USD 16.59 Billion | |
| % | |
|
Segmentação do mercado de Business Process as a Service (BPaaS) na Ásia-Pacífico, por solução (plataforma e serviços), modelo de implantação (nuvem pública, nuvem privada e híbrida), processo de negócio (finanças e contabilidade, recursos humanos (RH e folha de pagamento), vendas e marketing, atendimento e suporte ao cliente (experiência do cliente), operações, análise de dados, compras e gestão da cadeia de suprimentos e outros), porte da organização (grandes empresas e pequenas e médias empresas (PMEs)), aplicação (suporte, gestão, operação e área de mercado conectada), modelo de entrega em nuvem (serviço de processo de negócio baseado em SaaS (serviço SAASBP), serviço de processo de negócio baseado em PaaS (serviço PAASBP) e serviço de processo de negócio baseado em IaaS (serviço IaaS BP), usuário final (bancos, serviços financeiros e seguros (BFSI), governo, TI e telecomunicações, manufatura, saúde, varejo e comércio eletrônico, mídia e entretenimento e outros) - tendências e previsões do setor até 2033
Tamanho do mercado de Business Process as a Service (BPaaS) na região Ásia-Pacífico
- O mercado de processos de negócios como serviço (BPaaS) na região Ásia-Pacífico foi avaliado em US$ 7,10 bilhões em 2025 e deverá atingir US$ 16,59 bilhões até 2033 , com uma taxa de crescimento anual composta (CAGR) de 11,19% durante o período de previsão.
- O crescimento do mercado é impulsionado principalmente pela crescente adoção da computação em nuvem, automação e iniciativas de transformação digital em empresas que buscam aumentar a eficiência operacional e a relação custo-benefício.
- A crescente integração de inteligência artificial (IA), aprendizado de máquina (ML) e análise de dados em soluções BPaaS também está impulsionando a demanda por automação inteligente de processos de negócios em diversos setores.
Análise do mercado de Processos de Negócio como Serviço (BPaaS) na região Ásia-Pacífico
- O mercado de BPaaS está testemunhando um rápido crescimento à medida que as organizações migram de modelos tradicionais de terceirização para plataformas flexíveis de prestação de serviços baseadas em nuvem. Essas soluções permitem que as empresas otimizem fluxos de trabalho, melhorem a escalabilidade e alcancem um tempo de lançamento no mercado mais rápido.
- As empresas estão cada vez mais utilizando BPaaS para automatizar funções administrativas repetitivas, como recursos humanos, finanças e atendimento ao cliente, concentrando-se assim na inovação do negócio principal e no crescimento estratégico.
- O mercado chinês de Business Process as a Service (BPaaS) detinha a maior participação de receita na região Ásia-Pacífico em 2025, impulsionado pela transformação digital em curso no país e pela ênfase em modelos de serviço baseados em nuvem.
- Prevê-se que o Japão registre a maior taxa de crescimento anual composta (CAGR) no mercado de processos de negócios como serviço (BPaaS) da região Ásia-Pacífico, devido ao crescente foco na otimização de processos, inovação tecnológica e à integração cada vez maior de soluções BPaaS em setores como finanças, manufatura e serviços de TI.
- O segmento de serviços detinha a maior participação na receita de mercado em 2025, impulsionado pela crescente demanda por serviços de processos gerenciados que permitem às empresas se concentrarem em suas operações principais, terceirizando funções não essenciais para provedores especializados. A crescente necessidade de flexibilidade, escalabilidade e redução de custos operacionais acelerou ainda mais a adoção de serviços BPaaS em diversos setores.
Escopo do relatório e segmentação do mercado de Processos de Negócio como Serviço (BPaaS) na região Ásia-Pacífico
|
Atributos |
Principais insights do mercado de Processos de Negócio como Serviço (BPaaS) na região Ásia-Pacífico |
|
Segmentos abrangidos |
|
|
Países abrangidos |
Ásia-Pacífico
|
|
Principais participantes do mercado |
|
|
Oportunidades de mercado |
|
|
Conjuntos de informações de dados de valor agregado |
Além de informações de mercado como valor de mercado, taxa de crescimento, segmentos de mercado, cobertura geográfica, participantes do mercado e cenário de mercado, o relatório de mercado elaborado pela equipe da Data Bridge Market Research inclui análises aprofundadas de especialistas, análises de importação/exportação, análises de preços, análises de produção e consumo e análises PESTEL. |
Tendências do mercado de Processos de Negócio como Serviço (BPaaS) na região Ásia-Pacífico
“A Ascensão da Automação Habilitada por IA nos Processos de Negócios”
- A crescente integração de inteligência artificial (IA) e aprendizado de máquina (ML) em soluções BPaaS está transformando as operações empresariais, possibilitando análises preditivas, tomada de decisões inteligentes e fluxos de trabalho automatizados. As organizações estão utilizando essas tecnologias para reduzir a intervenção manual, aumentar a precisão e acelerar a execução de processos de negócios em diversas funções, como finanças, recursos humanos e gestão da cadeia de suprimentos.
- A demanda por automação está crescendo rapidamente, à medida que as empresas buscam minimizar custos, aumentar a eficiência e se adaptar às flutuações do mercado. As soluções BPaaS baseadas em IA estão ajudando as empresas a otimizar tarefas repetitivas, padronizar processos e aumentar a capacidade de resposta, resultando em maior produtividade e prazos de entrega mais rápidos.
- A incorporação de automação robótica de processos (RPA), computação cognitiva e processamento de linguagem natural (PLN) em ofertas de BPaaS está expandindo as capacidades de otimização de processos. As empresas estão aproveitando esses avanços para gerenciar grandes volumes de dados, fortalecer a conformidade e aprimorar o engajamento do cliente por meio da prestação de serviços inteligentes.
- Por exemplo, diversas empresas multinacionais implementaram sistemas BPaaS baseados em IA para automatizar o processamento de faturas, reduzindo o tempo de processamento em mais de 40% e eliminando erros manuais. Da mesma forma, provedores globais de serviços financeiros adotaram análises preditivas em BPaaS para aprimorar a avaliação de riscos e a eficiência operacional.
- Embora a automação impulsionada por IA continue a redefinir as operações comerciais, seu pleno potencial depende de integração segura, pessoal qualificado e estruturas robustas de governança de dados. As organizações devem investir em treinamento da força de trabalho, transparência de processos e segurança cibernética para aproveitar efetivamente os benefícios da IA em BPaaS.
Dinâmica do mercado de Processos de Negócio como Serviço (BPaaS) na região Ásia-Pacífico
Motorista
“Adoção crescente de soluções de processos de negócios baseadas em nuvem”
- A crescente adoção da computação em nuvem em diversos setores está impulsionando o crescimento do BPaaS, à medida que as empresas buscam soluções escaláveis, econômicas e ágeis para otimizar suas operações. O BPaaS baseado em nuvem elimina a necessidade de grandes investimentos em infraestrutura, oferecendo flexibilidade, acessibilidade em tempo real e implantação rápida.
- As empresas estão integrando cada vez mais o BPaaS em áreas-chave como suporte ao cliente, gestão de folha de pagamento e compras. Essa integração permite fluxos de trabalho automatizados, gestão centralizada de dados e melhor colaboração entre equipes geograficamente dispersas, impulsionando uma maior eficácia operacional.
- O crescente foco na transformação digital acelerou a transição da terceirização tradicional de processos de negócios (BPO) para o BPaaS baseado em nuvem. As empresas se beneficiam de maior transparência, melhoria na prestação de serviços e da capacidade de otimizar continuamente os processos por meio de análises e automação integradas.
- Por exemplo, empresas globais de tecnologia migraram suas funções de RH e contabilidade para plataformas BPaaS baseadas em nuvem, resultando em maior escalabilidade e monitoramento de desempenho em tempo real. Da mesma forma, empresas de e-commerce estão utilizando BPaaS para gerenciar o processamento de pedidos e o relacionamento com o cliente de forma integrada em diversos canais.
- Embora o BPaaS baseado em nuvem possibilite eficiência e inovação, garantir a privacidade dos dados, a conformidade e a interoperabilidade dos sistemas continua sendo vital. As empresas devem adotar medidas de segurança em múltiplas camadas.
Restrição/Desafio
“Preocupações com a segurança de dados e complexidade da integração”
- A segurança de dados continua sendo um dos principais desafios que dificultam a adoção de BPaaS, visto que as plataformas baseadas em nuvem envolvem o armazenamento e o processamento de dados organizacionais sensíveis. O crescente risco de ataques cibernéticos, acesso não autorizado e violações de conformidade tornou a proteção de dados uma prioridade máxima para as empresas que adotam BPaaS.
- A integração de soluções BPaaS com sistemas de TI legados apresenta uma complexidade significativa, visto que as infraestruturas mais antigas frequentemente carecem de compatibilidade com aplicações baseadas na nuvem. Esses desafios podem atrasar a implementação, aumentar os custos operacionais e reduzir os benefícios esperados em termos de eficiência com a automação de processos.
- A escassez de profissionais de TI qualificados e especialistas em automação de processos limita ainda mais a implementação e a gestão eficazes de soluções BPaaS. As organizações frequentemente enfrentam dificuldades para manter fluxos de trabalho otimizados e aproveitar recursos analíticos avançados devido à limitada expertise técnica interna.
- Por exemplo, várias grandes empresas que adotaram BPaaS para gestão financeira relataram atrasos na integração devido a sistemas ERP legados e restrições relacionadas à conformidade. Em outros casos, os desafios na migração de dados causaram interrupções temporárias nos serviços durante as fases de implementação.
- Embora a adoção de BPaaS continue a se expandir, superar os desafios relacionados à segurança de dados, à complexidade da integração e à preparação da força de trabalho é crucial. Os esforços colaborativos entre fornecedores de tecnologia, empresas de cibersegurança e corporações desempenharão um papel fundamental para garantir a implementação segura e eficiente de soluções de BPaaS em todo o mundo.
Escopo do mercado de Processos de Negócio como Serviço (BPaaS) na região Ásia-Pacífico
O mercado é segmentado com base na solução, modelo de implantação, processo de negócios, tamanho da organização, aplicação, modelo de entrega em nuvem e usuário final.
• Por solução
Com base na solução, o mercado de Business Process as a Service (BPaaS) da região Ásia-Pacífico é segmentado em plataforma e serviços. O segmento de serviços detinha a maior participação na receita de mercado em 2025, impulsionado pela crescente demanda por serviços de processos gerenciados que permitem às empresas se concentrarem em suas operações principais, terceirizando funções não essenciais para provedores especializados. A crescente necessidade de flexibilidade, escalabilidade e redução de custos operacionais acelerou ainda mais a adoção de serviços de BPaaS em diversos setores.
Espera-se que o segmento de plataformas apresente a taxa de crescimento mais rápida de 2026 a 2033, impulsionado pelos avanços em tecnologias de automação e integração em nuvem. Essas plataformas permitem que as organizações otimizem fluxos de trabalho, melhorem a precisão dos dados e aprimorem a tomada de decisões por meio de análises avançadas e recursos de orquestração de processos.
• Por modelo de implantação
Com base no modelo de implantação, o mercado é segmentado em nuvem pública, nuvem privada e híbrida. O segmento de nuvem pública dominou o mercado em 2025, devido à sua relação custo-benefício, escalabilidade e facilidade de implementação, o que o torna adequado para organizações que buscam uma rápida transformação digital. As soluções BPaaS em nuvem pública oferecem alocação flexível de recursos e integração perfeita em diversos processos de negócios.
O segmento de nuvem híbrida deverá apresentar o crescimento mais rápido entre 2026 e 2033, impulsionado pela crescente preferência por controle e segurança de dados, aliada à escalabilidade dos ambientes de nuvem. Os modelos híbridos permitem que as empresas mantenham dados sensíveis em infraestrutura privada, ao mesmo tempo que aproveitam a agilidade da nuvem pública para cargas de trabalho não críticas.
• Por processo de negócio
Com base nos processos de negócios, o mercado é segmentado em finanças e contabilidade, recursos humanos (RH e folha de pagamento), vendas e marketing, atendimento e suporte ao cliente (experiência do cliente), operações, análise de dados, compras e gestão da cadeia de suprimentos, entre outros. O segmento de finanças e contabilidade detinha a maior participação em 2025 devido à alta demanda por serviços automatizados de faturamento, gestão de despesas e acompanhamento de conformidade. Esses processos estão sendo cada vez mais digitalizados para garantir precisão e eficiência.
Espera-se que o segmento de análise de dados apresente a maior taxa de crescimento anual composta (CAGR) de 2026 a 2033, à medida que as organizações aproveitam insights baseados em dados para otimização de processos e tomada de decisões. A integração de ferramentas avançadas de análise de dados em soluções BPaaS ajuda as empresas a aprimorarem a previsão, melhorarem o monitoramento de desempenho e impulsionarem a excelência operacional.
• Por tamanho da organização
Com base no porte da organização, o mercado é dividido em grandes empresas e pequenas e médias empresas (PMEs). As grandes empresas detiveram a maior participação de mercado em 2025 devido à sua ampla adoção de BPaaS para otimizar fluxos de trabalho complexos, reduzir custos indiretos e aprimorar a colaboração interfuncional.
Espera-se que o segmento de PMEs apresente a taxa de crescimento mais rápida entre 2026 e 2033, impulsionado pela crescente disponibilidade de soluções BPaaS (Business Platform as a Service) acessíveis e baseadas em nuvem. Essas soluções permitem que empresas menores acessem ferramentas de automação de processos e análise de dados de nível empresarial sem a necessidade de grandes investimentos em infraestrutura.
• Mediante inscrição
Com base na aplicação, o mercado é categorizado em áreas de suporte, gestão, operação e conectividade. O segmento operacional liderou o mercado em 2025 devido à forte ênfase na automação das atividades diárias e na melhoria da eficiência dos processos. As aplicações operacionais de BPaaS ajudam as empresas a aumentar a produtividade, minimizando a intervenção manual.
Prevê-se que o segmento de gestão cresça significativamente de 2026 a 2033, impulsionado pelo uso crescente de ferramentas baseadas na nuvem para monitoramento de desempenho, planejamento de recursos e integração de inteligência de negócios, visando apoiar a tomada de decisões estratégicas.
• Por modelo de entrega em nuvem
Com base no modelo de entrega em nuvem, o mercado é segmentado em serviços de processos de negócios baseados em SaaS (serviços SaaS-BP), serviços de processos de negócios baseados em PaaS (serviços PaaS-BP) e serviços de processos de negócios baseados em IaaS (serviços IaaS-BP). O segmento de serviços SaaS-BP dominou o mercado em 2025 devido à sua facilidade de implantação, custo-benefício e acessibilidade. Ele permite que as organizações utilizem ferramentas de automação de processos e gerenciamento de dados sem a necessidade de uma infraestrutura de TI complexa.
Espera-se que o segmento de serviços PAASBP apresente a taxa de crescimento mais rápida de 2026 a 2033, impulsionado por seu papel em facilitar a personalização de processos, o desenvolvimento de aplicativos e a flexibilidade de integração em ambientes de negócios complexos.
• Por usuário final
Com base no usuário final, o mercado é segmentado em bancos, serviços financeiros e seguros (BFSI), governo, TI e telecomunicações, manufatura, saúde, varejo e comércio eletrônico, mídia e entretenimento, e outros. O segmento BFSI detinha a maior participação de mercado em 2025, impulsionado pela adoção de BPaaS para gerenciamento de riscos, conformidade regulatória e relatórios financeiros automatizados.
Espera-se que o segmento de saúde experimente um crescimento rápido durante o período de 2026 a 2033, à medida que hospitais, seguradoras e prestadores de serviços de saúde utilizem cada vez mais o BPaaS para processamento de sinistros, gerenciamento de dados de pacientes e automação de fluxos de trabalho, visando melhorar a qualidade e a eficiência dos serviços.
Análise Regional do Mercado de Processos de Negócio como Serviço (BPaaS) na Ásia-Pacífico
- O mercado chinês de Business Process as a Service (BPaaS) detinha a maior participação de receita na região Ásia-Pacífico em 2025, impulsionado pela transformação digital em curso no país e pela ênfase em modelos de serviço baseados em nuvem.
- As empresas estão adotando cada vez mais soluções BPaaS para aumentar a eficiência operacional, reduzir custos e melhorar a experiência do cliente.
- O forte ecossistema de fornecedores de tecnologia nacionais e as iniciativas governamentais que promovem a digitalização em setores como manufatura, serviços financeiros e comércio eletrônico estão impulsionando ainda mais o crescimento.
Análise do Mercado Japonês de Processos de Negócio como Serviço (BPaaS)
O mercado japonês de Business Process as a Service (BPaaS) deverá apresentar o crescimento mais rápido entre 2026 e 2033, impulsionado pelo ecossistema tecnológico avançado do país e pelo foco na excelência operacional. As empresas estão utilizando soluções de BPaaS para aprimorar a agilidade dos negócios, aumentar a produtividade e apoiar a inovação digital. A integração de IA e análise de dados em plataformas de serviços está transformando as operações comerciais, enquanto a ênfase do Japão em qualidade, conformidade e eficiência continua a impulsionar a adoção de BPaaS em setores como manufatura, varejo e serviços financeiros.
Participação de mercado de Processos de Negócio como Serviço (BPaaS) na região Ásia-Pacífico
- Serviços de Consultoria Tata (Índia)
- Infosys Limited (Índia)
- Wipro Limited (Índia)
- HCL Technologies (Índia)
- Tech Mahindra (Índia)
- LTI – Larsen & Toubro Infotech (Índia)
- NTT DATA Corporation (Japão)
- Fujitsu Limited (Japão)
- Grupo Alibaba (China)
- Huawei Technologies Co., Ltd. (China)
Últimos desenvolvimentos no mercado de Processos de Negócio como Serviço (BPaaS) na região Ásia-Pacífico
- Em maio de 2020, a FUJITSU lançou a versão mais recente do DigitalSuite Process Modeler, da sua linha de produtos Fujitsu RunMyProcess. Esta automação de processos de negócios aprimorada permite o design de aplicações de forma mais eficiente, reduzindo o tempo necessário para projetar o fluxo de processos. O lançamento desta nova suíte digital contribuirá para a expansão do portfólio de produtos da empresa.
SKU-
Obtenha acesso online ao relatório sobre a primeira nuvem de inteligência de mercado do mundo

- Painel interativo de análise de dados
- Painel de análise da empresa para oportunidades de elevado potencial de crescimento
- Acesso de analista de pesquisa para personalização e customização. consultas
- Análise da concorrência com painel interativo
- Últimas notícias, atualizações e atualizações Análise de tendências
- Aproveite o poder da análise de benchmark para um rastreio abrangente da concorrência
Metodologia de Investigação
A recolha de dados e a análise do ano base são feitas através de módulos de recolha de dados com amostras grandes. A etapa inclui a obtenção de informações de mercado ou dados relacionados através de diversas fontes e estratégias. Inclui examinar e planear antecipadamente todos os dados adquiridos no passado. Da mesma forma, envolve o exame de inconsistências de informação observadas em diferentes fontes de informação. Os dados de mercado são analisados e estimados utilizando modelos estatísticos e coerentes de mercado. Além disso, a análise da quota de mercado e a análise das principais tendências são os principais fatores de sucesso no relatório de mercado. Para saber mais, solicite uma chamada de analista ou abra a sua consulta.
A principal metodologia de investigação utilizada pela equipa de investigação do DBMR é a triangulação de dados que envolve a mineração de dados, a análise do impacto das variáveis de dados no mercado e a validação primária (especialista do setor). Os modelos de dados incluem grelha de posicionamento de fornecedores, análise da linha de tempo do mercado, visão geral e guia de mercado, grelha de posicionamento da empresa, análise de patentes, análise de preços, análise da quota de mercado da empresa, normas de medição, análise global versus regional e de participação dos fornecedores. Para saber mais sobre a metodologia de investigação, faça uma consulta para falar com os nossos especialistas do setor.
Personalização disponível
A Data Bridge Market Research é líder em investigação formativa avançada. Orgulhamo-nos de servir os nossos clientes novos e existentes com dados e análises que correspondem e atendem aos seus objetivos. O relatório pode ser personalizado para incluir análise de tendências de preços de marcas-alvo, compreensão do mercado para países adicionais (solicite a lista de países), dados de resultados de ensaios clínicos, revisão de literatura, mercado remodelado e análise de base de produtos . A análise de mercado dos concorrentes-alvo pode ser analisada desde análises baseadas em tecnologia até estratégias de carteira de mercado. Podemos adicionar quantos concorrentes necessitar de dados no formato e estilo de dados que procura. A nossa equipa de analistas também pode fornecer dados em tabelas dinâmicas de ficheiros Excel em bruto (livro de factos) ou pode ajudá-lo a criar apresentações a partir dos conjuntos de dados disponíveis no relatório.

