
North America Invisible Orthodontics Market
시장 규모 (USD 10억)
연평균 성장률 :
% 
 USD
2,715.63 Million
USD
7,927.50 Million
2021
2029
USD
2,715.63 Million
USD
7,927.50 Million
2021
2029
| 2022 –2029 | |
| USD 2,715.63 Million | |
| USD 7,927.50 Million | |
| % | |
북미 보이지 않는 교정 시장, 제품 및 서비스별(제품 및 서비스), 연령대(성인, 청소년 및 어린이), 응용 분야( 부정교합 , 혼잡, 과도한 간격 및 기타), 최종 사용자( 병원치과교정 치과 및 기타), 유통 채널(직판 및 제3자 유통업체), 국가(미국, 캐나다, 멕시코 - 산업 동향 및 2029년까지의 예측.
시장 분석 및 통찰력 : 북미 보이지 않는 교정 시장
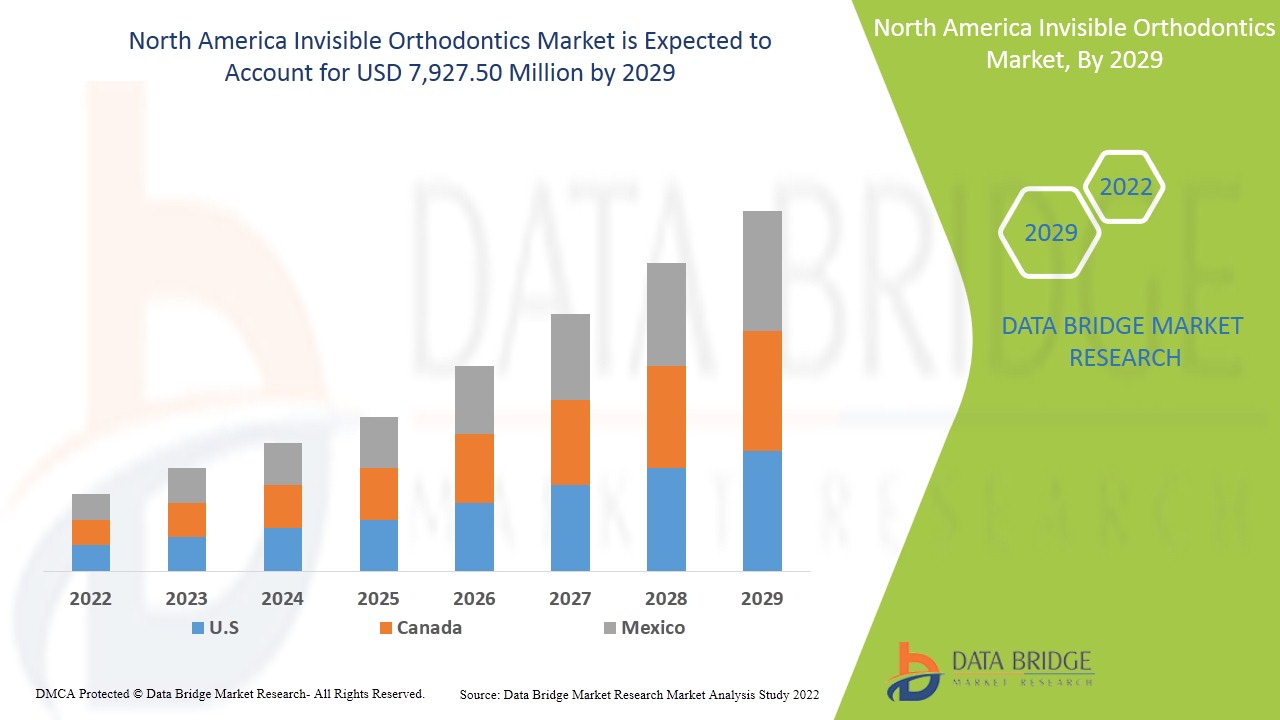
북미 보이지 않는 교정 시장은 2021년 2,715.63백만 달러에서 2029년까지 7,927.50백만 달러로 성장할 것으로 예상되며, 2022년에서 2029년까지의 예측 기간 동안 14.3%의 CAGR로 성장할 것입니다. 심미적 외관에 대한 수요 증가는 전 세계적으로 교정 치료에 대한 수요를 더욱 촉진했습니다. 따라서 부정교합의 증가는 보이지 않는 교정 시장 성장의 원동력으로 작용합니다.
보이지 않는 교정 시장은 혼잡한 치아, 과도한 간격 및 부정교합과 같은 사소한 치과 문제를 치료하기 위한 투명 교정기, 세라믹 교정기, 혀측 교정기 및 투명 리테이너와 같은 제품과 서비스를 취급합니다. 이러한 치료 옵션은 원하는 옵션과 더불어 이 치료 옵션이 제공하는 미적 매력으로 인해 큰 수요가 있으며, 또한 미용 치과에 대한 인식이 증가하여 보이지 않는 교정에 대한 수요가 더욱 증가했습니다. 공공 기관과 민간 기관은 데모 제공, 캠페인 실시 및 치과 검진 측면에서 고객의 변화하는 요구에 부응하는 데 주력하고 있습니다. 따라서 이러한 전략을 사용하면 보이지 않는 교정의 성장이 상당히 보장될 것입니다.
부정교합의 높은 유병률과 좋은 구강 위생에 대한 인식 증가는 전 세계적으로 보이지 않는 교정 시장 성장을 촉진하는 요인으로 작용할 것으로 예상됩니다. 그러나 보이지 않는 교정 치료의 높은 비용은 시장 성장을 저해하는 요인으로 작용할 것으로 예상됩니다. 시장 성장을 확대하기 위한 전략적 이니셔티브를 만들고 있는 많은 수의 시장 참여자가 시장 성장의 기회로 작용할 것으로 예상됩니다. 그러나 엄격한 정부 규제는 시장 성장에 도전이 될 수 있습니다.
북미 보이지 않는 치열교정 시장은 시장 점유율, 새로운 개발 및 제품 파이프라인 분석, 국내 및 지역 시장 참여자의 영향, 새로운 수익 창출, 시장 규정의 변화, 제품 승인, 전략적 의사 결정, 제품 출시, 지리적 확장 및 시장의 기술 혁신 측면에서의 분석 기회에 대한 세부 정보를 제공합니다. 분석 및 시장 시나리오를 이해하려면 분석가 브리핑을 위해 저희에게 연락하세요. 저희 팀은 원하는 목표를 달성하기 위한 수익 영향 솔루션을 만드는 데 도움을 드릴 것입니다.
북미 보이지 않는 교정 시장 범위 및 시장 규모
북미의 보이지 않는 교정치료 시장은 제품과 서비스, 연령대, 응용 분야, 최종 사용자, 유통 채널을 기준으로 주요 5개 부문으로 분류됩니다.
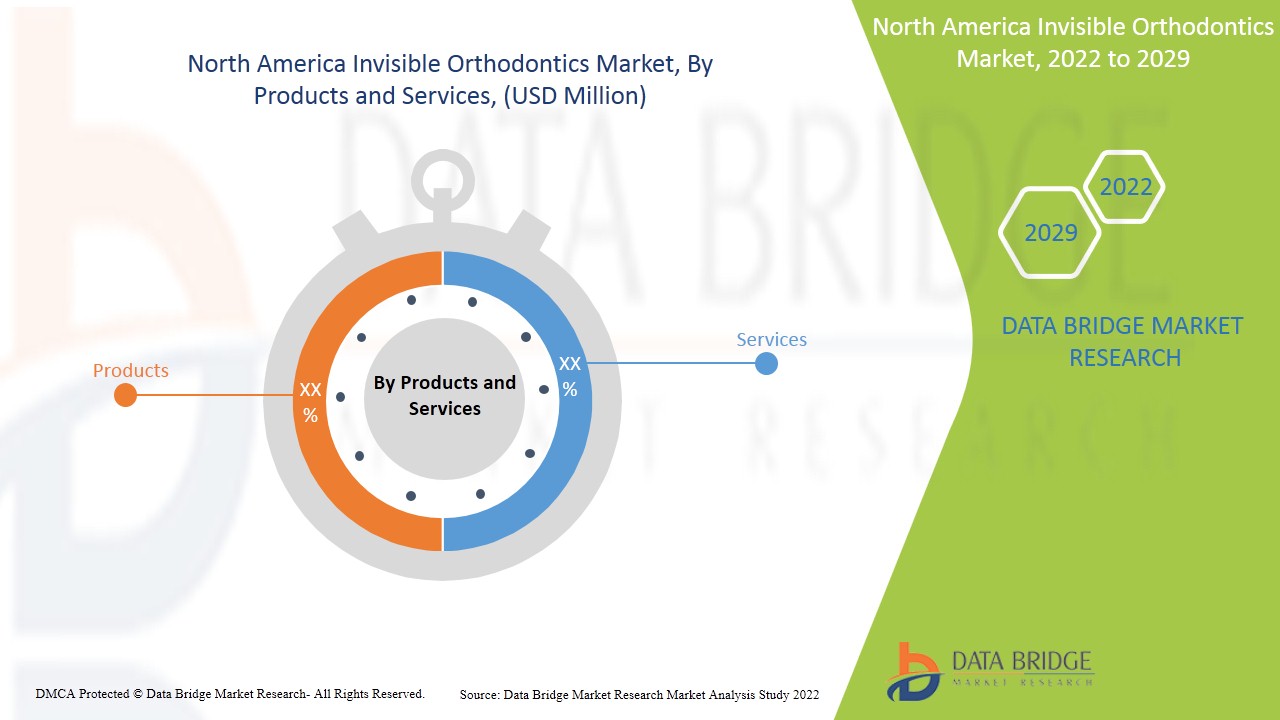
- 제품 및 서비스를 기준으로 북미 보이지 않는 교정 시장은 제품과 서비스로 세분화됩니다. 제품 세그먼트는 투명 교정기, 세라믹 교정기, 투명 리테이너 및 혀 교정기로 세분화됩니다. 2022년에는 다양한 유형의 교정기가 시장에 존재하기 때문에 제품 세그먼트가 북미 보이지 않는 교정 시장을 지배할 것으로 예상됩니다.
- 연령대를 기준으로 북미의 보이지 않는 교정 시장은 어린이, 성인, 청소년으로 세분화됩니다. 2022년에는 성인 인구 사이에서 이 치료에 대한 수요가 증가함에 따라 성인 세그먼트가 북미 보이지 않는 교정 시장을 지배할 것으로 예상됩니다.
- 적용을 기준으로 북미 보이지 않는 치열 교정 시장은 혼잡, 과도한 간격, 부정교합 및 기타로 세분화됩니다. 2022년에는 질병의 효과적인 치료로 이어지는 기술의 발전으로 인해 부정교합 세그먼트가 북미 보이지 않는 치열 교정 시장을 지배할 것으로 예상됩니다.
- 최종 사용자를 기준으로 북미의 보이지 않는 치열교정 시장은 병원, 치과, 치열교정 병원 등으로 세분화됩니다. 2022년에는 환자가 질병 진단 및 치료를 위해 병원을 방문함에 따라 최종 사용자 부문의 병원 세그먼트가 시장을 지배하게 될 것입니다.
- 유통 채널을 기준으로 북미 인비저블 치열교정 시장은 직접 판매와 제3자 유통업체로 세분화됩니다. 2022년에는 병원과 치과에서 수요가 증가함에 따라 유통 채널의 직접 판매 부문이 시장을 지배할 것입니다.
보이지 않는 교정 시장 국가 수준 분석
북미 보이지 않는 치열교정 시장을 분석하고 시장 규모 정보를 제품 및 서비스, 연령대, 응용 프로그램, 최종 사용자, 유통 채널별로 제공합니다. 북미 보이지 않는 치열교정 시장 보고서에서 다루는 국가는 미국, 캐나다, 멕시코입니다.
북미는 북미 국가와 마찬가지로 예측 기간 동안 14.3%의 CAGR로 성장할 것으로 예상되며, 보이지 않는 치열 교정 치료에 대한 수요가 증가하고 있습니다. 미국은 이 지역에 큰 시장 참여자가 있기 때문에 북미 시장을 지배할 것으로 예상됩니다.
보고서의 국가 섹션은 또한 개별 시장 영향 요인과 국내 시장의 현재 및 미래 트렌드에 영향을 미치는 규제 변화를 제공합니다. 신규 판매, 교체 판매, 국가 인구 통계, 규제 조치 및 수출입 관세와 같은 데이터 포인트는 개별 국가의 시장 시나리오를 예측하는 데 사용되는 주요 포인터 중 일부입니다. 또한 북미 브랜드의 존재 및 가용성과 지역 및 국내 브랜드와의 대규모 또는 희소한 경쟁으로 인해 직면한 과제, 판매 채널의 영향은 국가 데이터에 대한 예측 분석을 제공하는 동안 고려됩니다.
제조업체의 신제품 출시는 보이지 않는 교정 시장의 플레이어에게 새로운 기회를 창출합니다.
보이지 않는 치열교정 시장은 또한 보이지 않는 치열교정 시장 판매와 함께 미용 산업의 모든 국가적 성장에 대한 자세한 시장 분석, 보이지 않는 치열교정 시장 발전의 영향, 보이지 않는 치열교정 시장에 대한 지원과 함께 규제 시나리오의 변화를 제공합니다. 이 데이터는 2011년부터 2020년까지의 과거 기간에 대해 제공됩니다.
경쟁 환경 및 보이지 않는 교정 시장 점유율 분석
보이지 않는 치열교정 시장 경쟁 구도는 경쟁자별 세부 정보를 제공합니다. 포함된 세부 정보에는 회사 개요, 회사 재무, 창출된 수익, 시장 잠재력, 연구 개발 투자, 새로운 시장 이니셔티브, 생산 현장 및 시설, 회사의 강점과 약점, 제품 출시, 제품 시험 파이프라인, 제품 승인, 특허, 제품 폭 및 호흡, 응용 프로그램 우세, 기술 수명선 곡선이 있습니다. 제공된 위의 데이터 포인트는 보이지 않는 치열교정 시장과 관련된 회사의 초점에만 관련이 있습니다.
북미 투명 교정 시장의 주요 기업으로는 3M, Candid Care Co., Henry Schein Orthodontics(Henry Schein, Inc.의 자회사), TP Orthodontics, Inc., G&H Orthodontics, Great Lakes Dental Technologies, DynaFlex, American Orthodontics, Align Technology, Inc., Rocky Mountain Orthodontics, DB Orthodontics, DENTAURUM GmbH & Co. KG, ALIGNERCO, Institut Straumann AG, Ormco Corporation(Envista의 자회사), Dentsply Sirona, SmileDirectClub 등이 있습니다.
또한 전 세계 여러 회사에서 많은 제품 출시와 계약을 체결하면서 보이지 않는 치열교정 시장도 가속화되고 있습니다.
예를 들어,
- 2020년 4월, American Orthodontics는 투명한 심미적 브라켓인 Empower 2 Clear라는 신제품 출시를 발표했습니다. 이 회사가 출시한 이 신제품과 보이지 않는 교정에 대한 수요 증가로 시장에서의 수요와 판매가 증가하여 향후 수익이 증가할 것입니다.
회사가 출시한 이 신제품은 시장에서 단백질 추정 포트폴리오를 늘렸습니다. 시장 참여자의 협업, 합작 투자 및 기타 전략은 보이지 않는 치열 교정 시장에서 회사 시장을 강화하고 있으며, 이는 조직이 보이지 않는 치열 교정 시장에 대한 제안을 개선하는 데에도 도움이 됩니다.
SKU-
세계 최초의 시장 정보 클라우드 보고서에 온라인으로 접속하세요

- 대화형 데이터 분석 대시보드
- 높은 성장 잠재력 기회를 위한 회사 분석 대시보드
- 사용자 정의 및 질의를 위한 리서치 분석가 액세스
- 대화형 대시보드를 통한 경쟁자 분석
- 최신 뉴스, 업데이트 및 추세 분석
- 포괄적인 경쟁자 추적을 위한 벤치마크 분석의 힘 활용
목차
1 INTRODUCTION
1.1 OBJECTIVES OF THE STUDY
1.2 MARKET DEFINITION
1.3 OVERVIEW OF NORTH AMERICA INVISIBLE ORTHODONTICS MARKET
1.4 CURRENCY AND PRICING
1.5 LIMITATIONS
1.6 MARKETS COVERED
2 MARKET SEGMENTATION
2.1 MARKETS COVERED
2.2 GEOGRAPHICAL SCOPE
2.3 YEARS CONSIDERED FOR THE STUDY
2.4 DBMR TRIPOD DATA VALIDATION MODEL
2.5 PRIMARY INTERVIEWS WITH KEY OPINION LEADERS
2.6 MULTIVARIATE MODELLING
2.7 PRODUCTS AND SERVICES LIFELINE CURVE
2.8 DBMR MARKET POSITION GRID
2.9 VENDOR SHARE ANALYSIS
2.1 MARKET APPLICATION COVERAGE GRID
2.11 SECONDARY SOURCES
2.12 ASSUMPTIONS
3 EXECUTIVE SUMMARY
4 REGULATIONS OF INVISIBLE ORTHODONTICS MARKET
5 MARKET OVERVIEW
5.1 DRIVERS
5.1.1 INCREASE IN PREVALENCE OF MALOCCLUSION
5.1.2 GROWING ADULT ORTHODONTICS
5.1.3 INCREASED COSMETIC AWARENESS
5.1.4 GROWING NUMBER OF GPS OFFERING ORTHODONTIC SERVICES
5.1.5 RISING DEMAND FOR MINIMALLY INVASIVE SURGICAL TECHNIQUES
5.2 RESTRAINTS
5.2.1 HIGH PRICE OF INVISIBLE ORTHODONTICS
5.2.2 STRICT REGULATORY APPROVAL
5.3 OPPORTUNITIES
5.3.1 TECHNOLOGICAL ADVANCEMENT OF COSMETIC DENTISTRY TECHNIQUES
5.3.2 INTRODUCTION OF CAM/CAD TECHNOLOGY IN ORTHODONTICS
5.3.3 INCREASING HEALTH CARE EXPENDITURE
5.3.4 STRATEGIC INITIATIVES BY KEY MARKET PLAYERS
5.4 CHALLENGES
5.4.1 LIMITATIONS ASSOCIATED WITH THE INVISIBLE ORTHODONTICS
5.4.2 MARKET COMPETITION
5.4.3 EMERGENCE OF COVID-19
6 IMPACT OF COVID-19 ON NORTH AMERICA INVISIBLE ORTHODONTICS MARKET
6.1 IMPACT ON PRICE
6.2 IMPACT ON DEMAND
6.3 IMPACT ON SUPPLY CHAIN
6.4 STRATEGIC DECISIONS OF GOVERNMENT AND MANUFACTURERS
6.5 CONCLUSION
7 NORTH AMERICA INVISIBLE ORTHODONTICS MARKET, BY PRODUCTS AND SERVICES
7.1 OVERVIEW
7.2 PRODUCTS
7.2.1 CLEAR ALIGNERS
7.2.2 CERAMIC BRACES
7.2.3 CLEAR RETAINERS
7.2.4 LINGUAL BRACES
7.3 SERVICES
8 NORTH AMERICA INVISIBLE ORTHODONTICS MARKET, BY AGE GROUPS
8.1 OVERVIEW
8.2 ADULTS
8.2.1 CLEAR ALIGNERS
8.2.2 CERAMIC BRACES
8.2.3 CLEAR RETAINERS
8.2.4 LINGUAL BRACES
8.3 TEENAGERS
8.3.1 CLEAR ALIGNERS
8.3.2 CERAMIC BRACES
8.3.3 CLEAR RETAINERS
8.3.4 LINGUAL BRACES
8.4 CHILDREN
8.4.1 CLEAR ALIGNERS
8.4.2 CERAMIC BRACES
8.4.3 CLEAR RETAINERS
8.4.4 LINGUAL BRACES
9 NORTH AMERICA INVISIBLE ORTHODONTICS MARKET, BY APPLICATION
9.1 OVERVIEW
9.2 MALOCCLUSION
9.2.1 CLEAR ALIGNERS
9.2.2 CERAMIC BRACES
9.2.3 CLEAR RETAINERS
9.2.4 LINGUAL BRACES
9.3 CROWDING
9.3.1 CLEAR ALIGNERS
9.3.2 CERAMIC BRACES
9.3.3 CLEAR RETAINERS
9.3.4 LINGUAL BRACES
9.4 EXCESSIVE SPACING
9.4.1 CLEAR ALIGNERS
9.4.2 CERAMIC BRACES
9.4.3 CLEAR RETAINERS
9.4.4 LINGUAL BRACES
9.5 OTHERS
10 NORTH AMERICA INVISIBLE ORTHODONTICS MARKET, BY END USER
10.1 OVERVIEW
10.2 HOSPITALS
10.3 DENTAL CLINICS
10.4 ORTHODONTIC CLINICS
10.5 OTHERS
11 NORTH AMERICA INVISIBLE ORTHODONTICS MARKET, BY DISTRIBUTION CHANNEL
11.1 OVERVIEW
11.2 DIRECT SALES
11.3 THIRD PARTY DISTRIBUTORS
12 NORTH AMERICA INVISIBLE ORTHODONTICS MARKET, BY REGION
12.1 NORTH AMERICA
12.1.1 U.S.
12.1.2 CANADA
12.1.3 MEXICO
13 NORTH AMERICA INVISIBLE ORTHODONTICS: COMPANY LANDSCAPE
13.1 COMPANY SHARE ANALYSIS: NORTH AMERICA
14 SWOT ANALYSIS
15 COMPANY PROFILE
15.1 ALIGN TECHNOLOGY, INC.
15.1.1 COMPANY SNAPSHOT
15.1.2 REVENUE ANALYSIS
15.1.3 COMPANY SHARE ANALYSIS
15.1.4 PRODUCT PORTFOLIO
15.1.5 RECENT DEVELOPMENTS
15.2 SMILEDIRECTCLUB
15.2.1 COMPANY SNAPSHOT
15.2.2 REVENUE ANALYSIS
15.2.3 COMPANY SHARE ANALYSIS
15.2.4 PRODUCT PORTFOLIO
15.2.5 RECENT DEVELOPMENTS
15.3 HENRY SCHEIN ORTHODONTICS (A SUBSIDIARY OF HENRY SCHEIN, INC.)
15.3.1 COMPANY SNAPSHOT
15.3.2 REVENUE ANALYSIS
15.3.3 COMPANY SHARE ANALYSIS
15.3.4 PRODUCT PORTFOLIO
15.3.5 RECENT DEVELOPMENTS
15.4 DENTSPLY SIRONA
15.4.1 COMPANY SNAPSHOT
15.4.2 REVENUE ANALYSIS
15.4.3 COMPANY SHARE ANALYSIS
15.4.4 PRODUCT PORTFOLIO
15.4.5 RECENT DEVELOPMENTS
15.5 3M
15.5.1 COMPANY SNAPSHOT
15.5.2 REVENUE ANALYSIS
15.5.3 COMPANY SHARE ANALYSIS
15.5.4 PRODUCT PORTFOLIO
15.5.5 RECENT DEVELOPMENTS
15.6 ALIGNERCO
15.6.1 COMPANY SNAPSHOT
15.6.2 PRODUCT PORTFOLIO
15.6.3 RECENT DEVELOPMENT
15.7 AMERICAN ORTHODONTICS
15.7.1 COMPANY SNAPSHOT
15.7.2 PRODUCT PORTFOLIO
15.7.3 RECENT DEVELOPMENTS
15.8 CANDID CARE CO.
15.8.1 COMPANY SNAPSHOT
15.8.2 PRODUCT PORTFOLIO
15.8.3 RECENT DEVELOPMENTS
15.9 DB ORTHODONTICS
15.9.1 COMPANY SNAPSHOT
15.9.2 PRODUCT PORTFOLIO
15.9.3 RECENT DEVELOPMENTS
15.1 DENTAURUM GMBH & CO. KG
15.10.1 COMPANY SNAPSHOT
15.10.2 PRODUCT PORTFOLIO
15.10.3 RECENT DEVELOPMENTS
15.11 DR SMILE DENTAL CLINIC
15.11.1 COMPANY SNAPSHOT
15.11.2 SERVICE PORTFOLIO
15.11.3 RECENT DEVELOPMENT
15.12 DYNAFLEX
15.12.1 COMPANY SNAPSHOT
15.12.2 PRODUCT PORTFOLIO
15.12.3 RECENT DEVELOPMENT
15.13 FORESTADENT - BERNHARD FOERSTER GMBH
15.13.1 COMPANY SNAPSHOT
15.13.2 PRODUCT PORTFOLIO
15.13.3 RECENT DEVELOPMENTS
15.14 G&H ORTHODONTICS
15.14.1 COMPANY SNAPSHOT
15.14.2 PRODUCT PORTFOLIO
15.14.3 RECENT DEVELOPMENT
15.15 GREAT LAKES DENTAL TECHNOLOGIES
15.15.1 COMPANY SNAPSHOT
15.15.2 PRODUCT PORTFOLIO
15.15.3 RECENT DEVELOPMENT
15.16 INSTITUT STRAUMANN AG
15.16.1 COMPANY SNAPSHOT
15.16.2 REVENUE ANALYSIS
15.16.3 PRODUCT PORTFOLIO
15.16.4 RECENT DEVELOPMENTS
15.17 ORMCO CORPORATION (A SUBSIDIARY OF ENVISTA)
15.17.1 COMPANY SNAPSHOT
15.17.2 REVENUE ANALYSIS
15.17.3 PRODUCT PORTFOLIO
15.17.4 RECENT DEVELOPMENTS
15.18 ORTHO-CARE (UK) LTD
15.18.1 COMPANY SNAPSHOT
15.18.2 PRODUCT PORTFOLIO
15.18.3 RECENT DEVELOPMENT
15.19 ROCKY MOUNTAIN ORTHODONTICS
15.19.1 COMPANY SNAPSHOT
15.19.2 PRODUCT PORTFOLIO
15.19.3 RECENT DEVELOPMENTS
15.2 SMILE2IMPRESS SL
15.20.1 COMPANY SNAPSHOT
15.20.2 PRODUCT PORTFOLIO
15.20.3 RECENT DEVELOPMENT
15.21 STRAIGHT TEETH DIRECT
15.21.1 COMPANY SNAPSHOT
15.21.2 PRODUCT PORTFOLIO
15.21.3 RECENT DEVELOPMENT
15.22 SUNSHINE SMILE GMBH
15.22.1 COMPANY SNAPSHOT
15.22.2 PRODUCT PORTFOLIO
15.22.3 RECENT DEVELOPMENTS
15.23 TP ORTHODONTICS, INC.
15.23.1 COMPANY SNAPSHOT
15.23.2 PRODUCT PORTFOLIO
15.23.3 RECENT DEVELOPMENT
15.24 WONDERSMILE
15.24.1 COMPANY SNAPSHOT
15.24.2 PRODUCT PORTFOLIO
15.24.3 RECENT DEVELOPMENT
16 QUESTIONNAIRE
17 RELATED REPORTS
표 목록
TABLE 1 COST OF CERAMIC BRACES IN THE U.S.
TABLE 2 GENERAL AND MEDICAL INFLATION RATES FOR SELECTED COUNTRIES
TABLE 3 NORTH AMERICA INVISIBLE ORTHODONTICS MARKET, BY PRODUCTS AND SERVICES, 2020-2029 (USD MILLION)
TABLE 4 NORTH AMERICA PRODUCTS IN INVISIBLE ORTHODONTICS MARKET, BY REGION, 2020-2029 (USD MILLION)
TABLE 5 NORTH AMERICA PRODUCTS IN INVISIBLE ORTHODONTICS MARKET, BY PRODUCTS AND SERVICES, 2020-2029 (USD MILLION)
TABLE 6 NORTH AMERICA SERVICES IN INVISIBLE ORTHODONTICS MARKET, BY REGION, 2020-2029 (USD MILLION)
TABLE 7 NORTH AMERICA INVISIBLE ORTHODONTICS MARKET, BY AGE GROUPS, 2020-2029 (USD MILLION)
TABLE 8 NORTH AMERICA ADULTS IN INVISIBLE ORTHODONTICS MARKET, BY REGION, 2020-2029 (USD MILLION)
TABLE 9 NORTH AMERICA ADULTS IN INVISIBLE ORTHODONTICS MARKET, BY AGE GROUPS, 2020-2029 (USD MILLION)
TABLE 10 NORTH AMERICA TEENAGERS IN INVISIBLE ORTHODONTICS MARKET, BY REGION, 2020-2029 (USD MILLION)
TABLE 11 NORTH AMERICA TEENAGERS IN INVISIBLE ORTHODONTICS MARKET, BY AGE GROUPS, 2020-2029 (USD MILLION)
TABLE 12 NORTH AMERICA CHILDREN IN INVISIBLE ORTHODONTICS MARKET, BY REGION, 2020-2029 (USD MILLION)
TABLE 13 NORTH AMERICA CHILDREN IN INVISIBLE ORTHODONTICS MARKET, BY AGE GROUPS, 2020-2029 (USD MILLION)
TABLE 14 NORTH AMERICA INVISIBLE ORTHODONTICS MARKET, BY APPLICATION, 2020-2029 (USD MILLION)
TABLE 15 NORTH AMERICA MALOCCLUSION IN INVISIBLE ORTHODONTICS MARKET, BY REGION, 2020-2029 (USD MILLION)
TABLE 16 NORTH AMERICA MALOCCLUSION IN INVISIBLE ORTHODONTICS MARKET, BY APPLICATION, 2020-2029 (USD MILLION)
TABLE 17 NORTH AMERICA CROWDING IN INVISIBLE ORTHODONTICS MARKET, BY REGION, 2020-2029 (USD MILLION)
TABLE 18 NORTH AMERICA CROWDING IN INVISIBLE ORTHODONTICS MARKET, BY APPLICATION, 2020-2029 (USD MILLION)
TABLE 19 NORTH AMERICA EXCESSIVE SPACING IN INVISIBLE ORTHODONTICS MARKET, BY REGION, 2020-2029 (USD MILLION)
TABLE 20 NORTH AMERICA EXCESSIVE SPACING IN INVISIBLE ORTHODONTICS MARKET, BY APPLICATION, 2020-2029 (USD MILLION)
TABLE 21 NORTH AMERICA OTHERS IN INVISIBLE ORTHODONTICS MARKET, BY REGION, 2020-2029 (USD MILLION)
TABLE 22 NORTH AMERICA INVISIBLE ORTHODONTICS MARKET, BY END USER, 2020-2029 (USD MILLION)
TABLE 23 NORTH AMERICA HOSPITALS IN INVISIBLE ORTHODONTICS MARKET, BY REGION, 2020-2029 (USD MILLION)
TABLE 24 NORTH AMERICA DENTAL CLINICS IN INVISIBLE ORTHODONTICS MARKET, BY REGION, 2020-2029 (USD MILLION)
TABLE 25 NORTH AMERICA ORTHODONTICS CLINICS IN INVISIBLE ORTHODONTICS MARKET, BY REGION, 2020-2029 (USD MILLION)
TABLE 26 NORTH AMERICA OTHERS IN INVISIBLE ORTHODONTICS MARKET, BY REGION, 2020-2029 (USD MILLION)
TABLE 27 NORTH AMERICA INVISIBLE ORTHODONTICS MARKET, BY DISTRIBUTION CHANNEL, 2020-2029 (USD MILLION)
TABLE 28 NORTH AMERICA DIRECT SALES IN INVISIBLE ORTHODONTICS MARKET, BY REGION, 2020-2020 (USD MILLION)
TABLE 29 NORTH AMERICA THIRD PARTY DISTRIBUTORS IN INVISIBLE ORTHODONTICS MARKET, BY REGION, 2020-2029 (USD MILLION)
TABLE 30 NORTH AMERICA INVISIBLE ORTHODONTICS MARKET, BY COUNTRY, 2020-2029 (USD MILLION)
TABLE 31 NORTH AMERICA INVISIBLE ORTHODONTICS MARKET, BY PRODUCTS AND SERVICES, 2020-2029 (USD MILLION)
TABLE 32 NORTH AMERICA PRODUCTS IN INVISIBLE ORTHODONTICS MARKET, BY PRODUCTS AND SERVICES, 2020-2029 (USD MILLION)
TABLE 33 NORTH AMERICA INVISIBLE ORTHODONTICS MARKET, BY AGE GROUPS, 2020-2029 (USD MILLION)
TABLE 34 NORTH AMERICA ADULTS IN INVISIBLE ORTHODONTICS MARKET, BY AGE GROUPS, 2020-2029 (USD MILLION)
TABLE 35 NORTH AMERICA TEENAGERS IN INVISIBLE ORTHODONTICS MARKET, BY AGE GROUPS, 2020-2029 (USD MILLION)
TABLE 36 NORTH AMERICA CHILDREN IN INVISIBLE ORTHODONTICS MARKET, BY AGE GROUPS, 2020-2029 (USD MILLION)
TABLE 37 NORTH AMERICA INVISIBLE ORTHODONTICS MARKET, BY APPLICATION, 2020-2029 (USD MILLION)
TABLE 38 NORTH AMERICA MALOCCLUSION IN INVISIBLE ORTHODONTICS MARKET, BY APPLICATION, 2020-2029 (USD MILLION)
TABLE 39 NORTH AMERICA CROWDING IN INVISIBLE ORTHODONTICS MARKET, BY APPLICATION, 2020-2029 (USD MILLION)
TABLE 40 NORTH AMERICA EXCESSIVE SPACING IN INVISIBLE ORTHODONTICS MARKET, BY APPLICATION, 2020-2029 (USD MILLION)
TABLE 41 NORTH AMERICA INVISIBLE ORTHODONTICS MARKET, BY END USER, 2020-2029 (USD MILLION)
TABLE 42 NORTH AMERICA INVISIBLE ORTHODONTICS MARKET, BY DISTRIBUTION CHANNEL, 2020-2029 (USD MILLION)
TABLE 43 U.S. INVISIBLE ORTHODONTICS MARKET, BY PRODUCTS AND SERVICES, 2020-2029 (USD MILLION)
TABLE 44 U.S. INVISIBLE PRODUCTS IN ORTHODONTICS MARKET, BY PRODUCTS AND SERVICES, 2020-2029 (USD MILLION)
TABLE 45 U.S. INVISIBLE ORTHODONTICS MARKET, BY AGE GROUPS, 2020-2029 (USD MILLION)
TABLE 46 U.S. ADULTS IN INVISIBLE ORTHODONTICS MARKET, BY AGE GROUPS, 2020-2029 (USD MILLION)
TABLE 47 U.S. TEENAGERS IN INVISIBLE ORTHODONTICS MARKET, BY AGE GROUPS, 2020-2029 (USD MILLION)
TABLE 48 U.S. CHILDREN IN INVISIBLE ORTHODONTICS MARKET, BY AGE GROUPS, 2020-2029 (USD MILLION)
TABLE 49 U.S. INVISIBLE ORTHODONTICS MARKET, BY APPLICATION, 2020-2029 (USD MILLION)
TABLE 50 U.S. MALOCCLUSION IN INVISIBLE ORTHODONTICS MARKET, BY APPLICATION, 2020-2029 (USD MILLION)
TABLE 51 U.S. CROWDING IN INVISIBLE ORTHODONTICS MARKET, BY APPLICATION, 2020-2029 (USD MILLION)
TABLE 52 U.S. EXCESSIVE SPACING IN INVISIBLE ORTHODONTICS MARKET, BY APPLICATION, 2020-2029 (USD MILLION)
TABLE 53 U.S. INVISIBLE ORTHODONTICS MARKET, BY END USER, 2020-2029 (USD MILLION)
TABLE 54 U.S. INVISIBLE ORTHODONTICS MARKET, BY DISTRIBUTION CHANNEL, 2020-2029 (USD MILLION)
TABLE 55 CANADA INVISIBLE ORTHODONTICS MARKET, BY PRODUCTS AND SERVICES, 2020-2029 (USD MILLION)
TABLE 56 CANADA INVISIBLE PRODUCTS IN ORTHODONTICS MARKET, BY PRODUCTS AND SERVICES, 2020-2029 (USD MILLION)
TABLE 57 CANADA INVISIBLE ORTHODONTICS MARKET, BY AGE GROUPS, 2020-2029 (USD MILLION)
TABLE 58 CANADA ADULTS IN INVISIBLE ORTHODONTICS MARKET, BY AGE GROUPS, 2020-2029 (USD MILLION)
TABLE 59 CANADA TEENAGERS IN INVISIBLE ORTHODONTICS MARKET, BY AGE GROUPS, 2020-2029 (USD MILLION)
TABLE 60 CANADA CHILDREN IN INVISIBLE ORTHODONTICS MARKET, BY AGE GROUPS, 2020-2029 (USD MILLION)
TABLE 61 CANADA INVISIBLE ORTHODONTICS MARKET, BY APPLICATION, 2020-2029 (USD MILLION)
TABLE 62 CANADA MALOCCLUSION IN INVISIBLE ORTHODONTICS MARKET, BY APPLICATION, 2020-2029 (USD MILLION)
TABLE 63 CANADA CROWDING IN INVISIBLE ORTHODONTICS MARKET, BY APPLICATION, 2020-2029 (USD MILLION)
TABLE 64 CANADA EXCESSIVE SPACING IN INVISIBLE ORTHODONTICS MARKET, BY APPLICATION, 2020-2029 (USD MILLION)
TABLE 65 CANADA INVISIBLE ORTHODONTICS MARKET, BY END USER, 2020-2029 (USD MILLION)
TABLE 66 CANADA INVISIBLE ORTHODONTICS MARKET, BY DISTRIBUTION CHANNEL, 2020-2029 (USD MILLION)
TABLE 67 MEXICO INVISIBLE ORTHODONTICS MARKET, BY PRODUCTS AND SERVICES, 2020-2029 (USD MILLION)
TABLE 68 MEXICO INVISIBLE PRODUCTS IN ORTHODONTICS MARKET, BY PRODUCTS AND SERVICES, 2020-2029 (USD MILLION)
TABLE 69 MEXICO INVISIBLE ORTHODONTICS MARKET, BY AGE GROUPS, 2020-2029 (USD MILLION)
TABLE 70 MEXICO ADULTS IN INVISIBLE ORTHODONTICS MARKET, BY AGE GROUPS, 2020-2029 (USD MILLION)
TABLE 71 MEXICO TEENAGERS IN INVISIBLE ORTHODONTICS MARKET, BY AGE GROUPS, 2020-2029 (USD MILLION)
TABLE 72 MEXICO CHILDREN IN INVISIBLE ORTHODONTICS MARKET, BY AGE GROUPS, 2020-2029 (USD MILLION)
TABLE 73 MEXICO INVISIBLE ORTHODONTICS MARKET, BY APPLICATION, 2020-2029 (USD MILLION)
TABLE 74 MEXICO MALOCCLUSION IN INVISIBLE ORTHODONTICS MARKET, BY APPLICATION, 2020-2029 (USD MILLION)
TABLE 75 MEXICO CROWDING IN INVISIBLE ORTHODONTICS MARKET, BY APPLICATION, 2020-2029 (USD MILLION)
TABLE 76 MEXICO EXCESSIVE SPACING IN INVISIBLE ORTHODONTICS MARKET, BY APPLICATION, 2020-2029 (USD MILLION)
TABLE 77 MEXICO INVISIBLE ORTHODONTICS MARKET, BY END USER, 2020-2029 (USD MILLION)
TABLE 78 MEXICO INVISIBLE ORTHODONTICS MARKET, BY DISTRIBUTION CHANNEL, 2020-2029 (USD MILLION)
그림 목록
FIGURE 1 NORTH AMERICA INVISIBLE ORTHODONTICS MARKET: SEGMENTATION
FIGURE 2 NORTH AMERICA INVISIBLE ORTHODONTICS MARKET: DATA TRIANGULATION
FIGURE 3 NORTH AMERICA INVISIBLE ORTHODONTICS MARKET: DROC ANALYSIS
FIGURE 4 NORTH AMERICA INVISIBLE ORTHODONTICS MARKET: NORTH AMERICA VS REGIONAL MARKET ANALYSIS
FIGURE 5 NORTH AMERICA INVISIBLE ORTHODONTICS MARKET: COMPANY RESEARCH ANALYSIS
FIGURE 6 NORTH AMERICA INVISIBLE ORTHODONTICS MARKET: INTERVIEW DEMOGRAPHICS
FIGURE 7 NORTH AMERICA INVISIBLE ORTHODONTICS MARKET: DBMR MARKET POSITION GRID
FIGURE 8 NORTH AMERICA INVISIBLE ORTHODONTICS MARKET: VENDOR SHARE ANALYSIS
FIGURE 9 NORTH AMERICA INVISIBLE ORTHODONTICS MARKET: MARKET APPLICATION COVERAGE GRID
FIGURE 10 NORTH AMERICA INVISIBLE ORTHODONTICS MARKET: SEGMENTATION
FIGURE 11 NORTH AMERICA IS ANTICIPATED TO DOMINATE THE NORTH AMERICA INVISIBLE ORTHODONTICS MARKET AND ASIA-PACIFIC IS ESTIMATED TO BE GROWING WITH THE HIGHEST CAGR IN THE FORECAST PERIOD OF 2022 TO 2029
FIGURE 12 GROWING ADULT ORTHODONTICS IS EXPECTED TO DRIVE THE NORTH AMERICA INVISIBLE ORTHODONTICS MARKET IN THE FORECAST PERIOD OF 2022 TO 2029
FIGURE 13 PRODUCTS SEGMENT IS EXPECTED TO ACCOUNT FOR THE LARGEST SHARE OF THE NORTH AMERICA INVISIBLE ORTHODONTICS MARKET IN 2022 & 2029
FIGURE 14 DRIVERS, RESTRAINTS, OPPORTUNITIES AND CHALLENGES OF THE NORTH AMERICA INVISIBLE ORTHODONTICS MARKET
FIGURE 15 GOVERNMENT HEALTHCARE EXPENDITURE BY SHARE OF HEALTHCARE PROVIDERS IN THE U.K. IN 2018
FIGURE 16 NORTH AMERICA INVISIBLE ORTHODONTICS MARKET: BY PRODUCTS AND SERVICES, 2021
FIGURE 17 NORTH AMERICA INVISIBLE ORTHODONTICS MARKET: BY PRODUCTS AND SERVICES, 2020-2029 (USD MILLION)
FIGURE 18 NORTH AMERICA INVISIBLE ORTHODONTICS MARKET: BY PRODUCTS AND SERVICES, CAGR (2022-2029)
FIGURE 19 NORTH AMERICA INVISIBLE ORTHODONTICS MARKET: BY PRODUCTS AND SERVICES, LIFELINE CURVE
FIGURE 20 NORTH AMERICA INVISIBLE ORTHODONTICS MARKET: BY AGE GROUPS, 2021
FIGURE 21 NORTH AMERICA INVISIBLE ORTHODONTICS MARKET: BY AGE GROUPS, 2020-2029 (USD MILLION)
FIGURE 22 NORTH AMERICA INVISIBLE ORTHODONTICS MARKET: BY AGE GROUPS, CAGR (2022-2029)
FIGURE 23 NORTH AMERICA INVISIBLE ORTHODONTICS MARKET: BY AGE GROUPS, LIFELINE CURVE
FIGURE 24 NORTH AMERICA INVISIBLE ORTHODONTICS MARKET: BY APPLICATION, 2021
FIGURE 25 NORTH AMERICA INVISIBLE ORTHODONTICS MARKET: BY APPLICATION, 2020-2029 (USD MILLION)
FIGURE 26 NORTH AMERICA INVISIBLE ORTHODONTICS MARKET: BY APPLICATION, CAGR (2022-2029)
FIGURE 27 NORTH AMERICA INVISIBLE ORTHODONTICS MARKET: BY APPLICATION, LIFELINE CURVE
FIGURE 28 NORTH AMERICA INVISIBLE ORTHODONTICS MARKET: BY END USER, 2021
FIGURE 29 NORTH AMERICA INVISIBLE ORTHODONTICS MARKET: BY END USER, 2020-2029 (USD MILLION)
FIGURE 30 NORTH AMERICA INVISIBLE ORTHODONTICS MARKET: BY END USER, CAGR (2022-2029)
FIGURE 31 NORTH AMERICA INVISIBLE ORTHODONTICS MARKET: BY END USER, LIFELINE CURVE
FIGURE 32 NORTH AMERICA INVISIBLE ORTHODONTICS MARKET: BY DISTRIBUTION CHANNEL, 2021
FIGURE 33 NORTH AMERICA INVISIBLE ORTHODONTICS MARKET: BY DISTRIBUTION CHANNEL, 2020-2029 (USD MILLION)
FIGURE 34 NORTH AMERICA INVISIBLE ORTHODONTICS MARKET: BY DISTRIBUTION CHANNEL, CAGR (2022-2029)
FIGURE 35 NORTH AMERICA INVISIBLE ORTHODONTICS MARKET: BY DISTRIBUTION CHANNEL, LIFELINE CURVE
FIGURE 36 NORTH AMERICA INVISIBLE ORTHODONTICS MARKET: SNAPSHOT (2021)
FIGURE 37 NORTH AMERICA INVISIBLE ORTHODONTICS MARKET: BY COUNTRY (2021)
FIGURE 38 NORTH AMERICA INVISIBLE ORTHODONTICS MARKET: BY COUNTRY (2022 & 2029)
FIGURE 39 NORTH AMERICA INVISIBLE ORTHODONTICS MARKET: BY COUNTRY (2021 & 2029)
FIGURE 40 NORTH AMERICA INVISIBLE ORTHODONTICS MARKET: BY PRODUCTS AND SERVICES (2022-2029)
FIGURE 41 NORTH AMERICA INVISIBLE ORTHODONTICS: COMPANY SHARE 2021 (%)
연구 방법론
데이터 수집 및 기준 연도 분석은 대규모 샘플 크기의 데이터 수집 모듈을 사용하여 수행됩니다. 이 단계에는 다양한 소스와 전략을 통해 시장 정보 또는 관련 데이터를 얻는 것이 포함됩니다. 여기에는 과거에 수집한 모든 데이터를 미리 검토하고 계획하는 것이 포함됩니다. 또한 다양한 정보 소스에서 발견되는 정보 불일치를 검토하는 것도 포함됩니다. 시장 데이터는 시장 통계 및 일관된 모델을 사용하여 분석하고 추정합니다. 또한 시장 점유율 분석 및 주요 추세 분석은 시장 보고서의 주요 성공 요인입니다. 자세한 내용은 분석가에게 전화를 요청하거나 문의 사항을 드롭하세요.
DBMR 연구팀에서 사용하는 주요 연구 방법론은 데이터 마이닝, 시장에 대한 데이터 변수의 영향 분석 및 주요(산업 전문가) 검증을 포함하는 데이터 삼각 측량입니다. 데이터 모델에는 공급업체 포지셔닝 그리드, 시장 타임라인 분석, 시장 개요 및 가이드, 회사 포지셔닝 그리드, 특허 분석, 가격 분석, 회사 시장 점유율 분석, 측정 기준, 글로벌 대 지역 및 공급업체 점유율 분석이 포함됩니다. 연구 방법론에 대해 자세히 알아보려면 문의를 통해 업계 전문가에게 문의하세요.
사용자 정의 가능
Data Bridge Market Research는 고급 형성 연구 분야의 선두 주자입니다. 저희는 기존 및 신규 고객에게 목표에 맞는 데이터와 분석을 제공하는 데 자부심을 느낍니다. 보고서는 추가 국가에 대한 시장 이해(국가 목록 요청), 임상 시험 결과 데이터, 문헌 검토, 재생 시장 및 제품 기반 분석을 포함하도록 사용자 정의할 수 있습니다. 기술 기반 분석에서 시장 포트폴리오 전략에 이르기까지 타겟 경쟁업체의 시장 분석을 분석할 수 있습니다. 귀하가 원하는 형식과 데이터 스타일로 필요한 만큼 많은 경쟁자를 추가할 수 있습니다. 저희 분석가 팀은 또한 원시 엑셀 파일 피벗 테이블(팩트북)로 데이터를 제공하거나 보고서에서 사용 가능한 데이터 세트에서 프레젠테이션을 만드는 데 도움을 줄 수 있습니다.

