

Middle East And Africa Bioactive Ingredient Market
시장 규모 (USD 10억)
연평균 성장률 :
% 
 USD
3.55 Billion
USD
6.01 Billion
2025
2033
USD
3.55 Billion
USD
6.01 Billion
2025
2033
| 2026 –2033 | |
| USD 3.55 Billion | |
| USD 6.01 Billion | |
| % | |
|
중동 및 아프리카 생물학적 활성 성분 시장은 성분 유형(프리바이오틱스, 프로바이오틱스, 아미노산, 펩타이드, 오메가 3 및 구조화된 지질, 식물 화학 물질 및 식물 추출물, 미네랄, 비타민, 섬유질 및 특수 탄수화물, 카로티노이드 및 항산화제 및 기타), 응용 분야(기능성 식품, 식이 보충제, 젤리 보충제, 동물 영양, 개인 관리 및 기타) 및 출처(식물, 동물 및 미생물), 국가(UAE, 사우디 아라비아, 카타르, 쿠웨이트, 남아프리카, 중동 및 아프리카의 나머지 지역), 산업 동향 및 2028년까지의 예측으로 세분화됩니다.
 시장 분석 및 통찰력: 중동 및 아프리카 생물 활성 성분 시장
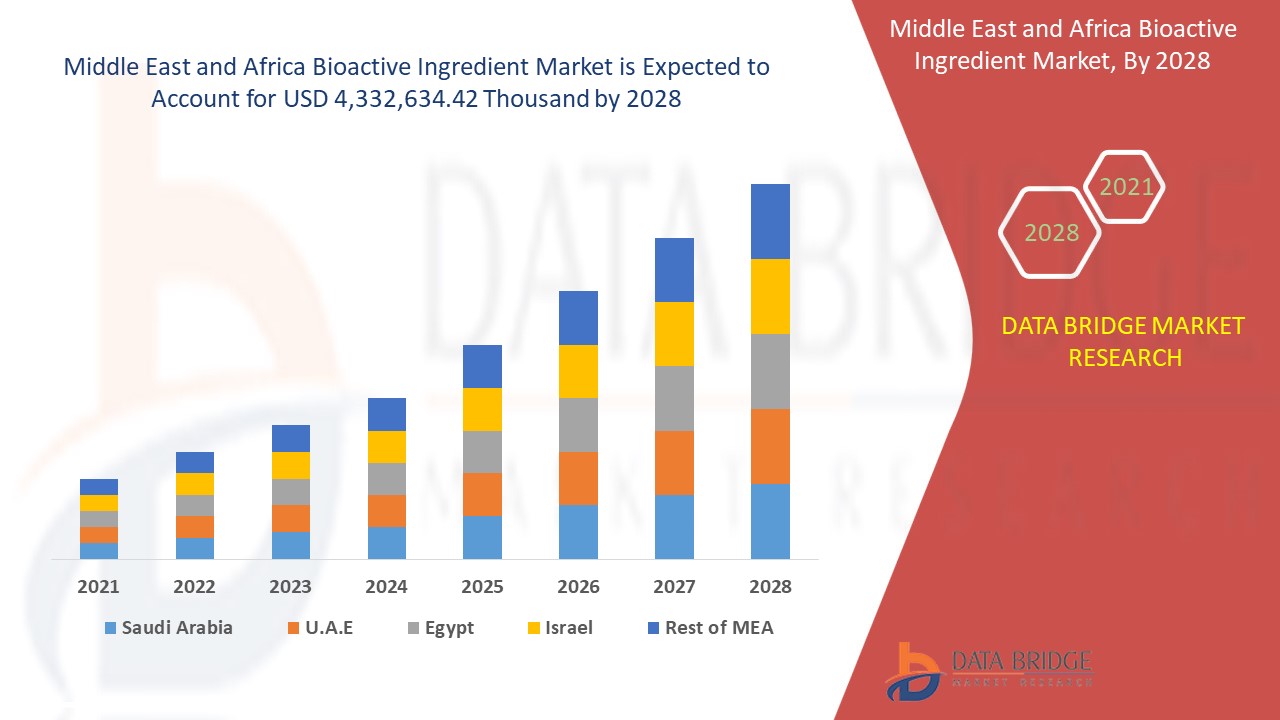
생물학적 활성 성분 시장은 2021년부터 2028년까지의 예측 기간 동안 시장 성장을 이룰 것으로 예상됩니다. Data Bridge Market Research는 시장이 2021년부터 2028년까지의 예측 기간 동안 6.8%의 CAGR로 성장하고 있으며 2028년까지 4,332,634.42천 달러에 도달할 것으로 예상한다고 분석합니다.
생물학적 활성 성분은 생물에 생물학적 효과를 미치는 물질입니다. 성분은 식물, 식품, 동물, 바다, 미생물을 포함한 다양한 출처에서 나옵니다. 생물학적 활성 물질은 고객의 신체적, 생리적 건강을 개선하기 위해 식품 및 사료 제품에 첨가됩니다. 기능성 식품 및 음료, 영양 보충제, 신생아 영양은 모두 생물학적 활성 물질을 광범위하게 사용합니다. 이러한 화학 물질은 암, 심장병 및 기타 질병을 예방하는 데 도움이 될 수 있습니다.
생리활성 물질은 식품 및 음료, 의약품 및 건강기능식품, 개인 관리 품목, 동물 사료를 포함한 다양한 분야에서 널리 활용됩니다. 카로티노이드, 에센셜 오일 , 항산화제는 기능성 식사에서 감각 및 영양적 품질을 개선하기 위해 사용되는 생리활성 물질의 예입니다. 이들은 식품 및 다양한 유형의 제품에 첨가된 건강한 분자의 대사 과정 을 돕는 일종의 생체 분자입니다 .
이 생물학적 활성 성분 시장 보고서는 시장 점유율, 새로운 개발 및 제품 파이프라인 분석, 국내 및 지역 시장 참여자의 영향, 새로운 수익 주머니, 시장 규정의 변화, 제품 승인, 전략적 의사 결정, 제품 출시, 지리적 확장 및 시장의 기술 혁신 측면에서의 분석 기회에 대한 세부 정보를 제공합니다. 분석 및 시장 시나리오를 이해하려면 분석가 브리핑을 위해 저희에게 연락하세요. 저희 팀은 원하는 목표를 달성하기 위한 수익 영향 솔루션을 만드는 데 도움을 드릴 것입니다.
 중동 및 아프리카 생물학적 활성 성분 시장 범위 및 시장 규모
중동 및 아프리카 생물학적 활성 성분 시장은 성분 유형, 응용 분야 및 출처를 기준으로 하는 세 가지 주목할 만한 세그먼트로 분류됩니다. 세그먼트 간의 성장은 틈새 성장 포켓과 시장에 접근하고 핵심 응용 분야와 타겟 시장의 차이점을 파악하기 위한 전략을 분석하는 데 도움이 됩니다.
- 성분 유형을 기준으로 글로벌 생물학적 활성 성분 시장은 프리바이오틱, 프로바이오틱, 아미노산, 펩타이드, 오메가 3 및 구조화된 지질, 식물 화학 물질 및 식물 추출물, 미네랄, 비타민 , 섬유질 및 특수 탄수화물, 카로티노이드 및 항산화제 및 기타로 세분화됩니다. 프리바이오틱은 프룩탄, 갈락토올리고당, 전분 및 포도당 유래 올리고당, 비탄수화물 올리고당 및 기타로 세분화됩니다. 프로바이오 틱은 유산균, 비피도박테리아, 효모로 세분화됩니다. 아미노산은 이소류신, 히스티딘, 류신, 라이신, 메티오닌, 페닐알라닌, 트레오닌, 트립토판, 발린 및 기타로 세분화됩니다. 펩타이드는 디펩타이드, 트리펩타이드, 올리고펩타이드 및 폴리펩타이드로 세분화됩니다. 미네랄은 칼슘, 인, 마그네슘, 나트륨 , 칼륨 , 망간, 철, 구리, 요오드, 아연 등으로 세분화됩니다. 비타민은 비타민 A, 비타민 C, 비타민 D, 비타민 E, 비타민 K, 비타민 B1, 비타민 B2, 비타민 B3, 비타민 B6, 비타민 B12 등으로 세분화됩니다.
- 응용 프로그램을 기준으로 글로벌 생물학적 활성 성분 시장은 기능성 식품, 식이 보충제, 젤리 보충제, 동물 영양제, 개인 관리 및 기타로 세분화됩니다. 기능성 식품은 유제품, 유제품 대체품, 빵, 파스타, 시리얼, 계란 제품, 스낵 바, 바 및 음료로 세분화됩니다. 유제품은 우유, 요구르트, 치즈, 버터 및 기타로 세분화됩니다. 유제품 대체품은 식물성 우유, 식물성 요구르트, 생물학적 활성 성분 및 기타로 세분화됩니다. 바는 단백질 바, 스포츠 영양 바, 요가 바, 운동 전 바, 운동 후 바 및 기타로 세분화됩니다. 음료는 주스와 스무디로 세분화됩니다. 동물 영양은 동물 범주별로 쇠고기, 가금류, 해산물 및 돼지고기로 세분화됩니다. 개인 관리품은 헤어 케어 및 스킨 케어로 세분화됩니다.
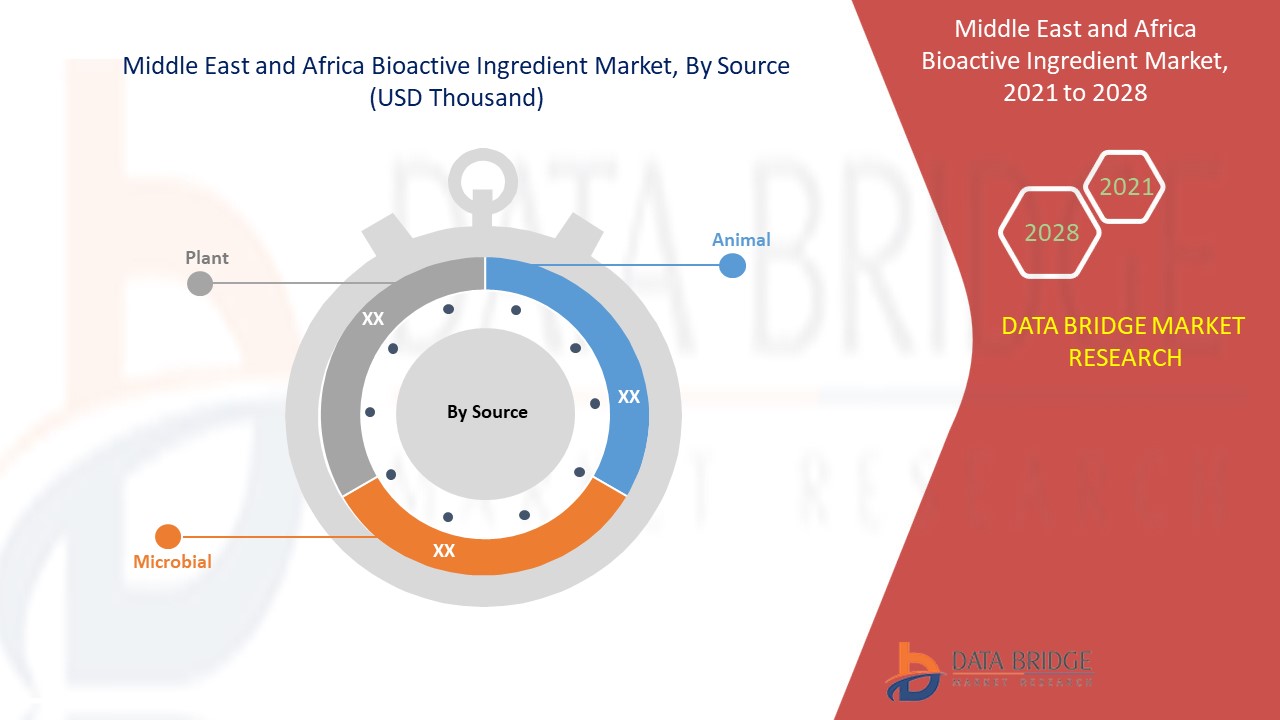
- 글로벌 생리활성 성분 시장은 출처를 기준으로 식물, 동물, 미생물로 구분됩니다.
생물학적 활성 성분 시장 국가 수준 분석
중동 및 아프리카 시장은 성분, 응용 분야, 출처별로 분석되고 시장 규모 정보가 제공됩니다. 중동 및 아프리카 생물 활성 성분 시장 보고서에서 다루는 국가는 UAE, 사우디 아라비아, 카타르, 쿠웨이트 및 남아프리카입니다.
보고서의 국가 섹션은 또한 개별 시장 영향 요인과 국내 시장의 현재 및 미래 트렌드에 영향을 미치는 규제 변화를 제공합니다. 신규 판매, 교체 판매, 국가 인구 통계, 규제 조치 및 수출입 관세와 같은 데이터 포인트는 개별 국가의 시장 시나리오를 예측하는 데 사용되는 주요 포인터 중 일부입니다. 또한 브랜드의 존재 및 가용성과 지역 및 국내 브랜드와의 대규모 또는 희소한 경쟁으로 인해 직면한 과제, 판매 채널의 영향이 국가 데이터에 대한 예측 분석을 제공하는 동안 고려됩니다.
생물학적 활성 성분 산업의 성장
중동 및 아프리카 생물학적 활성 성분 시장은 또한 생물학적 활성 성분 시장을 위한 다양한 종류의 제품 설치 기반의 모든 국가에 대한 자세한 시장 분석, 수명선 곡선을 사용한 기술의 영향, 영유아용 조제분유 규제 시나리오의 변화 및 생물학적 활성 성분 시장에 미치는 영향을 제공합니다. 이 데이터는 2010년부터 2019년까지의 과거 기간에 대해 제공됩니다.
경쟁 환경 및 생물학적 활성 성분 시장 점유율 분석
중동 및 아프리카 생물 활성 성분 시장 경쟁 구도는 경쟁자별 세부 정보를 제공합니다. 포함된 세부 정보는 회사 개요, 회사 재무, 창출된 수익, 시장 잠재력, 연구 개발 투자, 새로운 시장 이니셔티브, 글로벌 입지, 생산 현장 및 시설, 회사의 강점과 약점, 제품 출시, 임상 시험 파이프라인, 브랜드 분석, 제품 승인, 특허, 제품 폭 및 호흡, 응용 프로그램 우세, 기술 수명선 곡선입니다. 위에 제공된 데이터 포인트는 중동 및 아프리카 생물 활성 시장과 관련된 회사의 초점에만 관련됩니다.
글로벌 생물학적 활성 성분 시장에 참여하는 주요 시장 주체는 DSM, BASF SE, Kerry, DuPont, ADM, Global Bio-chem Technology Group Company Limited, Evonik Industries AG, Cargill, Incorporated, Arla Food Ingredients Group P/S(Arla Foods amba의 자회사), FMC Corporation, Sunrise Nutrachem Group, Adisseo(Bluestar Adisseo Co., Ltd.의 자회사), Chr.Hansen Holding A/S, Sabinsa, Ajinomoto Co., Inc, NOVUS INTERNATIONAL(Mitsui & Co. (USA), Inc.의 자회사), Ingredion, Roquette Frères, Probi 및 Advanced Animal Nutrition Pty Ltd. 등입니다.
예를 들어,
- 2021년 1월, DuPont Nutrition & Biosciences는 건강보조식품 생산자가 고객 스트레스의 악순환을 끊는 데 도움을 주는 것을 목표로 하는 프로바이오틱스인 HOWARD Calm이라는 신제품을 출시했습니다. 이 구현은 시장의 증가하는 고객 수요에 대응하기 위해 수행되었습니다.
SKU-
세계 최초의 시장 정보 클라우드 보고서에 온라인으로 접속하세요

- 대화형 데이터 분석 대시보드
- 높은 성장 잠재력 기회를 위한 회사 분석 대시보드
- 사용자 정의 및 질의를 위한 리서치 분석가 액세스
- 대화형 대시보드를 통한 경쟁자 분석
- 최신 뉴스, 업데이트 및 추세 분석
- 포괄적인 경쟁자 추적을 위한 벤치마크 분석의 힘 활용
연구 방법론
데이터 수집 및 기준 연도 분석은 대규모 샘플 크기의 데이터 수집 모듈을 사용하여 수행됩니다. 이 단계에는 다양한 소스와 전략을 통해 시장 정보 또는 관련 데이터를 얻는 것이 포함됩니다. 여기에는 과거에 수집한 모든 데이터를 미리 검토하고 계획하는 것이 포함됩니다. 또한 다양한 정보 소스에서 발견되는 정보 불일치를 검토하는 것도 포함됩니다. 시장 데이터는 시장 통계 및 일관된 모델을 사용하여 분석하고 추정합니다. 또한 시장 점유율 분석 및 주요 추세 분석은 시장 보고서의 주요 성공 요인입니다. 자세한 내용은 분석가에게 전화를 요청하거나 문의 사항을 드롭하세요.
DBMR 연구팀에서 사용하는 주요 연구 방법론은 데이터 마이닝, 시장에 대한 데이터 변수의 영향 분석 및 주요(산업 전문가) 검증을 포함하는 데이터 삼각 측량입니다. 데이터 모델에는 공급업체 포지셔닝 그리드, 시장 타임라인 분석, 시장 개요 및 가이드, 회사 포지셔닝 그리드, 특허 분석, 가격 분석, 회사 시장 점유율 분석, 측정 기준, 글로벌 대 지역 및 공급업체 점유율 분석이 포함됩니다. 연구 방법론에 대해 자세히 알아보려면 문의를 통해 업계 전문가에게 문의하세요.
사용자 정의 가능
Data Bridge Market Research는 고급 형성 연구 분야의 선두 주자입니다. 저희는 기존 및 신규 고객에게 목표에 맞는 데이터와 분석을 제공하는 데 자부심을 느낍니다. 보고서는 추가 국가에 대한 시장 이해(국가 목록 요청), 임상 시험 결과 데이터, 문헌 검토, 재생 시장 및 제품 기반 분석을 포함하도록 사용자 정의할 수 있습니다. 기술 기반 분석에서 시장 포트폴리오 전략에 이르기까지 타겟 경쟁업체의 시장 분석을 분석할 수 있습니다. 귀하가 원하는 형식과 데이터 스타일로 필요한 만큼 많은 경쟁자를 추가할 수 있습니다. 저희 분석가 팀은 또한 원시 엑셀 파일 피벗 테이블(팩트북)로 데이터를 제공하거나 보고서에서 사용 가능한 데이터 세트에서 프레젠테이션을 만드는 데 도움을 줄 수 있습니다.

