

Middle And East Africa Pharmaceutical Solvent Market
시장 규모 (USD 10억)
연평균 성장률 :
% 
 USD
367.96 Million
USD
507.46 Million
2024
2032
USD
367.96 Million
USD
507.46 Million
2024
2032
| 2025 –2032 | |
| USD 367.96 Million | |
| USD 507.46 Million | |
| % | |
|
중동 및 아프리카 제약 용매 시장 세분화, 제품별(알코올, 아민, 에스테르, 에테르, 방향족 탄화수소, 염소화 용매, 케톤 및 기타), 응용 분야(제약, 연구소, 화학 및 기타) - 산업 동향 및 2032년까지의 전망
중동 및 동아프리카 제약용 용매 시장 규모
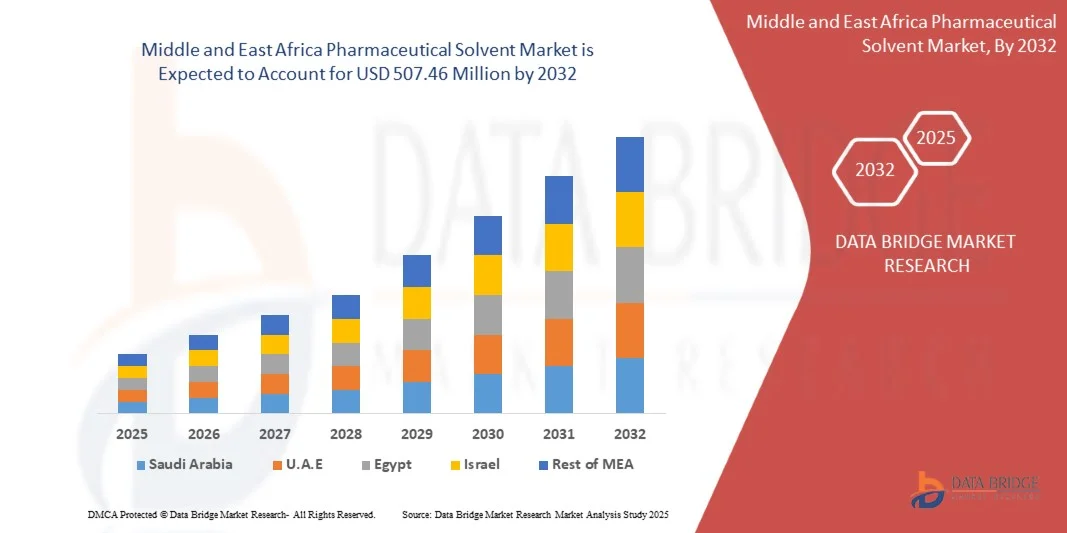
- 중동 및 동아프리카 제약용 용매 시장 규모는 2024년에 3억 6,796만 달러로 평가되었으며 2032년까지 5억 746만 달러에 도달할 것으로 예상되며 예측 기간 동안 4.10%의 CAGR로 성장할 것입니다.
- 시장 확장은 주로 제약 제조 증가, 제네릭 의약품 수요 증가, 지역 내 신흥 경제권의 의료 인프라 성장에 의해 주도됩니다.
- 또한, 고품질 약물 제형에 대한 규제 지원과 R&D 활동에 대한 투자 증가로 고순도 용매 채택이 촉진되어 시장의 강력한 성장 궤도가 더욱 가속화되고 있습니다.
중동 및 동아프리카 제약용 용매 시장 분석
- 의약품 제형, 합성 및 정제에 필수적인 제약 용매는 고품질 의약품에 대한 수요 증가와 현지 생산 시설 확장으로 인해 중동 및 동아프리카 전역의 제약 제조 공정에서 점점 더 중요해지고 있습니다.
- 제약용 용매에 대한 수요 급증은 주로 이 지역의 인구 증가, 만성 질환 유병률 증가, 의료 접근성 및 인프라 개선에 대한 관심 증가에 따른 것입니다.
- UAE는 2024년 기준 32.7%의 최고 매출 점유율을 기록하며 MEA 제약 용매 시장을 장악했습니다. 이는 첨단 제약 부문, 규제 지원, 잘 확립된 유통 네트워크 덕분입니다. 이집트와 사우디아라비아와 같은 국가는 외국인 투자 증가와 지원적인 의료 개혁으로 인해 급속한 성장을 보이고 있습니다.
- 사우디아라비아 국가들은 정부 주도의 현지화 노력, 연구개발 이니셔티브 확대, 지역 제약 제조 허브의 전략적 확장에 힘입어 예측 기간 동안 가장 빠른 성장을 경험할 것으로 전망됩니다.
- 알코올 부문은 2024년에 38.5%의 가장 큰 매출 점유율로 시장을 지배했으며, 특히 경구 액상 약물 및 국소 제제 제조에 널리 사용됨에 따라 주도되었습니다.
보고서 범위 및 중동 아프리카 제약 용매 시장 세분화
|
속성 |
제약용 용매 주요 시장 통찰력 |
|
다루는 세그먼트 |
|
|
포함 국가 |
중동 및 아프리카
|
|
주요 시장 참여자 |
|
|
시장 기회 |
|
|
부가가치 데이터 정보 세트 |
Data Bridge Market Research에서 큐레이팅한 시장 보고서에는 시장 가치, 성장률, 세분화, 지리적 범위, 주요 업체 등 시장 시나리오에 대한 통찰력 외에도 심층적인 전문가 분석, 가격 분석, 브랜드 점유율 분석, 소비자 설문 조사, 인구 통계 분석, 공급망 분석, 가치 사슬 분석, 원자재/소모품 개요, 공급업체 선택 기준, PESTLE 분석, Porter 분석 및 규제 프레임워크가 포함되어 있습니다. |
중동 및 동아프리카 제약용 용매 시장 동향
“고순도 용매 및 첨단 제형 기술에 대한 집중 강화”
- 중동 및 동아프리카 제약용 용매 시장에서 중요하고 가속화되는 추세는 엄격한 규제 기준을 충족하고 해당 지역의 확장 중인 제약 부문에서 약물의 안전성과 효능을 개선하기 위해 고순도 용매와 첨단 제형 기술에 대한 강조가 커지고 있다는 것입니다.
- 예를 들어, BASF와 Merck KGaA와 같은 다국적 공급업체는 GMP(우수 제조 기준) 요구 사항을 충족하도록 맞춤 제작된 제약품 등급 용매를 제공하는 경우가 늘어나고 있으며, 이를 통해 현지 제조업체가 지역 및 국제적 품질 규정을 준수하도록 지원하고 있습니다.
- 고순도 용매를 사용하면 더욱 정밀한 약물 제형이 가능하고, 오염 위험을 줄이며, 복잡한 제네릭 의약품 및 특수 의약품 생산을 지원합니다. 이러한 용매를 사용하는 첨단 제형 기술은 활성 의약품 성분(API)의 용해도 및 생체이용률 향상에도 기여하고 있으며, 이는 이 지역에서 널리 퍼진 만성 질환 및 감염성 질환 치료에 중요한 고려 사항입니다.
- 게다가 제약 회사들은 환경적 지속 가능성과 비용 효율성을 보장하기 위해 용매 회수 및 재활용 시스템을 도입하고 있습니다. 특히 남아프리카와 케냐와 같이 환경 규제가 점점 더 엄격해지고 있는 국가에서는 이러한 경향이 두드러집니다.
- 이러한 추세는 지역 및 글로벌 기업 간의 혁신을 촉진하고 있으며, Clariant와 Eastman Chemical Company와 같은 회사는 성능과 친환경적 특성을 결합한 차세대 용매를 개발하기 위해 R&D에 투자하고 있습니다.
- 정부와 의료 기관이 중동 및 동아프리카에서 안전하고 효과적이며 저렴한 의약품에 대한 접근성을 확대하기 위해 노력함에 따라, 고순도 특수 용매에 대한 수요는 공공 및 민간 부문의 제약 이니셔티브에서 계속해서 증가하고 있습니다.
중동 및 동아프리카 제약용 용매 시장 동향
운전사
“제약 제조 및 의료 수요 확대로 수요 증가”
- 중동부 아프리카 전역에서 제약품 제조 기반이 확대되고, 저렴하고 접근하기 쉬운 의료 솔루션에 대한 수요가 증가함에 따라 이 지역의 제약용 용매에 대한 수요가 크게 증가하고 있습니다.
- 예를 들어, 2024년 3월 남아프리카 공화국 정부는 필수 의약품의 국내 생산을 늘리고, 제약 인프라에 대한 투자를 장려하며, 약물 제형에 사용되는 고품질 용매에 대한 수요를 늘리기 위한 이니셔티브를 시작했습니다.
- 이 지역의 점점 더 많은 국가들이 약물 생산에서 자급자족을 우선시함에 따라, 특히 제네릭 및 필수 의약품의 경우 제약 용매는 현지 제조 공정에서 일관성, 품질 및 규정 준수를 보장하는 데 중요한 역할을 하고 있습니다.
- 또한 당뇨병이나 심혈관 질환과 같은 비전염성 질환의 부담이 커지면서 복잡한 약물 제형에 대한 수요도 늘어나고 있으며, 이 중 많은 약물은 용해도와 안정성을 위해 특정 용매를 필요로 합니다.
- 글로벌 및 지역 제약 회사들 또한 중동 및 동아프리카 지역의 생산 시설과 R&D 운영에 투자하여 비용 이점을 활용하고 신흥 시장에 대한 접근성을 높이고 있습니다. 이는 의약품 접근성과 품질을 개선하기 위한 정부 인센티브와 국제 보건 기구와의 파트너십을 통해 더욱 뒷받침됩니다.
- 첨단 제형 및 용매 회수 시스템을 사용하는 등 제약품 제조 분야의 현대화 및 자동화 추세는 해당 지역 전체에서 효율성을 높이고 용매 소비를 늘리고 있습니다.
제지/도전
“규제 문제와 고품질 용매에 대한 제한된 접근성”
- 중동 및 동아프리카 제약용 용매 시장이 직면한 중요한 과제 중 하나는 규제 환경이 분열되고 계속 변화하고 있다는 점입니다. 이로 인해 시장 진입이 복잡해지고 국경을 넘나드는 품질 기준의 불일치가 발생할 수 있습니다.
- 예를 들어, 이 지역의 일부 국가에는 확립된 제약 규제 프레임워크가 부족하여 국제 GMP 표준을 충족하는 제약 등급 용매의 지속적인 가용성을 보장하는 데 어려움이 있습니다.
- 고순도 용매의 국내 생산 제한과 수입 의존도 또한 공급망 취약성, 가격 변동, 그리고 농촌 지역이나 의료 서비스 취약 지역의 접근성 제한을 야기합니다. 이는 의약품 제조 공정의 일관성을 저해하고 의약품 출시 시기를 지연시킬 수 있습니다.
- 또한 용매 순도, 보관 및 안전한 취급 인프라를 유지하는 데 드는 높은 비용은 중소 제약 제조업체에 재정적 부담이 될 수 있으며, 특히 산업 기반이 덜 발달한 국가의 경우 더욱 그렇습니다.
- 이러한 문제를 해결하려면 지역별 규제 조화를 조율하고, 현지 용매 생산 역량에 투자하고, 제약 회사가 현대 제조 기술과 품질 관리 시스템을 도입하도록 더 많이 지원해야 합니다.
- 이러한 장벽을 극복하고 중동아프리카의 제약용 용매 시장의 지속 가능한 성장을 보장하려면 정부, 업계 이해 관계자, 국제 보건 기관 간의 파트너십을 강화하는 것이 필수적입니다.
중동 및 동아프리카 제약용 용매 시장 범위
중동 및 아프리카 제약용 용매 시장은 제품과 응용 분야를 기준으로 두 개의 주요 부문으로 세분화됩니다.
• 제품별
중동 및 동아프리카 제약 용매 시장은 제품별로 알코올, 아민, 에스테르, 에테르, 방향족 탄화수소, 염소화 용매, 케톤 및 기타로 구분됩니다. 알코올 부문은 2024년 38.5%의 매출 점유율로 시장을 장악했으며, 특히 경구용 액제 및 국소 제제 제조에 널리 사용되면서 시장을 주도했습니다. 에탄올 및 이소프로판올과 같은 알코올은 높은 용해력, 낮은 독성, 그리고 다양한 API와의 호환성으로 인해 제형 및 멸균 목적 모두에 이상적입니다.
케톤 부문은 2025년부터 2032년까지 가장 빠른 연평균 성장률(CAGR)을 기록할 것으로 예상되는데, 이는 특히 물에 잘 녹지 않는 약물을 포함한 복잡한 제형에서의 응용 증가에 힘입은 것입니다. 아세톤이나 메틸에틸케톤과 같은 용매는 뛰어난 증발 속도와 다른 용매와의 혼합성으로 효율적인 약물 처리를 가능하게 하여 인기를 얻고 있습니다. 제약 R&D 활동의 증가는 케톤과 같은 고성능 용매 분야의 성장을 더욱 뒷받침하고 있습니다.
• 응용 프로그램별
중동 및 동아프리카 제약 용매 시장은 용도별로 제약, 연구소, 화학, 기타로 구분됩니다. 제약 부문은 2024년 시장 매출 점유율 66.3%로 가장 큰 비중을 차지했으며, 이는 주로 제네릭 및 브랜드 의약품 수요 증가, 국내 제약 생산 증가, 그리고 지역 의료 인프라 강화를 위한 정부 정책 강화에 따른 것입니다. 이 부문의 용매는 합성, 정제 및 제형 공정에 광범위하게 사용되므로 약물 개발 수명 주기의 핵심 구성 요소입니다.
연구 실험실 부문은 남아프리카공화국, 케냐, 나이지리아 등 주요 국가에서 신약 개발, 생명과학 연구, 그리고 산학 협력에 대한 투자 증가에 힘입어 2025년부터 2032년까지 가장 빠른 연평균 성장률(CAGR)을 기록할 것으로 예상됩니다. 치료 분야 전반에 걸쳐 R&D가 강화됨에 따라 분석 및 실험 분야에서 고순도 용매에 대한 수요가 빠르게 증가하고 있습니다. 또한, 국제기구와 민간 부문의 자금 지원이 이 지역의 실험실 역량 강화에 중추적인 역할을 하며 장기적인 성장을 견인하고 있습니다.
중동 및 동아프리카 제약용 용매 시장 지역 분석
- UAE는 2024년 32.7%의 가장 큰 점유율로 신흥 제약 용매 시장의 핵심 부문을 장악했으며, 이는 제약 제조 확대, 제네릭 의약품 수요 증가, 지역 의료 인프라에 대한 투자 증가에 힘입은 것입니다.
- 이 지역의 제약 회사들은 더욱 엄격한 규제 기준과 치료 응용 분야 전반에 걸쳐 일관된 제품 품질에 대한 필요성에 따라 약물 제형 및 가공을 위한 고품질 용매를 점점 더 우선시하고 있습니다.
- 이러한 성장은 의료비 지출 증가, 정부 지원 현지화 전략, 글로벌 제약 회사와의 파트너십으로 더욱 가속화되었으며, 제약 용매는 지역 의약품 생산 목표를 충족하는 데 필수적인 구성 요소로 자리 잡았습니다.
남아프리카 공화국 제약 용매 시장 통찰력
남아프리카공화국은 탄탄한 제약 제조 산업과 우호적인 규제 환경에 힘입어 2024년 중동 및 동아프리카 제약 용매 시장에서 37.8%의 최대 매출 점유율을 기록하며 시장을 장악했습니다. 남아프리카공화국은 국내 의약품 생산 및 수출 역량 강화에 집중하면서 고품질 제약 용매에 대한 수요가 급증했습니다. 의료 인프라 투자와 첨단 제조 기술 도입 증가는 시장 확장을 더욱 가속화하고 있습니다. 남아프리카공화국은 지역 제약 허브로서 유통 및 공급망 효율성을 높여 시장 지위를 강화하고 있습니다.
사우디 아라비아 제약 용매 시장 통찰력
사우디아라비아 제약 용매 시장은 예측 기간 동안 상당한 연평균 성장률(CAGR)을 기록할 것으로 예상되며, 이는 사우디아라비아의 야심찬 의료 현대화 계획과 비전 2030(Vision 2030) 사업에 힘입은 것입니다. 제약 제조 시설에 대한 투자 증가와 제네릭 의약품 수요 증가는 용매 소비를 촉진하고 있습니다. 또한, 국내 생산 확대 및 수입 의존도 감소를 위한 규제 개혁은 특히 약물 제형 및 합성에 사용되는 특수 용매 시장의 성장을 촉진하고 있습니다.
UAE 제약 용매 시장 통찰력
UAE 제약 용매 시장은 물류 및 무역 허브로서의 전략적 입지와 의료 투자 증가에 힘입어 꾸준한 성장세를 보일 것으로 예상됩니다. 정부의 제약 혁신 지원과 계약 생산 및 연구 서비스 수요 증가로 용매 사용량이 증가했습니다. 또한, UAE의 임상 연구 활동 확대와 다국적 제약 회사 유치 노력은 이 지역의 고급 용매 수요 증가에 기여하고 있습니다.
이집트 제약 용매 시장 통찰력
이집트의 제약 용매 시장은 다각화된 제약 산업과 아프리카 및 중동 지역 수출 증가에 힘입어 꾸준히 성장할 것으로 예상됩니다. 제조 인프라를 개선하고 규제 기준을 조율하려는 정부의 노력은 고품질 의약품 생산에 필요한 용매 수요 증가에 발맞춰 진행되고 있습니다. 국내 제약 회사의 성장과 글로벌 기업과의 파트너십은 시장 전망을 더욱 밝게 합니다.
이스라엘 제약 용매 시장 통찰력
이스라엘의 제약 용매 시장은 제약 R&D와 바이오 제약 혁신에 대한 강력한 집중으로 인해 빠른 성장을 보이고 있습니다. 이스라엘의 선진 연구 생태계와 증가하는 임상 시험 활동은 특수 용매에 대한 높은 수요를 촉진합니다. 더욱이, 이스라엘의 활발한 제약 기술 스타트업 환경과 바이오테크 기업에 대한 정부의 인센티브는 용매 시장 성장에 크게 기여하고 있습니다.
중동 및 동아프리카 제약용 용매 시장 점유율
제약용 용매 산업은 주로 다음을 포함한 잘 확립된 회사들이 주도하고 있습니다.
- 듀폰(미국)
- 미쓰이 케미컬(일본)
- 다우(미국)
- 클라리언트(스위스)
- 브렌타크 SE(독일)
- 올린 코퍼레이션(미국)
- Merck KGaA(독일)
- Royal Dutch Shell Plc(영국/네덜란드)
- SK지오센트릭 주식회사(한국)
- 이스트만 케미컬 컴퍼니(미국)
- LyondellBasell Industries Holdings BV(네덜란드)
- BASF SE(독일)
- 엑손모빌 코퍼레이션(미국)
- Avantor, Inc. (미국)
중동 및 동아프리카 제약용 용매 시장의 최근 동향은 무엇인가?
- 2023년 4월, 선도적인 통합 화학 및 에너지 기업인 사솔 리미티드(Sasol Limited, 남아프리카 공화국)는 중동 및 동아프리카 지역의 증가하는 수요를 충족하기 위해 제약 용매 생산 용량 확장 이니셔티브를 시작했습니다. 이 전략적 조치는 지역 공급망을 강화하고 수입 의존도를 줄임으로써 지역 제약 산업의 성장을 지원하는 것을 목표로 합니다. 사솔은 첨단 정제 기술과 지속 가능한 생산 방식을 활용하여 해당 지역 제약 산업의 변화하는 요구에 맞춘 고품질 용매를 공급하겠다는 의지를 더욱 강화하고 있습니다.
- 2023년 3월, 특수 화학 분야의 주요 기업인 Sipchem(사우디 아라비아)은 엄격한 환경 규정을 준수하도록 설계된 새로운 친환경 제약 용매 제품군을 출시한다고 발표했습니다. 이 제품 출시는 성능 저하 없이 친환경적인 대안을 모색하는 제약 제조업체를 대상으로 합니다. Sipchem은 혁신과 지속가능성에 중점을 두고 있으며, 이는 중동 제약 분야의 규제 및 시장 요구 사항을 충족하고자 하는 Sipchem의 헌신을 보여줍니다.
- 2023년 3월, 걸프 파마슈티컬 인더스트리즈(Julphar)(UAE)는 자사 제조 시설의 용매 정제 공정을 개선하는 대규모 프로젝트를 시작하여 용매 품질과 운영 효율성을 개선했습니다. 이러한 발전은 중동 및 아프리카 전역에서 의약품 생산 기준을 높이고 규제 준수를 보장하여 더욱 안전하고 효과적인 의약품 생산에 기여한다는 Julphar의 사명을 뒷받침합니다.
- 2023년 2월, EIPICO(Egyptian International Pharmaceutical Industries Company, 이집트)는 복합 약물 제형용 특수 용매에 중점을 두고 용매 포트폴리오를 다각화하기 위해 국제 화학 공급업체와 협력 계약을 체결했습니다. 이 파트너십은 이집트 제약 제조업체의 제품 가용성을 개선하고 리드타임을 단축하기 위해 마련되었습니다. EIPICO의 전략적 협력은 이집트가 이 지역의 제약 제조 허브로서 입지를 강화하려는 EIPICO의 의지를 보여줍니다.
- 2023년 1월, 이스라엘의 테바 파마슈티컬 인더스트리즈(Teva Pharmaceutical Industries Ltd.)는 생물학 및 첨단 약물 전달 시스템에 최적화된 새로운 제약 용매 개발을 목표로 하는 새로운 연구 이니셔티브를 발표했습니다. 이 이니셔티브는 테바의 R&D 투자와 중동 지역 제약 혁신 분야의 선도적 입지를 강조합니다. 테바는 최첨단 용매 기술을 통합하여 약물 효능과 제조 효율성을 향상시키고, 이를 통해 중동 제약 산업의 성장을 더욱 촉진하고자 합니다.
SKU-
세계 최초의 시장 정보 클라우드 보고서에 온라인으로 접속하세요

- 대화형 데이터 분석 대시보드
- 높은 성장 잠재력 기회를 위한 회사 분석 대시보드
- 사용자 정의 및 질의를 위한 리서치 분석가 액세스
- 대화형 대시보드를 통한 경쟁자 분석
- 최신 뉴스, 업데이트 및 추세 분석
- 포괄적인 경쟁자 추적을 위한 벤치마크 분석의 힘 활용
연구 방법론
데이터 수집 및 기준 연도 분석은 대규모 샘플 크기의 데이터 수집 모듈을 사용하여 수행됩니다. 이 단계에는 다양한 소스와 전략을 통해 시장 정보 또는 관련 데이터를 얻는 것이 포함됩니다. 여기에는 과거에 수집한 모든 데이터를 미리 검토하고 계획하는 것이 포함됩니다. 또한 다양한 정보 소스에서 발견되는 정보 불일치를 검토하는 것도 포함됩니다. 시장 데이터는 시장 통계 및 일관된 모델을 사용하여 분석하고 추정합니다. 또한 시장 점유율 분석 및 주요 추세 분석은 시장 보고서의 주요 성공 요인입니다. 자세한 내용은 분석가에게 전화를 요청하거나 문의 사항을 드롭하세요.
DBMR 연구팀에서 사용하는 주요 연구 방법론은 데이터 마이닝, 시장에 대한 데이터 변수의 영향 분석 및 주요(산업 전문가) 검증을 포함하는 데이터 삼각 측량입니다. 데이터 모델에는 공급업체 포지셔닝 그리드, 시장 타임라인 분석, 시장 개요 및 가이드, 회사 포지셔닝 그리드, 특허 분석, 가격 분석, 회사 시장 점유율 분석, 측정 기준, 글로벌 대 지역 및 공급업체 점유율 분석이 포함됩니다. 연구 방법론에 대해 자세히 알아보려면 문의를 통해 업계 전문가에게 문의하세요.
사용자 정의 가능
Data Bridge Market Research는 고급 형성 연구 분야의 선두 주자입니다. 저희는 기존 및 신규 고객에게 목표에 맞는 데이터와 분석을 제공하는 데 자부심을 느낍니다. 보고서는 추가 국가에 대한 시장 이해(국가 목록 요청), 임상 시험 결과 데이터, 문헌 검토, 재생 시장 및 제품 기반 분석을 포함하도록 사용자 정의할 수 있습니다. 기술 기반 분석에서 시장 포트폴리오 전략에 이르기까지 타겟 경쟁업체의 시장 분석을 분석할 수 있습니다. 귀하가 원하는 형식과 데이터 스타일로 필요한 만큼 많은 경쟁자를 추가할 수 있습니다. 저희 분석가 팀은 또한 원시 엑셀 파일 피벗 테이블(팩트북)로 데이터를 제공하거나 보고서에서 사용 가능한 데이터 세트에서 프레젠테이션을 만드는 데 도움을 줄 수 있습니다.

