

Global Surface Analysis Market
시장 규모 (USD 10억)
연평균 성장률 :
% 
 USD
6.10 Billion
USD
8.68 Billion
2024
2032
USD
6.10 Billion
USD
8.68 Billion
2024
2032
| 2025 –2032 | |
| USD 6.10 Billion | |
| USD 8.68 Billion | |
| % | |
|
글로벌 표면 분석 시장, 기술별(현미경, 분광법, X선 회절(XRD), 표면 분석기), 유형(XPS(X선 광전자 분광법), TOF-SIMS(비행시간형 2차 이온 질량 분석법), AES(오거 전자 분광법), 라만(라만 분광법), UPS(자외선 광전자 분광법), ISS(이온 산란 분광법) 및 기타), 방법 유형(분광법, 현미경 방법 및 고전적 방법), 장비 유형(주사 프로브 현미경(SPM)/원자간력 현미경(AFM), 전자 프로브 마이크로 분석기(EPMA), X선 광전자 분광기(XPS)/화학 분석을 위한 전자 분광법(ESCA) 및 기타), 응용 분야(재료 구성, 표면 거칠기 및 지형, 박막 분석, 표면 오염, 파손 분석, 부식 분석 및 표면 개질, 최종 사용자(산업, 연구 기관 및 학술 기관) - 2032년까지의 산업 동향 및 예측
표면 분석 시장 분석
글로벌 표면 분석 시장은 반도체, 제약, 항공우주 등 산업 전반에서 정밀한 재료 특성 분석에 대한 수요 증가에 힘입어 상당한 성장을 경험하고 있습니다. 이 시장에는 X선 광전자 분광법(XPS), 원자간력 현미경(AFM), 2차 이온 질량 분석법(SIMS)과 같은 첨단 기술이 포함되어 있으며, 이를 통해 상세한 표면 구성 및 구조 분석이 가능합니다. AI 기반 데이터 해석, 하이브리드 분석 기술, 자동화를 포함한 기술 발전은 정확도와 효율성을 향상시키고 있습니다. R&D 투자 증가, 나노기술 적용 분야 확대, 그리고 재료 품질 및 안전에 대한 규제 요건 강화는 이 시장을 더욱 성장시키고 있습니다.
표면 분석 시장 규모
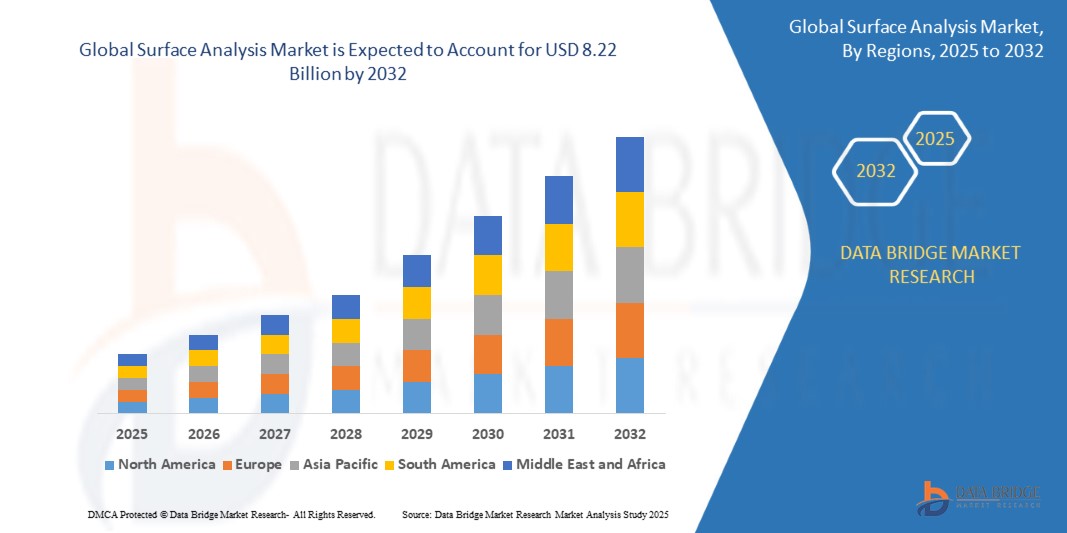
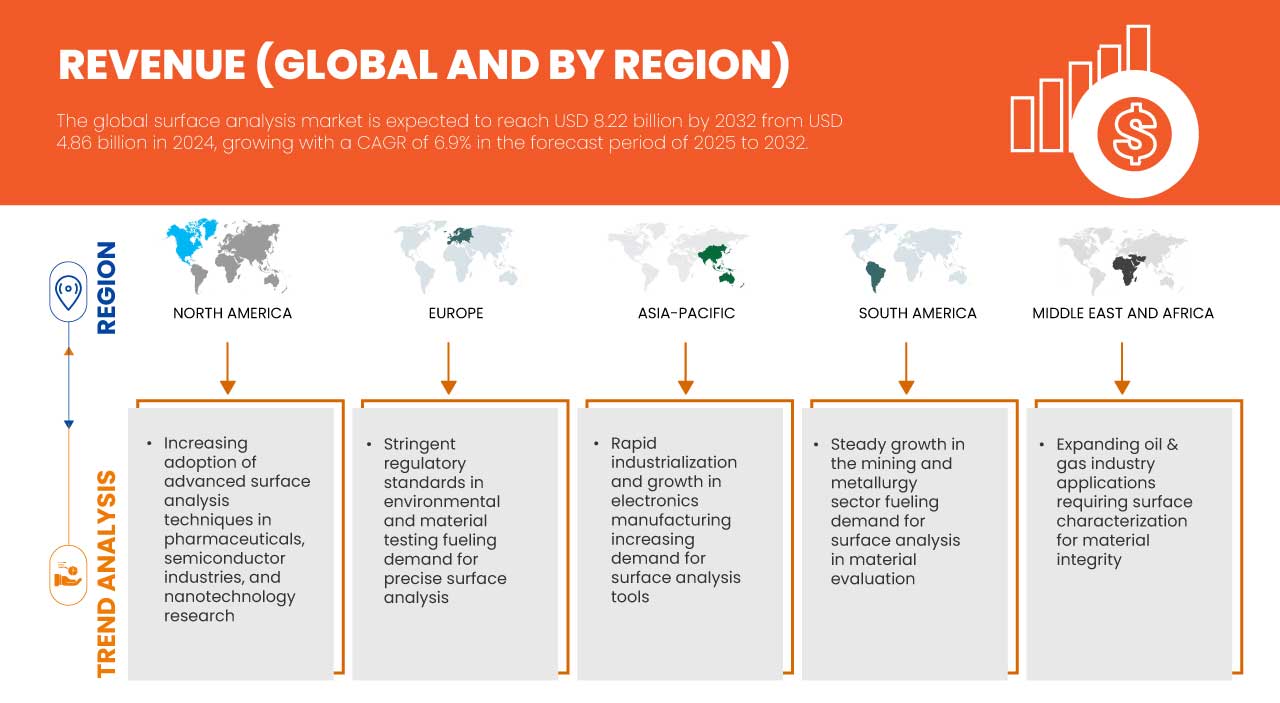
글로벌 표면 분석 시장 규모는 2024년에 48억 6천만 달러로 평가되었으며, 2032년에는 82억 2천만 달러에 이를 것으로 예상되며, 2025년부터 2032년까지의 예측 기간 동안 연평균 성장률은 6.9%입니다. Data Bridge Market Research에서 큐레이팅한 시장 보고서에는 시장 가치, 성장률, 세분화, 지리적 범위, 주요 업체와 같은 시장 시나리오에 대한 통찰력 외에도 심층적인 전문가 분석, 수입/수출 분석, 가격 분석, 생산 소비 분석 및 유봉 분석이 포함되어 있습니다.
표면 분석 시장 동향
“고정밀 재료 특성화에 대한 수요 증가”
고정밀 재료 특성 분석에 대한 요구가 증가함에 따라 표면 분석 시장의 발전이 가속화되고 있습니다. 반도체, 제약, 항공우주 등의 산업은 제품 품질과 성능을 보장하기 위해 더욱 정확하고 신뢰할 수 있는 표면 평가 기술을 요구하고 있습니다. 분광학, 현미경, 질량 분석법의 혁신은 분석 역량을 향상시켜 실시간 심층 표면 평가를 가능하게 합니다. 또한, 자동화 및 AI 기반 데이터 처리는 효율성을 높이고 오류를 줄이며 연구 개발 프로세스를 가속화하고 있습니다. 재료 무결성 및 안전에 대한 규제 기준이 강화됨에 따라 고급 표면 분석 기술의 도입이 증가하여 다양한 첨단 기술 분야에서 그 역할이 더욱 강화될 것으로 예상됩니다.
보고서 범위 및 표면 분석 시장 세분화
|
속성 |
표면 분석 주요 시장 통찰력 |
|
다루는 세그먼트 |
|
|
포함 국가 |
미국, 캐나다, 멕시코, 영국, 독일, 프랑스, 이탈리아, 스페인, 러시아, 네덜란드, 스위스, 벨기에, 터키, 룩셈부르크, 유럽 기타 지역, 중국, 일본, 인도, 한국, 호주, 뉴질랜드, 싱가포르, 말레이시아, 태국, 인도네시아, 필리핀, 대만, 베트남, 아시아 태평양 기타 지역, 브라질, 아르헨티나, 남미 및 UAE 기타 지역, 사우디 아라비아, 남아프리카, 이집트, 이스라엘, 중동 및 아프리카 기타 지역 |
|
주요 시장 참여자 |
SERMA GROUP(프랑스), Shimadzu Corporation(일본), Eurofins Scientific(룩셈부르크), Thermo Fisher Scientific Inc(미국), SAI Ltd(영국), SPECS GmbH(독일), Physical Electronics, Inc.(PHI)(미국), Staib Instruments(독일), Hiden Analytical(영국), Bruker(미국), HORIBA Group(일본), JEOL Ltd(일본), Carl Zeiss AG(독일), TESCAN GROUP, as(체코), TSI(미국), Nikon Instruments Inc.(미국) |
|
시장 기회 |
|
|
부가가치 데이터 정보 세트 |
Data Bridge Market Research에서 큐레이팅한 시장 보고서에는 시장 가치, 성장률, 세분화, 지리적 적용 범위, 주요 기업 등 시장 시나리오에 대한 통찰력 외에도 심층적인 전문가 분석, 환자 역학, 파이프라인 분석, 가격 분석, 규제 프레임워크가 포함됩니다. |
표면 분석 시장 정의
표면 분석은 재료의 가장 바깥층을 연구하여 성분, 구조, 거칠기, 화학적 특성을 파악하는 것입니다. X선 광전자 분광법(XPS), 원자간력 현미경(AFM), 이차 이온 질량 분석법(SIMS)과 같은 첨단 기술을 활용하여 미시적 및 원자적 수준에서 표면을 분석합니다. 반도체, 제약, 항공우주, 나노기술 등 재료의 특성이 성능과 신뢰성에 큰 영향을 미치는 산업에서는 표면 분석이 필수적입니다. 표면 특성에 대한 상세한 통찰력을 제공함으로써, 표면 분석은 제품 품질 향상, 제조 공정 최적화, 규제 준수를 보장합니다.
표면 분석 시장 동향
운전자
- 의료·제약 기업 R&D 지출 증가
이러한 산업들이 혁신적인 의약품 및 의료기기 개발에 집중함에 따라, 정밀한 표면 특성 분석은 제품 품질 및 규제 준수를 보장하는 데 필수적입니다. 이러한 R&D 지출 급증은 표면 분석의 혁신을 가속화하여 주요 의료 분야에서의 적용 범위를 확대하고 있습니다. 또한, 투자 증가로 인해 더 높은 분해능과 감도를 제공하는 최첨단 분석 장비 개발이 촉진되었습니다. 이러한 발전을 통해 기업들은 엄격한 규제 기준을 충족하는 동시에 제품 개발 분야에서 획기적인 연구를 촉진할 수 있습니다.
예를 들어,
- 딜로이트가 발표한 자료에 따르면, 2024년 4월, 글로벌 제약 회사들은 2023년 R&D 투자 수익률(ROI)을 4.1%로 끌어올려 사상 최저치를 기록했습니다. 상위 20대 제약 회사들은 복잡한 임상시험과 규제 변화로 인해 R&D에 1,450억 달러를 지출했습니다. 이러한 혁신 증가는 품질 관리 및 공정 최적화에 대한 투자 증가로 이어졌습니다. 결과적으로, 표면 분석을 포함한 첨단 분석 기법이 약물 안전성과 성능을 보장하는 데 중요해지면서 표면 분석 시장 성장에 기여했습니다.
표면 분석 방법 활용 증가
표면 분석 방법의 통합은 표면 결함을 정확하게 감지하고 일관성을 유지함으로써 제조 공정을 최적화합니다. 이러한 광범위한 사용은 표면 분석 도구의 다재다능함을 강조하고 다양한 산업 분야에서 시장 성장을 촉진합니다. 또한, 기술 발전으로 운영 비용이 절감되어 더 광범위한 산업 분야에서 이러한 기술을 더 쉽게 활용할 수 있게 되었습니다. 사용자 친화적인 소프트웨어의 지속적인 발전은 데이터 해석 및 공정 제어를 더욱 향상시켜 전반적인 효율성을 향상시킵니다.
예를 들어,
엘스비어(Elsevier Inc.)에서 발표한 논문에 따르면, 2025년 3월, 연구진은 AI 강화 X선 현미경을 사용하여 비정질 고체 분산액에서 결정질 미코나졸을 비파괴적으로 검출하고 정량화했습니다. 연구진은 고급 이미징 기술과 AI 기반 분할 기술을 결합하여 상세한 입자 크기 분포를 확보하고 인적 오류를 줄였습니다. 이 기술은 의약품 제조의 품질 관리를 개선하고 정밀 표면 분석에 대한 명확한 이점을 보여주었으며, 이는 글로벌 표면 분석 시장의 성장을 촉진할 것으로 예상됩니다.
기회
- 새로운 나노기술은 분석에 획기적인 기술을 제공합니다
새롭게 부상하는 나노기술은 원자 및 분자 수준의 분석을 가능하게 하여 전례 없는 분해능과 정확도를 제공함으로써 혁신을 주도하고 있습니다. 이러한 발전은 기존 방식으로는 접근하기 어려웠던 미세한 표면 특징의 검출 및 특성 분석을 가능하게 합니다. 이러한 나노기술 기반 기술은 끊임없이 발전하며 재료 과학 및 품질 관리 분야의 새로운 가능성을 열어주고 있으며, 다양한 산업 분야에서 표면 분석 응용 분야의 성장을 촉진하고 있습니다.
예를 들어: -
- 2024년 6월, Springer Nature Limited에서 발표한 논문에 따르면, 연구진은 첨단 환경 주사 전자 현미경(A-ESEM)을 사용하여 응축된 유사 분열 염색체의 자연적인 나노 형태를 밝혀냈습니다. 머신 러닝을 적용하여 조건을 최적화함으로써 민감하고 습한 샘플을 손상 없이 고해상도로 이미징할 수 있었습니다. 이 획기적인 연구를 통해 이전에는 관찰되지 않았던 염색체 표면의 구조적 세부 사항을 발견할 수 있었습니다. 이 연구는 나노기술이 표면 분석 시장을 발전시킬 중요한 기회를 제공함을 보여주었습니다.
전략적 파트너십과 합병으로 시장 확장 가속화
전략적 파트너십과 합병은 상호 보완적인 전문 지식과 자원을 결합하여 시장 성장을 촉진하는 시너지 효과를 창출합니다. 이러한 협업은 공유 기술, 고객 네트워크 및 시장 통찰력을 활용하여 고급 표면 분석 기술의 개발 및 배포를 간소화합니다. 결과적으로 기업은 제품 출시 기간을 단축하고, 글로벌 입지를 확대하며, 변화하는 산업 과제에 더욱 효과적으로 대처할 수 있으며, 궁극적으로 표면 분석 시장의 전반적인 성장을 가속화할 수 있습니다.
예를 들어,
Cision US Inc.가 발표한 기사에 따르면, 2025년 2월 Nanovis는 Medtronic이 차세대 PEEK 추체간 유합술 기기에 사용하기 위해 OsteoSync 티타늄 패드 관련 지적 재산을 포함한 특정 나노 표면 기술 자산을 인수했다고 발표했습니다. FDA 승인을 받은 나노 기술은 골유합을 개선하여 척추 수술 시 임플란트 고정력을 향상시킵니다. 이 전략적 인수는 첨단 나노 기술 혁신과 선도적인 의료 기기 설계를 접목하여 표면 분석 시장 확장을 가속화하는 파트너십과 합병의 중요성을 강조했습니다. 이번 협력을 통해 외과 의사들에게 동급 최고의 기기를 제공함으로써 의료 임플란트 분야의 혁신과 시장 성장을 더욱 촉진할 것으로 기대됩니다.
제약/도전
- 정확도에 영향을 미치는 표면 오염 물질에 대한 민감도
X선 광전자 분광법(XPS), 오제 전자 분광법(AES), 비행시간형 이차 이온 질량 분석법(ToF-SIMS)과 같은 기술은 표면에 매우 민감하기 때문에 환경, 취급 또는 시료 전처리 과정에서 발생하는 오염으로 인해 오류가 발생할 수 있습니다. 이러한 문제는 특히 반도체, 제약, 첨단 소재 산업에서 매우 중요한데, 이러한 산업에서는 정밀한 표면 구성 분석이 품질 관리 및 규정 준수에 필수적입니다. 이러한 문제를 해결하려면 엄격한 시료 취급 프로토콜, 통제된 환경, 그리고 원치 않는 표면 변화를 최소화하는 첨단 세척 기술이 필요합니다.
나노기술 및 생체재료 연구에서 고해상도 및 정량적 표면 분석에 대한 수요가 증가함에 따라 오염 관리 대책 개선의 필요성이 더욱 커지고 있습니다. 초고진공(UHV) 조건, 이온 스퍼터링과 같은 현장 세척 기술, 그리고 고급 데이터 보정 알고리즘과 같은 혁신적인 솔루션들이 오염 물질의 영향을 완화하기 위해 연구되고 있습니다. 그러나 이러한 접근 방식은 분석 프로세스의 복잡성과 비용을 증가시켜, 특히 소규모 연구실이나 신흥 산업 분야에서 널리 채택되기 어려운 과제를 안겨줍니다. 표면 분석 기술이 발전함에 따라 자동화, 실시간 오염 감지, 그리고 머신러닝 기반 보정 기술의 발전은 다양한 응용 분야에서 정확도와 신뢰성을 향상시키는 데 핵심적인 역할을 할 것입니다.
예를 들어
XPS 계측학에 따르면 표면 오염은 재료 특성, 코팅 및 접착력에 영향을 미쳐 부식과 성능 저하를 유발하는 경우가 많습니다. 오일, 염분, 대기 오염 물질과 같은 오염 물질은 표면 분석 결과를 왜곡하는데, 특히 나노미터 두께의 층이라도 정확도에 영향을 미치는 XPS의 경우 더욱 그렇습니다. 취급 방식, 장갑, 세척 스프레이는 항공우주 및 반도체 제조와 같은 산업에서 측정 신뢰성을 더욱 저하시킵니다.
- 고급 표면 분석 기술을 위한 숙련된 인력 부족
XPS, SIMS, AFM과 같은 기술은 정밀하고 신뢰할 수 있는 결과를 얻는 데 필수적인 계측, 데이터 해석 및 시료 전처리에 대한 전문 지식을 요구합니다. 숙련된 전문가 부족은 비효율성, 데이터 품질 저하, 분석 시간 연장으로 이어질 수 있으며, 궁극적으로 표면 특성 분석에 의존하는 연구, 품질 관리 및 산업 응용 분야에 부정적인 영향을 미칩니다.
예를 들어:
2020년 1월, 미국 국립의학도서관(National Library of Medicine)에 따르면 X선 광전자 분광법(XPS)이 가장 널리 사용되는 표면 분석 기술이 되었지만, 급속한 도입으로 인해 숙련된 전문가 부족으로 인해 오용 사례가 빈번하게 발생했습니다. 많은 경험이 부족한 사용자들이 정확한 측정 및 데이터 해석에 어려움을 겪으며, 이로 인해 오류와 불일치가 발생합니다. 장비 교정의 편차는 프로세스를 더욱 복잡하게 만들고, 숙련된 전문가 부족은 표면 분석 시장의 주요 과제가 되어 결과의 신뢰성과 재현성에 영향을 미칩니다.
이 시장 보고서는 최근 동향, 무역 규제, 수출입 분석, 생산 분석, 가치 사슬 최적화, 시장 점유율, 국내 및 현지 시장 참여자의 영향, 신규 매출 창출 기회 분석, 시장 규제 변화, 전략적 시장 성장 분석, 시장 규모, 카테고리별 시장 성장, 응용 분야별 틈새 시장 및 시장 지배력, 제품 승인, 제품 출시, 지리적 확장, 시장 기술 혁신 등에 대한 세부 정보를 제공합니다. 시장에 대한 자세한 정보를 원하시면 Data Bridge Market Research에 문의하여 분석 브리핑을 요청해 주십시오. 저희 팀은 시장 성장을 위한 정보에 기반한 시장 결정을 내릴 수 있도록 도와드리겠습니다.
표면 분석 시장 범위
글로벌 표면 분석 시장은 제공 제품, 배포 모델, 조직 규모, 운영 체제 및 애플리케이션을 기준으로 다섯 가지 주요 세그먼트로 구분됩니다. 이러한 세그먼트의 성장은 업계 내 저조한 성장 세그먼트를 분석하고, 사용자에게 핵심 시장 애플리케이션을 파악하기 위한 전략적 의사 결정에 도움이 되는 귀중한 시장 개요와 시장 통찰력을 제공합니다.
기술
- 현미경 사용
- 방법으로
- 전자 현미경
- 광학 현미경
- 공초점 현미경
- 프로브 현미경
- 기술에 따라
- 주사전자현미경(Sem)
- 투과전자현미경(Tem)
- 주사 프로브 현미경(Spm)
- 이미지 분석
- 극저온 전자 현미경(Cryo-Em)
- 기타
- 방법으로
- 분광학
- X선 회절(Xrd)
- 표면 분석기
유형
- Xps(X선 광전자 분광법)
- Tof-Sims(비행시간 이차 이온 질량 분석법)
- Aes(오거 전자 분광법)
- 라만(라만 분광법)
- UPS(자외선 광전자 분광법)
- Iss(이온 산란 분광법)
- 기타
메서드 유형
- 분광법
- 미세한 방법
- 고전적 방법
장비 유형
- 주사 탐침 현미경(SPM)/원자간력 현미경(AFM)
- 운영에 따라
- 오토매틱
- 수동
- 소음 수준별
- 낮은
- 매우 낮음
- 기준
- 운영에 따라
- 전자 프로브 마이크로 분석기(EPMA)
- X선 광전자 분광기(Xps)/화학 분석을 위한 전자 분광법(Esca)
- 기타
애플리케이션
- 재료 구성
- 표면 거칠기 및 지형
- 박막 분석
- 표면 오염
- 고장 분석
- 부식 분석
- 표면 개질
최종 사용자
- 산업
- 유형별
- 반도체
- 생명과학 및 제약
- 폴리머
- 에너지
- 야금 및 광물
- 자동차
- 음식 및 음료
- 직물
- 종이 및 포장
- 기타
- 기술로
- 현미경 사용
- 분광학
- X선 회절(Xrd)
- 표면 분석기
- 유형별
- 연구 기관
- 현미경 사용
- 분광학
- X선 회절(Xrd)
- 표면 분석기
- 학술 기관
- 현미경 사용
- 분광학
- X선 회절(XRD)
- 표면 분석기

표면 분석 시장 지역 분석
기술, 유형, 방법 유형, 장비 유형, 응용 프로그램 및 최종 사용자별로 시장을 분석하고 시장 규모에 대한 통찰력과 추세를 제공합니다.
이 시장에서 다루는 국가는 미국, 캐나다, 멕시코, 영국, 독일, 프랑스, 이탈리아, 스페인, 러시아, 네덜란드, 스위스, 벨기에, 터키, 룩셈부르크 및 기타 유럽 국가, 중국, 일본, 인도, 한국, 호주, 뉴질랜드, 싱가포르, 말레이시아, 태국, 인도네시아, 필리핀, 대만, 베트남 및 기타 아시아 태평양 국가, 브라질, 아르헨티나 및 기타 남미 국가, UAE, 사우디 아라비아, 남아프리카 공화국, 이집트, 이스라엘 및 기타 중동 및 아프리카 국가입니다.
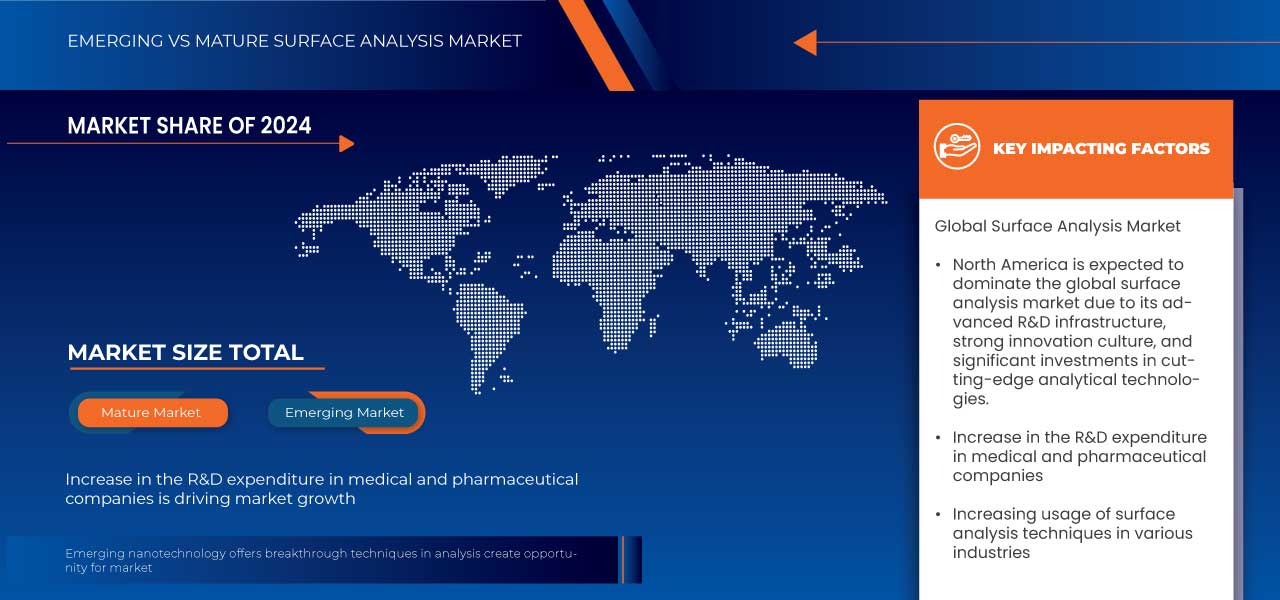
북미 지역은 선진 R&D 인프라, 탄탄한 혁신 문화, 그리고 최첨단 분석 기술에 대한 막대한 투자를 바탕으로 세계 표면 분석 시장을 선도할 것으로 예상됩니다. 항공우주, 의료, 자동차, 전자 등 다양한 산업 분야에서 확고한 기반을 구축한 북미 지역은 정밀 품질 관리 및 재료 특성 분석에 대한 높은 수요를 견인하고 있습니다. 탄탄한 산학 협력과 적극적인 규제 프레임워크는 기술 도입을 더욱 촉진하고 있습니다.
북미는 선도적인 기술 기업의 존재, 연구 개발에 대한 강력한 투자, 첨단 반도체 및 나노기술 산업, 그리고 의료, 전자, 재료 과학 등 다양한 분야에서 최첨단 분석 기술의 높은 도입으로 인해 글로벌 표면 분석 시장에서 가장 빠르게 성장하는 지역이 될 것으로 예상됩니다.
보고서의 국가별 섹션은 개별 시장 영향 요인과 국내 시장 규제 변화도 제시하며, 이는 현재 및 미래 시장 동향에 영향을 미칩니다. 다운스트림 및 업스트림 가치 사슬 분석, 기술 동향, 포터의 5가지 경쟁 요인 분석, 사례 연구 등의 데이터 포인트는 개별 국가의 시장 시나리오를 예측하는 데 활용됩니다. 또한, 남미 브랜드의 존재 및 가용성, 그리고 국내 및 국내 브랜드와의 경쟁이 심화되거나 부족하여 직면하는 과제, 국내 관세 및 무역 경로의 영향 등을 고려하여 국가별 데이터를 예측 분석합니다.
표면 분석 시장 점유율
시장 경쟁 구도는 경쟁사별 세부 정보를 제공합니다. 여기에는 회사 개요, 회사 재무 상태, 창출된 매출, 시장 잠재력, 연구 개발 투자, 신규 시장 진출, 남미 시장 진출, 생산 시설 및 설비, 생산 능력, 회사의 강점과 약점, 제품 출시, 제품 종류 및 범위, 응용 분야별 우위 등이 포함됩니다. 위에 제공된 데이터는 해당 회사의 시장 집중도와 관련된 데이터입니다.
시장에서 활동하는 표면 분석 시장 선두주자는 다음과 같습니다.
- SERMA GROUP(프랑스)
- 시마즈 주식회사(일본)
- Eurofins Scientific(룩셈부르크)
- Thermo Fisher Scientific Inc(미국)
- SAI Ltd(영국)
- SPECS GmbH(독일)
- Physical Electronics, Inc. (PHI) (미국)
- Staib Instruments(독일)
- 히덴 분석(영국)
- 브루커(미국)
- HORIBA 그룹(일본)
- JEOL Ltd(일본)
- Carl Zeiss AG(독일)
- TESCAN GROUP(체코 공화국)
- TSI(미국)
- Nikon Instruments Inc.(미국)
글로벌 표면 분석 시장의 최신 동향
- 2025년 1월, 유로핀스 환경 테스팅 이튼 애널리티컬(Eurofins Environment Testing Eaton Analytical)은 음용수에서 새롭게 발견된 소독 부산물인 클로로니트라마이드 음이온을 검출하는 최첨단 방법을 개발하여 수질 분석 및 안전성을 향상시켰습니다. 이러한 발전은 오염 물질 식별 및 평가 능력을 향상시켜 유로핀스 사이언티픽(Eurofins Scientific)의 표면 및 화학 분석 전문성을 강화하고, 수질 및 환경 안전 분석 시험 분야에서의 리더십을 더욱 공고히 합니다.
- 2022년 7월, ULVAC-PHI는 고속, 고감도 표면 및 계면 분석을 위해 설계된 완전 자동화 XPS/HAXPES 시스템인 PHI GENESIS를 출시했습니다. 이 발전된 시스템은 금속, 반도체, 세라믹 및 유기 재료에 대한 자동화, 감도 및 분석 기능을 향상시켜 Physical Electronics, Inc.의 입지를 강화합니다.
- 2024년 7월, 시마즈(Shimadzu Corporation)는 TESCAN 그룹과 협력하여 올가을 일본에서 TESCAN의 주사전자현미경을 출시하고 분석 측정 솔루션을 확장합니다. 이번 파트너십을 통해 TESCAN의 최첨단 SEM 기술과 기존 장비를 결합하여 시마즈의 표면 분석 역량을 강화하고, 더욱 정밀하고 포괄적인 재료 특성 분석을 가능하게 합니다.
- 2024년 7월, LAB14 GmbH 산하의 FOCUS GmbH와 SPECS Surface Nano Analysis GmbH는 브랜드 아이덴티티를 유지하면서 SPECS Surface Nano Analysis GmbH로 합병되었습니다. 이번 합병을 통해 FOCUS GmbH의 운동량 현미경 및 전자 분광학 전문성을 통합하여 SPECS GmbH의 표면 분석 역량을 강화하고, 더욱 정밀하고 포괄적인 연구 솔루션을 제공할 수 있게 되었습니다.
- 2025년 2월, Thermo Fisher Scientific은 Solventum의 Purification & Filtration 사업부를 41억 달러에 인수하여 성장하는 바이오프로세싱 시장에서의 입지를 강화합니다. 이번 인수를 통해 Thermo Fisher의 여과 및 정제 역량이 강화되어 XPS 및 분광법과 같은 표면 분석 기술을 위한 시료 전처리가 향상되고, 결과적으로 재료 특성 분석의 정밀도와 효율성이 향상됩니다.
SKU-
세계 최초의 시장 정보 클라우드 보고서에 온라인으로 접속하세요

- 대화형 데이터 분석 대시보드
- 높은 성장 잠재력 기회를 위한 회사 분석 대시보드
- 사용자 정의 및 질의를 위한 리서치 분석가 액세스
- 대화형 대시보드를 통한 경쟁자 분석
- 최신 뉴스, 업데이트 및 추세 분석
- 포괄적인 경쟁자 추적을 위한 벤치마크 분석의 힘 활용
목차
1 INTRODUCTION
1.1 OBJECTIVES OF THE STUDY
1.2 MARKET DEFINITION
1.3 OVERVIEW OF GLOBAL SURFACE ANALYSIS MARKET
1.4 CURRENCY AND PRICING
1.5 LIMITATIONS
1.6 MARKETS COVERED
2 MARKET SEGMENTATION
2.1 MARKETS COVERED
2.2 GEOGRAPHICAL SCOPE
2.3 YEARS CONSIDERED FOR THE STUDY
2.4 DBMR TRIPOD DATA VALIDATION MODEL
2.5 PRIMARY INTERVIEWS WITH KEY OPINION LEADERS
2.6 DBMR MARKET POSITION GRID
2.7 MULTIVARIATE MODELING
2.8 THECNOLOGY TIMELINE CURVE
2.9 MARKET APPLICATION COVERAGE GRID
2.1 SECONDARY SOURCES
2.11 ASSUMPTIONS
3 EXECUTIVE SUMMARY
4 PREMIUM INSIGHTS
4.1 INDUSTRY ANALYSIS & FUTURISTIC SCENARIO
4.1.1 SURFACE ANALYSIS IN THE SEMICONDUCTOR INDUSTRY
4.1.2 SURFACE ANALYSIS IN THE ACADEMIC INSTITUTES
4.1.3 SURFACE ANALYSIS IN THE RESEARCH ORGANIZATIONS
4.2 PENETRATION AND GROWTH PROSPECT MAPPING
4.2.1 GROWTH PROSPECT
4.3 COMPETITOR KEY PRICING STRATEGIES
4.4 KEY TECHNOLOGIES
4.4.1 COMPLEMENTARY TECHNOLOGIES
4.4.2 ADJACENT TECHNOLOGIES
4.4.3 CHALLENGES
4.4.4 TECHNOLOGY SPEND OF COMPANY
4.5 COMPANY COMPARATIVE ANALYSIS
5 MARKET OVERVIEW
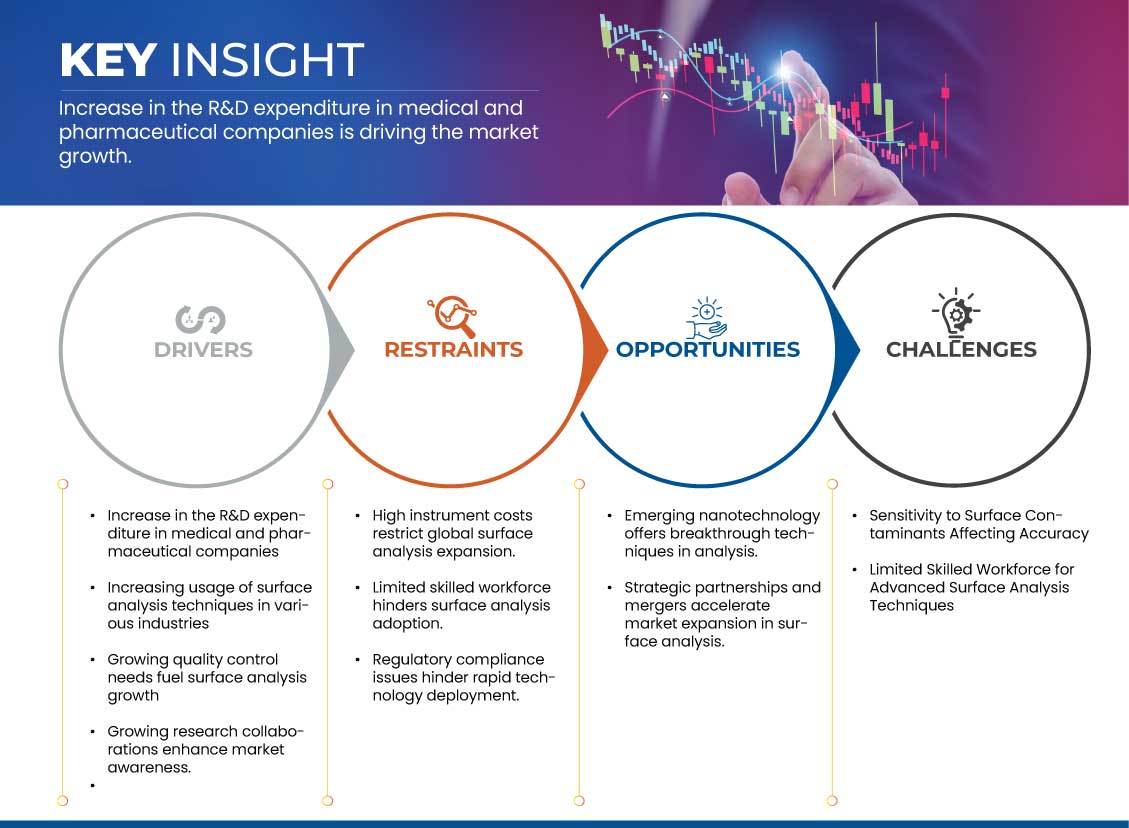
5.1 DRIVERS
5.1.1 INCREASE IN THE R&D EXPENDITURE IN MEDICAL AND PHARMACEUTICAL COMPANIES
5.1.2 GROWING UTILIZATION OF SURFACE ANALYSIS METHODS IS EXPANDING ACROSS SECTORS LIKE ELECTRONICS, AUTOMOTIVE, AEROSPACE, AND ADVANCED MATERIALS
5.1.3 INCREASING QUALITY CONTROL DEMANDS ARE DRIVING THE EXPANSION OF SURFACE ANALYSIS.
5.1.4 GROWING RESEARCH COLLABORATION AMONG ACADEMIA, INDUSTRY, AND GOVERNMENT BOOST MARKET AWARENESS
5.2 RESTRAINTS
5.2.1 HIGH INSTRUMENT COSTS RESTRICT GLOBAL SURFACE ANALYSIS EXPANSION
5.2.2 REGULATORY COMPLIANCE ISSUES HINDER RAPID TECHNOLOGY DEPLOYMENT
5.3 OPPORTUNITIES
5.3.1 EMERGING NANOTECHNOLOGY OFFERS BREAKTHROUGH TECHNIQUES IN ANALYSIS
5.3.2 STRATEGIC PARTNERSHIPS AND MERGERS ACCELERATE MARKET EXPANSION IN SURFACE ANALYSIS
5.4 CHALLENGES
5.4.1 SENSITIVITY TO SURFACE CONTAMINANTS AFFECTING ACCURACY
5.4.2 LIMITED SKILLED WORKFORCE FOR ADVANCED SURFACE ANALYSIS TECHNIQUES
6 GLOBAL SURFACE ANALYSIS MARKET, BY TECHNOLOGY
6.1 OVERVIEW
6.2 MICROSCOPY
6.2.1 MICROSCOPY, BY METHOD
6.2.1.1 ELECTRON MICROSCOPY
6.2.1.2 OPTICAL MICROSCOPY
6.2.1.3 CONFOCAL MICROSCOPY
6.2.1.4 PROBE MICROSCOPY
6.2.2 MICROSCOPY, BY TECHNIQUE
6.2.2.1 SCANNING ELECTRON MICROSCOPY (SEM)
6.2.2.2 TRANSMISSION ELECTRON MICROSCOPY (TEM)
6.2.2.3 SCANNING PROBE MICROSCOPY (SPM)
6.2.2.4 IMAGE ANALYSIS
6.2.2.5 CRYO-ELECTRON MICROSCOPY (CRYO-EM)
6.2.2.6 OTHERS
6.3 SPECTROSCOPY
6.4 X-RAY DIFFRACTION (XRD)
6.5 SURFACE ANALYZERS
7 GLOBAL SURFACE ANALYSIS MARKET, BY TYPE
7.1 OVERVIEW
7.2 XPS (X-RAY PHOTOELECTRON SPECTROSCOPY)
7.3 TOF-SIMS (TIME-OF-FLIGHT SECONDARY ION MASS SPECTROMETRY)
7.4 AES (AUGER ELECTRON SPECTROSCOPY)
7.5 RAMAN (RAMAN SPECTROSCOPY)
7.6 UPS (UV PHOTOELECTRON SPECTROSCOPY)
7.7 ISS (ION SCATTERING SPECTROSCOPY)
7.8 OTHERS
8 GLOBAL SURFACE ANALYSIS MARKET, BY METHOD TYPE
8.1 OVERVIEW
8.2 SPECTROSCOPIC METHOD
8.3 MICROSCOPIC METHOD
8.4 CLASSICAL METHOD
9 GLOBAL SURFACE ANALYSIS MARKET, BY EQUIPMENT TYPE
9.1 OVERVIEW
9.2 SCANNING PROBE MICROSCOPES (SPM)/ATOMIC FORCE MICROSCOPES (AFM)
9.2.1 SCANNING PROBE MICROSCOPES (SPM)/ATOMIC FORCE MICROSCOPES (AFM), BY OPERATION
9.2.1.1 AUTOMATIC
9.2.1.2 MANUAL
9.2.2 SCANNING PROBE MICROSCOPES (SPM)/ATOMIC FORCE MICROSCOPES (AFM), BY NOISE LEVEL
9.2.2.1 LOW
9.2.2.2 EXTREMELY LOW
9.2.2.3 STANDARD
9.3 ELECTRON PROBE MICRO-ANALYZERS (EPMA)
9.4 X-RAY PHOTOELECTRON SPECTROMETERS (XPS)/ELECTRON SPECTROSCOPY FOR CHEMICAL ANALYSIS (ESCA)
9.5 OTHERS
10 GLOBAL SURFACE ANALYSIS MARKET, BY APPLICATION
10.1 OVERVIEW
10.2 MATERIAL COMPOSITION
10.3 SURFACE ROUGHNESS AND TOPOGRAPHY
10.4 THIN FILM ANALYSIS
10.5 SURFACE CONTAMINATION
10.6 FAILURE ANALYSIS
10.7 CORROSION ANALYSIS
10.8 SURFACE MODIFICATION
11 GLOBAL SURFACE ANALYSIS MARKET, BY END USER
11.1 OVERVIEW
11.2 INDUSTRIES
11.2.1 INDUSTRIES, BY TYPE
11.2.1.1 LIFE SCIENCES & PHARMACEUTICALS
11.2.1.2 SEMICONDUCTOR
11.2.1.3 METALLURGY AND MINERALS
11.2.1.4 AUTOMOTIVE
11.2.1.5 ENERGY
11.2.1.6 FOOD AND BEVERAGES
11.2.1.7 POLYMERS
11.2.1.8 TEXTILE
11.2.1.9 PAPER AND PACKAGING
11.2.1.10 OTHERS
11.2.2 INDUSTRIES, BY TECHNOLOGY
11.2.2.1 MICROSCOPY
11.2.2.2 SPECTROSCOPY
11.2.2.3 X-RAY DIFFRACTION (XRD)
11.2.2.4 SURFACE ANALYZERS
11.3 RESEARCH ORGANIZATION
11.3.1 RESEARCH ORGANIZATION, BY TECHNOLOGY
11.3.1.1 MICROSCOPY
11.3.1.2 SPECTROSCOPY
11.3.1.3 X-RAY DIFFRACTION (XRD)
11.3.1.4 SURFACE ANALYZERS
11.4 ACADEMIC INSTITUTES
11.4.1 ACADEMIC INSTITUTES, BY TECHNOLOGY
11.4.1.1 MICROSCOPY
11.4.1.2 SPECTROSCOPY
11.4.1.3 X-RAY DIFFRACTION (XRD)
11.4.1.4 SURFACE ANALYZERS
12 GLOBAL SURFACE ANALYSIS MARKET, BY REGION
12.1 OVERVIEW
12.2 NORTH AMERICA
12.2.1 U.S.
12.2.2 CANADA
12.2.3 MEXICO
12.3 EUROPE
12.3.1 GERMANY
12.3.2 FRANCE
12.3.3 U.K.
12.3.4 ITALY
12.3.5 SPAIN
12.3.6 NETHERLANDS
12.3.7 SWITZERLAND
12.3.8 RUSS.IA
12.3.9 TURKEY
12.3.10 BELGIUM
12.3.11 REST OF EUROPE
12.4 ASIA-PACIFIC
12.4.1 CHINA
12.4.2 JAPAN
12.4.3 SOUTH KOREA
12.4.4 INDIA
12.4.5 AUST.RALIA
12.4.6 SINGAPORE
12.4.7 INDONESIA
12.4.8 THAILAND
12.4.9 MALAYSIA
12.4.10 PHILIPPINES
12.4.11 NEW-ZEALAND
12.4.12 REST OF ASIA-PACIFIC
12.5 SOUTH AMERICA
12.5.1 BRAZIL
12.5.2 ARGENTINA
12.5.3 REST OF SOUTH AMERICA
12.6 MIDDLE EAST AND AFRICA
12.6.1 SAUDI ARABIA
12.6.2 SOUTH AFRICA
12.6.3 U.A.E.
12.6.4 EGYPT
12.6.5 ISRAEL
12.6.6 REST OF MIDDLE EAST AND AFRICA
13 GLOBAL SURFACE ANALYSIS MARKET, COMPANY LANDSCAPE
13.1 COMPANY SHARE ANALYSIS: GLOBAL
13.2 COMPANY SHARE ANALYSIS: NORTH AMERICA
13.3 COMPANY SHARE ANALYSIS: EUROPE
13.4 COMPANY SHARE ANALYSIS: ASIA-PACIFIC
14 SWOT ANALYSIS
15 COMPANY PROFILES
15.1 THERMO FISHER SCIENTIFIC INC.
15.1.1 COMPANY SNAPSHOTS
15.1.2 REVENUE ANALYSIS
15.1.3 COMPANY SHARE ANALYSIS
15.1.4 PRODUCT PORTFOLIO
15.1.5 RECENT DEVELOPMENT
15.2 CARL ZEISS AG
15.2.1 COMPANY SNAPSHOT
15.2.2 COMPANY SHARE ANALYSIS
15.2.3 PRODUCT PORTFOLIO
15.2.4 RECENT DEVELOPMENTS/NEWS
15.3 BRUKER
15.3.1 COMPANY SNAPSHOT
15.3.2 REVENUE ANALYSIS
15.3.3 COMPANY SHARE ANALYSIS
15.3.4 PRODUCT PORTFOLIO
15.3.5 RECENT DEVELOPMENT/ NEWS
15.4 HORIBA GROUP
15.4.1 COMPANY SNAPSHOT
15.4.2 REVENUE ANALYSIS
15.4.3 COMPANY SHARE ANALYSIS
15.4.4 PRODUCT PORTFOLIO
15.4.5 RECENT DEVELOPMENTS
15.5 EUROFINS SCIENTIFIC
15.5.1 COMPANY SNAPSHOT
15.5.2 REVENUE ANALYSIS
15.5.3 COMPANY SHARE ANALYSIS
15.5.4 SERVICE PORTFOLIO
15.5.5 RECENT DEVELOPMENT
15.6 HIDDEN ANALYTICAL
15.6.1 COMPANY SNAPSHOT
15.6.2 PRODUCT PORTFOLIO
15.6.3 RECENT DEVELOPMENT
15.7 JEOL LTD.
15.7.1 COMPANY SNAPSHOTS
15.7.2 REVENUE ANALYSIS
15.7.3 PRODUCT PORTFOLIO
15.7.4 RECENT DEVELOPMENTS/NEWS
15.8 NIKON INSTRUMENTS INC.
15.8.1 COMPANY SNAPSHOT
15.8.2 PRODUCT PORTFOLIO
15.8.3 RECENT DEVELOPMENT
15.9 PHYSICAL ELECTRONICS, INC. (AS A PART OF ULVAC-PHI)
15.9.1 COMPANY SNAPSHOT
15.9.2 PRODUCT PORTFOLIO
15.9.3 RECENT DEVELOPMENT
15.1 S A I LTD
15.10.1 COMPANY SNAPSHOT
15.10.2 PRODUCT PORTFOLIO
15.10.3 RECENT DEVELOPMENT
15.11 SERMA GROUP
15.11.1 COMPANY SNAPSHOT
15.11.2 PRODUCT PORTFOLIO
15.11.3 RECENT DEVELOPMENT / NEWS
15.12 SHIMADZU CORPORATION
15.12.1 COMPANY SNAPSHOT
15.12.2 REVENUE ANALYSIS
15.12.3 PRODUCT PORTFOLIO
15.12.4 RECENT DEVELOPMENT
15.13 SPECS GMBH
15.13.1 COMPANY SNAPSHOT
15.13.2 PRODUCT PORTFOLIO
15.13.3 RECENT DEVELOPMENT
15.14 STAIB INSTRUMENTS
15.14.1 COMPANY SNAPSHOT
15.14.2 PRODUCT PORTFOLIO
15.14.3 RECENT DEVELOPMENT
15.15 TESCAN
15.15.1 COMPANY SNAPSHOT
15.15.2 PRODUCT PORTFOLIO
15.15.3 RECENT DEVELOPMENT/NEWS
15.16 TSI
15.16.1 COMPANY SNAPSHOT
15.16.2 PRODUCT PORTFOLIO
15.16.3 RECENT DEVELOPMENT/NEWS
16 QUESTIONNAIRE
17 RELATED REPORTS
표 목록
TABLE 1 MARKET PENETRATION ANALYSIS
TABLE 2 PRICING
TABLE 3 COMPANY COMPARATIVE ANALYSIS
TABLE 4 SEVERAL SOURCES OF SUBSTRATE SURFACE CONTAMINATION
TABLE 5 GLOBAL SURFACE ANALYSIS MARKET, BY TECHNOLOGY, 2018-2032 (USD THOUSAND)
TABLE 6 GLOBAL MICROSCOPY IN SURFACE ANALYSIS MARKET, BY REGION, 2018-2032 (USD THOUSAND)
TABLE 7 GLOBAL MICROSCOPY IN SURFACE ANALYSIS MARKET, BY METHOD, 2018-2032 (USD THOUSAND)
TABLE 8 GLOBAL MICROSCOPY IN SURFACE ANALYSIS MARKET, BY TECHNIQUE, 2018-2032 (USD THOUSAND)
TABLE 9 GLOBAL SPECTROSCOPY IN SURFACE ANALYSIS MARKET, BY REGION, 2018-2032 (USD THOUSAND)
TABLE 10 GLOBAL X-RAY DIFFRACTION (XRD) IN SURFACE ANALYSIS MARKET, BY RGION, 2018-2032 (USD THOUSAND)
TABLE 11 GLOBAL SURFACE ANALYZERS IN SURFACE ANALYSIS MARKET, BY REGION, 2018-2032 (USD THOUSAND)
TABLE 12 GLOBAL SURFACE ANALYSIS MARKET, BY TYPE, 2018-2032 (USD THOUSAND)
TABLE 13 GLOBAL XPS (X-RAY PHOTOELECTRON SPECTROSCOPY) IN SURFACE ANALYSIS MARKET, BY REGION, 2018-2032 (USD THOUSAND)
TABLE 14 GLOBAL TOF-SIMS (TIME-OF-FLIGHT SECONDARY ION MASS SPECTROMETRY) IN SURFACE ANALYSIS MARKET, BY REGION, 2018-2032 (USD THOUSAND)
TABLE 15 GLOBAL AES (AUGER ELECTRON SPECTROSCOPY) IN SURFACE ANALYSIS MARKET, BY REGION, 2018-2032 (USD THOUSAND)
TABLE 16 GLOBAL RAMAN (RAMAN SPECTROSCOPY) IN SURFACE ANALYSIS MARKET, BY REGION, 2018-2032 (USD THOUSAND)
TABLE 17 GLOBAL UPS (UV PHOTOELECTRON SPECTROSCOPY) IN SURFACE ANALYSIS MARKET, BY REGION, 2018-2032 (USD THOUSAND)
TABLE 18 GLOBAL ISS (ION SCATTERING SPECTROSCOPY) IN SURFACE ANALYSIS MARKET, BY REGION, 2018-2032 (USD THOUSAND)
TABLE 19 GLOBAL OTHERS IN SURFACE ANALYSIS MARKET, BY REGION, 2018-2032 (USD THOUSAND)
TABLE 20 GLOBAL SURFACE ANALYSIS MARKET, BY METHOD TYPE, 2018-2032 (USD THOUSAND)
TABLE 21 GLOBAL SPECTROSCOPIC METHOD IN SURFACE ANALYSIS MARKET, BY REGION, 2018-2032 (USD THOUSAND)
TABLE 22 GLOBAL MICROSCOPIC METHOD IN SURFACE ANALYSIS MARKET, BY REGION, 2018-2032 (USD THOUSAND)
TABLE 23 GLOBAL CLASSICAL METHOD IN SURFACE ANALYSIS MARKET, BY REGION, 2018-2032 (USD THOUSAND)
TABLE 24 GLOBAL SURFACE ANALYSIS MARKET, BY EQUIPMENT TYPE, 2018-2032 (USD THOUSAND)
TABLE 25 GLOBAL SCANNING PROBE MICROSCOPES (SPM)/ATOMIC FORCE MICROSCOPES (AFM) IN SURFACE ANALYSIS MARKET, BY REGION, 2018-2032 (USD THOUSAND)
TABLE 26 GLOBAL SCANNING PROBE MICROSCOPES (SPM)/ATOMIC FORCE MICROSCOPES (AFM) IN SURFACE ANALYSIS MARKET, BY OPERATION, 2018-2032 (USD THOUSAND)
TABLE 27 GLOBAL SCANNING PROBE MICROSCOPES (SPM)/ATOMIC FORCE MICROSCOPES (AFM) IN SURFACE ANALYSIS MARKET, BY NOISE LEVEL, 2018-2032 (USD THOUSAND)
TABLE 28 GLOBAL ELECTRON PROBE MICRO-ANALYZERS (EPMA) IN SURFACE ANALYSIS MARKET, BY REGION, 2018-2032 (USD THOUSAND)
TABLE 29 GLOBAL X-RAY PHOTOELECTRON SPECTROMETERS (XPS)/ELECTRON SPECTROSCOPY FOR CHEMICAL ANALYSIS (ESCA) IN SURFACE ANALYSIS MARKET, BY REGION, 2018-2032 (USD THOUSAND)
TABLE 30 GLOBAL OTHERS IN SURFACE ANALYSIS MARKET, BY REGION, 2018-2032 (USD THOUSAND)
TABLE 31 GLOBAL SURFACE ANALYSIS MARKET, BY APPLICATION, 2018-2032 (USD THOUSAND)
TABLE 32 GLOBAL MATERIAL COMPOSITION IN SURFACE ANALYSIS MARKET, BY REGION, 2018-2032 (USD THOUSAND)
TABLE 33 GLOBAL SURFACE ROUGHNESS AND TOPOGRAPHY IN SURFACE ANALYSIS MARKET, BY REGION, 2018-2032 (USD THOUSAND)
TABLE 34 GLOBAL THIN FILM ANALYSIS IN SURFACE ANALYSIS MARKET, BY REGION, 2018-2032 (USD THOUSAND)
TABLE 35 GLOBAL SURFACE CONTAMINATION IN SURFACE ANALYSIS MARKET, BY REGION, 2018-2032 (USD THOUSAND)
TABLE 36 GLOBAL FAILURE ANALYSIS IN SURFACE ANALYSIS MARKET, BY REGION, 2018-2032 (USD THOUSAND)
TABLE 37 GLOBAL CORROSION ANALYSIS IN SURFACE ANALYSIS MARKET, BY REGION, 2018-2032 (USD THOUSAND)
TABLE 38 GLOBAL SURFACE MODIFICATION IN SURFACE ANALYSIS MARKET, BY REGION, 2018-2032 (USD THOUSAND)
TABLE 39 GLOBAL SURFACE ANALYSIS MARKET, BY END USER, 2018-2032 (USD THOUSAND)
TABLE 40 GLOBAL INDUSTRIES IN SURFACE ANALYSIS MARKET, BY REGION, 2018-2032 (USD THOUSAND)
TABLE 41 GLOBAL INDUSTRIES IN SURFACE ANALYSIS MARKET, BY TYPE, 2018-2032 (USD THOUSAND)
TABLE 42 GLOBAL INDUSTRIES IN SURFACE ANALYSIS MARKET, BY TECHNOLOGY, 2018-2032 (USD THOUSAND)
TABLE 43 GLOBAL RESEARCH ORGANIZATION IN SURFACE ANALYSIS MARKET, BY REGION, 2018-2032 (USD THOUSAND)
TABLE 44 GLOBAL RESEARCH ORGANIZATION IN SURFACE ANALYSIS MARKET, BY TECHNOLOGY, 2018-2032 (USD THOUSAND)
TABLE 45 GLOBAL ACADEMIC INSTITUTES IN SURFACE ANALYSIS MARKET, BY REGION, 2018-2032 (USD THOUSAND)
TABLE 46 GLOBAL ACADEMIC INSTITUTES IN SURFACE ANALYSIS MARKET, BY TECHNOLOGY, 2018-2032 (USD THOUSAND)
TABLE 47 GLOBAL SURFACE ANALYSIS MARKET, BY REGION 2018-2032, USD (THOUSAND)
TABLE 48 NORTH AMERICA SURFACE ANALYSIS MARKET, BY COUNTRY, 2018-2032 (USD THOUSAND)
TABLE 49 NORTH AMERICA SURFACE ANALYSIS MARKET, BY TECHNOLOGY, 2018-2032 (USD THOUSAND)
TABLE 50 NORTH AMERICA MICROSCOPY IN SURFACE ANALYSIS MARKET, BY METHOD, 2018-2032 (USD THOUSAND)
TABLE 51 NORTH AMERICA MICROSCOPY IN SURFACE ANALYSIS MARKET, BY TECHNIQUE, 2018-2032 (USD THOUSAND)
TABLE 52 NORTH AMERICA SURFACE ANALYSIS MARKET, BY TYPE, 2018-2032 (USD THOUSAND)
TABLE 53 NORTH AMERICA SURFACE ANALYSIS MARKET, BY METHOD TYPE, 2018-2032 (USD THOUSAND)
TABLE 54 NORTH AMERICA SURFACE ANALYSIS MARKET, BY EQUIPMENT TYPE, 2018-2032 (USD THOUSAND)
TABLE 55 NORTH AMERICA SCANNING PROBE MICROSCOPES (SPM)/ATOMIC FORCE MICROSCOPES (AFM) IN SURFACE ANALYSIS MARKET, BY OPERATION, 2018-2032 (USD THOUSAND)
TABLE 56 NORTH AMERICA SCANNING PROBE MICROSCOPES (SPM)/ATOMIC FORCE MICROSCOPES (AFM) IN SURFACE ANALYSIS MARKET, BY NOISE LEVEL, 2018-2032 (USD THOUSAND)
TABLE 57 NORTH AMERICA SURFACE ANALYSIS MARKET, BY APPLICATION, 2018-2032 (USD THOUSAND)
TABLE 58 NORTH AMERICA SURFACE ANALYSIS MARKET, BY END USER, 2018-2032 (USD THOUSAND)
TABLE 59 NORTH AMERICA INDUSTRIES IN SURFACE ANALYSIS MARKET, BY TYPE, 2018-2032 (USD THOUSAND)
TABLE 60 NORTH AMERICA INDUSTRIES IN SURFACE ANALYSIS MARKET, BY TECHNOLOGY, 2018-2032 (USD THOUSAND)
TABLE 61 NORTH AMERICA RESEARCH ORGANIZATION IN SURFACE ANALYSIS MARKET, BY TECHNOLOGY, 2018-2032 (USD THOUSAND)
TABLE 62 NORTH AMERICA ACADEMIC INSTITUTES IN SURFACE ANALYSIS MARKET, BY TECHNOLOGY, 2018-2032 (USD THOUSAND)
TABLE 63 U.S. SURFACE ANALYSIS MARKET, BY TECHNOLOGY, 2018-2032 (USD THOUSAND)
TABLE 64 U.S. MICROSCOPY IN SURFACE ANALYSIS MARKET, BY METHOD, 2018-2032 (USD THOUSAND)
TABLE 65 U.S. MICROSCOPY IN SURFACE ANALYSIS MARKET, BY TECHNIQUE, 2018-2032 (USD THOUSAND)
TABLE 66 U.S. SURFACE ANALYSIS MARKET, BY TYPE, 2018-2032 (USD THOUSAND)
TABLE 67 U.S. SURFACE ANALYSIS MARKET, BY METHOD TYPE, 2018-2032 (USD THOUSAND)
TABLE 68 U.S. SURFACE ANALYSIS MARKET, BY EQUIPMENT TYPE, 2018-2032 (USD THOUSAND)
TABLE 69 U.S. SCANNING PROBE MICROSCOPES (SPM)/ATOMIC FORCE MICROSCOPES (AFM) IN SURFACE ANALYSIS MARKET, BY OPERATION, 2018-2032 (USD THOUSAND)
TABLE 70 U.S. SCANNING PROBE MICROSCOPES (SPM)/ATOMIC FORCE MICROSCOPES (AFM) IN SURFACE ANALYSIS MARKET, BY NOISE LEVEL, 2018-2032 (USD THOUSAND)
TABLE 71 U.S. SURFACE ANALYSIS MARKET, BY APPLICATION, 2018-2032 (USD THOUSAND)
TABLE 72 U.S. SURFACE ANALYSIS MARKET, BY END USER, 2018-2032 (USD THOUSAND)
TABLE 73 U.S. INDUSTRIES IN SURFACE ANALYSIS MARKET, BY TYPE, 2018-2032 (USD THOUSAND)
TABLE 74 U.S. INDUSTRIES IN SURFACE ANALYSIS MARKET, BY TECHNOLOGY, 2018-2032 (USD THOUSAND)
TABLE 75 U.S. RESEARCH ORGANIZATION IN SURFACE ANALYSIS MARKET, BY TECHNOLOGY, 2018-2032 (USD THOUSAND)
TABLE 76 U.S. ACADEMIC INSTITUTES IN SURFACE ANALYSIS MARKET, BY TECHNOLOGY, 2018-2032 (USD THOUSAND)
TABLE 77 CANADA SURFACE ANALYSIS MARKET, BY TECHNOLOGY, 2018-2032 (USD THOUSAND)
TABLE 78 CANADA MICROSCOPY IN SURFACE ANALYSIS MARKET, BY METHOD, 2018-2032 (USD THOUSAND)
TABLE 79 CANADA MICROSCOPY IN SURFACE ANALYSIS MARKET, BY TECHNIQUE, 2018-2032 (USD THOUSAND)
TABLE 80 CANADA SURFACE ANALYSIS MARKET, BY TYPE, 2018-2032 (USD THOUSAND)
TABLE 81 CANADA SURFACE ANALYSIS MARKET, BY METHOD TYPE, 2018-2032 (USD THOUSAND)
TABLE 82 CANADA SURFACE ANALYSIS MARKET, BY EQUIPMENT TYPE, 2018-2032 (USD THOUSAND)
TABLE 83 CANADA SCANNING PROBE MICROSCOPES (SPM)/ATOMIC FORCE MICROSCOPES (AFM) IN SURFACE ANALYSIS MARKET, BY OPERATION, 2018-2032 (USD THOUSAND)
TABLE 84 CANADA SCANNING PROBE MICROSCOPES (SPM)/ATOMIC FORCE MICROSCOPES (AFM) IN SURFACE ANALYSIS MARKET, BY NOISE LEVEL, 2018-2032 (USD THOUSAND)
TABLE 85 CANADA SURFACE ANALYSIS MARKET, BY APPLICATION, 2018-2032 (USD THOUSAND)
TABLE 86 CANADA SURFACE ANALYSIS MARKET, BY END USER, 2018-2032 (USD THOUSAND)
TABLE 87 CANADA INDUSTRIES IN SURFACE ANALYSIS MARKET, BY TYPE, 2018-2032 (USD THOUSAND)
TABLE 88 CANADA INDUSTRIES IN SURFACE ANALYSIS MARKET, BY TECHNOLOGY, 2018-2032 (USD THOUSAND)
TABLE 89 CANADA RESEARCH ORGANIZATION IN SURFACE ANALYSIS MARKET, BY TECHNOLOGY, 2018-2032 (USD THOUSAND)
TABLE 90 CANADA ACADEMIC INSTITUTES IN SURFACE ANALYSIS MARKET, BY TECHNOLOGY, 2018-2032 (USD THOUSAND)
TABLE 91 MEXICO SURFACE ANALYSIS MARKET, BY TECHNOLOGY, 2018-2032 (USD THOUSAND)
TABLE 92 MEXICO MICROSCOPY IN SURFACE ANALYSIS MARKET, BY METHOD, 2018-2032 (USD THOUSAND)
TABLE 93 MEXICO MICROSCOPY IN SURFACE ANALYSIS MARKET, BY TECHNIQUE, 2018-2032 (USD THOUSAND)
TABLE 94 MEXICO SURFACE ANALYSIS MARKET, BY TYPE, 2018-2032 (USD THOUSAND)
TABLE 95 MEXICO SURFACE ANALYSIS MARKET, BY METHOD TYPE, 2018-2032 (USD THOUSAND)
TABLE 96 MEXICO SURFACE ANALYSIS MARKET, BY EQUIPMENT TYPE, 2018-2032 (USD THOUSAND)
TABLE 97 MEXICO SCANNING PROBE MICROSCOPES (SPM)/ATOMIC FORCE MICROSCOPES (AFM) IN SURFACE ANALYSIS MARKET, BY OPERATION, 2018-2032 (USD THOUSAND)
TABLE 98 MEXICO SCANNING PROBE MICROSCOPES (SPM)/ATOMIC FORCE MICROSCOPES (AFM) IN SURFACE ANALYSIS MARKET, BY NOISE LEVEL, 2018-2032 (USD THOUSAND)
TABLE 99 MEXICO SURFACE ANALYSIS MARKET, BY APPLICATION, 2018-2032 (USD THOUSAND)
TABLE 100 MEXICO SURFACE ANALYSIS MARKET, BY END USER, 2018-2032 (USD THOUSAND)
TABLE 101 MEXICO INDUSTRIES IN SURFACE ANALYSIS MARKET, BY TYPE, 2018-2032 (USD THOUSAND)
TABLE 102 MEXICO INDUSTRIES IN SURFACE ANALYSIS MARKET, BY TECHNOLOGY, 2018-2032 (USD THOUSAND)
TABLE 103 MEXICO RESEARCH ORGANIZATION IN SURFACE ANALYSIS MARKET, BY TECHNOLOGY, 2018-2032 (USD THOUSAND)
TABLE 104 MEXICO ACADEMIC INSTITUTES IN SURFACE ANALYSIS MARKET, BY TECHNOLOGY, 2018-2032 (USD THOUSAND)
TABLE 105 EUROPE SURFACE ANALYSIS MARKET, BY COUNTRY, 2018-2032 (USD THOUSAND)
TABLE 106 EUROPE SURFACE ANALYSIS MARKET, BY TECHNOLOGY, 2018-2032 (USD THOUSAND)
TABLE 107 EUROPE MICROSCOPY IN SURFACE ANALYSIS MARKET, BY METHOD, 2018-2032 (USD THOUSAND)
TABLE 108 EUROPE MICROSCOPY IN SURFACE ANALYSIS MARKET, BY TECHNIQUE, 2018-2032 (USD THOUSAND)
TABLE 109 EUROPE SURFACE ANALYSIS MARKET, BY TYPE, 2018-2032 (USD THOUSAND)
TABLE 110 EUROPE SURFACE ANALYSIS MARKET, BY METHOD TYPE, 2018-2032 (USD THOUSAND)
TABLE 111 EUROPE SURFACE ANALYSIS MARKET, BY EQUIPMENT TYPE, 2018-2032 (USD THOUSAND)
TABLE 112 EUROPE SCANNING PROBE MICROSCOPES (SPM)/ATOMIC FORCE MICROSCOPES (AFM) IN SURFACE ANALYSIS MARKET, BY OPERATION, 2018-2032 (USD THOUSAND)
TABLE 113 EUROPE SCANNING PROBE MICROSCOPES (SPM)/ATOMIC FORCE MICROSCOPES (AFM) IN SURFACE ANALYSIS MARKET, BY NOISE LEVEL, 2018-2032 (USD THOUSAND)
TABLE 114 EUROPE SURFACE ANALYSIS MARKET, BY APPLICATION, 2018-2032 (USD THOUSAND)
TABLE 115 EUROPE SURFACE ANALYSIS MARKET, BY END USER, 2018-2032 (USD THOUSAND)
TABLE 116 EUROPE INDUSTRIES IN SURFACE ANALYSIS MARKET, BY TYPE, 2018-2032 (USD THOUSAND)
TABLE 117 EUROPE INDUSTRIES IN SURFACE ANALYSIS MARKET, BY TECHNOLOGY, 2018-2032 (USD THOUSAND)
TABLE 118 EUROPE RESEARCH ORGANIZATION IN SURFACE ANALYSIS MARKET, BY TECHNOLOGY, 2018-2032 (USD THOUSAND)
TABLE 119 EUROPE ACADEMIC INSTITUTES IN SURFACE ANALYSIS MARKET, BY TECHNOLOGY, 2018-2032 (USD THOUSAND)
TABLE 120 GERMANY SURFACE ANALYSIS MARKET, BY TECHNOLOGY, 2018-2032 (USD THOUSAND)
TABLE 121 GERMANY MICROSCOPY IN SURFACE ANALYSIS MARKET, BY METHOD, 2018-2032 (USD THOUSAND)
TABLE 122 GERMANY MICROSCOPY IN SURFACE ANALYSIS MARKET, BY TECHNIQUE, 2018-2032 (USD THOUSAND)
TABLE 123 GERMANY SURFACE ANALYSIS MARKET, BY TYPE, 2018-2032 (USD THOUSAND)
TABLE 124 GERMANY SURFACE ANALYSIS MARKET, BY METHOD TYPE, 2018-2032 (USD THOUSAND)
TABLE 125 GERMANY SURFACE ANALYSIS MARKET, BY EQUIPMENT TYPE, 2018-2032 (USD THOUSAND)
TABLE 126 GERMANY SCANNING PROBE MICROSCOPES (SPM)/ATOMIC FORCE MICROSCOPES (AFM) IN SURFACE ANALYSIS MARKET, BY OPERATION, 2018-2032 (USD THOUSAND)
TABLE 127 GERMANY SCANNING PROBE MICROSCOPES (SPM)/ATOMIC FORCE MICROSCOPES (AFM) IN SURFACE ANALYSIS MARKET, BY NOISE LEVEL, 2018-2032 (USD THOUSAND)
TABLE 128 GERMANY SURFACE ANALYSIS MARKET, BY APPLICATION, 2018-2032 (USD THOUSAND)
TABLE 129 GERMANY SURFACE ANALYSIS MARKET, BY END USER, 2018-2032 (USD THOUSAND)
TABLE 130 GERMANY INDUSTRIES IN SURFACE ANALYSIS MARKET, BY TYPE, 2018-2032 (USD THOUSAND)
TABLE 131 GERMANY INDUSTRIES IN SURFACE ANALYSIS MARKET, BY TECHNOLOGY, 2018-2032 (USD THOUSAND)
TABLE 132 GERMANY RESEARCH ORGANIZATION IN SURFACE ANALYSIS MARKET, BY TECHNOLOGY, 2018-2032 (USD THOUSAND)
TABLE 133 GERMANY ACADEMIC INSTITUTES IN SURFACE ANALYSIS MARKET, BY TECHNOLOGY, 2018-2032 (USD THOUSAND)
TABLE 134 FRANCE SURFACE ANALYSIS MARKET, BY TECHNOLOGY, 2018-2032 (USD THOUSAND)
TABLE 135 FRANCE MICROSCOPY IN SURFACE ANALYSIS MARKET, BY METHOD, 2018-2032 (USD THOUSAND)
TABLE 136 FRANCE MICROSCOPY IN SURFACE ANALYSIS MARKET, BY TECHNIQUE, 2018-2032 (USD THOUSAND)
TABLE 137 FRANCE SURFACE ANALYSIS MARKET, BY TYPE, 2018-2032 (USD THOUSAND)
TABLE 138 FRANCE SURFACE ANALYSIS MARKET, BY METHOD TYPE, 2018-2032 (USD THOUSAND)
TABLE 139 FRANCE SURFACE ANALYSIS MARKET, BY EQUIPMENT TYPE, 2018-2032 (USD THOUSAND)
TABLE 140 FRANCE SCANNING PROBE MICROSCOPES (SPM)/ATOMIC FORCE MICROSCOPES (AFM) IN SURFACE ANALYSIS MARKET, BY OPERATION, 2018-2032 (USD THOUSAND)
TABLE 141 FRANCE SCANNING PROBE MICROSCOPES (SPM)/ATOMIC FORCE MICROSCOPES (AFM) IN SURFACE ANALYSIS MARKET, BY NOISE LEVEL, 2018-2032 (USD THOUSAND)
TABLE 142 FRANCE SURFACE ANALYSIS MARKET, BY APPLICATION, 2018-2032 (USD THOUSAND)
TABLE 143 FRANCE SURFACE ANALYSIS MARKET, BY END USER, 2018-2032 (USD THOUSAND)
TABLE 144 FRANCE INDUSTRIES IN SURFACE ANALYSIS MARKET, BY TYPE, 2018-2032 (USD THOUSAND)
TABLE 145 FRANCE INDUSTRIES IN SURFACE ANALYSIS MARKET, BY TECHNOLOGY, 2018-2032 (USD THOUSAND)
TABLE 146 FRANCE RESEARCH ORGANIZATION IN SURFACE ANALYSIS MARKET, BY TECHNOLOGY, 2018-2032 (USD THOUSAND)
TABLE 147 FRANCE ACADEMIC INSTITUTES IN SURFACE ANALYSIS MARKET, BY TECHNOLOGY, 2018-2032 (USD THOUSAND)
TABLE 148 U.K. SURFACE ANALYSIS MARKET, BY TECHNOLOGY, 2018-2032 (USD THOUSAND)
TABLE 149 U.K. MICROSCOPY IN SURFACE ANALYSIS MARKET, BY METHOD, 2018-2032 (USD THOUSAND)
TABLE 150 U.K. MICROSCOPY IN SURFACE ANALYSIS MARKET, BY TECHNIQUE, 2018-2032 (USD THOUSAND)
TABLE 151 U.K. SURFACE ANALYSIS MARKET, BY TYPE, 2018-2032 (USD THOUSAND)
TABLE 152 U.K. SURFACE ANALYSIS MARKET, BY METHOD TYPE, 2018-2032 (USD THOUSAND)
TABLE 153 U.K. SURFACE ANALYSIS MARKET, BY EQUIPMENT TYPE, 2018-2032 (USD THOUSAND)
TABLE 154 U.K. SCANNING PROBE MICROSCOPES (SPM)/ATOMIC FORCE MICROSCOPES (AFM) IN SURFACE ANALYSIS MARKET, BY OPERATION, 2018-2032 (USD THOUSAND)
TABLE 155 U.K. SCANNING PROBE MICROSCOPES (SPM)/ATOMIC FORCE MICROSCOPES (AFM) IN SURFACE ANALYSIS MARKET, BY NOISE LEVEL, 2018-2032 (USD THOUSAND)
TABLE 156 U.K. SURFACE ANALYSIS MARKET, BY APPLICATION, 2018-2032 (USD THOUSAND)
TABLE 157 U.K. SURFACE ANALYSIS MARKET, BY END USER, 2018-2032 (USD THOUSAND)
TABLE 158 U.K. INDUSTRIES IN SURFACE ANALYSIS MARKET, BY TYPE, 2018-2032 (USD THOUSAND)
TABLE 159 U.K. INDUSTRIES IN SURFACE ANALYSIS MARKET, BY TECHNOLOGY, 2018-2032 (USD THOUSAND)
TABLE 160 U.K. RESEARCH ORGANIZATION IN SURFACE ANALYSIS MARKET, BY TECHNOLOGY, 2018-2032 (USD THOUSAND)
TABLE 161 U.K. ACADEMIC INSTITUTES IN SURFACE ANALYSIS MARKET, BY TECHNOLOGY, 2018-2032 (USD THOUSAND)
TABLE 162 ITALY SURFACE ANALYSIS MARKET, BY TECHNOLOGY, 2018-2032 (USD THOUSAND)
TABLE 163 ITALY MICROSCOPY IN SURFACE ANALYSIS MARKET, BY METHOD, 2018-2032 (USD THOUSAND)
TABLE 164 ITALY MICROSCOPY IN SURFACE ANALYSIS MARKET, BY TECHNIQUE, 2018-2032 (USD THOUSAND)
TABLE 165 ITALY SURFACE ANALYSIS MARKET, BY TYPE, 2018-2032 (USD THOUSAND)
TABLE 166 ITALY SURFACE ANALYSIS MARKET, BY METHOD TYPE, 2018-2032 (USD THOUSAND)
TABLE 167 ITALY SURFACE ANALYSIS MARKET, BY EQUIPMENT TYPE, 2018-2032 (USD THOUSAND)
TABLE 168 ITALY SCANNING PROBE MICROSCOPES (SPM)/ATOMIC FORCE MICROSCOPES (AFM) IN SURFACE ANALYSIS MARKET, BY OPERATION, 2018-2032 (USD THOUSAND)
TABLE 169 ITALY SCANNING PROBE MICROSCOPES (SPM)/ATOMIC FORCE MICROSCOPES (AFM) IN SURFACE ANALYSIS MARKET, BY NOISE LEVEL, 2018-2032 (USD THOUSAND)
TABLE 170 ITALY SURFACE ANALYSIS MARKET, BY APPLICATION, 2018-2032 (USD THOUSAND)
TABLE 171 ITALY SURFACE ANALYSIS MARKET, BY END USER, 2018-2032 (USD THOUSAND)
TABLE 172 ITALY INDUSTRIES IN SURFACE ANALYSIS MARKET, BY TYPE, 2018-2032 (USD THOUSAND)
TABLE 173 ITALY INDUSTRIES IN SURFACE ANALYSIS MARKET, BY TECHNOLOGY, 2018-2032 (USD THOUSAND)
TABLE 174 ITALY RESEARCH ORGANIZATION IN SURFACE ANALYSIS MARKET, BY TECHNOLOGY, 2018-2032 (USD THOUSAND)
TABLE 175 ITALY ACADEMIC INSTITUTES IN SURFACE ANALYSIS MARKET, BY TECHNOLOGY, 2018-2032 (USD THOUSAND)
TABLE 176 SPAIN SURFACE ANALYSIS MARKET, BY TECHNOLOGY, 2018-2032 (USD THOUSAND)
TABLE 177 SPAIN MICROSCOPY IN SURFACE ANALYSIS MARKET, BY METHOD, 2018-2032 (USD THOUSAND)
TABLE 178 SPAIN MICROSCOPY IN SURFACE ANALYSIS MARKET, BY TECHNIQUE, 2018-2032 (USD THOUSAND)
TABLE 179 SPAIN SURFACE ANALYSIS MARKET, BY TYPE, 2018-2032 (USD THOUSAND)
TABLE 180 SPAIN SURFACE ANALYSIS MARKET, BY METHOD TYPE, 2018-2032 (USD THOUSAND)
TABLE 181 SPAIN SURFACE ANALYSIS MARKET, BY EQUIPMENT TYPE, 2018-2032 (USD THOUSAND)
TABLE 182 SPAIN SCANNING PROBE MICROSCOPES (SPM)/ATOMIC FORCE MICROSCOPES (AFM) IN SURFACE ANALYSIS MARKET, BY OPERATION, 2018-2032 (USD THOUSAND)
TABLE 183 SPAIN SCANNING PROBE MICROSCOPES (SPM)/ATOMIC FORCE MICROSCOPES (AFM) IN SURFACE ANALYSIS MARKET, BY NOISE LEVEL, 2018-2032 (USD THOUSAND)
TABLE 184 SPAIN SURFACE ANALYSIS MARKET, BY APPLICATION, 2018-2032 (USD THOUSAND)
TABLE 185 SPAIN SURFACE ANALYSIS MARKET, BY END USER, 2018-2032 (USD THOUSAND)
TABLE 186 SPAIN INDUSTRIES IN SURFACE ANALYSIS MARKET, BY TYPE, 2018-2032 (USD THOUSAND)
TABLE 187 SPAIN INDUSTRIES IN SURFACE ANALYSIS MARKET, BY TECHNOLOGY, 2018-2032 (USD THOUSAND)
TABLE 188 SPAIN RESEARCH ORGANIZATION IN SURFACE ANALYSIS MARKET, BY TECHNOLOGY, 2018-2032 (USD THOUSAND)
TABLE 189 SPAIN ACADEMIC INSTITUTES IN SURFACE ANALYSIS MARKET, BY TECHNOLOGY, 2018-2032 (USD THOUSAND)
TABLE 190 NETHERLANDS SURFACE ANALYSIS MARKET, BY TECHNOLOGY, 2018-2032 (USD THOUSAND)
TABLE 191 NETHERLANDS MICROSCOPY IN SURFACE ANALYSIS MARKET, BY METHOD, 2018-2032 (USD THOUSAND)
TABLE 192 NETHERLANDS MICROSCOPY IN SURFACE ANALYSIS MARKET, BY TECHNIQUE, 2018-2032 (USD THOUSAND)
TABLE 193 NETHERLANDS SURFACE ANALYSIS MARKET, BY TYPE, 2018-2032 (USD THOUSAND)
TABLE 194 NETHERLANDS SURFACE ANALYSIS MARKET, BY METHOD TYPE, 2018-2032 (USD THOUSAND)
TABLE 195 NETHERLANDS SURFACE ANALYSIS MARKET, BY EQUIPMENT TYPE, 2018-2032 (USD THOUSAND)
TABLE 196 NETHERLANDS SCANNING PROBE MICROSCOPES (SPM)/ATOMIC FORCE MICROSCOPES (AFM) IN SURFACE ANALYSIS MARKET, BY OPERATION, 2018-2032 (USD THOUSAND)
TABLE 197 NETHERLANDS SCANNING PROBE MICROSCOPES (SPM)/ATOMIC FORCE MICROSCOPES (AFM) IN SURFACE ANALYSIS MARKET, BY NOISE LEVEL, 2018-2032 (USD THOUSAND)
TABLE 198 NETHERLANDS SURFACE ANALYSIS MARKET, BY APPLICATION, 2018-2032 (USD THOUSAND)
TABLE 199 NETHERLANDS SURFACE ANALYSIS MARKET, BY END USER, 2018-2032 (USD THOUSAND)
TABLE 200 NETHERLANDS INDUSTRIES IN SURFACE ANALYSIS MARKET, BY TYPE, 2018-2032 (USD THOUSAND)
TABLE 201 NETHERLANDS INDUSTRIES IN SURFACE ANALYSIS MARKET, BY TECHNOLOGY, 2018-2032 (USD THOUSAND)
TABLE 202 NETHERLANDS RESEARCH ORGANIZATION IN SURFACE ANALYSIS MARKET, BY TECHNOLOGY, 2018-2032 (USD THOUSAND)
TABLE 203 NETHERLANDS ACADEMIC INSTITUTES IN SURFACE ANALYSIS MARKET, BY TECHNOLOGY, 2018-2032 (USD THOUSAND)
TABLE 204 SWITZERLAND SURFACE ANALYSIS MARKET, BY TECHNOLOGY, 2018-2032 (USD THOUSAND)
TABLE 205 SWITZERLAND MICROSCOPY IN SURFACE ANALYSIS MARKET, BY METHOD, 2018-2032 (USD THOUSAND)
TABLE 206 SWITZERLAND MICROSCOPY IN SURFACE ANALYSIS MARKET, BY TECHNIQUE, 2018-2032 (USD THOUSAND)
TABLE 207 SWITZERLAND SURFACE ANALYSIS MARKET, BY TYPE, 2018-2032 (USD THOUSAND)
TABLE 208 SWITZERLAND SURFACE ANALYSIS MARKET, BY METHOD TYPE, 2018-2032 (USD THOUSAND)
TABLE 209 SWITZERLAND SURFACE ANALYSIS MARKET, BY EQUIPMENT TYPE, 2018-2032 (USD THOUSAND)
TABLE 210 SWITZERLAND SCANNING PROBE MICROSCOPES (SPM)/ATOMIC FORCE MICROSCOPES (AFM) IN SURFACE ANALYSIS MARKET, BY OPERATION, 2018-2032 (USD THOUSAND)
TABLE 211 SWITZERLAND SCANNING PROBE MICROSCOPES (SPM)/ATOMIC FORCE MICROSCOPES (AFM) IN SURFACE ANALYSIS MARKET, BY NOISE LEVEL, 2018-2032 (USD THOUSAND)
TABLE 212 SWITZERLAND SURFACE ANALYSIS MARKET, BY APPLICATION, 2018-2032 (USD THOUSAND)
TABLE 213 SWITZERLAND SURFACE ANALYSIS MARKET, BY END USER, 2018-2032 (USD THOUSAND)
TABLE 214 SWITZERLAND INDUSTRIES IN SURFACE ANALYSIS MARKET, BY TYPE, 2018-2032 (USD THOUSAND)
TABLE 215 SWITZERLAND INDUSTRIES IN SURFACE ANALYSIS MARKET, BY TECHNOLOGY, 2018-2032 (USD THOUSAND)
TABLE 216 SWITZERLAND RESEARCH ORGANIZATION IN SURFACE ANALYSIS MARKET, BY TECHNOLOGY, 2018-2032 (USD THOUSAND)
TABLE 217 SWITZERLAND ACADEMIC INSTITUTES IN SURFACE ANALYSIS MARKET, BY TECHNOLOGY, 2018-2032 (USD THOUSAND)
TABLE 218 RUSSIA SURFACE ANALYSIS MARKET, BY TECHNOLOGY, 2018-2032 (USD THOUSAND)
TABLE 219 RUSSIA MICROSCOPY IN SURFACE ANALYSIS MARKET, BY METHOD, 2018-2032 (USD THOUSAND)
TABLE 220 RUSSIA MICROSCOPY IN SURFACE ANALYSIS MARKET, BY TECHNIQUE, 2018-2032 (USD THOUSAND)
TABLE 221 RUSSIA SURFACE ANALYSIS MARKET, BY TYPE, 2018-2032 (USD THOUSAND)
TABLE 222 RUSSIA SURFACE ANALYSIS MARKET, BY METHOD TYPE, 2018-2032 (USD THOUSAND)
TABLE 223 RUSSIA SURFACE ANALYSIS MARKET, BY EQUIPMENT TYPE, 2018-2032 (USD THOUSAND)
TABLE 224 RUSSIA SCANNING PROBE MICROSCOPES (SPM)/ATOMIC FORCE MICROSCOPES (AFM) IN SURFACE ANALYSIS MARKET, BY OPERATION, 2018-2032 (USD THOUSAND)
TABLE 225 RUSSIA SCANNING PROBE MICROSCOPES (SPM)/ATOMIC FORCE MICROSCOPES (AFM) IN SURFACE ANALYSIS MARKET, BY NOISE LEVEL, 2018-2032 (USD THOUSAND)
TABLE 226 RUSSIA SURFACE ANALYSIS MARKET, BY APPLICATION, 2018-2032 (USD THOUSAND)
TABLE 227 RUSSIA SURFACE ANALYSIS MARKET, BY END USER, 2018-2032 (USD THOUSAND)
TABLE 228 RUSSIA INDUSTRIES IN SURFACE ANALYSIS MARKET, BY TYPE, 2018-2032 (USD THOUSAND)
TABLE 229 RUSSIA INDUSTRIES IN SURFACE ANALYSIS MARKET, BY TECHNOLOGY, 2018-2032 (USD THOUSAND)
TABLE 230 RUSSIA RESEARCH ORGANIZATION IN SURFACE ANALYSIS MARKET, BY TECHNOLOGY, 2018-2032 (USD THOUSAND)
TABLE 231 RUSSIA ACADEMIC INSTITUTES IN SURFACE ANALYSIS MARKET, BY TECHNOLOGY, 2018-2032 (USD THOUSAND)
TABLE 232 TURKEY SURFACE ANALYSIS MARKET, BY TECHNOLOGY, 2018-2032 (USD THOUSAND)
TABLE 233 TURKEY MICROSCOPY IN SURFACE ANALYSIS MARKET, BY METHOD, 2018-2032 (USD THOUSAND)
TABLE 234 TURKEY MICROSCOPY IN SURFACE ANALYSIS MARKET, BY TECHNIQUE, 2018-2032 (USD THOUSAND)
TABLE 235 TURKEY SURFACE ANALYSIS MARKET, BY TYPE, 2018-2032 (USD THOUSAND)
TABLE 236 TURKEY SURFACE ANALYSIS MARKET, BY METHOD TYPE, 2018-2032 (USD THOUSAND)
TABLE 237 TURKEY SURFACE ANALYSIS MARKET, BY EQUIPMENT TYPE, 2018-2032 (USD THOUSAND)
TABLE 238 TURKEY SCANNING PROBE MICROSCOPES (SPM)/ATOMIC FORCE MICROSCOPES (AFM) IN SURFACE ANALYSIS MARKET, BY OPERATION, 2018-2032 (USD THOUSAND)
TABLE 239 TURKEY SCANNING PROBE MICROSCOPES (SPM)/ATOMIC FORCE MICROSCOPES (AFM) IN SURFACE ANALYSIS MARKET, BY NOISE LEVEL, 2018-2032 (USD THOUSAND)
TABLE 240 TURKEY SURFACE ANALYSIS MARKET, BY APPLICATION, 2018-2032 (USD THOUSAND)
TABLE 241 TURKEY SURFACE ANALYSIS MARKET, BY END USER, 2018-2032 (USD THOUSAND)
TABLE 242 TURKEY INDUSTRIES IN SURFACE ANALYSIS MARKET, BY TYPE, 2018-2032 (USD THOUSAND)
TABLE 243 TURKEY INDUSTRIES IN SURFACE ANALYSIS MARKET, BY TECHNOLOGY, 2018-2032 (USD THOUSAND)
TABLE 244 TURKEY RESEARCH ORGANIZATION IN SURFACE ANALYSIS MARKET, BY TECHNOLOGY, 2018-2032 (USD THOUSAND)
TABLE 245 TURKEY ACADEMIC INSTITUTES IN SURFACE ANALYSIS MARKET, BY TECHNOLOGY, 2018-2032 (USD THOUSAND)
TABLE 246 BELGIUM SURFACE ANALYSIS MARKET, BY TECHNOLOGY, 2018-2032 (USD THOUSAND)
TABLE 247 BELGIUM MICROSCOPY IN SURFACE ANALYSIS MARKET, BY METHOD, 2018-2032 (USD THOUSAND)
TABLE 248 BELGIUM MICROSCOPY IN SURFACE ANALYSIS MARKET, BY TECHNIQUE, 2018-2032 (USD THOUSAND)
TABLE 249 BELGIUM SURFACE ANALYSIS MARKET, BY TYPE, 2018-2032 (USD THOUSAND)
TABLE 250 BELGIUM SURFACE ANALYSIS MARKET, BY METHOD TYPE, 2018-2032 (USD THOUSAND)
TABLE 251 BELGIUM SURFACE ANALYSIS MARKET, BY EQUIPMENT TYPE, 2018-2032 (USD THOUSAND)
TABLE 252 BELGIUM SCANNING PROBE MICROSCOPES (SPM)/ATOMIC FORCE MICROSCOPES (AFM) IN SURFACE ANALYSIS MARKET, BY OPERATION, 2018-2032 (USD THOUSAND)
TABLE 253 BELGIUM SCANNING PROBE MICROSCOPES (SPM)/ATOMIC FORCE MICROSCOPES (AFM) IN SURFACE ANALYSIS MARKET, BY NOISE LEVEL, 2018-2032 (USD THOUSAND)
TABLE 254 BELGIUM SURFACE ANALYSIS MARKET, BY APPLICATION, 2018-2032 (USD THOUSAND)
TABLE 255 BELGIUM SURFACE ANALYSIS MARKET, BY END USER, 2018-2032 (USD THOUSAND)
TABLE 256 BELGIUM INDUSTRIES IN SURFACE ANALYSIS MARKET, BY TYPE, 2018-2032 (USD THOUSAND)
TABLE 257 BELGIUM INDUSTRIES IN SURFACE ANALYSIS MARKET, BY TECHNOLOGY, 2018-2032 (USD THOUSAND)
TABLE 258 BELGIUM RESEARCH ORGANIZATION IN SURFACE ANALYSIS MARKET, BY TECHNOLOGY, 2018-2032 (USD THOUSAND)
TABLE 259 BELGIUM ACADEMIC INSTITUTES IN SURFACE ANALYSIS MARKET, BY TECHNOLOGY, 2018-2032 (USD THOUSAND)
TABLE 260 REST OF EUROPE SURFACE ANALYSIS MARKET, BY TECHNOLOGY, 2018-2032 (USD THOUSAND)
TABLE 261 ASIA-PACIFIC SURFACE ANALYSIS MARKET, BY COUNTRY, 2018-2032 (USD THOUSAND)
TABLE 262 ASIA-PACIFIC SURFACE ANALYSIS MARKET, BY TECHNOLOGY, 2018-2032 (USD THOUSAND)
TABLE 263 ASIA-PACIFIC MICROSCOPY IN SURFACE ANALYSIS MARKET, BY METHOD, 2018-2032 (USD THOUSAND)
TABLE 264 ASIA-PACIFIC MICROSCOPY IN SURFACE ANALYSIS MARKET, BY TECHNIQUE, 2018-2032 (USD THOUSAND)
TABLE 265 ASIA-PACIFIC SURFACE ANALYSIS MARKET, BY TYPE, 2018-2032 (USD THOUSAND)
TABLE 266 ASIA-PACIFIC SURFACE ANALYSIS MARKET, BY METHOD TYPE, 2018-2032 (USD THOUSAND)
TABLE 267 ASIA-PACIFIC SURFACE ANALYSIS MARKET, BY EQUIPMENT TYPE, 2018-2032 (USD THOUSAND)
TABLE 268 ASIA-PACIFIC SCANNING PROBE MICROSCOPES (SPM)/ATOMIC FORCE MICROSCOPES (AFM) IN SURFACE ANALYSIS MARKET, BY OPERATION, 2018-2032 (USD THOUSAND)
TABLE 269 ASIA-PACIFIC SCANNING PROBE MICROSCOPES (SPM)/ATOMIC FORCE MICROSCOPES (AFM) IN SURFACE ANALYSIS MARKET, BY NOISE LEVEL, 2018-2032 (USD THOUSAND)
TABLE 270 ASIA-PACIFIC SURFACE ANALYSIS MARKET, BY APPLICATION, 2018-2032 (USD THOUSAND)
TABLE 271 ASIA-PACIFIC SURFACE ANALYSIS MARKET, BY END USER, 2018-2032 (USD THOUSAND)
TABLE 272 ASIA-PACIFIC INDUSTRIES IN SURFACE ANALYSIS MARKET, BY TYPE, 2018-2032 (USD THOUSAND)
TABLE 273 ASIA-PACIFIC INDUSTRIES IN SURFACE ANALYSIS MARKET, BY TECHNOLOGY, 2018-2032 (USD THOUSAND)
TABLE 274 ASIA-PACIFIC RESEARCH ORGANIZATION IN SURFACE ANALYSIS MARKET, BY TECHNOLOGY, 2018-2032 (USD THOUSAND)
TABLE 275 ASIA-PACIFIC ACADEMIC INSTITUTES IN SURFACE ANALYSIS MARKET, BY TECHNOLOGY, 2018-2032 (USD THOUSAND)
TABLE 276 CHINA SURFACE ANALYSIS MARKET, BY TECHNOLOGY, 2018-2032 (USD THOUSAND)
TABLE 277 CHINA MICROSCOPY IN SURFACE ANALYSIS MARKET, BY METHOD, 2018-2032 (USD THOUSAND)
TABLE 278 CHINA MICROSCOPY IN SURFACE ANALYSIS MARKET, BY TECHNIQUE, 2018-2032 (USD THOUSAND)
TABLE 279 CHINA SURFACE ANALYSIS MARKET, BY TYPE, 2018-2032 (USD THOUSAND)
TABLE 280 CHINA SURFACE ANALYSIS MARKET, BY METHOD TYPE, 2018-2032 (USD THOUSAND)
TABLE 281 CHINA SURFACE ANALYSIS MARKET, BY EQUIPMENT TYPE, 2018-2032 (USD THOUSAND)
TABLE 282 CHINA SCANNING PROBE MICROSCOPES (SPM)/ATOMIC FORCE MICROSCOPES (AFM) IN SURFACE ANALYSIS MARKET, BY OPERATION, 2018-2032 (USD THOUSAND)
TABLE 283 CHINA SCANNING PROBE MICROSCOPES (SPM)/ATOMIC FORCE MICROSCOPES (AFM) IN SURFACE ANALYSIS MARKET, BY NOISE LEVEL, 2018-2032 (USD THOUSAND)
TABLE 284 CHINA SURFACE ANALYSIS MARKET, BY APPLICATION, 2018-2032 (USD THOUSAND)
TABLE 285 CHINA SURFACE ANALYSIS MARKET, BY END USER, 2018-2032 (USD THOUSAND)
TABLE 286 CHINA INDUSTRIES IN SURFACE ANALYSIS MARKET, BY TYPE, 2018-2032 (USD THOUSAND)
TABLE 287 CHINA INDUSTRIES IN SURFACE ANALYSIS MARKET, BY TECHNOLOGY, 2018-2032 (USD THOUSAND)
TABLE 288 CHINA RESEARCH ORGANIZATION IN SURFACE ANALYSIS MARKET, BY TECHNOLOGY, 2018-2032 (USD THOUSAND)
TABLE 289 CHINA ACADEMIC INSTITUTES IN SURFACE ANALYSIS MARKET, BY TECHNOLOGY, 2018-2032 (USD THOUSAND)
TABLE 290 JAPAN SURFACE ANALYSIS MARKET, BY TECHNOLOGY, 2018-2032 (USD THOUSAND)
TABLE 291 JAPAN MICROSCOPY IN SURFACE ANALYSIS MARKET, BY METHOD, 2018-2032 (USD THOUSAND)
TABLE 292 JAPAN MICROSCOPY IN SURFACE ANALYSIS MARKET, BY TECHNIQUE, 2018-2032 (USD THOUSAND)
TABLE 293 JAPAN SURFACE ANALYSIS MARKET, BY TYPE, 2018-2032 (USD THOUSAND)
TABLE 294 JAPAN SURFACE ANALYSIS MARKET, BY METHOD TYPE, 2018-2032 (USD THOUSAND)
TABLE 295 JAPAN SURFACE ANALYSIS MARKET, BY EQUIPMENT TYPE, 2018-2032 (USD THOUSAND)
TABLE 296 JAPAN SCANNING PROBE MICROSCOPES (SPM)/ATOMIC FORCE MICROSCOPES (AFM) IN SURFACE ANALYSIS MARKET, BY OPERATION, 2018-2032 (USD THOUSAND)
TABLE 297 JAPAN SCANNING PROBE MICROSCOPES (SPM)/ATOMIC FORCE MICROSCOPES (AFM) IN SURFACE ANALYSIS MARKET, BY NOISE LEVEL, 2018-2032 (USD THOUSAND)
TABLE 298 JAPAN SURFACE ANALYSIS MARKET, BY APPLICATION, 2018-2032 (USD THOUSAND)
TABLE 299 JAPAN SURFACE ANALYSIS MARKET, BY END USER, 2018-2032 (USD THOUSAND)
TABLE 300 JAPAN INDUSTRIES IN SURFACE ANALYSIS MARKET, BY TYPE, 2018-2032 (USD THOUSAND)
TABLE 301 JAPAN INDUSTRIES IN SURFACE ANALYSIS MARKET, BY TECHNOLOGY, 2018-2032 (USD THOUSAND)
TABLE 302 JAPAN RESEARCH ORGANIZATION IN SURFACE ANALYSIS MARKET, BY TECHNOLOGY, 2018-2032 (USD THOUSAND)
TABLE 303 JAPAN ACADEMIC INSTITUTES IN SURFACE ANALYSIS MARKET, BY TECHNOLOGY, 2018-2032 (USD THOUSAND)
TABLE 304 SOUTH KOREA SURFACE ANALYSIS MARKET, BY TECHNOLOGY, 2018-2032 (USD THOUSAND)
TABLE 305 SOUTH KOREA MICROSCOPY IN SURFACE ANALYSIS MARKET, BY METHOD, 2018-2032 (USD THOUSAND)
TABLE 306 SOUTH KOREA MICROSCOPY IN SURFACE ANALYSIS MARKET, BY TECHNIQUE, 2018-2032 (USD THOUSAND)
TABLE 307 SOUTH KOREA SURFACE ANALYSIS MARKET, BY TYPE, 2018-2032 (USD THOUSAND)
TABLE 308 SOUTH KOREA SURFACE ANALYSIS MARKET, BY METHOD TYPE, 2018-2032 (USD THOUSAND)
TABLE 309 SOUTH KOREA SURFACE ANALYSIS MARKET, BY EQUIPMENT TYPE, 2018-2032 (USD THOUSAND)
TABLE 310 SOUTH KOREA SCANNING PROBE MICROSCOPES (SPM)/ATOMIC FORCE MICROSCOPES (AFM) IN SURFACE ANALYSIS MARKET, BY OPERATION, 2018-2032 (USD THOUSAND)
TABLE 311 SOUTH KOREA SCANNING PROBE MICROSCOPES (SPM)/ATOMIC FORCE MICROSCOPES (AFM) IN SURFACE ANALYSIS MARKET, BY NOISE LEVEL, 2018-2032 (USD THOUSAND)
TABLE 312 SOUTH KOREA SURFACE ANALYSIS MARKET, BY APPLICATION, 2018-2032 (USD THOUSAND)
TABLE 313 SOUTH KOREA SURFACE ANALYSIS MARKET, BY END USER, 2018-2032 (USD THOUSAND)
TABLE 314 SOUTH KOREA INDUSTRIES IN SURFACE ANALYSIS MARKET, BY TYPE, 2018-2032 (USD THOUSAND)
TABLE 315 SOUTH KOREA INDUSTRIES IN SURFACE ANALYSIS MARKET, BY TECHNOLOGY, 2018-2032 (USD THOUSAND)
TABLE 316 SOUTH KOREA RESEARCH ORGANIZATION IN SURFACE ANALYSIS MARKET, BY TECHNOLOGY, 2018-2032 (USD THOUSAND)
TABLE 317 SOUTH KOREA ACADEMIC INSTITUTES IN SURFACE ANALYSIS MARKET, BY TECHNOLOGY, 2018-2032 (USD THOUSAND)
TABLE 318 INDIA SURFACE ANALYSIS MARKET, BY TECHNOLOGY, 2018-2032 (USD THOUSAND)
TABLE 319 INDIA MICROSCOPY IN SURFACE ANALYSIS MARKET, BY METHOD, 2018-2032 (USD THOUSAND)
TABLE 320 INDIA MICROSCOPY IN SURFACE ANALYSIS MARKET, BY TECHNIQUE, 2018-2032 (USD THOUSAND)
TABLE 321 INDIA SURFACE ANALYSIS MARKET, BY TYPE, 2018-2032 (USD THOUSAND)
TABLE 322 INDIA SURFACE ANALYSIS MARKET, BY METHOD TYPE, 2018-2032 (USD THOUSAND)
TABLE 323 INDIA SURFACE ANALYSIS MARKET, BY EQUIPMENT TYPE, 2018-2032 (USD THOUSAND)
TABLE 324 INDIA SCANNING PROBE MICROSCOPES (SPM)/ATOMIC FORCE MICROSCOPES (AFM) IN SURFACE ANALYSIS MARKET, BY OPERATION, 2018-2032 (USD THOUSAND)
TABLE 325 INDIA SCANNING PROBE MICROSCOPES (SPM)/ATOMIC FORCE MICROSCOPES (AFM) IN SURFACE ANALYSIS MARKET, BY NOISE LEVEL, 2018-2032 (USD THOUSAND)
TABLE 326 INDIA SURFACE ANALYSIS MARKET, BY APPLICATION, 2018-2032 (USD THOUSAND)
TABLE 327 INDIA SURFACE ANALYSIS MARKET, BY END USER, 2018-2032 (USD THOUSAND)
TABLE 328 INDIA INDUSTRIES IN SURFACE ANALYSIS MARKET, BY TYPE, 2018-2032 (USD THOUSAND)
TABLE 329 INDIA INDUSTRIES IN SURFACE ANALYSIS MARKET, BY TECHNOLOGY, 2018-2032 (USD THOUSAND)
TABLE 330 INDIA RESEARCH ORGANIZATION IN SURFACE ANALYSIS MARKET, BY TECHNOLOGY, 2018-2032 (USD THOUSAND)
TABLE 331 INDIA ACADEMIC INSTITUTES IN SURFACE ANALYSIS MARKET, BY TECHNOLOGY, 2018-2032 (USD THOUSAND)
TABLE 332 AUSTRALIA SURFACE ANALYSIS MARKET, BY TECHNOLOGY, 2018-2032 (USD THOUSAND)
TABLE 333 AUSTRALIA MICROSCOPY IN SURFACE ANALYSIS MARKET, BY METHOD, 2018-2032 (USD THOUSAND)
TABLE 334 AUSTRALIA MICROSCOPY IN SURFACE ANALYSIS MARKET, BY TECHNIQUE, 2018-2032 (USD THOUSAND)
TABLE 335 AUSTRALIA SURFACE ANALYSIS MARKET, BY TYPE, 2018-2032 (USD THOUSAND)
TABLE 336 AUSTRALIA SURFACE ANALYSIS MARKET, BY METHOD TYPE, 2018-2032 (USD THOUSAND)
TABLE 337 AUSTRALIA SURFACE ANALYSIS MARKET, BY EQUIPMENT TYPE, 2018-2032 (USD THOUSAND)
TABLE 338 AUSTRALIA SCANNING PROBE MICROSCOPES (SPM)/ATOMIC FORCE MICROSCOPES (AFM) IN SURFACE ANALYSIS MARKET, BY OPERATION, 2018-2032 (USD THOUSAND)
TABLE 339 AUSTRALIA SCANNING PROBE MICROSCOPES (SPM)/ATOMIC FORCE MICROSCOPES (AFM) IN SURFACE ANALYSIS MARKET, BY NOISE LEVEL, 2018-2032 (USD THOUSAND)
TABLE 340 AUSTRALIA SURFACE ANALYSIS MARKET, BY APPLICATION, 2018-2032 (USD THOUSAND)
TABLE 341 AUSTRALIA SURFACE ANALYSIS MARKET, BY END USER, 2018-2032 (USD THOUSAND)
TABLE 342 AUSTRALIA INDUSTRIES IN SURFACE ANALYSIS MARKET, BY TYPE, 2018-2032 (USD THOUSAND)
TABLE 343 AUSTRALIA INDUSTRIES IN SURFACE ANALYSIS MARKET, BY TECHNOLOGY, 2018-2032 (USD THOUSAND)
TABLE 344 AUSTRALIA RESEARCH ORGANIZATION IN SURFACE ANALYSIS MARKET, BY TECHNOLOGY, 2018-2032 (USD THOUSAND)
TABLE 345 AUSTRALIA ACADEMIC INSTITUTES IN SURFACE ANALYSIS MARKET, BY TECHNOLOGY, 2018-2032 (USD THOUSAND)
TABLE 346 SINGAPORE SURFACE ANALYSIS MARKET, BY TECHNOLOGY, 2018-2032 (USD THOUSAND)
TABLE 347 SINGAPORE MICROSCOPY IN SURFACE ANALYSIS MARKET, BY METHOD, 2018-2032 (USD THOUSAND)
TABLE 348 SINGAPORE MICROSCOPY IN SURFACE ANALYSIS MARKET, BY TECHNIQUE, 2018-2032 (USD THOUSAND)
TABLE 349 SINGAPORE SURFACE ANALYSIS MARKET, BY TYPE, 2018-2032 (USD THOUSAND)
TABLE 350 SINGAPORE SURFACE ANALYSIS MARKET, BY METHOD TYPE, 2018-2032 (USD THOUSAND)
TABLE 351 SINGAPORE SURFACE ANALYSIS MARKET, BY EQUIPMENT TYPE, 2018-2032 (USD THOUSAND)
TABLE 352 SINGAPORE SCANNING PROBE MICROSCOPES (SPM)/ATOMIC FORCE MICROSCOPES (AFM) IN SURFACE ANALYSIS MARKET, BY OPERATION, 2018-2032 (USD THOUSAND)
TABLE 353 SINGAPORE SCANNING PROBE MICROSCOPES (SPM)/ATOMIC FORCE MICROSCOPES (AFM) IN SURFACE ANALYSIS MARKET, BY NOISE LEVEL, 2018-2032 (USD THOUSAND)
TABLE 354 SINGAPORE SURFACE ANALYSIS MARKET, BY APPLICATION, 2018-2032 (USD THOUSAND)
TABLE 355 SINGAPORE SURFACE ANALYSIS MARKET, BY END USER, 2018-2032 (USD THOUSAND)
TABLE 356 SINGAPORE INDUSTRIES IN SURFACE ANALYSIS MARKET, BY TYPE, 2018-2032 (USD THOUSAND)
TABLE 357 SINGAPORE INDUSTRIES IN SURFACE ANALYSIS MARKET, BY TECHNOLOGY, 2018-2032 (USD THOUSAND)
TABLE 358 SINGAPORE RESEARCH ORGANIZATION IN SURFACE ANALYSIS MARKET, BY TECHNOLOGY, 2018-2032 (USD THOUSAND)
TABLE 359 SINGAPORE ACADEMIC INSTITUTES IN SURFACE ANALYSIS MARKET, BY TECHNOLOGY, 2018-2032 (USD THOUSAND)
TABLE 360 INDONESIA SURFACE ANALYSIS MARKET, BY TECHNOLOGY, 2018-2032 (USD THOUSAND)
TABLE 361 INDONESIA MICROSCOPY IN SURFACE ANALYSIS MARKET, BY METHOD, 2018-2032 (USD THOUSAND)
TABLE 362 INDONESIA MICROSCOPY IN SURFACE ANALYSIS MARKET, BY TECHNIQUE, 2018-2032 (USD THOUSAND)
TABLE 363 INDONESIA SURFACE ANALYSIS MARKET, BY TYPE, 2018-2032 (USD THOUSAND)
TABLE 364 INDONESIA SURFACE ANALYSIS MARKET, BY METHOD TYPE, 2018-2032 (USD THOUSAND)
TABLE 365 INDONESIA SURFACE ANALYSIS MARKET, BY EQUIPMENT TYPE, 2018-2032 (USD THOUSAND)
TABLE 366 INDONESIA SCANNING PROBE MICROSCOPES (SPM)/ATOMIC FORCE MICROSCOPES (AFM) IN SURFACE ANALYSIS MARKET, BY OPERATION, 2018-2032 (USD THOUSAND)
TABLE 367 INDONESIA SCANNING PROBE MICROSCOPES (SPM)/ATOMIC FORCE MICROSCOPES (AFM) IN SURFACE ANALYSIS MARKET, BY NOISE LEVEL, 2018-2032 (USD THOUSAND)
TABLE 368 INDONESIA SURFACE ANALYSIS MARKET, BY APPLICATION, 2018-2032 (USD THOUSAND)
TABLE 369 INDONESIA SURFACE ANALYSIS MARKET, BY END USER, 2018-2032 (USD THOUSAND)
TABLE 370 INDONESIA INDUSTRIES IN SURFACE ANALYSIS MARKET, BY TYPE, 2018-2032 (USD THOUSAND)
TABLE 371 INDONESIA INDUSTRIES IN SURFACE ANALYSIS MARKET, BY TECHNOLOGY, 2018-2032 (USD THOUSAND)
TABLE 372 INDONESIA RESEARCH ORGANIZATION IN SURFACE ANALYSIS MARKET, BY TECHNOLOGY, 2018-2032 (USD THOUSAND)
TABLE 373 INDONESIA ACADEMIC INSTITUTES IN SURFACE ANALYSIS MARKET, BY TECHNOLOGY, 2018-2032 (USD THOUSAND)
TABLE 374 THAILAND SURFACE ANALYSIS MARKET, BY TECHNOLOGY, 2018-2032 (USD THOUSAND)
TABLE 375 THAILAND MICROSCOPY IN SURFACE ANALYSIS MARKET, BY METHOD, 2018-2032 (USD THOUSAND)
TABLE 376 THAILAND MICROSCOPY IN SURFACE ANALYSIS MARKET, BY TECHNIQUE, 2018-2032 (USD THOUSAND)
TABLE 377 THAILAND SURFACE ANALYSIS MARKET, BY TYPE, 2018-2032 (USD THOUSAND)
TABLE 378 THAILAND SURFACE ANALYSIS MARKET, BY METHOD TYPE, 2018-2032 (USD THOUSAND)
TABLE 379 THAILAND SURFACE ANALYSIS MARKET, BY EQUIPMENT TYPE, 2018-2032 (USD THOUSAND)
TABLE 380 THAILAND SCANNING PROBE MICROSCOPES (SPM)/ATOMIC FORCE MICROSCOPES (AFM) IN SURFACE ANALYSIS MARKET, BY OPERATION, 2018-2032 (USD THOUSAND)
TABLE 381 THAILAND SCANNING PROBE MICROSCOPES (SPM)/ATOMIC FORCE MICROSCOPES (AFM) IN SURFACE ANALYSIS MARKET, BY NOISE LEVEL, 2018-2032 (USD THOUSAND)
TABLE 382 THAILAND SURFACE ANALYSIS MARKET, BY APPLICATION, 2018-2032 (USD THOUSAND)
TABLE 383 THAILAND SURFACE ANALYSIS MARKET, BY END USER, 2018-2032 (USD THOUSAND)
TABLE 384 THAILAND INDUSTRIES IN SURFACE ANALYSIS MARKET, BY TYPE, 2018-2032 (USD THOUSAND)
TABLE 385 THAILAND INDUSTRIES IN SURFACE ANALYSIS MARKET, BY TECHNOLOGY, 2018-2032 (USD THOUSAND)
TABLE 386 THAILAND RESEARCH ORGANIZATION IN SURFACE ANALYSIS MARKET, BY TECHNOLOGY, 2018-2032 (USD THOUSAND)
TABLE 387 THAILAND ACADEMIC INSTITUTES IN SURFACE ANALYSIS MARKET, BY TECHNOLOGY, 2018-2032 (USD THOUSAND)
TABLE 388 MALAYSIA SURFACE ANALYSIS MARKET, BY TECHNOLOGY, 2018-2032 (USD THOUSAND)
TABLE 389 MALAYSIA MICROSCOPY IN SURFACE ANALYSIS MARKET, BY METHOD, 2018-2032 (USD THOUSAND)
TABLE 390 MALAYSIA MICROSCOPY IN SURFACE ANALYSIS MARKET, BY TECHNIQUE, 2018-2032 (USD THOUSAND)
TABLE 391 MALAYSIA SURFACE ANALYSIS MARKET, BY TYPE, 2018-2032 (USD THOUSAND)
TABLE 392 MALAYSIA SURFACE ANALYSIS MARKET, BY METHOD TYPE, 2018-2032 (USD THOUSAND)
TABLE 393 MALAYSIA SURFACE ANALYSIS MARKET, BY EQUIPMENT TYPE, 2018-2032 (USD THOUSAND)
TABLE 394 MALAYSIA SCANNING PROBE MICROSCOPES (SPM)/ATOMIC FORCE MICROSCOPES (AFM) IN SURFACE ANALYSIS MARKET, BY OPERATION, 2018-2032 (USD THOUSAND)
TABLE 395 MALAYSIA SCANNING PROBE MICROSCOPES (SPM)/ATOMIC FORCE MICROSCOPES (AFM) IN SURFACE ANALYSIS MARKET, BY NOISE LEVEL, 2018-2032 (USD THOUSAND)
TABLE 396 MALAYSIA SURFACE ANALYSIS MARKET, BY APPLICATION, 2018-2032 (USD THOUSAND)
TABLE 397 MALAYSIA SURFACE ANALYSIS MARKET, BY END USER, 2018-2032 (USD THOUSAND)
TABLE 398 MALAYSIA INDUSTRIES IN SURFACE ANALYSIS MARKET, BY TYPE, 2018-2032 (USD THOUSAND)
TABLE 399 MALAYSIA INDUSTRIES IN SURFACE ANALYSIS MARKET, BY TECHNOLOGY, 2018-2032 (USD THOUSAND)
TABLE 400 MALAYSIA RESEARCH ORGANIZATION IN SURFACE ANALYSIS MARKET, BY TECHNOLOGY, 2018-2032 (USD THOUSAND)
TABLE 401 MALAYSIA ACADEMIC INSTITUTES IN SURFACE ANALYSIS MARKET, BY TECHNOLOGY, 2018-2032 (USD THOUSAND)
TABLE 402 PHILIPPINES SURFACE ANALYSIS MARKET, BY TECHNOLOGY, 2018-2032 (USD THOUSAND)
TABLE 403 PHILIPPINES MICROSCOPY IN SURFACE ANALYSIS MARKET, BY METHOD, 2018-2032 (USD THOUSAND)
TABLE 404 PHILIPPINES MICROSCOPY IN SURFACE ANALYSIS MARKET, BY TECHNIQUE, 2018-2032 (USD THOUSAND)
TABLE 405 PHILIPPINES SURFACE ANALYSIS MARKET, BY TYPE, 2018-2032 (USD THOUSAND)
TABLE 406 PHILIPPINES SURFACE ANALYSIS MARKET, BY METHOD TYPE, 2018-2032 (USD THOUSAND)
TABLE 407 PHILIPPINES SURFACE ANALYSIS MARKET, BY EQUIPMENT TYPE, 2018-2032 (USD THOUSAND)
TABLE 408 PHILIPPINES SCANNING PROBE MICROSCOPES (SPM)/ATOMIC FORCE MICROSCOPES (AFM) IN SURFACE ANALYSIS MARKET, BY OPERATION, 2018-2032 (USD THOUSAND)
TABLE 409 PHILIPPINES SCANNING PROBE MICROSCOPES (SPM)/ATOMIC FORCE MICROSCOPES (AFM) IN SURFACE ANALYSIS MARKET, BY NOISE LEVEL, 2018-2032 (USD THOUSAND)
TABLE 410 PHILIPPINES SURFACE ANALYSIS MARKET, BY APPLICATION, 2018-2032 (USD THOUSAND)
TABLE 411 PHILIPPINES SURFACE ANALYSIS MARKET, BY END USER, 2018-2032 (USD THOUSAND)
TABLE 412 PHILIPPINES INDUSTRIES IN SURFACE ANALYSIS MARKET, BY TYPE, 2018-2032 (USD THOUSAND)
TABLE 413 PHILIPPINES INDUSTRIES IN SURFACE ANALYSIS MARKET, BY TECHNOLOGY, 2018-2032 (USD THOUSAND)
TABLE 414 PHILIPPINES RESEARCH ORGANIZATION IN SURFACE ANALYSIS MARKET, BY TECHNOLOGY, 2018-2032 (USD THOUSAND)
TABLE 415 PHILIPPINES ACADEMIC INSTITUTES IN SURFACE ANALYSIS MARKET, BY TECHNOLOGY, 2018-2032 (USD THOUSAND)
TABLE 416 NEW-ZEALAND SURFACE ANALYSIS MARKET, BY TECHNOLOGY, 2018-2032 (USD THOUSAND)
TABLE 417 NEW-ZEALAND MICROSCOPY IN SURFACE ANALYSIS MARKET, BY METHOD, 2018-2032 (USD THOUSAND)
TABLE 418 NEW-ZEALAND MICROSCOPY IN SURFACE ANALYSIS MARKET, BY TECHNIQUE, 2018-2032 (USD THOUSAND)
TABLE 419 NEW-ZEALAND SURFACE ANALYSIS MARKET, BY TYPE, 2018-2032 (USD THOUSAND)
TABLE 420 NEW-ZEALAND SURFACE ANALYSIS MARKET, BY METHOD TYPE, 2018-2032 (USD THOUSAND)
TABLE 421 NEW-ZEALAND SURFACE ANALYSIS MARKET, BY EQUIPMENT TYPE, 2018-2032 (USD THOUSAND)
TABLE 422 NEW-ZEALAND SCANNING PROBE MICROSCOPES (SPM)/ATOMIC FORCE MICROSCOPES (AFM) IN SURFACE ANALYSIS MARKET, BY OPERATION, 2018-2032 (USD THOUSAND)
TABLE 423 NEW-ZEALAND SCANNING PROBE MICROSCOPES (SPM)/ATOMIC FORCE MICROSCOPES (AFM) IN SURFACE ANALYSIS MARKET, BY NOISE LEVEL, 2018-2032 (USD THOUSAND)
TABLE 424 NEW-ZEALAND SURFACE ANALYSIS MARKET, BY APPLICATION, 2018-2032 (USD THOUSAND)
TABLE 425 NEW-ZEALAND SURFACE ANALYSIS MARKET, BY END USER, 2018-2032 (USD THOUSAND)
TABLE 426 NEW-ZEALAND INDUSTRIES IN SURFACE ANALYSIS MARKET, BY TYPE, 2018-2032 (USD THOUSAND)
TABLE 427 NEW-ZEALAND INDUSTRIES IN SURFACE ANALYSIS MARKET, BY TECHNOLOGY, 2018-2032 (USD THOUSAND)
TABLE 428 NEW-ZEALAND RESEARCH ORGANIZATION IN SURFACE ANALYSIS MARKET, BY TECHNOLOGY, 2018-2032 (USD THOUSAND)
TABLE 429 NEW-ZEALAND ACADEMIC INSTITUTES IN SURFACE ANALYSIS MARKET, BY TECHNOLOGY, 2018-2032 (USD THOUSAND)
TABLE 430 REST OF ASIA-PACIFIC SURFACE ANALYSIS MARKET, BY TECHNOLOGY, 2018-2032 (USD THOUSAND)
TABLE 431 SOUTH AMERICA SURFACE ANALYSIS MARKET, BY COUNTRY, 2018-2032 (USD THOUSAND)
TABLE 432 SOUTH AMERICA SURFACE ANALYSIS MARKET, BY TECHNOLOGY, 2018-2032 (USD THOUSAND)
TABLE 433 SOUTH AMERICA MICROSCOPY IN SURFACE ANALYSIS MARKET, BY METHOD, 2018-2032 (USD THOUSAND)
TABLE 434 SOUTH AMERICA MICROSCOPY IN SURFACE ANALYSIS MARKET, BY TECHNIQUE, 2018-2032 (USD THOUSAND)
TABLE 435 SOUTH AMERICA SURFACE ANALYSIS MARKET, BY TYPE, 2018-2032 (USD THOUSAND)
TABLE 436 SOUTH AMERICA SURFACE ANALYSIS MARKET, BY METHOD TYPE, 2018-2032 (USD THOUSAND)
TABLE 437 SOUTH AMERICA SURFACE ANALYSIS MARKET, BY EQUIPMENT TYPE, 2018-2032 (USD THOUSAND)
TABLE 438 SOUTH AMERICA SCANNING PROBE MICROSCOPES (SPM)/ATOMIC FORCE MICROSCOPES (AFM) IN SURFACE ANALYSIS MARKET, BY OPERATION, 2018-2032 (USD THOUSAND)
TABLE 439 SOUTH AMERICA SCANNING PROBE MICROSCOPES (SPM)/ATOMIC FORCE MICROSCOPES (AFM) IN SURFACE ANALYSIS MARKET, BY NOISE LEVEL, 2018-2032 (USD THOUSAND)
TABLE 440 SOUTH AMERICA SURFACE ANALYSIS MARKET, BY APPLICATION, 2018-2032 (USD THOUSAND)
TABLE 441 SOUTH AMERICA SURFACE ANALYSIS MARKET, BY END USER, 2018-2032 (USD THOUSAND)
TABLE 442 SOUTH AMERICA INDUSTRIES IN SURFACE ANALYSIS MARKET, BY TYPE, 2018-2032 (USD THOUSAND)
TABLE 443 SOUTH AMERICA INDUSTRIES IN SURFACE ANALYSIS MARKET, BY TECHNOLOGY, 2018-2032 (USD THOUSAND)
TABLE 444 SOUTH AMERICA RESEARCH ORGANIZATION IN SURFACE ANALYSIS MARKET, BY TECHNOLOGY, 2018-2032 (USD THOUSAND)
TABLE 445 SOUTH AMERICA ACADEMIC INSTITUTES IN SURFACE ANALYSIS MARKET, BY TECHNOLOGY, 2018-2032 (USD THOUSAND)
TABLE 446 BRAZIL SURFACE ANALYSIS MARKET, BY TECHNOLOGY, 2018-2032 (USD THOUSAND)
TABLE 447 BRAZIL MICROSCOPY IN SURFACE ANALYSIS MARKET, BY METHOD, 2018-2032 (USD THOUSAND)
TABLE 448 BRAZIL MICROSCOPY IN SURFACE ANALYSIS MARKET, BY TECHNIQUE, 2018-2032 (USD THOUSAND)
TABLE 449 BRAZIL SURFACE ANALYSIS MARKET, BY TYPE, 2018-2032 (USD THOUSAND)
TABLE 450 BRAZIL SURFACE ANALYSIS MARKET, BY METHOD TYPE, 2018-2032 (USD THOUSAND)
TABLE 451 BRAZIL SURFACE ANALYSIS MARKET, BY EQUIPMENT TYPE, 2018-2032 (USD THOUSAND)
TABLE 452 BRAZIL SCANNING PROBE MICROSCOPES (SPM)/ATOMIC FORCE MICROSCOPES (AFM) IN SURFACE ANALYSIS MARKET, BY OPERATION, 2018-2032 (USD THOUSAND)
TABLE 453 BRAZIL SCANNING PROBE MICROSCOPES (SPM)/ATOMIC FORCE MICROSCOPES (AFM) IN SURFACE ANALYSIS MARKET, BY NOISE LEVEL, 2018-2032 (USD THOUSAND)
TABLE 454 BRAZIL SURFACE ANALYSIS MARKET, BY APPLICATION, 2018-2032 (USD THOUSAND)
TABLE 455 BRAZIL SURFACE ANALYSIS MARKET, BY END USER, 2018-2032 (USD THOUSAND)
TABLE 456 BRAZIL INDUSTRIES IN SURFACE ANALYSIS MARKET, BY TYPE, 2018-2032 (USD THOUSAND)
TABLE 457 BRAZIL INDUSTRIES IN SURFACE ANALYSIS MARKET, BY TECHNOLOGY, 2018-2032 (USD THOUSAND)
TABLE 458 BRAZIL RESEARCH ORGANIZATION IN SURFACE ANALYSIS MARKET, BY TECHNOLOGY, 2018-2032 (USD THOUSAND)
TABLE 459 BRAZIL ACADEMIC INSTITUTES IN SURFACE ANALYSIS MARKET, BY TECHNOLOGY, 2018-2032 (USD THOUSAND)
TABLE 460 ARGENTINA SURFACE ANALYSIS MARKET, BY TECHNOLOGY, 2018-2032 (USD THOUSAND)
TABLE 461 ARGENTINA MICROSCOPY IN SURFACE ANALYSIS MARKET, BY METHOD, 2018-2032 (USD THOUSAND)
TABLE 462 ARGENTINA MICROSCOPY IN SURFACE ANALYSIS MARKET, BY TECHNIQUE, 2018-2032 (USD THOUSAND)
TABLE 463 ARGENTINA SURFACE ANALYSIS MARKET, BY TYPE, 2018-2032 (USD THOUSAND)
TABLE 464 ARGENTINA SURFACE ANALYSIS MARKET, BY METHOD TYPE, 2018-2032 (USD THOUSAND)
TABLE 465 ARGENTINA SURFACE ANALYSIS MARKET, BY EQUIPMENT TYPE, 2018-2032 (USD THOUSAND)
TABLE 466 ARGENTINA SCANNING PROBE MICROSCOPES (SPM)/ATOMIC FORCE MICROSCOPES (AFM) IN SURFACE ANALYSIS MARKET, BY OPERATION, 2018-2032 (USD THOUSAND)
TABLE 467 ARGENTINA SCANNING PROBE MICROSCOPES (SPM)/ATOMIC FORCE MICROSCOPES (AFM) IN SURFACE ANALYSIS MARKET, BY NOISE LEVEL, 2018-2032 (USD THOUSAND)
TABLE 468 ARGENTINA SURFACE ANALYSIS MARKET, BY APPLICATION, 2018-2032 (USD THOUSAND)
TABLE 469 ARGENTINA SURFACE ANALYSIS MARKET, BY END USER, 2018-2032 (USD THOUSAND)
TABLE 470 ARGENTINA INDUSTRIES IN SURFACE ANALYSIS MARKET, BY TYPE, 2018-2032 (USD THOUSAND)
TABLE 471 ARGENTINA INDUSTRIES IN SURFACE ANALYSIS MARKET, BY TECHNOLOGY, 2018-2032 (USD THOUSAND)
TABLE 472 ARGENTINA RESEARCH ORGANIZATION IN SURFACE ANALYSIS MARKET, BY TECHNOLOGY, 2018-2032 (USD THOUSAND)
TABLE 473 ARGENTINA ACADEMIC INSTITUTES IN SURFACE ANALYSIS MARKET, BY TECHNOLOGY, 2018-2032 (USD THOUSAND)
TABLE 474 REST OF SOUTH AMERICA SURFACE ANALYSIS MARKET, BY TECHNOLOGY, 2018-2032 (USD THOUSAND)
TABLE 475 MIDDLE EAST AND AFRICA SURFACE ANALYSIS MARKET, BY COUNTRY, 2018-2032 (USD THOUSAND)
TABLE 476 MIDDLE EAST AND AFRICA SURFACE ANALYSIS MARKET, BY TECHNOLOGY, 2018-2032 (USD THOUSAND)
TABLE 477 MIDDLE EAST AND AFRICA MICROSCOPY IN SURFACE ANALYSIS MARKET, BY METHOD, 2018-2032 (USD THOUSAND)
TABLE 478 MIDDLE EAST AND AFRICA MICROSCOPY IN SURFACE ANALYSIS MARKET, BY TECHNIQUE, 2018-2032 (USD THOUSAND)
TABLE 479 MIDDLE EAST AND AFRICA SURFACE ANALYSIS MARKET, BY TYPE, 2018-2032 (USD THOUSAND)
TABLE 480 MIDDLE EAST AND AFRICA SURFACE ANALYSIS MARKET, BY METHOD TYPE, 2018-2032 (USD THOUSAND)
TABLE 481 MIDDLE EAST AND AFRICA SURFACE ANALYSIS MARKET, BY EQUIPMENT TYPE, 2018-2032 (USD THOUSAND)
TABLE 482 MIDDLE EAST AND AFRICA SCANNING PROBE MICROSCOPES (SPM)/ATOMIC FORCE MICROSCOPES (AFM) IN SURFACE ANALYSIS MARKET, BY OPERATION, 2018-2032 (USD THOUSAND)
TABLE 483 MIDDLE EAST AND AFRICA SCANNING PROBE MICROSCOPES (SPM)/ATOMIC FORCE MICROSCOPES (AFM) IN SURFACE ANALYSIS MARKET, BY NOISE LEVEL, 2018-2032 (USD THOUSAND)
TABLE 484 MIDDLE EAST AND AFRICA SURFACE ANALYSIS MARKET, BY APPLICATION, 2018-2032 (USD THOUSAND)
TABLE 485 MIDDLE EAST AND AFRICA SURFACE ANALYSIS MARKET, BY END USER, 2018-2032 (USD THOUSAND)
TABLE 486 MIDDLE EAST AND AFRICA INDUSTRIES IN SURFACE ANALYSIS MARKET, BY TYPE, 2018-2032 (USD THOUSAND)
TABLE 487 MIDDLE EAST AND AFRICA INDUSTRIES IN SURFACE ANALYSIS MARKET, BY TECHNOLOGY, 2018-2032 (USD THOUSAND)
TABLE 488 MIDDLE EAST AND AFRICA RESEARCH ORGANIZATION IN SURFACE ANALYSIS MARKET, BY TECHNOLOGY, 2018-2032 (USD THOUSAND)
TABLE 489 MIDDLE EAST AND AFRICA ACADEMIC INSTITUTES IN SURFACE ANALYSIS MARKET, BY TECHNOLOGY, 2018-2032 (USD THOUSAND)
TABLE 490 SAUDI ARABIA SURFACE ANALYSIS MARKET, BY TECHNOLOGY, 2018-2032 (USD THOUSAND)
TABLE 491 SAUDI ARABIA MICROSCOPY IN SURFACE ANALYSIS MARKET, BY METHOD, 2018-2032 (USD THOUSAND)
TABLE 492 SAUDI ARABIA MICROSCOPY IN SURFACE ANALYSIS MARKET, BY TECHNIQUE, 2018-2032 (USD THOUSAND)
TABLE 493 SAUDI ARABIA SURFACE ANALYSIS MARKET, BY TYPE, 2018-2032 (USD THOUSAND)
TABLE 494 SAUDI ARABIA SURFACE ANALYSIS MARKET, BY METHOD TYPE, 2018-2032 (USD THOUSAND)
TABLE 495 SAUDI ARABIA SURFACE ANALYSIS MARKET, BY EQUIPMENT TYPE, 2018-2032 (USD THOUSAND)
TABLE 496 SAUDI ARABIA SCANNING PROBE MICROSCOPES (SPM)/ATOMIC FORCE MICROSCOPES (AFM) IN SURFACE ANALYSIS MARKET, BY OPERATION, 2018-2032 (USD THOUSAND)
TABLE 497 SAUDI ARABIA SCANNING PROBE MICROSCOPES (SPM)/ATOMIC FORCE MICROSCOPES (AFM) IN SURFACE ANALYSIS MARKET, BY NOISE LEVEL, 2018-2032 (USD THOUSAND)
TABLE 498 SAUDI ARABIA SURFACE ANALYSIS MARKET, BY APPLICATION, 2018-2032 (USD THOUSAND)
TABLE 499 SAUDI ARABIA SURFACE ANALYSIS MARKET, BY END USER, 2018-2032 (USD THOUSAND)
TABLE 500 SAUDI ARABIA INDUSTRIES IN SURFACE ANALYSIS MARKET, BY TYPE, 2018-2032 (USD THOUSAND)
TABLE 501 SAUDI ARABIA INDUSTRIES IN SURFACE ANALYSIS MARKET, BY TECHNOLOGY, 2018-2032 (USD THOUSAND)
TABLE 502 SAUDI ARABIA RESEARCH ORGANIZATION IN SURFACE ANALYSIS MARKET, BY TECHNOLOGY, 2018-2032 (USD THOUSAND)
TABLE 503 SAUDI ARABIA ACADEMIC INSTITUTES IN SURFACE ANALYSIS MARKET, BY TECHNOLOGY, 2018-2032 (USD THOUSAND)
TABLE 504 SOUTH AFRICA SURFACE ANALYSIS MARKET, BY TECHNOLOGY, 2018-2032 (USD THOUSAND)
TABLE 505 SOUTH AFRICA MICROSCOPY IN SURFACE ANALYSIS MARKET, BY METHOD, 2018-2032 (USD THOUSAND)
TABLE 506 SOUTH AFRICA MICROSCOPY IN SURFACE ANALYSIS MARKET, BY TECHNIQUE, 2018-2032 (USD THOUSAND)
TABLE 507 SOUTH AFRICA SURFACE ANALYSIS MARKET, BY TYPE, 2018-2032 (USD THOUSAND)
TABLE 508 SOUTH AFRICA SURFACE ANALYSIS MARKET, BY METHOD TYPE, 2018-2032 (USD THOUSAND)
TABLE 509 SOUTH AFRICA SURFACE ANALYSIS MARKET, BY EQUIPMENT TYPE, 2018-2032 (USD THOUSAND)
TABLE 510 SOUTH AFRICA SCANNING PROBE MICROSCOPES (SPM)/ATOMIC FORCE MICROSCOPES (AFM) IN SURFACE ANALYSIS MARKET, BY OPERATION, 2018-2032 (USD THOUSAND)
TABLE 511 SOUTH AFRICA SCANNING PROBE MICROSCOPES (SPM)/ATOMIC FORCE MICROSCOPES (AFM) IN SURFACE ANALYSIS MARKET, BY NOISE LEVEL, 2018-2032 (USD THOUSAND)
TABLE 512 SOUTH AFRICA SURFACE ANALYSIS MARKET, BY APPLICATION, 2018-2032 (USD THOUSAND)
TABLE 513 SOUTH AFRICA SURFACE ANALYSIS MARKET, BY END USER, 2018-2032 (USD THOUSAND)
TABLE 514 SOUTH AFRICA INDUSTRIES IN SURFACE ANALYSIS MARKET, BY TYPE, 2018-2032 (USD THOUSAND)
TABLE 515 SOUTH AFRICA INDUSTRIES IN SURFACE ANALYSIS MARKET, BY TECHNOLOGY, 2018-2032 (USD THOUSAND)
TABLE 516 SOUTH AFRICA RESEARCH ORGANIZATION IN SURFACE ANALYSIS MARKET, BY TECHNOLOGY, 2018-2032 (USD THOUSAND)
TABLE 517 SOUTH AFRICA ACADEMIC INSTITUTES IN SURFACE ANALYSIS MARKET, BY TECHNOLOGY, 2018-2032 (USD THOUSAND)
TABLE 518 U.A.E. SURFACE ANALYSIS MARKET, BY TECHNOLOGY, 2018-2032 (USD THOUSAND)
TABLE 519 U.A.E. MICROSCOPY IN SURFACE ANALYSIS MARKET, BY METHOD, 2018-2032 (USD THOUSAND)
TABLE 520 U.A.E. MICROSCOPY IN SURFACE ANALYSIS MARKET, BY TECHNIQUE, 2018-2032 (USD THOUSAND)
TABLE 521 U.A.E. SURFACE ANALYSIS MARKET, BY TYPE, 2018-2032 (USD THOUSAND)
TABLE 522 U.A.E. SURFACE ANALYSIS MARKET, BY METHOD TYPE, 2018-2032 (USD THOUSAND)
TABLE 523 U.A.E. SURFACE ANALYSIS MARKET, BY EQUIPMENT TYPE, 2018-2032 (USD THOUSAND)
TABLE 524 U.A.E. SCANNING PROBE MICROSCOPES (SPM)/ATOMIC FORCE MICROSCOPES (AFM) IN SURFACE ANALYSIS MARKET, BY OPERATION, 2018-2032 (USD THOUSAND)
TABLE 525 U.A.E. SCANNING PROBE MICROSCOPES (SPM)/ATOMIC FORCE MICROSCOPES (AFM) IN SURFACE ANALYSIS MARKET, BY NOISE LEVEL, 2018-2032 (USD THOUSAND)
TABLE 526 U.A.E. SURFACE ANALYSIS MARKET, BY APPLICATION, 2018-2032 (USD THOUSAND)
TABLE 527 U.A.E. SURFACE ANALYSIS MARKET, BY END USER, 2018-2032 (USD THOUSAND)
TABLE 528 U.A.E. INDUSTRIES IN SURFACE ANALYSIS MARKET, BY TYPE, 2018-2032 (USD THOUSAND)
TABLE 529 U.A.E. INDUSTRIES IN SURFACE ANALYSIS MARKET, BY TECHNOLOGY, 2018-2032 (USD THOUSAND)
TABLE 530 U.A.E. RESEARCH ORGANIZATION IN SURFACE ANALYSIS MARKET, BY TECHNOLOGY, 2018-2032 (USD THOUSAND)
TABLE 531 U.A.E. ACADEMIC INSTITUTES IN SURFACE ANALYSIS MARKET, BY TECHNOLOGY, 2018-2032 (USD THOUSAND)
TABLE 532 EGYPT SURFACE ANALYSIS MARKET, BY TECHNOLOGY, 2018-2032 (USD THOUSAND)
TABLE 533 EGYPT MICROSCOPY IN SURFACE ANALYSIS MARKET, BY METHOD, 2018-2032 (USD THOUSAND)
TABLE 534 EGYPT MICROSCOPY IN SURFACE ANALYSIS MARKET, BY TECHNIQUE, 2018-2032 (USD THOUSAND)
TABLE 535 EGYPT SURFACE ANALYSIS MARKET, BY TYPE, 2018-2032 (USD THOUSAND)
TABLE 536 EGYPT SURFACE ANALYSIS MARKET, BY METHOD TYPE, 2018-2032 (USD THOUSAND)
TABLE 537 EGYPT SURFACE ANALYSIS MARKET, BY EQUIPMENT TYPE, 2018-2032 (USD THOUSAND)
TABLE 538 EGYPT SCANNING PROBE MICROSCOPES (SPM)/ATOMIC FORCE MICROSCOPES (AFM) IN SURFACE ANALYSIS MARKET, BY OPERATION, 2018-2032 (USD THOUSAND)
TABLE 539 EGYPT SCANNING PROBE MICROSCOPES (SPM)/ATOMIC FORCE MICROSCOPES (AFM) IN SURFACE ANALYSIS MARKET, BY NOISE LEVEL, 2018-2032 (USD THOUSAND)
TABLE 540 EGYPT SURFACE ANALYSIS MARKET, BY APPLICATION, 2018-2032 (USD THOUSAND)
TABLE 541 EGYPT SURFACE ANALYSIS MARKET, BY END USER, 2018-2032 (USD THOUSAND)
TABLE 542 EGYPT INDUSTRIES IN SURFACE ANALYSIS MARKET, BY TYPE, 2018-2032 (USD THOUSAND)
TABLE 543 EGYPT INDUSTRIES IN SURFACE ANALYSIS MARKET, BY TECHNOLOGY, 2018-2032 (USD THOUSAND)
TABLE 544 EGYPT RESEARCH ORGANIZATION IN SURFACE ANALYSIS MARKET, BY TECHNOLOGY, 2018-2032 (USD THOUSAND)
TABLE 545 EGYPT ACADEMIC INSTITUTES IN SURFACE ANALYSIS MARKET, BY TECHNOLOGY, 2018-2032 (USD THOUSAND)
TABLE 546 ISRAEL SURFACE ANALYSIS MARKET, BY TECHNOLOGY, 2018-2032 (USD THOUSAND)
TABLE 547 ISRAEL MICROSCOPY IN SURFACE ANALYSIS MARKET, BY METHOD, 2018-2032 (USD THOUSAND)
TABLE 548 ISRAEL MICROSCOPY IN SURFACE ANALYSIS MARKET, BY TECHNIQUE, 2018-2032 (USD THOUSAND)
TABLE 549 ISRAEL SURFACE ANALYSIS MARKET, BY TYPE, 2018-2032 (USD THOUSAND)
TABLE 550 ISRAEL SURFACE ANALYSIS MARKET, BY METHOD TYPE, 2018-2032 (USD THOUSAND)
TABLE 551 ISRAEL SURFACE ANALYSIS MARKET, BY EQUIPMENT TYPE, 2018-2032 (USD THOUSAND)
TABLE 552 ISRAEL SCANNING PROBE MICROSCOPES (SPM)/ATOMIC FORCE MICROSCOPES (AFM) IN SURFACE ANALYSIS MARKET, BY OPERATION, 2018-2032 (USD THOUSAND)
TABLE 553 ISRAEL SCANNING PROBE MICROSCOPES (SPM)/ATOMIC FORCE MICROSCOPES (AFM) IN SURFACE ANALYSIS MARKET, BY NOISE LEVEL, 2018-2032 (USD THOUSAND)
TABLE 554 ISRAEL SURFACE ANALYSIS MARKET, BY APPLICATION, 2018-2032 (USD THOUSAND)
TABLE 555 ISRAEL SURFACE ANALYSIS MARKET, BY END USER, 2018-2032 (USD THOUSAND)
TABLE 556 ISRAEL INDUSTRIES IN SURFACE ANALYSIS MARKET, BY TYPE, 2018-2032 (USD THOUSAND)
TABLE 557 ISRAEL INDUSTRIES IN SURFACE ANALYSIS MARKET, BY TECHNOLOGY, 2018-2032 (USD THOUSAND)
TABLE 558 ISRAEL RESEARCH ORGANIZATION IN SURFACE ANALYSIS MARKET, BY TECHNOLOGY, 2018-2032 (USD THOUSAND)
TABLE 559 ISRAEL ACADEMIC INSTITUTES IN SURFACE ANALYSIS MARKET, BY TECHNOLOGY, 2018-2032 (USD THOUSAND)
TABLE 560 REST OF MIDDLE EAST AND AFRICA SURFACE ANALYSIS MARKET, BY TECHNOLOGY, 2018-2032 (USD THOUSAND)
그림 목록
FIGURE 1 GLOBAL SURFACE ANALYSIS MARKET: SEGMENTATION
FIGURE 2 GLOBAL SURFACE ANALYSIS MARKET: DATA TRIANGULATION
FIGURE 3 GLOBAL SURFACE ANALYSIS MARKET: DROC ANALYSIS
FIGURE 4 GLOBAL SURFACE ANALYSIS MARKET: INTERVIEW DEMOGRAPHICS
FIGURE 5 GLOBAL SURFACE ANALYSIS MARKET: DBMR MARKET POSITION GRID
FIGURE 6 GLOBAL SURFACE ANALYSIS MARKET: MULTIVARIATE MODELING
FIGURE 7 GLOBAL SURFACE ANALYSIS MARKET: TECHNOLOGY TIMELINE CURVE
FIGURE 8 GLOBAL SURFACE ANALYSIS MARKET: APPLICATION COVERAGE GRID
FIGURE 9 GLOBAL SURFACE ANALYSIS MARKET: SEGMENTATION
FIGURE 10 SEMICONDUCTOR: GLOBAL SURFACE ANALYSIS MARKET EXECUTIVE SUMMARY
FIGURE 11 FOUR SEGMENTS COMPRISE THE GLOBAL SURFACE ANALYSIS MARKET, BY TECHNOLOGY (2024)
FIGURE 12 STRATEGIC DECISIONS
FIGURE 13 INCREASE IN THE R&D EXPENDITURE IN MEDICAL AND PHARMACEUTICAL COMPANIES THE GLOBAL SURFACE ANALYSIS MARKET DURING THE FORECAST PERIOD OF 2025 TO 2032
FIGURE 14 TECHNOLOGY SEGMENT IS EXPECTED TO ACCOUNT FOR THE LARGEST SHARE OF THE GLOBAL SURFACE ANALYSIS MARKET IN 2025 & 2032
FIGURE 15 NORTH AMERICA IS EXPECTED TO BE THE DOMINANT, AND ASIA-PACIFIC IS THE FASTEST GROWING REGION IN THE GLOBAL SURFACE ANALYSIS MARKET IN THE FORECAST PERIOD OF 2025 TO 2032
FIGURE 16 ASIA-PACIFIC IS THE FASTEST-GROWING REGION FOR THE GLOBAL SURFACE ANALYSIS MARKET IN THE FORECAST PERIOD OF 2025 TO 2032
FIGURE 17 BIGGEST MANUFACTURING ECONOMIES
FIGURE 18 DROC ANALYSIS
FIGURE 19 R&D INVESTMENTS BY INDIAN PHARMA COMPANIES
FIGURE 20 GLOBAL SURFACE ANALYSIS MARKET: BY TECHNOLOGY, 2024
FIGURE 21 GLOBAL SURFACE ANALYSIS MARKET: BY TYPE, 2024
FIGURE 22 GLOBAL SURFACE ANALYSIS MARKET: BY METHOD TYPE, 2024
FIGURE 23 GLOBAL SURFACE ANALYSIS MARKET: BY EQUIPMENT TYPE, 2024
FIGURE 24 GLOBAL SURFACE ANALYSIS MARKET: BY APPLICATION, 2024
FIGURE 25 GLOBAL SURFACE ANALYSIS MARKET: BY END USER, 2024
FIGURE 26 GLOBAL SURFACE ANALYSIS MARKET: SNAPSHOT (2024)
FIGURE 27 GLOBAL SURFACE ANALYSIS MARKET: COMPANY SHARE 2024 (%)
FIGURE 28 NORTH AMERICA SURFACE ANALYSIS MARKET: COMPANY SHARE 2024 (%)
FIGURE 29 EUROPE SURFACE ANALYSIS MARKET: COMPANY SHARE 2024 (%)
FIGURE 30 ASIA-PACIFIC SURFACE ANALYSIS MARKET: COMPANY SHARE 2024 (%)
연구 방법론
데이터 수집 및 기준 연도 분석은 대규모 샘플 크기의 데이터 수집 모듈을 사용하여 수행됩니다. 이 단계에는 다양한 소스와 전략을 통해 시장 정보 또는 관련 데이터를 얻는 것이 포함됩니다. 여기에는 과거에 수집한 모든 데이터를 미리 검토하고 계획하는 것이 포함됩니다. 또한 다양한 정보 소스에서 발견되는 정보 불일치를 검토하는 것도 포함됩니다. 시장 데이터는 시장 통계 및 일관된 모델을 사용하여 분석하고 추정합니다. 또한 시장 점유율 분석 및 주요 추세 분석은 시장 보고서의 주요 성공 요인입니다. 자세한 내용은 분석가에게 전화를 요청하거나 문의 사항을 드롭하세요.
DBMR 연구팀에서 사용하는 주요 연구 방법론은 데이터 마이닝, 시장에 대한 데이터 변수의 영향 분석 및 주요(산업 전문가) 검증을 포함하는 데이터 삼각 측량입니다. 데이터 모델에는 공급업체 포지셔닝 그리드, 시장 타임라인 분석, 시장 개요 및 가이드, 회사 포지셔닝 그리드, 특허 분석, 가격 분석, 회사 시장 점유율 분석, 측정 기준, 글로벌 대 지역 및 공급업체 점유율 분석이 포함됩니다. 연구 방법론에 대해 자세히 알아보려면 문의를 통해 업계 전문가에게 문의하세요.
사용자 정의 가능
Data Bridge Market Research는 고급 형성 연구 분야의 선두 주자입니다. 저희는 기존 및 신규 고객에게 목표에 맞는 데이터와 분석을 제공하는 데 자부심을 느낍니다. 보고서는 추가 국가에 대한 시장 이해(국가 목록 요청), 임상 시험 결과 데이터, 문헌 검토, 재생 시장 및 제품 기반 분석을 포함하도록 사용자 정의할 수 있습니다. 기술 기반 분석에서 시장 포트폴리오 전략에 이르기까지 타겟 경쟁업체의 시장 분석을 분석할 수 있습니다. 귀하가 원하는 형식과 데이터 스타일로 필요한 만큼 많은 경쟁자를 추가할 수 있습니다. 저희 분석가 팀은 또한 원시 엑셀 파일 피벗 테이블(팩트북)로 데이터를 제공하거나 보고서에서 사용 가능한 데이터 세트에서 프레젠테이션을 만드는 데 도움을 줄 수 있습니다.

