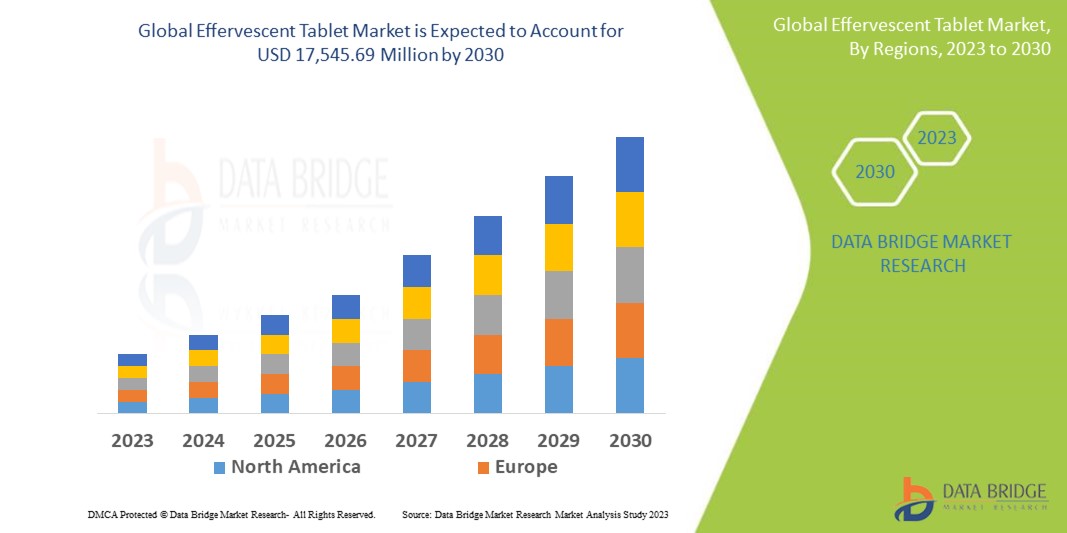
Global Effervescent Tablet Market
시장 규모 (USD 10억)
연평균 성장률 :
% 
 USD
9.78 Billion
USD
19.06 Billion
2023
2031
USD
9.78 Billion
USD
19.06 Billion
2023
2031
| 2024 –2031 | |
| USD 9.78 Billion | |
| USD 19.06 Billion | |
| % | |
글로벌 발포정 시장, 부산물(의약품 및 보충제), 방법(건식법 및 습식 과립화), 유형(처방전 및 일반 의약품), 적응증(이뇨제, 통증 관리, 위장 장애, 호흡기 질환 및 기타), 인구 유형(어린이 및 성인), 응용 분야(치과 제품, 건강 보충제, 제약 및 기타), 최종 사용자(병원, 홈 케어, 전문 클리닉 및 기타), 유통 채널(병원 약국, 온라인 약국 및 소매 약국) - 2031년까지의 산업 동향 및 예측.
발포정 시장 분석 및 규모
발포정 시장은 몇 가지 주요 요인에 의해 주도되어 상당한 성장을 경험하고 있습니다. 주요 동인 중 하나는 발포정이 전통적인 정제나 캡슐에 비해 휴대하기 편리하고 사용하기 쉬운 대안을 제공하기 때문에 편리한 복용 형태에 대한 소비자 선호도가 높아지고 있다는 것입니다. 발포정의 쾌적한 맛과 탄산이 많은 특성은 소비자, 특히 어린이와 노인에게 더 매력적입니다. 시장 성장을 주도하는 또 다른 요인은 건강 보충제와 비타민에 대한 수요 증가입니다. 발포정은 빠르게 용해되고 생체이용률이 높아 이러한 영양소를 제공하는 데 인기가 있습니다. 건강 의식의 증가와 예방 건강 관리에 대한 강조도 발포정에 대한 수요 증가에 기여합니다.
글로벌 발포정 시장 규모는 2023년에 97억 8천만 달러로 평가되었으며, 2031년까지 190억 6천만 달러에 도달할 것으로 예상되며, 2024년에서 2031년까지의 예측 기간 동안 CAGR은 8.7%입니다. Data Bridge Market Research에서 큐레이팅한 시장 보고서에는 시장 가치, 성장률, 세분화, 지리적 범위, 주요 업체와 같은 시장 시나리오에 대한 통찰력 외에도 심층 전문가 분석, 환자 역학, 파이프라인 분석, 가격 분석 및 규제 프레임워크도 포함됩니다.
보고 범위 및 시장 세분화
|
보고서 메트릭 |
세부 |
|
예측 기간 |
2024년부터 2031년까지 |
|
기준 연도 |
2023 |
|
역사적 연도 |
2022 (2016~2021년까지 맞춤 설정 가능) |
|
양적 단위 |
매출은 10억 달러, 볼륨은 단위, 가격은 10억 달러 |
|
다루는 세그먼트 |
제품(의약품 및 보충제), 방법(건식법 및 습식 과립화), 유형(처방전 및 일반 의약품), 적응증(이뇨제, 통증 관리, 위장 장애, 호흡기 질환 및 기타), 인구 유형(어린이 및 성인), 응용 분야(치과 제품, 건강 보충제 , 제약 및 기타), 최종 사용자(병원, 홈 케어, 전문 클리닉 및 기타), 유통 채널(병원 약국, 온라인 약국 및 소매 약국) |
|
적용 국가 |
미국, 캐나다, 멕시코, 독일, 프랑스, 영국, 네덜란드, 스위스, 벨기에, 러시아, 이탈리아, 스페인, 터키, 유럽 기타 지역, 중국, 일본, 인도, 한국, 싱가포르, 말레이시아, 호주, 태국, 인도네시아, 필리핀, 아시아 태평양 기타 지역, 사우디 아라비아, UAE, 남아프리카, 이집트, 이스라엘, 중동 및 아프리카 기타 지역, 브라질, 아르헨티나, 남미 기타 지역 |
|
시장 참여자 포함 |
Pfizer Inc.(미국), GSK plc(영국), Novartis AG(스위스), Bayer AG(독일), Perrigo Company plc(아일랜드), Reckitt Benckiser Group PLC(영국), Bristol-Myers Squibb Company(미국), CHIESI SAS(프랑스), Hermes Pharma(오스트리아), SG Biopharm Pvt. Ltd(인도), Bliss GVS Pharma Limited(인도), SCITECH(인도), Alpex Solar(스위스), Vovantis Laboratories(인도), Herbalife International of America, Inc.(미국), Swisse Wellness PTY LTD(호주), Nuun(미국), Natur Produkt Zdrovit Sp ZOO(폴란드), Vitabiotics Ltd(영국), Amerilab Technologies Inc.(미국), HERMES ARZNEIMITTEL(독일) |
|
시장 기회 |
|
시장 정의
발포정은 물에 빠르게 녹아 이산화탄소 가스를 방출하도록 제형화되었습니다. 이는 탄산 또는 발포성 용액을 생성하며, 종종 약용 또는 건강 보조 식품으로 사용됩니다. 발포정은 일반적으로 비타민 , 미네랄 및 기타 활성 성분을 전달하는 데 사용되며, 맛이 좋고 섭취하기 쉬워 인기가 있습니다.
발포정 시장 동향
운전자
- 편리한 복용 형태에 대한 수요 증가
발포정과 같은 편리한 복용 형태에 대한 수요는 소비자들이 사용하기 쉽고 휴대하기 쉬운 옵션을 추구함에 따라 증가하고 있습니다. 발포정은 물에 녹여 상쾌한 음료로 마실 수 있기 때문에 약물과 보충제를 섭취하는 편리한 방법을 제공합니다. 이러한 사용 편의성으로 인해 발포정은 건강 관리 요구 사항을 충족하는 편리한 솔루션을 찾는 바쁜 개인에게 특히 인기가 있습니다. 또한 발포정의 휴대성은 이동 중에 섭취하기에 이상적이며, 소비자는 물이나 다른 음료가 필요 없이 이동 중에 약물이나 보충제를 편리하게 복용할 수 있습니다. 결과적으로 발포정 시장은 계속 성장할 것으로 예상됩니다.
- 건강 의식 향상
건강과 웰빙에 대한 관심이 커지면서 일반적으로 발포정으로 제공되는 식이 보충제 와 비타민 에 대한 수요가 증가하고 있습니다 . 소비자들은 건강한 라이프스타일을 유지하는 것의 중요성을 더 잘 알고 있으며, 전반적인 웰빙을 개선할 방법을 적극적으로 모색하고 있습니다. 이러한 추세는 특히 나이가 들면서 건강과 활력을 유지할 방법을 찾는 노령 인구 사이에서 두드러집니다. 발포정은 필수 영양소를 제공하는 편리하고 효과적인 방법을 제공하여 건강을 의식하는 소비자들에게 인기를 끌고 있습니다. 또한 발포정의 쾌적한 맛과 탄산이 많은 특성으로 인해 소비자에게 더 매력적이어서 시장에서의 인기를 더욱 높이고 있습니다.
기회
- 도시화 증가
도시화는 라이프스타일과 식단 선택을 변화시키고 있습니다. 개인이 도시 지역으로 이주함에 따라, 그들은 더 빠른 속도의 일상과 높아진 스트레스 수준에 직면하게 되며, 이는 건강과 웰빙에 대한 더 큰 집중을 유도합니다. 발포정은 필수 영양소를 보충하는 빠르고 쉬운 방법을 제공하여 바쁜 일정 속에서도 건강을 유지하려는 도시 거주자에게 매력적인 옵션이 되며, 이는 시장 성장의 기회를 만들어냅니다.
- 노령 인구 확대
발포정은 사용하기 쉽고 소화하기 쉽기 때문에 노인에게 적합합니다. 나이가 들면서 많은 사람들이 알약이나 캡슐을 삼키는 데 어려움을 겪기 때문에 발포정이 더 적합한 옵션입니다. 게다가 발포정은 뼈 건강, 관절 통증, 인지 기능과 같은 노인들이 겪는 일반적인 건강 문제를 해결하도록 제형화할 수 있습니다. 노인 인구가 증가함에 따라 발포정과 같은 사용하기 쉽고 효과적인 복용 형태에 대한 수요가 증가할 것으로 예상됩니다.
제약/도전
- 다른 복용 형태의 경쟁
발포정은 빠른 용해성과 기분 좋은 맛과 같은 독특한 이점을 제공합니다. 전통적인 복용 형태는 시장에서 잘 확립되어 있으며 친숙성과 인지된 효과로 인해 소비자에게 선호되는 경우가 많습니다. 또한 전통적인 정제와 캡슐은 유통기한이 길고 생산 비용 효율성이 높아 제조업체에 더 매력적인 옵션이 될 수 있습니다. 발포정 제조업체는 제품을 차별화하고 소비자에게 고유한 복용 형태의 이점을 확신시키기 위해 지속적으로 혁신해야 합니다. 이러한 정제는 전통적인 정제, 캡슐 및 기타 복용 형태와의 치열한 경쟁에 직면하여 시장 성장을 방해합니다.
- 환경 문제
발포정의 포장 및 생산은 환경 문제에 기여할 수 있으며, 이는 환경을 의식하는 소비자에게 우려를 줄 수 있습니다. 발포정 생산에는 종종 재활용하기 어려운 플라스틱 및 기타 재료를 사용하여 폐기물이 발생합니다. 또한 개별 호일 패킷이나 튜브와 같은 발포정의 포장은 과도한 포장 폐기물을 초래할 수 있습니다. 소비자가 환경 문제에 대해 더 많이 알게 됨에 따라 환경에 미치는 영향이 최소인 제품을 찾을 수 있으며, 이는 발포정에서 벗어나는 방향으로 이어질 수 있으며, 이는 시장에 도전이 될 수 있습니다.
이 시장 보고서는 최근의 새로운 개발, 무역 규정, 수출입 분석, 생산 분석, 가치 사슬 최적화, 시장 점유율, 국내 및 지역 시장 참여자의 영향, 새로운 수익 창출처, 시장 규정의 변화, 전략적 시장 성장 분석, 시장 규모, 범주 시장 성장, 응용 분야 틈새 시장 및 지배력, 제품 승인, 제품 출시, 지리적 확장, 시장의 기술 혁신에 대한 분석 기회를 제공합니다. 발포성 정제 시장에 대한 자세한 정보를 얻으려면 Data Bridge Market Research에 연락하여 분석가 브리핑을 받으세요. 저희 팀은 시장 성장을 달성하기 위한 정보에 입각한 시장 결정을 내리는 데 도움을 드립니다.
최근 개발 사항
- 2023년 7월, 브리스톨 마이어스 스퀴브(NYSE: BMY)는 유럽 의약품 기관(EMA) 인체용 의약품 위원회(CHMP)가 12세 이상의 성인 및 청소년의 완전 절제된 IIB기 또는 IIC기 흑색종의 보조 치료용 단일 요법으로 오디보(니볼루맙)를 승인할 것을 권고했다고 발표했습니다. 승인될 경우 오디보는 두 가지 승인 중 IIB기, IIC기, III기 및 IV기 절제된 흑색종의 보조 치료로 적응증이 있는 유일한 PD-1 억제제가 될 것입니다.
- 2023년 7월, Bayer와 Swiss Tropical and Public Health Institute(Swiss TPH)는 토양 매개 선충류에 감염된 인간을 치료하기 위한 화합물 emodepside를 임상적으로 개발하기 위한 협업을 발표했습니다. 이 협업은 Swiss TPH와 탄자니아의 파트너가 수행한 2상 연구의 유망한 결과에 따른 것입니다. 2023년 5월 18일 New England Journal of Medicine에 발표된 이 연구는 채찍벌레(Trichuris trichiura)와 구충(Ancylostoma duodenale 및 Necator americanus) 감염 환자에서 emodepside의 효능을 입증했습니다.
발포정 시장 범위
시장은 제품, 방법, 유형, 적응증, 응용 프로그램, 인구 유형, 최종 사용자, 유통 채널을 기준으로 세분화됩니다. 이러한 세그먼트 간의 성장은 산업의 빈약한 성장 세그먼트를 분석하고 사용자에게 핵심 시장 응용 프로그램을 식별하기 위한 전략적 결정을 내리는 데 도움이 되는 귀중한 시장 개요와 시장 통찰력을 제공하는 데 도움이 됩니다.
제품
- 약물
- 보충제
행동 양식
- 건조 방법
- 습식 과립화
유형
- 처방
- 카운터 너머
표시
- 이뇨제
- 통증 관리
- 위장 장애
- 호흡기 질환
- 기타
인구 유형
- 어린이들
- 성인
애플리케이션
- 치과 제품
- 식이 보충제
- 제약
- 기타
최종 사용자
- 병원
- 홈케어
- 전문 클리닉
- 기타
유통 채널
- 병원 약국
- 온라인 약국
- 소매 약국
발포정 시장 지역 분석/통찰력
위에 언급된 대로 국가, 제품, 방법, 유형, 적응증, 응용 분야, 인구 유형, 최종 사용자 및 유통 채널별로 시장을 분석하고 시장 규모에 대한 통찰력과 추세를 제공합니다.
시장에서 다루는 국가는 미국, 캐나다, 멕시코, 독일, 프랑스, 영국, 네덜란드, 스위스, 벨기에, 러시아, 이탈리아, 스페인, 터키, 기타 유럽, 중국, 일본, 인도, 한국, 싱가포르, 말레이시아, 호주, 태국, 인도네시아, 필리핀, 기타 아시아 태평양 지역, 사우디 아라비아, UAE, 남아프리카 공화국, 이집트, 이스라엘, 기타 중동 및 아프리카 지역, 브라질, 아르헨티나, 기타 남미 지역입니다.
유럽은 가처분 소득 증가로 인해 시장을 지배할 것으로 예상됩니다. 또한, 이 지역의 의료 인프라 개발과 정부 이니셔티브 증가로 시장 성장이 더욱 가속화될 것으로 예상됩니다.
북미는 연구 개발 활동 증가와 의료 지출 증가로 인해 예측 기간 동안 상당한 성장을 보일 것으로 예상되며, 이는 시장 성장에 기여할 것입니다. 또한, 이 지역의 주요 시장 참여자들은 시장 확장을 더욱 자극할 것입니다.
보고서의 국가 섹션은 또한 개별 시장 영향 요인과 국내 시장의 현재 및 미래 트렌드에 영향을 미치는 규제 변화를 제공합니다. 다운스트림 및 업스트림 가치 사슬 분석, 기술 트렌드 및 포터의 5가지 힘 분석, 사례 연구와 같은 데이터 포인트는 개별 국가의 시장 시나리오를 예측하는 데 사용되는 몇 가지 포인터입니다. 또한 글로벌 브랜드의 존재 및 가용성과 지역 및 국내 브랜드와의 대규모 또는 희소한 경쟁으로 인해 직면한 과제, 국내 관세 및 무역 경로의 영향은 국가 데이터에 대한 예측 분석을 제공하는 동안 고려됩니다.
의료 인프라 성장 설치 기반 및 신기술 침투
발포정 시장은 또한 모든 국가에 대한 자세한 시장 분석을 제공합니다. 자본 장비에 대한 의료 지출 증가, 발포정 시장을 위한 다양한 종류의 제품 설치 기반, 수명선 곡선을 사용한 기술의 영향, 의료 규제 시나리오의 변화 및 발포정 시장에 미치는 영향. 이 데이터는 2011-2021년의 과거 기간에 대해 제공됩니다.
경쟁 환경 및 발포정 시장 점유율 분석
The market competitive landscape provides details by competitor. Details included are company overview, company financials, revenue generated, market potential, investment in research and development, new market initiatives, global presence, production sites and facilities, production capacities, company strengths and weaknesses, product launch, product width and breadth, application dominance. The above data points provided are only related to the companies' focus related to the market.
Some of the major players operating in the market are:
- Pfizer Inc. (U.S.)
- GSK plc (U.K.)
- Novartis AG (Switzerland)
- Bayer AG (Germany)
- Perrigo Company plc (Ireland)
- Reckitt Benckiser Group PLC (U.K.)
- Bristol-Myers Squibb Company (U.S.)
- CHIESI SAS (France)
- Hermes Pharma (Austria)
- S. G. Biopharm Pvt. Ltd (India)
- Bliss GVS Pharma Limited (India)
- Scitech (India)
- Alpex Solar (Switzerland)
- Vovantis Laboratories (India)
- Herbalife International of America, Inc. (U.S.)
- Swisse Wellness PTY LTD (Australia)
- Nuun (U.S.
- Natur Produkt Zdrovit Sp Z O O (Poland)
- Vitabiotics Ltd (U.K.)
- Amerilab Technologies Inc. (U.S.)
- HERMES ARZNEIMITTEL (Germany)
SKU-
세계 최초의 시장 정보 클라우드 보고서에 온라인으로 접속하세요
- 대화형 데이터 분석 대시보드
- 높은 성장 잠재력 기회를 위한 회사 분석 대시보드
- 사용자 정의 및 질의를 위한 리서치 분석가 액세스
- 대화형 대시보드를 통한 경쟁자 분석
- 최신 뉴스, 업데이트 및 추세 분석
- 포괄적인 경쟁자 추적을 위한 벤치마크 분석의 힘 활용
목차
- introduction
- OBJECTIVES OF THE STUDY
- MARKET DEFINITION
- OVERVIEW of Global Effervescent tablet market
- LIMITATIONs
- MARKETS COVERED
- MARKET SEGMENTATION
- MARKETS COVERED
- geographical scope
- years considered for the study
- currency and pricing
- DBMR TRIPOD DATA VALIDATION MODEL
- MULTIVARIATE MODELLING
- Products LIFELINE CURVE
- primary interviews with key opinion leaders
- DBMR MARKET POSITION GRID
- market application coverage grid
- vendor share analysis
- secondary sourcEs
- assumptions
- EXECUTIVE SUMMARY
- premium insights
- global Effervescent tablet market: regulationS
- REGULATIONS IN THE U.S.:
- REGULATIONS IN EUROPE
- REGULATIONS IN AUSTRALIA
- REGULATIONS IN JAPAN
- REGULATIONS IN CHINA
- CONSUMER BEHAVIOUR ANALYSIS- GLOBAL EFFERVESCENT TABLETS
- CONSUMER PREFERENCE OVER ANOTHER FORM OF MEDICATION
- REASON FOR CONSUMERS OPTING FOR EFFERVESCENT TABLET
- Market Overview
- drivers
- rise in chronic diseases
- Growth of R&D in the healthcare industry
- Advantages of effervescent products
- increase in geriatric population with chronic diseases
- RisE IN demand for maintaining a healthier lifestyle
- Restraints
- disadvantages of effervescent tablets
- IncreasE IN number of product recalls for effervescent tablets
- complex production process
- Expensive Product as compare to conventional tablets
- OPPORTUNITIES
- Rise in disposable incomes
- Strategic initiative by key market players
- risE IN demand for effervescent tablet
- CHALLENGES
- shortage of availability of the effervescent products in remote and underdeveloped regions
- Limitation associated with the presence of high sodium content
- IMPACT OF COVID-19 ON GLOBAL EFFERVESCENT TABLET MARKET
- IMPACT ON PRICE
- IMPACT ON DEMAND
- IMPACT ON SUPPLY CHAIN
- STRATEGIC DECISIONS BY MANUFACTURERS
- CONCLUSION
- GLOBAL EFFERVESCENT TABLET MARKET, BY PRODUCTS
- OVERVIEW
- Supplements
- vitamins
- minerals
- medication
- analgesics
- antacids
- GLOBAL EFFERVESCENT TABLET MARKET, BY METHOD
- OVERVIEW
- wet granulation
- fluid bed spray granulation
- organic solvents
- water
- dry method
- GLOBAL EFFERVESCENT TABLET MARKET, BY TYPE
- OVERVIEW
- over the counter
- prescription
- GLOBAL EFFERVESCENT TABLET MARKET, BY INDICATION
- OVERVIEW
- pain management
- gastric disorder
- respiratory diseases
- diuretics
- others
- GLOBAL EFFERVESCENT TABLET MARKET, BY POPULATION TYPE
- OVERVIEW
- adults
- children
- GLOBAL EFFERVESCENT TABLET MARKET, BY APPLICATION
- OVERVIEW
- pharmaceutical
- dietary supplements
- dental Products
- others
- GLOBAL EFFERVESCENT TABLET MARKET, BY END USER
- OVERVIEW
- HOSPITALS
- Specialty clinics
- home healthcare
- others
- GLOBAL EFFERVESCENT TABLET MARKET, BY DISTRIBUTION CHANNEL
- OVERVIEW
- retail pharmacies
- drug stores
- e-commerce
- Hypermarket & Supermarkets
- others
- GLOBAL Effervescent tablet market, by REGION
- overview
- North America
- U.S.
- Canada
- MEXICO
- South America
- Brazil
- Argentina
- PERU
- Rest of South America
- Middle East & Africa
- South Africa
- Saudi Arabia
- U.A.E.
- Egypt
- kuwait
- Israel
- Rest of Middle East and Africa
- ASIA-PACIFIC
- JAPAN
- CHINA
- INDIA
- South Korea
- AUSTRALIA
- Singapore
- Thailand
- Malaysia
- Indonesia
- Philippines
- Vietnam
- Rest of Asia-Pacific
- Europe
- Germany
- Italy
- France
- U.K.
- Spain
- Netherlands
- Russia
- Switzerland
- Turkey
- Austria
- Norway
- HUNGARY
- LITHUANIA
- IRELAND
- POLAND
- Rest of Europe
- Global effervescent tablet market: COMPANY landscape
- company share analysis: Global
- company share analysis: North America
- company share analysis: Europe
- company share analysis: Asia-Pacific
- swot
- company profile
- GLAXOSMITHKLINE PLC
- COMPANY SNAPSHOT
- REVENUE ANALYSIS
- PRODUCT PORTFOLIO
- RECENT DEVELOPMENTS
- BAYER AG
- COMPANY SNAPSHOT
- REVENUE ANALYSIS
- PRODUCT PORTFOLIO
- RECENT DEVELOPMENTS
- RECKITT BENCKISER GROUP PLC
- COMPANY SNAPSHOT
- REVENUE ANALYSIS
- PRODUCT PORTFOLIO
- RECENT DEVELOPMENTS
- PERRIGO COMPANY PLC
- COMPANY SNAPSHOT
- REVENUE ANALYSIS
- PRODUCT PORTFOLIO
- RECENT DEVELOPMENTS
- HERBALIFE INTERNATIONAL OF AMERICA INC
- COMPANY SNAPSHOT
- REVENUE ANALYSIS
- PRODUCT PORTFOLIO
- RECENT DEVELOPMENTS
- SWISSE WELLNESS PTY LTD
- COMPANY SNAPSHOT
- PRODUCT PORTFOLIO
- RECENT DEVELOPMENTS
- ALPEX
- COMPANY SNAPSHOT
- PRODUCT PORTFOLIO
- RECENT DEVELOPMENT
- BLISS GVS PHARMA LIMITED
- COMPANY SNAPSHOT
- REVENUE ANALYSIS
- PRODUCT PORTFOLIO
- RECENT DEVELOPMENTS
- CHIESI SAS
- COMPANY SNAPSHOT
- PRODUCT PORTFOLIO
- RECENT DEVELOPMENTS
- DIETFARM
- COMPANY SNAPSHOT
- PRODUCT PORTFOLIO
- RECENT DEVELOPMENTS
- HERMES ARZNEIMITTEL
- COMPANY SNAPSHOT
- PRODUCT PORTFOLIO
- RECENT DEVELOPMENTS
- NUUN
- COMPANY SNAPSHOT
- PRODUCT PORTFOLIO
- RECENT DEVELOPMENTS
- NATUR PRODUKT ZDROVIT SP. Z O.O.
- COMPANY SNAPSHOT
- PRODUCT PORTFOLIO
- RECENT DEVELOPMENT
- SCITECH
- COMPANY SNAPSHOT
- PRODUCT PORTFOLIO
- RECENT DEVELOPMENTS
- S. G. BIOPHARMA PVT LTD.
- COMPANY SNAPSHOT
- PRODUCT PORTFOLIO
- RECENT DEVELOPMENT
- VITABIOTICS LTD.
- COMPANY SNAPSHOT
- PRODUCT PORTFOLIO
- RECENT DEVELOPMENT
- Vovantis Laboratories
- COMPANY SNAPSHOT
- PRODUCT PORTFOLIO
- RECENT DEVELOPMENT
- questionnaire
- related reports
표 목록
TABLE 1 global effervescent tablet MARKET, By PRODUCTS, 2019-2028 (USD Million)
TABLE 2 global supplements in effervescent tablet Market, By Region, 2019-2028 (USD Million)
TABLE 3 global supplements in effervescent tablet MARKET, By PRODUCTS, 2019-2028 (USD Million)
TABLE 4 global medication in effervescent tablet Market, By Region, 2019-2028 (USD Million)
TABLE 5 global medication in effervescent tablet MARKET, By PRODUCTS, 2019-2028 (USD Million)
TABLE 6 global effervescent tablet MARKET, By METHOD, 2019-2028 (USD Million)
TABLE 7 global wet granulation in effervescent tablet Market, By Region, 2019-2028 (USD Million)
TABLE 8 global wet granulation in effervescent tablet Market, By method, 2019-2028 (USD Million)
TABLE 9 global dry method in effervescent tablet Market, By Region, 2019-2028 (USD Million)
TABLE 10 global effervescent tablet MARKET, By TYPE, 2019-2028 (USD Million)
TABLE 11 global over the counter in effervescent tablet Market, By Region, 2019-2028 (USD Million)
TABLE 12 global prescription in effervescent tablet Market, By Region, 2019-2028 (USD Million)
TABLE 13 global effervescent tablet MARKET, By INDICATION, 2019-2028 (USD Million)
TABLE 14 global pain management in effervescent tablet Market, By Region, 2019-2028 (USD Million)
TABLE 15 global gastric disorder in effervescent tablet Market, By Region, 2019-2028 (USD Million)
TABLE 16 global respiratory diseases in effervescent tablet Market, By Region, 2019-2028 (USD Million)
TABLE 17 global diuretics in effervescent tablet Market, By Region, 2019-2028 (USD Million)
TABLE 18 global others in effervescent tablet Market, By Region, 2019-2028 (USD Million)
TABLE 19 global effervescent tablet MARKET, By POPULATION TYPE, 2019-2028 (USD Million)
TABLE 20 global adults in effervescent tablet Market, By Region, 2019-2028 (USD Million)
TABLE 21 global children in effervescent tablet Market, By Region, 2019-2028 (USD Million)
TABLE 22 global effervescent tablet MARKET, By APPLICATION, 2019-2028 (USD Million)
TABLE 23 global pharmaceutical in effervescent tablet Market, By Region, 2019-2028 (USD Million)
TABLE 24 global dietary supplements in effervescent tablet Market, By Region, 2019-2028 (USD Million)
TABLE 25 global dental productsts in effervescent tablet Market, By Region, 2019-2028 (USD Million)
TABLE 26 global others in effervescent tablet Market, By Region, 2019-2028 (USD Million)
TABLE 27 global effervescent tablet MARKET, By END USER, 2019-2028 (USD Million)
TABLE 28 global HOSPITALS in effervescent tablet Market, By Region, 2019-2028 (USD Million)
TABLE 29 global specialty clinics in effervescent tablet Market, By Region, 2019-2028 (USD Million)
TABLE 30 global home healthcare in effervescent tablet Market, By Region, 2019-2028 (USD Million)
TABLE 31 global others in effervescent tablet Market, By Region, 2019-2028 (USD Million)
TABLE 32 global effervescent tablet MARKET, By DISTRIBUTION CHANNEL, 2019-2028 (USD Million)
TABLE 33 global retail pharmacies in effervescent tablet Market, By Region, 2019-2028 (USD Million)
TABLE 34 global drug store in effervescent tablet Market, By Region, 2019-2028 (USD Million)
TABLE 35 global e-commerce in effervescent tablet Market, By Region, 2019-2028 (USD Million)
TABLE 36 global hypermarket & supermarkets in effervescent tablet Market, By Region, 2019-2028 (USD Million)
TABLE 37 global others in effervescent tablet Market, By Region, 2019-2028 (USD Million)
TABLE 38 GLOBAL Effervescent tablet market, BY REGION, 2019-2028 (USD MILLION)
TABLE 39 North America effervescent tablet market, By country, 2019-2028 (USD Million)
TABLE 40 North America effervescent tablet market, By Products, 2019-2028 (USD Million)
TABLE 41 North America Supplements in effervescent tablet market, By Products, 2019-2028 (USD Million)
TABLE 42 North America Medication in effervescent tablet market, By Products, 2019-2028 (USD Million)
TABLE 43 North America effervescent tablet market, By Method, 2019-2028 (USD Million)
TABLE 44 North America Wet Granulation in effervescent tablet market, By Method, 2019-2028 (USD Million)
TABLE 45 North America effervescent tablet market, By Type, 2019-2028 (USD Million)
TABLE 46 North America effervescent tablet market, By Indication, 2019-2028 (USD Million)
TABLE 47 North America effervescent tablet market, By Population Type, 2019-2028 (USD Million)
TABLE 48 North America effervescent tablet market, By Application, 2019-2028 (USD Million)
TABLE 49 North America effervescent tablet market, By End User, 2019-2028 (USD Million)
TABLE 50 North America effervescent tablet market, By Distribution Channel, 2019-2028 (USD Million)
TABLE 51 U.S. effervescent tablet market, By Products, 2019-2028 (USD Million)
TABLE 52 U.S. Supplements in effervescent tablet market, By Products, 2019-2028 (USD Million)
TABLE 53 U.S. Medication in effervescent tablet market, By Products, 2019-2028 (USD Million)
TABLE 54 U.S. effervescent tablet market, By Method, 2019-2028 (USD Million)
TABLE 55 U.S. Wet Granulation in effervescent tablet market, By Method, 2019-2028 (USD Million)
TABLE 56 U.S. effervescent tablet market, By Type, 2019-2028 (USD Million)
TABLE 57 U.S. effervescent tablet market, By Indication, 2019-2028 (USD Million)
TABLE 58 U.S. effervescent tablet market, By Population Type, 2019-2028 (USD Million)
TABLE 59 U.S. effervescent tablet market, By Application, 2019-2028 (USD Million)
TABLE 60 U.S. effervescent tablet market, By End User, 2019-2028 (USD Million)
TABLE 61 U.S. effervescent tablet market, By Distribution Channel, 2019-2028 (USD Million)
TABLE 62 Canada effervescent tablet market, By Products, 2019-2028 (USD Million)
TABLE 63 Canada Supplements in effervescent tablet market, By Products, 2019-2028 (USD Million)
TABLE 64 Canada Medication in effervescent tablet market, By Products, 2019-2028 (USD Million)
TABLE 65 Canada effervescent tablet market, By Method, 2019-2028 (USD Million)
TABLE 66 Canada Wet Granulation in effervescent tablet market, By Method, 2019-2028 (USD Million)
TABLE 67 Canada effervescent tablet market, By Type, 2019-2028 (USD Million)
TABLE 68 Canada effervescent tablet market, By Indication, 2019-2028 (USD Million)
TABLE 69 Canada effervescent tablet market, By Population Type, 2019-2028 (USD Million)
TABLE 70 Canada effervescent tablet market, By Application, 2019-2028 (USD Million)
TABLE 71 Canada effervescent tablet market, By End User, 2019-2028 (USD Million)
TABLE 72 Canada effervescent tablet market, By Distribution Channel, 2019-2028 (USD Million)
TABLE 73 Mexico effervescent tablet market, By Products, 2019-2028 (USD Million)
TABLE 74 Mexico Supplements in effervescent tablet market, By Products, 2019-2028 (USD Million)
TABLE 75 Mexico Medication in effervescent tablet market, By Products, 2019-2028 (USD Million)
TABLE 76 Mexico effervescent tablet market, By Method, 2019-2028 (USD Million)
TABLE 77 Mexico Wet Granulation in effervescent tablet market, By Method, 2019-2028 (USD Million)
TABLE 78 Mexico effervescent tablet market, By Type, 2019-2028 (USD Million)
TABLE 79 Mexico effervescent tablet market, By Indication, 2019-2028 (USD Million)
TABLE 80 Mexico effervescent tablet market, By Population Type, 2019-2028 (USD Million)
TABLE 81 Mexico effervescent tablet market, By Application, 2019-2028 (USD Million)
TABLE 82 Mexico effervescent tablet market, By End User, 2019-2028 (USD Million)
TABLE 83 Mexico effervescent tablet market, By Distribution Channel, 2019-2028 (USD Million)
TABLE 84 South America effervescent tablet market, By country, 2019-2028 (USD Million)
TABLE 85 South America effervescent tablet market, By Products, 2019-2028 (USD Million)
TABLE 86 South America Supplements in effervescent tablet market, By Products, 2019-2028 (USD Million)
TABLE 87 South America Medication in effervescent tablet market, By Products, 2019-2028 (USD Million)
TABLE 88 South America effervescent tablet market, By Method, 2019-2028 (USD Million)
TABLE 89 South America Wet Granulation in effervescent tablet market, By Method, 2019-2028 (USD Million)
TABLE 90 South America effervescent tablet market, By Type, 2019-2028 (USD Million)
TABLE 91 South America effervescent tablet market, By Indication, 2019-2028 (USD Million)
TABLE 92 South America effervescent tablet market, By Population Type, 2019-2028 (USD Million)
TABLE 93 South America effervescent tablet market, By Application, 2019-2028 (USD Million)
TABLE 94 South America effervescent tablet market, By End User, 2019-2028 (USD Million)
TABLE 95 South America effervescent tablet market, By Distribution Channel, 2019-2028 (USD Million)
TABLE 96 Brazil effervescent tablet market, By Products, 2019-2028 (USD Million)
TABLE 97 Brazil Supplements in effervescent tablet market, By Products, 2019-2028 (USD Million)
TABLE 98 Brazil Medication in effervescent tablet market, By Products, 2019-2028 (USD Million)
TABLE 99 Brazil effervescent tablet market, By Method, 2019-2028 (USD Million)
TABLE 100 Brazil Wet Granulation in effervescent tablet market, By Method, 2019-2028 (USD Million)
TABLE 101 Brazil effervescent tablet market, By Type, 2019-2028 (USD Million)
TABLE 102 Brazil effervescent tablet market, By Indication, 2019-2028 (USD Million)
TABLE 103 Brazil effervescent tablet market, By Population Type, 2019-2028 (USD Million)
TABLE 104 Brazil effervescent tablet market, By Application, 2019-2028 (USD Million)
TABLE 105 Brazil effervescent tablet market, By End User, 2019-2028 (USD Million)
TABLE 106 Brazil effervescent tablet market, By Distribution Channel, 2019-2028 (USD Million)
TABLE 107 Argentina effervescent tablet market, By Products, 2019-2028 (USD Million)
TABLE 108 Argentina Supplements in effervescent tablet market, By Products, 2019-2028 (USD Million)
TABLE 109 Argentina Medication in effervescent tablet market, By Products, 2019-2028 (USD Million)
TABLE 110 Argentina effervescent tablet market, By Method, 2019-2028 (USD Million)
TABLE 111 Argentina Wet Granulation in effervescent tablet market, By Method, 2019-2028 (USD Million)
TABLE 112 Argentina effervescent tablet market, By Type, 2019-2028 (USD Million)
TABLE 113 Argentina effervescent tablet market, By Indication, 2019-2028 (USD Million)
TABLE 114 Argentina effervescent tablet market, By Population Type, 2019-2028 (USD Million)
TABLE 115 Argentina effervescent tablet market, By Application, 2019-2028 (USD Million)
TABLE 116 Argentina effervescent tablet market, By End User, 2019-2028 (USD Million)
TABLE 117 Argentina effervescent tablet market, By Distribution Channel, 2019-2028 (USD Million)
TABLE 118 Peru effervescent tablet market, By Products, 2019-2028 (USD Million)
TABLE 119 Peru Supplements in effervescent tablet market, By Products, 2019-2028 (USD Million)
TABLE 120 Peru Medication in effervescent tablet market, By Products, 2019-2028 (USD Million)
TABLE 121 Peru effervescent tablet market, By Method, 2019-2028 (USD Million)
TABLE 122 Peru Wet Granulation in effervescent tablet market, By Method, 2019-2028 (USD Million)
TABLE 123 Peru effervescent tablet market, By Type, 2019-2028 (USD Million)
TABLE 124 Peru effervescent tablet market, By Indication, 2019-2028 (USD Million)
TABLE 125 Peru effervescent tablet market, By Population Type, 2019-2028 (USD Million)
TABLE 126 Peru effervescent tablet market, By Application, 2019-2028 (USD Million)
TABLE 127 Peru effervescent tablet market, By End User, 2019-2028 (USD Million)
TABLE 128 Peru effervescent tablet market, By Distribution Channel, 2019-2028 (USD Million)
TABLE 129 Rest of South America effervescent tablet market, By Products, 2019-2028 (USD Million)
TABLE 130 Middle East & Africa Effervescent tablet market, By country, 2019-2028 (USD Million)
TABLE 131 Middle East & Africa Effervescent tablet market, By Products, 2019-2028 (USD Million)
TABLE 132 Middle East & Africa Supplements in Effervescent tablet market, By Products, 2019-2028 (USD Million)
TABLE 133 Middle East & Africa Medication in Effervescent tablet market, By Products, 2019-2028 (USD Million)
TABLE 134 Middle East & Africa Effervescent tablet market, By Method, 2019-2028 (USD Million)
TABLE 135 Middle East & Africa Wet Granulation in Effervescent tablet market, By Method, 2019-2028 (USD Million)
TABLE 136 Middle East & Africa Effervescent tablet market, By Type, 2019-2028 (USD Million)
TABLE 137 Middle East & Africa Effervescent tablet market, By Indication, 2019-2028 (USD Million)
TABLE 138 Middle East & Africa Effervescent tablet market, By Population Type, 2019-2028 (USD Million)
TABLE 139 Middle East & Africa Effervescent tablet market, By Application, 2019-2028 (USD Million)
TABLE 140 Middle East & Africa Effervescent tablet market, By End User, 2019-2028 (USD Million)
TABLE 141 Middle East & Africa Effervescent tablet market, By Distribution Channel, 2019-2028 (USD Million)
TABLE 142 South Africa Effervescent tablet market, By Products, 2019-2028 (USD Million)
TABLE 143 South Africa Supplements in Effervescent tablet market, By Products, 2019-2028 (USD Million)
TABLE 144 South Africa Medication in Effervescent tablet market, By Products, 2019-2028 (USD Million)
TABLE 145 South Africa Effervescent tablet market, By Method, 2019-2028 (USD Million)
TABLE 146 South Africa Wet Granulation in Effervescent tablet market, By Method, 2019-2028 (USD Million)
TABLE 147 South Africa Effervescent tablet market, By Type, 2019-2028 (USD Million)
TABLE 148 South Africa Effervescent tablet market, By Indication, 2019-2028 (USD Million)
TABLE 149 South Africa Effervescent tablet market, By Population Type, 2019-2028 (USD Million)
TABLE 150 South Africa Effervescent tablet market, By Application, 2019-2028 (USD Million)
TABLE 151 South Africa Effervescent tablet market, By End User, 2019-2028 (USD Million)
TABLE 152 South Africa Effervescent tablet market, By Distribution Channel, 2019-2028 (USD Million)
TABLE 153 Saudi Arabia Effervescent tablet market, By Products, 2019-2028 (USD Million)
TABLE 154 Saudi Arabia Supplements in Effervescent tablet market, By Products, 2019-2028 (USD Million)
TABLE 155 Saudi Arabia Medication in Effervescent tablet market, By Products, 2019-2028 (USD Million)
TABLE 156 Saudi Arabia Effervescent tablet market, By Method, 2019-2028 (USD Million)
TABLE 157 Saudi Arabia Wet Granulation in Effervescent tablet market, By Method, 2019-2028 (USD Million)
TABLE 158 Saudi Arabia Effervescent tablet market, By Type, 2019-2028 (USD Million)
TABLE 159 Saudi Arabia Effervescent tablet market, By Indication, 2019-2028 (USD Million)
TABLE 160 Saudi Arabia Effervescent tablet market, By Population Type, 2019-2028 (USD Million)
TABLE 161 Saudi Arabia Effervescent tablet market, By Application, 2019-2028 (USD Million)
TABLE 162 Saudi Arabia Effervescent tablet market, By End User, 2019-2028 (USD Million)
TABLE 163 Saudi Arabia Effervescent tablet market, By Distribution Channel, 2019-2028 (USD Million)
TABLE 164 U.A.E. Effervescent tablet market, By Products, 2019-2028 (USD Million)
TABLE 165 U.A.E. Supplements in Effervescent tablet market, By Products, 2019-2028 (USD Million)
TABLE 166 U.A.E. Medication in Effervescent tablet market, By Products, 2019-2028 (USD Million)
TABLE 167 U.A.E. Effervescent tablet market, By Method, 2019-2028 (USD Million)
TABLE 168 U.A.E. Wet Granulation in Effervescent tablet market, By Method, 2019-2028 (USD Million)
TABLE 169 U.A.E. Effervescent tablet market, By Type, 2019-2028 (USD Million)
TABLE 170 U.A.E. Effervescent tablet market, By Indication, 2019-2028 (USD Million)
TABLE 171 U.A.E. Effervescent tablet market, By Population Type, 2019-2028 (USD Million)
TABLE 172 U.A.E. Effervescent tablet market, By Application, 2019-2028 (USD Million)
TABLE 173 U.A.E. Effervescent tablet market, By End User, 2019-2028 (USD Million)
TABLE 174 U.A.E. Effervescent tablet market, By Distribution Channel, 2019-2028 (USD Million)
TABLE 175 EGYPT Effervescent tablet market, By Products, 2019-2028 (USD Million)
TABLE 176 EGYPT Supplements in Effervescent tablet market, By Products, 2019-2028 (USD Million)
TABLE 177 EGYPT Medication in Effervescent tablet market, By Products, 2019-2028 (USD Million)
TABLE 178 EGYPT Effervescent tablet market, By Method, 2019-2028 (USD Million)
TABLE 179 EGYPT Wet Granulation in Effervescent tablet market, By Method, 2019-2028 (USD Million)
TABLE 180 EGYPT Effervescent tablet market, By Type, 2019-2028 (USD Million)
TABLE 181 EGYPT Effervescent tablet market, By Indication, 2019-2028 (USD Million)
TABLE 182 EGYPT Effervescent tablet market, By Population Type, 2019-2028 (USD Million)
TABLE 183 EGYPT Effervescent tablet market, By Application, 2019-2028 (USD Million)
TABLE 184 EGYPT Effervescent tablet market, By End User, 2019-2028 (USD Million)
TABLE 185 EGYPT Effervescent tablet market, By Distribution Channel, 2019-2028 (USD Million)
TABLE 186 Kuwait Effervescent tablet market, By Products, 2019-2028 (USD Million)
TABLE 187 Kuwait Supplements in Effervescent tablet market, By Products, 2019-2028 (USD Million)
TABLE 188 Kuwait Medication in Effervescent tablet market, By Products, 2019-2028 (USD Million)
TABLE 189 Kuwait Effervescent tablet market, By Method, 2019-2028 (USD Million)
TABLE 190 Kuwait Wet Granulation in Effervescent tablet market, By Method, 2019-2028 (USD Million)
TABLE 191 Kuwait Effervescent tablet market, By Type, 2019-2028 (USD Million)
TABLE 192 Kuwait Effervescent tablet market, By Indication, 2019-2028 (USD Million)
TABLE 193 Kuwait Effervescent tablet market, By Population Type, 2019-2028 (USD Million)
TABLE 194 Kuwait Effervescent tablet market, By Application, 2019-2028 (USD Million)
TABLE 195 Kuwait Effervescent tablet market, By End User, 2019-2028 (USD Million)
TABLE 196 Kuwait Effervescent tablet market, By Distribution Channel, 2019-2028 (USD Million)
TABLE 197 Israel Effervescent tablet market, By Products, 2019-2028 (USD Million)
TABLE 198 Israel Supplements in Effervescent tablet market, By Products, 2019-2028 (USD Million)
TABLE 199 Israel Medication in Effervescent tablet market, By Products, 2019-2028 (USD Million)
TABLE 200 Israel Effervescent tablet market, By Method, 2019-2028 (USD Million)
TABLE 201 Israel Wet Granulation in Effervescent tablet market, By Method, 2019-2028 (USD Million)
TABLE 202 Israel Effervescent tablet market, By Type, 2019-2028 (USD Million)
TABLE 203 Israel Effervescent tablet market, By Indication, 2019-2028 (USD Million)
TABLE 204 Israel Effervescent tablet market, By Population Type, 2019-2028 (USD Million)
TABLE 205 Israel Effervescent tablet market, By Application, 2019-2028 (USD Million)
TABLE 206 Israel Effervescent tablet market, By End User, 2019-2028 (USD Million)
TABLE 207 Israel Effervescent tablet market, By Distribution Channel, 2019-2028 (USD Million)
TABLE 208 Rest of Middle East & Africa Effervescent tablet market, By Products, 2019-2028 (USD Million)
TABLE 209 Asia-Pacific Effervescent tablet market, By country, 2019-2028 (USD Million)
TABLE 210 Asia-Pacific Effervescent tablet market, By Products, 2019-2028 (USD Million)
TABLE 211 Asia-Pacific Supplements in Effervescent tablet market, By Products, 2019-2028 (USD Million)
TABLE 212 Asia-Pacific Medication in Effervescent tablet market, By Products, 2019-2028 (USD Million)
TABLE 213 Asia-Pacific Effervescent tablet market, By Method, 2019-2028 (USD Million)
TABLE 214 Asia-Pacific Wet Granulation in Effervescent tablet market, By Method, 2019-2028 (USD Million)
TABLE 215 Asia-Pacific Effervescent tablet market, By Type, 2019-2028 (USD Million)
TABLE 216 Asia-Pacific Effervescent tablet market, By Indication, 2019-2028 (USD Million)
TABLE 217 Asia-Pacific Effervescent tablet market, By Population Type, 2019-2028 (USD Million)
TABLE 218 Asia-Pacific Effervescent tablet market, By Application, 2019-2028 (USD Million)
TABLE 219 Asia-Pacific Effervescent tablet market, By End User, 2019-2028 (USD Million)
TABLE 220 Asia-Pacific Effervescent tablet market, By Distribution Channel, 2019-2028 (USD Million)
TABLE 221 Japan Effervescent tablet market, By Products, 2019-2028 (USD Million)
TABLE 222 Japan Supplements in Effervescent tablet market, By Products, 2019-2028 (USD Million)
TABLE 223 Japan Medication in Effervescent tablet market, By Products, 2019-2028 (USD Million)
TABLE 224 Japan Effervescent tablet market, By Method, 2019-2028 (USD Million)
TABLE 225 Japan Wet Granulation in Effervescent tablet market, By Method, 2019-2028 (USD Million)
TABLE 226 Japan Effervescent tablet market, By Type, 2019-2028 (USD Million)
TABLE 227 Japan Effervescent tablet market, By Indication, 2019-2028 (USD Million)
TABLE 228 Japan Effervescent tablet market, By Population Type, 2019-2028 (USD Million)
TABLE 229 Japan Effervescent tablet market, By Application, 2019-2028 (USD Million)
TABLE 230 Japan Effervescent tablet market, By End User, 2019-2028 (USD Million)
TABLE 231 Japan Effervescent tablet market, By Distribution Channel, 2019-2028 (USD Million)
TABLE 232 China Effervescent tablet market, By Products, 2019-2028 (USD Million)
TABLE 233 China Supplements in Effervescent tablet market, By Products, 2019-2028 (USD Million)
TABLE 234 China Medication in Effervescent tablet market, By Products, 2019-2028 (USD Million)
TABLE 235 China Effervescent tablet market, By Method, 2019-2028 (USD Million)
TABLE 236 China Wet Granulation in Effervescent tablet market, By Method, 2019-2028 (USD Million)
TABLE 237 China Effervescent tablet market, By Type, 2019-2028 (USD Million)
TABLE 238 China Effervescent tablet market, By Indication, 2019-2028 (USD Million)
TABLE 239 China Effervescent tablet market, By Population Type, 2019-2028 (USD Million)
TABLE 240 China Effervescent tablet market, By Application, 2019-2028 (USD Million)
TABLE 241 China Effervescent tablet market, By End User, 2019-2028 (USD Million)
TABLE 242 China Effervescent tablet market, By Distribution Channel, 2019-2028 (USD Million)
TABLE 243 India Effervescent tablet market, By Products, 2019-2028 (USD Million)
TABLE 244 India Supplements in Effervescent tablet market, By Products, 2019-2028 (USD Million)
TABLE 245 India Medication in Effervescent tablet market, By Products, 2019-2028 (USD Million)
TABLE 246 India Effervescent tablet market, By Method, 2019-2028 (USD Million)
TABLE 247 India Wet Granulation in Effervescent tablet market, By Method, 2019-2028 (USD Million)
TABLE 248 India Effervescent tablet market, By Type, 2019-2028 (USD Million)
TABLE 249 India Effervescent tablet market, By Indication, 2019-2028 (USD Million)
TABLE 250 India Effervescent tablet market, By Population Type, 2019-2028 (USD Million)
TABLE 251 India Effervescent tablet market, By Application, 2019-2028 (USD Million)
TABLE 252 India Effervescent tablet market, By End User, 2019-2028 (USD Million)
TABLE 253 India Effervescent tablet market, By Distribution Channel, 2019-2028 (USD Million)
TABLE 254 SOUTH KOREA Effervescent tablet market, By Products, 2019-2028 (USD Million)
TABLE 255 SOUTH KOREA Supplements in Effervescent tablet market, By Products, 2019-2028 (USD Million)
TABLE 256 SOUTH KOREA Medication in Effervescent tablet market, By Products, 2019-2028 (USD Million)
TABLE 257 SOUTH KOREA Effervescent tablet market, By Method, 2019-2028 (USD Million)
TABLE 258 SOUTH KOREA Wet Granulation in Effervescent tablet market, By Method, 2019-2028 (USD Million)
TABLE 259 SOUTH KOREA Effervescent tablet market, By Type, 2019-2028 (USD Million)
TABLE 260 SOUTH KOREA Effervescent tablet market, By Indication, 2019-2028 (USD Million)
TABLE 261 SOUTH KOREA Effervescent tablet market, By Population Type, 2019-2028 (USD Million)
TABLE 262 SOUTH KOREA Effervescent tablet market, By Application, 2019-2028 (USD Million)
TABLE 263 SOUTH KOREA Effervescent tablet market, By End User, 2019-2028 (USD Million)
TABLE 264 SOUTH KOREA Effervescent tablet market, By Distribution Channel, 2019-2028 (USD Million)
TABLE 265 Australia Effervescent tablet market, By Products, 2019-2028 (USD Million)
TABLE 266 Australia Supplements in Effervescent tablet market, By Products, 2019-2028 (USD Million)
TABLE 267 Australia Medication in Effervescent tablet market, By Products, 2019-2028 (USD Million)
TABLE 268 Australia Effervescent tablet market, By Method, 2019-2028 (USD Million)
TABLE 269 Australia Wet Granulation in Effervescent tablet market, By Method, 2019-2028 (USD Million)
TABLE 270 Australia Effervescent tablet market, By Type, 2019-2028 (USD Million)
TABLE 271 Australia Effervescent tablet market, By Indication, 2019-2028 (USD Million)
TABLE 272 Australia Effervescent tablet market, By Population Type, 2019-2028 (USD Million)
TABLE 273 Australia Effervescent tablet market, By Application, 2019-2028 (USD Million)
TABLE 274 Australia Effervescent tablet market, By End User, 2019-2028 (USD Million)
TABLE 275 Australia Effervescent tablet market, By Distribution Channel, 2019-2028 (USD Million)
TABLE 276 Singapore Effervescent tablet market, By Products, 2019-2028 (USD Million)
TABLE 277 Singapore Supplements in Effervescent tablet market, By Products, 2019-2028 (USD Million)
TABLE 278 Singapore Medication in Effervescent tablet market, By Products, 2019-2028 (USD Million)
TABLE 279 Singapore Effervescent tablet market, By Method, 2019-2028 (USD Million)
TABLE 280 Singapore Wet Granulation in Effervescent tablet market, By Method, 2019-2028 (USD Million)
TABLE 281 Singapore Effervescent tablet market, By Type, 2019-2028 (USD Million)
TABLE 282 Singapore Effervescent tablet market, By Indication, 2019-2028 (USD Million)
TABLE 283 Singapore Effervescent tablet market, By Population Type, 2019-2028 (USD Million)
TABLE 284 Singapore Effervescent tablet market, By Application, 2019-2028 (USD Million)
TABLE 285 Singapore Effervescent tablet market, By End User, 2019-2028 (USD Million)
TABLE 286 Singapore Effervescent tablet market, By Distribution Channel, 2019-2028 (USD Million)
TABLE 287 Thailand Effervescent tablet market, By Products, 2019-2028 (USD Million)
TABLE 288 Thailand Supplements in Effervescent tablet market, By Products, 2019-2028 (USD Million)
TABLE 289 Thailand Medication in Effervescent tablet market, By Products, 2019-2028 (USD Million)
TABLE 290 Thailand Effervescent tablet market, By Method, 2019-2028 (USD Million)
TABLE 291 Thailand Wet Granulation in Effervescent tablet market, By Method, 2019-2028 (USD Million)
TABLE 292 Thailand Effervescent tablet market, By Type, 2019-2028 (USD Million)
TABLE 293 Thailand Effervescent tablet market, By Indication, 2019-2028 (USD Million)
TABLE 294 Thailand Effervescent tablet market, By Population Type, 2019-2028 (USD Million)
TABLE 295 Thailand Effervescent tablet market, By Application, 2019-2028 (USD Million)
TABLE 296 Thailand Effervescent tablet market, By End User, 2019-2028 (USD Million)
TABLE 297 Thailand Effervescent tablet market, By Distribution Channel, 2019-2028 (USD Million)
TABLE 298 Malaysia Effervescent tablet market, By Products, 2019-2028 (USD Million)
TABLE 299 Malaysia Supplements in Effervescent tablet market, By Products, 2019-2028 (USD Million)
TABLE 300 Malaysia Medication in Effervescent tablet market, By Products, 2019-2028 (USD Million)
TABLE 301 Malaysia Effervescent tablet market, By Method, 2019-2028 (USD Million)
TABLE 302 Malaysia Wet Granulation in Effervescent tablet market, By Method, 2019-2028 (USD Million)
TABLE 303 Malaysia Effervescent tablet market, By Type, 2019-2028 (USD Million)
TABLE 304 Malaysia Effervescent tablet market, By Indication, 2019-2028 (USD Million)
TABLE 305 Malaysia Effervescent tablet market, By Population Type, 2019-2028 (USD Million)
TABLE 306 Malaysia Effervescent tablet market, By Application, 2019-2028 (USD Million)
TABLE 307 Malaysia Effervescent tablet market, By End User, 2019-2028 (USD Million)
TABLE 308 Malaysia Effervescent tablet market, By Distribution Channel, 2019-2028 (USD Million)
TABLE 309 Indonesia Effervescent tablet market, By Products, 2019-2028 (USD Million)
TABLE 310 Indonesia Supplements in Effervescent tablet market, By Products, 2019-2028 (USD Million)
TABLE 311 Indonesia Medication in Effervescent tablet market, By Products, 2019-2028 (USD Million)
TABLE 312 Indonesia Effervescent tablet market, By Method, 2019-2028 (USD Million)
TABLE 313 Indonesia Wet Granulation in Effervescent tablet market, By Method, 2019-2028 (USD Million)
TABLE 314 Indonesia Effervescent tablet market, By Type, 2019-2028 (USD Million)
TABLE 315 Indonesia Effervescent tablet market, By Indication, 2019-2028 (USD Million)
TABLE 316 Indonesia Effervescent tablet market, By Population Type, 2019-2028 (USD Million)
TABLE 317 Indonesia Effervescent tablet market, By Application, 2019-2028 (USD Million)
TABLE 318 Indonesia Effervescent tablet market, By End User, 2019-2028 (USD Million)
TABLE 319 Indonesia Effervescent tablet market, By Distribution Channel, 2019-2028 (USD Million)
TABLE 320 Philippines Effervescent tablet market, By Products, 2019-2028 (USD Million)
TABLE 321 Philippines Supplements in Effervescent tablet market, By Products, 2019-2028 (USD Million)
TABLE 322 Philippines Medication in Effervescent tablet market, By Products, 2019-2028 (USD Million)
TABLE 323 Philippines Effervescent tablet market, By Method, 2019-2028 (USD Million)
TABLE 324 Philippines Wet Granulation in Effervescent tablet market, By Method, 2019-2028 (USD Million)
TABLE 325 Philippines Effervescent tablet market, By Type, 2019-2028 (USD Million)
TABLE 326 Philippines Effervescent tablet market, By Indication, 2019-2028 (USD Million)
TABLE 327 Philippines Effervescent tablet market, By Population Type, 2019-2028 (USD Million)
TABLE 328 Philippines Effervescent tablet market, By Application, 2019-2028 (USD Million)
TABLE 329 Philippines Effervescent tablet market, By End User, 2019-2028 (USD Million)
TABLE 330 Philippines Effervescent tablet market, By Distribution Channel, 2019-2028 (USD Million)
TABLE 331 Vietnam Effervescent tablet market, By Products, 2019-2028 (USD Million)
TABLE 332 Vietnam Supplements in Effervescent tablet market, By Products, 2019-2028 (USD Million)
TABLE 333 Vietnam Medication in Effervescent tablet market, By Products, 2019-2028 (USD Million)
TABLE 334 Vietnam Effervescent tablet market, By Method, 2019-2028 (USD Million)
TABLE 335 Vietnam Wet Granulation in Effervescent tablet market, By Method, 2019-2028 (USD Million)
TABLE 336 Vietnam Effervescent tablet market, By Type, 2019-2028 (USD Million)
TABLE 337 Vietnam Effervescent tablet market, By Indication, 2019-2028 (USD Million)
TABLE 338 Vietnam Effervescent tablet market, By Population Type, 2019-2028 (USD Million)
TABLE 339 Vietnam Effervescent tablet market, By Application, 2019-2028 (USD Million)
TABLE 340 Vietnam Effervescent tablet market, By End User, 2019-2028 (USD Million)
TABLE 341 Vietnam Effervescent tablet market, By Distribution Channel, 2019-2028 (USD Million)
TABLE 342 Rest of Asia-Pacific Effervescent tablet market, By Products, 2019-2028 (USD Million)
TABLE 343 Europe effervescent tablet market, By country, 2019-2028 (USD Million)
TABLE 344 Europe effervescent tablet market, By Products, 2019-2028 (USD Million)
TABLE 345 Europe Supplements in effervescent tablet market, By Products, 2019-2028 (USD Million)
TABLE 346 Europe Medication in effervescent tablet market, By Products, 2019-2028 (USD Million)
TABLE 347 Europe effervescent tablet market, By Methods, 2019-2028 (USD Million)
TABLE 348 Europe Wet Granulation in effervescent tablet market, By Methods, 2019-2028 (USD Million)
TABLE 349 Europe effervescent tablet market, By Type, 2019-2028 (USD Million)
TABLE 350 Europe effervescent tablet market, By Indication, 2019-2028 (USD Million)
TABLE 351 Europe effervescent tablet market, By Population Type, 2019-2028 (USD Million)
TABLE 352 Europe effervescent tablet market, By Application, 2019-2028 (USD Million)
TABLE 353 Europe effervescent tablet market, By End User, 2019-2028 (USD Million)
TABLE 354 Europe effervescent tablet market, By Distribution Channel, 2019-2028 (USD Million)
TABLE 355 Germany effervescent tablet market, By Products, 2019-2028 (USD Million)
TABLE 356 Germany Supplements in effervescent tablet market, By Products, 2019-2028 (USD Million)
TABLE 357 Germany Medication in effervescent tablet market, By Products, 2019-2028 (USD Million)
TABLE 358 Germany effervescent tablet market, By Methods, 2019-2028 (USD Million)
TABLE 359 Germany Wet Granulation in effervescent tablet market, By Methods, 2019-2028 (USD Million)
TABLE 360 Germany effervescent tablet market, By Type, 2019-2028 (USD Million)
TABLE 361 Germany effervescent tablet market, By Indication, 2019-2028 (USD Million)
TABLE 362 Germany effervescent tablet market, By Population Type, 2019-2028 (USD Million)
TABLE 363 Germany effervescent tablet market, By Application, 2019-2028 (USD Million)
TABLE 364 Germany effervescent tablet market, By End User, 2019-2028 (USD Million)
TABLE 365 Germany effervescent tablet market, By Distribution Channel, 2019-2028 (USD Million)
TABLE 366 Italy effervescent tablet market, By Products, 2019-2028 (USD Million)
TABLE 367 Italy Supplements in effervescent tablet market, By Products, 2019-2028 (USD Million)
TABLE 368 Italy Medication in effervescent tablet market, By Products, 2019-2028 (USD Million)
TABLE 369 Italy effervescent tablet market, By Methods, 2019-2028 (USD Million)
TABLE 370 Italy Wet Granulation in effervescent tablet market, By Methods, 2019-2028 (USD Million)
TABLE 371 Italy effervescent tablet market, By Type, 2019-2028 (USD Million)
TABLE 372 Italy effervescent tablet market, By Indication, 2019-2028 (USD Million)
TABLE 373 Italy effervescent tablet market, By Population Type, 2019-2028 (USD Million)
TABLE 374 Italy effervescent tablet market, By Application, 2019-2028 (USD Million)
TABLE 375 Italy effervescent tablet market, By End User, 2019-2028 (USD Million)
TABLE 376 Italy effervescent tablet market, By Distribution Channel, 2019-2028 (USD Million)
TABLE 377 France effervescent tablet market, By Products, 2019-2028 (USD Million)
TABLE 378 France Supplements in effervescent tablet market, By Products, 2019-2028 (USD Million)
TABLE 379 France Medication in effervescent tablet market, By Products, 2019-2028 (USD Million)
TABLE 380 France effervescent tablet market, By Methods, 2019-2028 (USD Million)
TABLE 381 France Wet Granulation in effervescent tablet market, By Methods, 2019-2028 (USD Million)
TABLE 382 France effervescent tablet market, By Type, 2019-2028 (USD Million)
TABLE 383 France effervescent tablet market, By Indication, 2019-2028 (USD Million)
TABLE 384 France effervescent tablet market, By Population Type, 2019-2028 (USD Million)
TABLE 385 France effervescent tablet market, By Application, 2019-2028 (USD Million)
TABLE 386 France effervescent tablet market, By End User, 2019-2028 (USD Million)
TABLE 387 France effervescent tablet market, By Distribution Channel, 2019-2028 (USD Million)
TABLE 388 U.K. effervescent tablet market, By Products, 2019-2028 (USD Million)
TABLE 389 U.K. Supplements in effervescent tablet market, By Products, 2019-2028 (USD Million)
TABLE 390 U.K. Medication in effervescent tablet market, By Products, 2019-2028 (USD Million)
TABLE 391 U.K. effervescent tablet market, By Methods, 2019-2028 (USD Million)
TABLE 392 U.K. Wet Granulation in effervescent tablet market, By Methods, 2019-2028 (USD Million)
TABLE 393 U.K. effervescent tablet market, By Type, 2019-2028 (USD Million)
TABLE 394 U.K. effervescent tablet market, By Indication, 2019-2028 (USD Million)
TABLE 395 U.K. effervescent tablet market, By Population Type, 2019-2028 (USD Million)
TABLE 396 U.K. effervescent tablet market, By Application, 2019-2028 (USD Million)
TABLE 397 U.K. effervescent tablet market, By End User, 2019-2028 (USD Million)
TABLE 398 U.K. effervescent tablet market, By Distribution Channel, 2019-2028 (USD Million)
TABLE 399 Spain effervescent tablet market, By Products, 2019-2028 (USD Million)
TABLE 400 Spain Supplements in effervescent tablet market, By Products, 2019-2028 (USD Million)
TABLE 401 Spain Medication in effervescent tablet market, By Products, 2019-2028 (USD Million)
TABLE 402 Spain effervescent tablet market, By Methods, 2019-2028 (USD Million)
TABLE 403 Spain Wet Granulation in effervescent tablet market, By Methods, 2019-2028 (USD Million)
TABLE 404 Spain effervescent tablet market, By Type, 2019-2028 (USD Million)
TABLE 405 Spain effervescent tablet market, By Indication, 2019-2028 (USD Million)
TABLE 406 Spain effervescent tablet market, By Population Type, 2019-2028 (USD Million)
TABLE 407 Spain effervescent tablet market, By Application, 2019-2028 (USD Million)
TABLE 408 Spain effervescent tablet market, By End User, 2019-2028 (USD Million)
TABLE 409 Spain effervescent tablet market, By Distribution Channel, 2019-2028 (USD Million)
TABLE 410 Netherlands effervescent tablet market, By Products, 2019-2028 (USD Million)
TABLE 411 Netherlands Supplements in effervescent tablet market, By Products, 2019-2028 (USD Million)
TABLE 412 Netherlands Medication in effervescent tablet market, By Products, 2019-2028 (USD Million)
TABLE 413 Netherlands effervescent tablet market, By Methods, 2019-2028 (USD Million)
TABLE 414 Netherlands Wet Granulation in effervescent tablet market, By Methods, 2019-2028 (USD Million)
TABLE 415 Netherlands effervescent tablet market, By Type, 2019-2028 (USD Million)
TABLE 416 Netherlands effervescent tablet market, By Indication, 2019-2028 (USD Million)
TABLE 417 Netherlands effervescent tablet market, By Population Type, 2019-2028 (USD Million)
TABLE 418 Netherlands effervescent tablet market, By Application, 2019-2028 (USD Million)
TABLE 419 Netherlands effervescent tablet market, By End User, 2019-2028 (USD Million)
TABLE 420 Netherlands effervescent tablet market, By Distribution Channel, 2019-2028 (USD Million)
TABLE 421 Russia effervescent tablet market, By Products, 2019-2028 (USD Million)
TABLE 422 Russia Supplements in effervescent tablet market, By Products, 2019-2028 (USD Million)
TABLE 423 Russia Medication in effervescent tablet market, By Products, 2019-2028 (USD Million)
TABLE 424 Russia effervescent tablet market, By Methods, 2019-2028 (USD Million)
TABLE 425 Russia Wet Granulation in effervescent tablet market, By Methods, 2019-2028 (USD Million)
TABLE 426 Russia effervescent tablet market, By Type, 2019-2028 (USD Million)
TABLE 427 Russia effervescent tablet market, By Indication, 2019-2028 (USD Million)
TABLE 428 Russia effervescent tablet market, By Population Type, 2019-2028 (USD Million)
TABLE 429 Russia effervescent tablet market, By Application, 2019-2028 (USD Million)
TABLE 430 Russia effervescent tablet market, By End User, 2019-2028 (USD Million)
TABLE 431 Russia effervescent tablet market, By Distribution Channel, 2019-2028 (USD Million)
TABLE 432 Switzerland effervescent tablet market, By Products, 2019-2028 (USD Million)
TABLE 433 Switzerland Supplements in effervescent tablet market, By Products, 2019-2028 (USD Million)
TABLE 434 Switzerland Medication in effervescent tablet market, By Products, 2019-2028 (USD Million)
TABLE 435 Switzerland effervescent tablet market, By Methods, 2019-2028 (USD Million)
TABLE 436 Switzerland Wet Granulation in effervescent tablet market, By Methods, 2019-2028 (USD Million)
TABLE 437 Switzerland effervescent tablet market, By Type, 2019-2028 (USD Million)
TABLE 438 Switzerland effervescent tablet market, By Indication, 2019-2028 (USD Million)
TABLE 439 Switzerland effervescent tablet market, By Population Type, 2019-2028 (USD Million)
TABLE 440 Switzerland effervescent tablet market, By Application, 2019-2028 (USD Million)
TABLE 441 Switzerland effervescent tablet market, By End User, 2019-2028 (USD Million)
TABLE 442 Switzerland effervescent tablet market, By Distribution Channel, 2019-2028 (USD Million)
TABLE 443 Turkey effervescent tablet market, By Products, 2019-2028 (USD Million)
TABLE 444 Turkey Supplements in effervescent tablet market, By Products, 2019-2028 (USD Million)
TABLE 445 Turkey Medication in effervescent tablet market, By Products, 2019-2028 (USD Million)
TABLE 446 Turkey effervescent tablet market, By Methods, 2019-2028 (USD Million)
TABLE 447 Turkey Wet Granulation in effervescent tablet market, By Methods, 2019-2028 (USD Million)
TABLE 448 Turkey effervescent tablet market, By Type, 2019-2028 (USD Million)
TABLE 449 Turkey effervescent tablet market, By Indication, 2019-2028 (USD Million)
TABLE 450 Turkey effervescent tablet market, By Population Type, 2019-2028 (USD Million)
TABLE 451 Turkey effervescent tablet market, By Application, 2019-2028 (USD Million)
TABLE 452 Turkey effervescent tablet market, By End User, 2019-2028 (USD Million)
TABLE 453 Turkey effervescent tablet market, By Distribution Channel, 2019-2028 (USD Million)
TABLE 454 Austria effervescent tablet market, By Products, 2019-2028 (USD Million)
TABLE 455 Austria Supplements in effervescent tablet market, By Products, 2019-2028 (USD Million)
TABLE 456 Austria Medication in effervescent tablet market, By Products, 2019-2028 (USD Million)
TABLE 457 Austria effervescent tablet market, By Methods, 2019-2028 (USD Million)
TABLE 458 Austria Wet Granulation in effervescent tablet market, By Methods, 2019-2028 (USD Million)
TABLE 459 Austria effervescent tablet market, By Type, 2019-2028 (USD Million)
TABLE 460 Austria effervescent tablet market, By Indication, 2019-2028 (USD Million)
TABLE 461 Austria effervescent tablet market, By Population Type, 2019-2028 (USD Million)
TABLE 462 Austria effervescent tablet market, By Application, 2019-2028 (USD Million)
TABLE 463 Austria effervescent tablet market, By End User, 2019-2028 (USD Million)
TABLE 464 Austria effervescent tablet market, By Distribution Channel, 2019-2028 (USD Million)
TABLE 465 Norway effervescent tablet market, By Products, 2019-2028 (USD Million)
TABLE 466 Norway Supplements in effervescent tablet market, By Products, 2019-2028 (USD Million)
TABLE 467 Norway Medication in effervescent tablet market, By Products, 2019-2028 (USD Million)
TABLE 468 Norway effervescent tablet market, By Methods, 2019-2028 (USD Million)
TABLE 469 Norway Wet Granulation in effervescent tablet market, By Methods, 2019-2028 (USD Million)
TABLE 470 Norway effervescent tablet market, By Type, 2019-2028 (USD Million)
TABLE 471 Norway effervescent tablet market, By Indication, 2019-2028 (USD Million)
TABLE 472 Norway effervescent tablet market, By Population Type, 2019-2028 (USD Million)
TABLE 473 Norway effervescent tablet market, By Application, 2019-2028 (USD Million)
TABLE 474 Norway effervescent tablet market, By End User, 2019-2028 (USD Million)
TABLE 475 Norway effervescent tablet market, By Distribution Channel, 2019-2028 (USD Million)
TABLE 476 Hungary effervescent tablet market, By Products, 2019-2028 (USD Million)
TABLE 477 Hungary Supplements in effervescent tablet market, By Products, 2019-2028 (USD Million)
TABLE 478 Hungary Medication in effervescent tablet market, By Products, 2019-2028 (USD Million)
TABLE 479 Hungary effervescent tablet market, By Methods, 2019-2028 (USD Million)
TABLE 480 Hungary Wet Granulation in effervescent tablet market, By Methods, 2019-2028 (USD Million)
TABLE 481 Hungary effervescent tablet market, By Type, 2019-2028 (USD Million)
TABLE 482 Hungary effervescent tablet market, By Indication, 2019-2028 (USD Million)
TABLE 483 Hungary effervescent tablet market, By Population Type, 2019-2028 (USD Million)
TABLE 484 Hungary effervescent tablet market, By Application, 2019-2028 (USD Million)
TABLE 485 Hungary effervescent tablet market, By End User, 2019-2028 (USD Million)
TABLE 486 Hungary effervescent tablet market, By Distribution Channel, 2019-2028 (USD Million)
TABLE 487 Lithuania effervescent tablet market, By Products, 2019-2028 (USD Million)
TABLE 488 Lithuania Supplements in effervescent tablet market, By Products, 2019-2028 (USD Million)
TABLE 489 Lithuania Medication in effervescent tablet market, By Products, 2019-2028 (USD Million)
TABLE 490 Lithuania effervescent tablet market, By Methods, 2019-2028 (USD Million)
TABLE 491 Lithuania Wet Granulation in effervescent tablet market, By Methods, 2019-2028 (USD Million)
TABLE 492 Lithuania effervescent tablet market, By Type, 2019-2028 (USD Million)
TABLE 493 Lithuania effervescent tablet market, By Indication, 2019-2028 (USD Million)
TABLE 494 Lithuania effervescent tablet market, By Population Type, 2019-2028 (USD Million)
TABLE 495 Lithuania effervescent tablet market, By Application, 2019-2028 (USD Million)
TABLE 496 Lithuania effervescent tablet market, By End User, 2019-2028 (USD Million)
TABLE 497 Lithuania effervescent tablet market, By Distribution Channel, 2019-2028 (USD Million)
TABLE 498 Ireland effervescent tablet market, By Products, 2019-2028 (USD Million)
TABLE 499 Ireland Supplements in effervescent tablet market, By Products, 2019-2028 (USD Million)
TABLE 500 Ireland Medication in effervescent tablet market, By Products, 2019-2028 (USD Million)
TABLE 501 Ireland effervescent tablet market, By Methods, 2019-2028 (USD Million)
TABLE 502 Ireland Wet Granulation in effervescent tablet market, By Methods, 2019-2028 (USD Million)
TABLE 503 Ireland effervescent tablet market, By Type, 2019-2028 (USD Million)
TABLE 504 Ireland effervescent tablet market, By Indication, 2019-2028 (USD Million)
TABLE 505 Ireland effervescent tablet market, By Population Type, 2019-2028 (USD Million)
TABLE 506 Ireland effervescent tablet market, By Application, 2019-2028 (USD Million)
TABLE 507 Ireland effervescent tablet market, By End User, 2019-2028 (USD Million)
TABLE 508 Ireland effervescent tablet market, By Distribution Channel, 2019-2028 (USD Million)
TABLE 509 Poland effervescent tablet market, By Products, 2019-2028 (USD Million)
TABLE 510 Poland Supplements in effervescent tablet market, By Products, 2019-2028 (USD Million)
TABLE 511 Poland Medication in effervescent tablet market, By Products, 2019-2028 (USD Million)
TABLE 512 Poland effervescent tablet market, By Methods, 2019-2028 (USD Million)
TABLE 513 Poland Wet Granulation in effervescent tablet market, By Methods, 2019-2028 (USD Million)
TABLE 514 Poland effervescent tablet market, By Type, 2019-2028 (USD Million)
TABLE 515 Poland effervescent tablet market, By Indication, 2019-2028 (USD Million)
TABLE 516 Poland effervescent tablet market, By Population Type, 2019-2028 (USD Million)
TABLE 517 Poland effervescent tablet market, By Application, 2019-2028 (USD Million)
TABLE 518 Poland effervescent tablet market, By End User, 2019-2028 (USD Million)
TABLE 519 Poland effervescent tablet market, By Distribution Channel, 2019-2028 (USD Million)
TABLE 520 REST OF Europe effervescent tablet market, By Products, 2019-2028 (USD Million)
그림 목록
FIGURE 1 Global Effervescent tablet market: segmentation
FIGURE 2 Global Effervescent tablet market: data triangulation
FIGURE 3 Global Effervescent tablet market: DROC ANALYSIS
FIGURE 4 Global Effervescent tablet market: global vs REGIONAL MARKET ANALYSIS
FIGURE 5 Global Effervescent tablet market : COMPANY RESEARCH ANALYSIS
FIGURE 6 Global Effervescent tablet market: INTERVIEW DEMOGRAPHICS
FIGURE 7 Global Effervescent tablet market: DBMR MARKET POSITION GRID
FIGURE 8 GLOBAL Effervescent tablet MARKET: MARKET APPLICATION COVERAGE GRID
FIGURE 9 Global Effervescent tablet market: vendor share analysis
FIGURE 10 Global Effervescent tablet market: SEGMENTATION
FIGURE 11 Increase in chronic diseases and R&D activities are expected to drive THE Global Effervescent tablet market IN THE FORECAST PERIOD of 2021 to 2028
FIGURE 12 DIAGNOSIS segment is expected to account for the largest share of the Global Effervescent tablet market in 2021 & 2028
FIGURE 13 NORTH AMERICA is expected to DOMINATE the gLOBAL Effervescent tablet market and ASIA-PACIFIC IS EXPECTED TO GROW WITH THE HIGHEST CAGR IN THE FORECAST PERIOD OF 2021 TO 2028
FIGURE 14 asia-pacific is the fastest growing market for Effervescent tablet manufacturers in the forecast period of 2021 to 2028
FIGURE 15 DRIVERS, RESTRAINTS, OPPORTUNITIES AND CHALLENGEs OF Global EFFERVESCENT TABLET MARKET
FIGURE 16 global effervescent tablet market: BY PRODUCTS, 2020
FIGURE 17 global effervescent tablet market: BY PRODUCTS, 2020-2028 (USD Million)
FIGURE 18 global effervescent tablet market: BY PRODUCTS, CAGR (2021-2028)
FIGURE 19 global effervescent tablet market: BY PRODUCTS, LIFELINE CURVE
FIGURE 20 global effervescent tablet market: BY METHOD, 2020
FIGURE 21 global effervescent tablet market: BY METHOD, 2020-2028 (USD Million)
FIGURE 22 global effervescent tablet market: BY METHOD, CAGR (2021-2028)
FIGURE 23 global effervescent tablet market: BY METHOD, LIFELINE CURVE
FIGURE 24 global effervescent tablet market: BY TYPE, 2020
FIGURE 25 global effervescent tablet market: BY TYPE, 2020-2028 (USD Million)
FIGURE 26 global effervescent tablet market: BY TYPE, CAGR (2021-2028)
FIGURE 27 global effervescent tablet market: BY TYPE, LIFELINE CURVE
FIGURE 28 global effervescent tablet market: BY INDICATION, 2020
FIGURE 29 global effervescent tablet market: BY INDICATION, 2020-2028 (USD Million)
FIGURE 30 global effervescent tablet market: BY INDICATION, CAGR (2021-2028)
FIGURE 31 global effervescent tablet market: BY INDICATION, LIFELINE CURVE
FIGURE 32 global effervescent tablet market: BY POPULATION TYPE, 2020
FIGURE 33 global effervescent tablet market: BY POPULATION TYPE, 2020-2028 (USD Million)
FIGURE 34 global effervescent tablet market: BY POPULATION TYPE, CAGR (2021-2028)
FIGURE 35 global effervescent tablet market: BY POPULATION TYPE, LIFELINE CURVE
FIGURE 36 global effervescent tablet market: BY APPLICATION, 2020
FIGURE 37 global effervescent tablet market: BY APPLICATION, 2020-2028 (USD Million)
FIGURE 38 global effervescent tablet market: BY APPLICATION, CAGR (2021-2028)
FIGURE 39 global effervescent tablet market: BY APPLICATION, LIFELINE CURVE
FIGURE 40 global effervescent tablet market: BY END USER, 2020
FIGURE 41 global effervescent tablet market: BY END USER, 2020-2028 (USD Million)
FIGURE 42 global effervescent tablet market: BY END USER, CAGR (2021-2028)
FIGURE 43 global effervescent tablet market: BY END USER, LIFELINE CURVE
FIGURE 44 global effervescent tablet market: BY DISTRIBUTION CHANNEL, 2020
FIGURE 45 global effervescent tablet market: BY DISTRIBUTION CHANNEL, 2020-2028 (USD Million)
FIGURE 46 global effervescent tablet market: BY DISTRIBUTION CHANNEL, CAGR (2021-2028)
FIGURE 47 global effervescent tablet market: BY DISTRIBUTION CHANNEL, LIFELINE CURVE
FIGURE 48 GLOBAL Effervescent tablet market: SNAPSHOT (2020)
FIGURE 49 GLOBAL Effervescent tablet market: BY REGION (2020)
FIGURE 50 GLOBAL Effervescent tablet market: BY REGION (2021 & 2028)
FIGURE 51 GLOBAL Effervescent tablet market: BY REGION (2020 & 2028)
FIGURE 52 GLOBAL Effervescent tablet market: BY products (2021-2028)
FIGURE 53 NORTH AMERICA effervescent tablet market: SNAPSHOT (2020)
FIGURE 54 NORTH AMERICA EFFERVESCENT TABLET Market: BY COUNTRY (2020)
FIGURE 55 NORTH AMERICA EFFERVESCENT TABLET Market: BY COUNTRY (2021 & 2028)
FIGURE 56 NORTH AMERICA EFFERVESCENT TABLET Market: BY COUNTRY (2020 & 2028)
FIGURE 57 NORTH AMERICA EFFERVESCENT TABLET Market: BY Products (2021-2028)
FIGURE 58 SOUTH AMERICA effervescent tablet market: SNAPSHOT (2020)
FIGURE 59 SOUTH AMERICA EFFERVESCENT TABLET Market: BY COUNTRY (2020)
FIGURE 60 SOUTH AMERICA EFFERVESCENT TABLET Market: BY COUNTRY (2021 & 2028)
FIGURE 61 SOUTH AMERICA EFFERVESCENT TABLET Market: BY COUNTRY (2020 & 2028)
FIGURE 62 SOUTH AMERICA EFFERVESCENT TABLET Market: BY Products (2021-2028)
FIGURE 63 MIDDLE EAST & AFRICA Effervescent tablet market: SNAPSHOT (2020)
FIGURE 64 MIDDLE EAST & AFRICA Effervescent tablet market: BY COUNTRY (2020)
FIGURE 65 MIDDLE EAST & AFRICA Effervescent tablet market: BY COUNTRY (2021 & 2028)
FIGURE 66 MIDDLE EAST & AFRICA Effervescent tablet market: BY COUNTRY (2020 & 2028)
FIGURE 67 MIDDLE EAST & AFRICA Effervescent tablet market: BY Products (2021-2028)
FIGURE 68 ASIA-PACIFIC Effervescent tablet market: SNAPSHOT (2020)
FIGURE 69 ASIA-PACIFIC Effervescent tablet market: BY COUNTRY (2020)
FIGURE 70 ASIA-PACIFIC Effervescent tablet market: BY COUNTRY (2021 & 2028)
FIGURE 71 ASIA-PACIFIC Effervescent tablet market: BY COUNTRY (2020 & 2028)
FIGURE 72 ASIA-PACIFIC Effervescent tablet market: BY Products (2021-2028)
FIGURE 73 EUROPE effervescent tablet market: SNAPSHOT (2020)
FIGURE 74 EUROPE EFFERVESCENT TABLET Market: BY COUNTRY (2020)
FIGURE 75 EUROPE EFFERVESCENT TABLET Market: BY COUNTRY (2021 & 2028)
FIGURE 76 EUROPE EFFERVESCENT TABLET Market: BY COUNTRY (2020 & 2028)
FIGURE 77 EUROPE EFFERVESCENT TABLET Market: BY Products (2021-2028)
FIGURE 78 Global effervescent tablet Market: company share 2020 (%)
FIGURE 79 North America effervescent tablet Market: company share 2020 (%)
FIGURE 80 Europe effervescent tablet Market: company share 2020 (%)
FIGURE 81 Asia-Pacific effervescent tablet Market: company share 2020 (%)
연구 방법론
데이터 수집 및 기준 연도 분석은 대규모 샘플 크기의 데이터 수집 모듈을 사용하여 수행됩니다. 이 단계에는 다양한 소스와 전략을 통해 시장 정보 또는 관련 데이터를 얻는 것이 포함됩니다. 여기에는 과거에 수집한 모든 데이터를 미리 검토하고 계획하는 것이 포함됩니다. 또한 다양한 정보 소스에서 발견되는 정보 불일치를 검토하는 것도 포함됩니다. 시장 데이터는 시장 통계 및 일관된 모델을 사용하여 분석하고 추정합니다. 또한 시장 점유율 분석 및 주요 추세 분석은 시장 보고서의 주요 성공 요인입니다. 자세한 내용은 분석가에게 전화를 요청하거나 문의 사항을 드롭하세요.
DBMR 연구팀에서 사용하는 주요 연구 방법론은 데이터 마이닝, 시장에 대한 데이터 변수의 영향 분석 및 주요(산업 전문가) 검증을 포함하는 데이터 삼각 측량입니다. 데이터 모델에는 공급업체 포지셔닝 그리드, 시장 타임라인 분석, 시장 개요 및 가이드, 회사 포지셔닝 그리드, 특허 분석, 가격 분석, 회사 시장 점유율 분석, 측정 기준, 글로벌 대 지역 및 공급업체 점유율 분석이 포함됩니다. 연구 방법론에 대해 자세히 알아보려면 문의를 통해 업계 전문가에게 문의하세요.
사용자 정의 가능
Data Bridge Market Research는 고급 형성 연구 분야의 선두 주자입니다. 저희는 기존 및 신규 고객에게 목표에 맞는 데이터와 분석을 제공하는 데 자부심을 느낍니다. 보고서는 추가 국가에 대한 시장 이해(국가 목록 요청), 임상 시험 결과 데이터, 문헌 검토, 재생 시장 및 제품 기반 분석을 포함하도록 사용자 정의할 수 있습니다. 기술 기반 분석에서 시장 포트폴리오 전략에 이르기까지 타겟 경쟁업체의 시장 분석을 분석할 수 있습니다. 귀하가 원하는 형식과 데이터 스타일로 필요한 만큼 많은 경쟁자를 추가할 수 있습니다. 저희 분석가 팀은 또한 원시 엑셀 파일 피벗 테이블(팩트북)로 데이터를 제공하거나 보고서에서 사용 가능한 데이터 세트에서 프레젠테이션을 만드는 데 도움을 줄 수 있습니다.