유럽 ​​생물 활성 성분 시장 – 2028년까지의 산업 동향 및 예측

TOC 요청 TOC 요청 분석가에게 문의 분석가에게 문의 지금 구매 지금 구매 구매하기 전에 문의 구매하기 전에 문의 무료 샘플 보고서 무료 샘플 보고서

유럽 ​​생물 활성 성분 시장 – 2028년까지의 산업 동향 및 예측

  • Food & Beverage
  • Published Report
  • Aug 2021
  • Europe
  • 350 Pages
  • 테이블 수: 290
  • 그림 수: 9

유럽 ​​소수성 코팅 시장은 성분 유형(프리바이오틱스, 프로바이오틱스, 아미노산, 펩타이드, 오메가 3 및 구조화된 지질, 식물 화학 물질 및 식물 추출물, 미네랄, 비타민, 섬유질 및 특수 탄수화물, 카로티노이드 및 항산화제 및 기타), 응용 분야(기능성 식품, 건강 보충제, 젤리 보충제, 동물 영양제, 개인 관리 및 기타) 및 출처(식물, 동물 및 미생물), 국가(독일, 영국, 프랑스, ​​이탈리아, 스페인, 네덜란드, 벨기에, 러시아, 터키, 스위스, 덴마크, 스웨덴, 폴란드, 기타 유럽), 산업 동향 및 2028년까지의 예측으로 세분화됩니다.
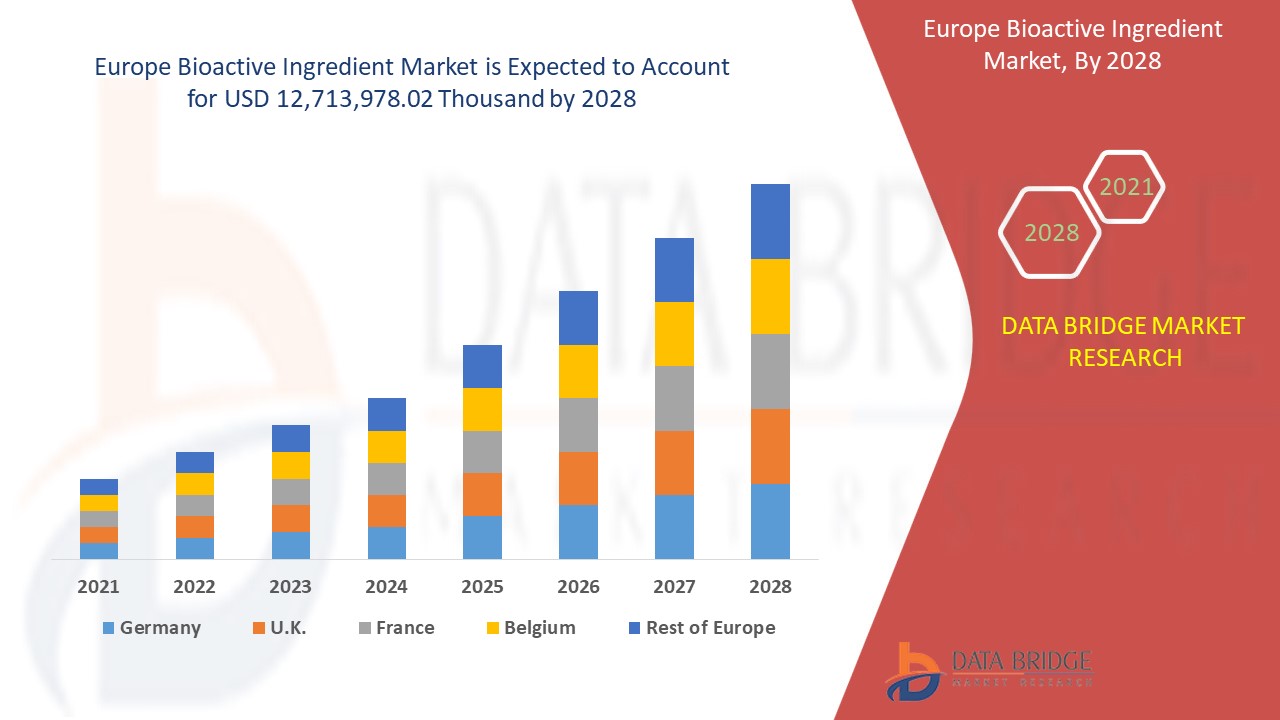
유럽 ​​생물학적 활성 성분 시장시장 분석 및 통찰력: 유럽 생물 활성 성분 시장

유럽 ​​생물학적 활성 성분 시장은 2021년부터 2028년까지의 예측 기간 동안 시장 성장을 이룰 것으로 예상됩니다. Data Bridge Market Research는 시장이 2021년부터 2028년까지의 예측 기간 동안 7.1%의 CAGR로 성장하고 있으며 2028년까지 12,713,978.02천 달러에 도달할 것으로 예상한다고 분석합니다.

생물학적 활성 성분은 생물에 생물학적 효과를 미치는 물질입니다. 이 성분은 식물, 식품, 동물, 바다, 미생물을 포함한 다양한 출처에서 나옵니다. 생물학적 활성 물질은 고객의 신체적, 생리적 건강을 개선하기 위해 식품 및 사료 제품에 첨가됩니다. 기능성 식품 및 음료, 영양 보충제, 신생아 영양은 모두 생물학적 활성 물질을 광범위하게 사용합니다. 이러한 화학 물질은 암, 심장병 및 기타 질병을 예방하는 데 도움이 될 수 있습니다.

생리활성 물질은 식품 및 음료, 의약품 및 건강기능식품, 개인 관리 품목, 동물 사료를 포함한 다양한 분야에서 널리 활용됩니다. 카로티노이드, 에센셜 오일, 항산화제는 기능성 식사에서 감각 및 영양적 품질을 개선하기 위해 사용되는 생리활성 물질의 예입니다. 이들은 식품 및 다양한 유형의 제품에 첨가된 건강한 분자의 대사 과정을 돕는 일종의 생체 분자입니다.

생물학적 활성 성분 시장 보고서는 시장 점유율, 새로운 개발 및 제품 파이프라인 분석, 국내 및 지역 시장 참여자의 영향, 새로운 수익 주머니, 시장 규정의 변화, 제품 승인, 전략적 의사 결정, 제품 출시, 지리적 확장 및 시장의 기술 혁신 측면에서의 분석 기회에 대한 세부 정보를 제공합니다. 분석 및 시장 시나리오를 이해하려면 분석가 브리핑을 위해 저희에게 연락하세요. 저희 팀은 원하는 목표를 달성하기 위한 수익 영향 솔루션을 만드는 데 도움을 드릴 것입니다.
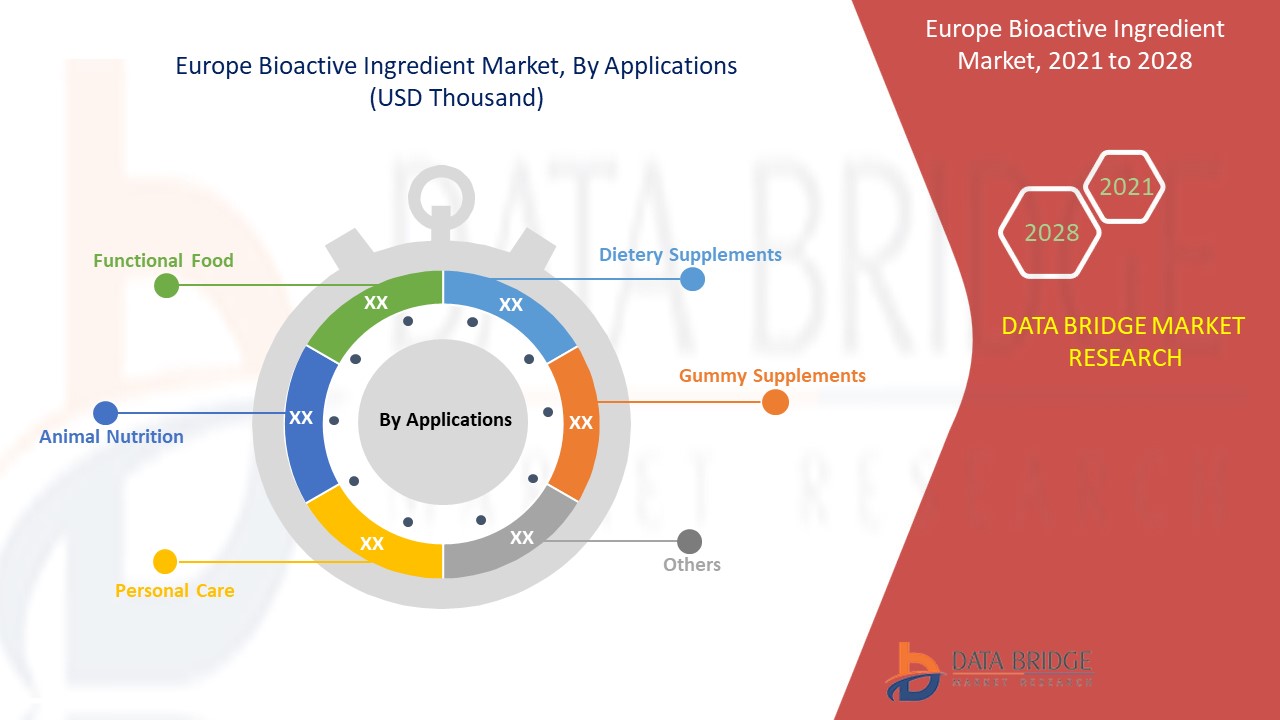
유럽 ​​생물학적 활성 성분 시장유럽 ​​생물학적 활성 성분 시장 범위 및 시장 규모

유럽 ​​생물학적 활성 성분 시장은 성분 유형, 응용 분야 및 출처를 기준으로 하는 세 가지 주목할 만한 세그먼트로 분류됩니다. 세그먼트 간의 성장은 틈새 성장 포켓과 시장에 접근하고 핵심 응용 분야와 타겟 시장의 차이점을 파악하기 위한 전략을 분석하는 데 도움이 됩니다.

  • 성분 유형을 기준으로 글로벌 생물학적 활성 성분 시장은 프리바이오틱, 프로바이오틱, 아미노산 , 펩타이드, 오메가 3 및 구조화된 지질, 식물 화학 물질 및 식물 추출물, 미네랄, 비타민, 섬유질, 특수 탄수화물, 카로티노이드 및 항산화제 및 기타로 세분화됩니다. 프리바이오틱은 프룩탄, 갈락토올리고당, 전분 및 포도당 유래 올리고당, 비탄수화물 올리고당 및 기타로 세분화됩니다. 프로바이오틱은 유산균, 비피도박테리아, 효모로 세분화됩니다. 아미노산은 이소류신, 히스티딘, 류신, 라이신, 메티오닌, 페닐알라닌, 트레오닌, 트립토판, 발린 및 기타로 세분화됩니다. 펩타이드는 디펩타이드, 트리펩타이드, 올리고펩타이드 및 폴리펩타이드로 세분화됩니다. 미네랄은 칼슘 , 인, 마그네슘, 나트륨, 칼륨, 망간, 철, 구리, 요오드, 아연 등 으로 세분화됩니다 . 비타민은 비타민 A, 비타민 C, 비타민 D, 비타민 E, 비타민 K, 비타민 B1, 비타민 B2, 비타민 B3, 비타민 B6, 비타민 B12 등으로 세분화됩니다.
  • 응용 프로그램을 기준으로 글로벌 생물학적 활성 성분 시장은 기능성 식품, 식이 보충제, 젤리 보충제, 동물 영양제, 개인 관리 및 기타로 세분화됩니다. 기능성 식품은 유제품, 유제품 대체품, 빵, 파스타, 시리얼, 계란 제품, 스낵 바, 바 및 음료 로 세분화됩니다. 유제품은 우유, 요구르트, 치즈, 버터 및 기타로 세분화됩니다. 유제품 대체품은 식물성 우유, 식물성 요구르트, 생물학적 활성 성분 및 기타로 세분화됩니다. 바는 단백질 바, 스포츠 영양 바, 요가 바, 운동 전 바, 운동 후 바 및 기타로 세분화됩니다. 음료는 주스와 스무디로 세분화됩니다. 동물 영양은 동물 범주별로 쇠고기, 가금류, 해산물 및 돼지고기로 세분화됩니다. 개인 관리품은 헤어 케어 및 스킨 케어로 세분화됩니다.
  • 글로벌 생리활성 성분 시장은 출처를 기준으로 식물, 동물, 미생물로 구분됩니다.

유럽 ​​생물학적 활성 성분 시장 국가 수준 분석

유럽 ​​생물학적 활성 성분 시장을 분석하고, 성분, 응용 분야, 출처별로 시장 규모 정보를 제공합니다.

유럽 ​​생물학적 활성 성분 시장 보고서에서 다루는 국가는 독일, 영국, 프랑스, ​​이탈리아, 스페인, 네덜란드, 벨기에, 러시아, 터키, 스위스, 폴란드, 덴마크 및 기타 유럽 국가입니다.

유럽 ​​생물학적 활성 성분 시장은 사회의 주요 계층에서 인구 증가와 질병 증가로 인해 시장을 지배하고 있습니다.

보고서의 국가 섹션은 또한 개별 시장 영향 요인과 국내 시장의 현재 및 미래 트렌드에 영향을 미치는 규제 변화를 제공합니다. 신규 판매, 교체 판매, 국가 인구 통계, 규제 조치 및 수출입 관세와 같은 데이터 포인트는 개별 국가의 시장 시나리오를 예측하는 데 사용되는 주요 포인터 중 일부입니다. 또한 브랜드의 존재 및 가용성과 지역 및 국내 브랜드와의 대규모 또는 희소한 경쟁으로 인해 직면한 과제, 판매 채널의 영향이 국가 데이터에 대한 예측 분석을 제공하는 동안 고려됩니다.

생물학적 활성 성분 산업의 성장

유럽 ​​생물학적 활성 성분 시장은 또한 생물학적 활성 성분 시장을 위한 다양한 종류의 제품 설치 기반의 모든 국가에 대한 자세한 시장 분석, 수명선 곡선을 사용한 기술의 영향, 영유아용 조제분유 규제 시나리오의 변화 및 생물학적 활성 성분 시장에 미치는 영향을 제공합니다. 이 데이터는 2010년부터 2019년까지의 과거 기간에 대해 제공됩니다.

경쟁 환경 및 생물학적 활성 성분 시장 점유율 분석

유럽 ​​생물학적 활성 성분 시장 경쟁 구도는 경쟁자별 세부 정보를 제공합니다. 포함된 세부 정보는 회사 개요, 회사 재무, 창출된 수익, 시장 잠재력, 연구 개발 투자, 새로운 시장 이니셔티브, 글로벌 입지, 생산 현장 및 시설, 회사의 강점과 약점, 제품 출시, 임상 시험 파이프라인, 브랜드 분석, 제품 승인, 특허, 제품 폭 및 호흡, 응용 프로그램 우세, 기술 수명선 곡선입니다. 위에 제공된 데이터 포인트는 유럽 생물학적 활성 성분 시장과 관련된 회사의 초점에만 관련이 있습니다.

글로벌 생물학적 활성 성분 시장에 참여하는 주요 시장 주체로는 DSM, BASF SE, Kerry, DuPont, ADM, Global Bio-chem Technology Group Company Limited, Evonik Industries AG, Cargill, Incorporated, Arla Food Ingredients Group P/S(Arla Foods amba의 자회사), FMC Corporation, Sunrise Nutrachem Group, Adisseo(Bluestar Adisseo Co., Ltd.의 자회사), Chr.Hansen Holding A/S, Sabinsa, Ajinomoto Co., Inc, NOVUS INTERNATIONAL(Mitsui & Co. (USA), Inc.의 자회사), Ingredion, Roquette Frères, Probi 및 Advanced Animal Nutrition Pty Ltd. 등이 있습니다.

예를 들어,

  • 2020년 6월, Sabinsa는 면역 체계를 강화하는 데 도움이 되는 새로운 허브 추출물 성분 'Curcumins'를 출시했습니다. 이 제품은 COVID-19 시대에 시장에 새로운 솔루션을 제공하기 위해 구현되었습니다.


SKU-

세계 최초의 시장 정보 클라우드 보고서에 온라인으로 접속하세요

  • 대화형 데이터 분석 대시보드
  • 높은 성장 잠재력 기회를 위한 회사 분석 대시보드
  • 사용자 정의 및 질의를 위한 리서치 분석가 액세스
  • 대화형 대시보드를 통한 경쟁자 분석
  • 최신 뉴스, 업데이트 및 추세 분석
  • 포괄적인 경쟁자 추적을 위한 벤치마크 분석의 힘 활용
데모 요청

목차

  1. introduction
    1. OBJECTIVES OF THE STUDY
    2. MARKET DEFINITION
    3. OVERVIEW of EUROPE BIOACTIVE INGREDIENT MARKET
    4. LIMITATION
    5. MARKETS COVERED
  2. MARKET SEGMENTATION
    1. MARKETS COVERED
    2. geographicAL scope
    3. years considered for the study
    4. currency and pricing
    5. DBMR TRIPOD DATA VALIDATION MODEL
    6. Ingredient LIFE LINE CURVE
    7. MULTIVARIATE MODELING
    8. primary interviews with key opinion leaders
    9. DBMR MARKET POSITION GRID
    10. MARKET application COVERAGE GRID
    11. DBMR MARKET CHALLENGE MATRIX
    12. vendor share analysis
    13. IMPORT-EXPORT DATA
    14. secondary sourcEs
    15. assumptions
  3. EXECUTIVE SUMMARY
  4. premium insights
    1. Factors Influencing Purchasing Decision:
    2. MAJOR BRANDS COMPETITIVE ANALYSIS:
      1. NEW PRODUCT BRAND LAUNCHES AND INNOVATIONS
      2. Investments Made by Top Manufacturers
    3. REGULATORY FRAMEWORK AND GUIDELINES
    4. supply chain analysis
  5. market overview
    1. drivers
      1. Progressive use of bioactive ingredients in personal care products
      2. Growth in the co-prescription of bioactive ingredient along with traditional drugs
      3. Rising demand of bioactive ingredients in functional food
      4. Increasing adoption of bioactive ingredients in pharmaceuticals for chronic diseases
      5. Surge in the incidence of lifestyle diseases and lack of nutrition
    2. RESTRAINTS
      1. Lack of regulatory framework for validating heath claims
      2. Therapeutic constraints allied with bioactive ingredient
      3. Inadequate controls on safety and quality of bioactive ingredients
    3. OPPORTUNITIES
      1. Increasing awareness among consumers with rising preference for prevention instead of cure
      2. ADVANCEMENT IN R&D ASSOCIATED WITH ENCAPSULATION OF BIOACTIVE INGREDIENTS
      3. Growing trust among the consumers towards herbal ingredients and its involvement in bioactive market
    4. Challenges
      1. EXTRACTION OF THE BIOACTIVE COMPOUNDS AND MAINTAINING GOOD RECOVERY
      2. Valorization of fruit and vegetable wastes as bioactive compounds
  6. Analysis on Impact of Covid-19 on ‘Europe Bioactive ingredient Market”
    1. IMPACT ON PRICE
    2. IMPACT ON DEMAND
    3. Impact on supply chain
    4. Conclusion
  7. Europe Bioactive ingredient market, BY Ingredient Type
    1. overview
    2. Peptides
      1. Dipeptides
      2. Tripeptides
      3. Oligopeptides
      4. Polypeptides
    3. Prebiotic
      1. Fructans
      2. Galacto-Oligosaccharides
      3. Starch and Glucose-Derived Oligosaccharides
      4. Non-Carbohydrate Oligosaccharides
      5. Others
    4. Probiotics
      1. Lactobacilli
      2. Bifidobacteria
      3. Yeasts
    5. Minerals
      1. Zinc
      2. Calcium
      3. Phosphorus
      4. Magnesium
      5. Sodium
      6. Potassium
      7. Manganese
      8. Iron
      9. Copper
      10. Iodine
      11. Others
    6. Vitamins
      1. Vitamin A
      2. Vitamin c
      3. Vitamin d
      4. Vitamin E
      5. Vitamin K
      6. Vitamin B1
      7. Vitamin B2
      8. Vitamin B3
      9. Vitamin B6
      10. Vitamin B12
      11. Others
    7. Amino Acid
      1. Isoleucine
      2. Histidine
      3. Leucine
      4. Lysine
      5. Methionine
      6. Phenylalanine
      7. Threonine
      8. Tryptophan
      9. Valine
      10. Others
    8. Omega 3 and Structured Lipi
    9. Phytochemicals & Plant Extracts
    10. Fibers and Specialty Carbohydrates
    11. Carotenoids & Antioxidants
    12. Others
  8. Europe Bioactive ingredient market, BY Applications
    1. overview
    2. Functional Food
      1. Dairy
        1. Milk
        2. Yogurt
        3. Cheese
        4. Butter
        5. Others
    3. Dairy Alternatives
      1. Plant-Based Milk
      2. Plant-Based Yogurt
      3. Bioactive Ingredients
      4. Others
    4. Bread
    5. Cereal
    6. Egg Products
    7. Beverages
      1. Juices
      2. Smoothies
    8. Bars
      1. Protein Bars
      2. Sports Nutrition Bars
      3. Pre Work Out Bars
      4. Post Work Out Bars
      5. Others
    9. Pasta
    10. Snack Bars
    11. Animal Nutrition
      1. ANIMAL NUTRITION, BY ANIMAL CATEGORY
        1. Poultry
        2. Seafood
        3. Beef
        4. Pork
    12. Personal Care
      1. Hair Care
      2. Skin Care
    13. Dietary Supplements
    14. Gummy Supplements
    15. Others
  9. Europe Bioactive ingredient market, BY Source
    1. overview
    2. Plant
    3. Animal
    4. Microbial
  10. EUROPE Bioactive ingredient Market, BY GEOGRAPHY
    1. Europe
      1. Germany
      2. U.K.
      3. France
      4. ITALY
      5. Spain
      6. Netherlands
      7. Belgium
      8. Russia
      9. Turkey
      10. SWItzerland
      11. Denmark
      12. Sweden
      13. Poland
      14. Rest of Europe
  11. EUROPE BIOACTIVE INGREDIENT MARKET: COMPANY landscape
    1. company share analysis: EUROPE
  12. COMPANY PROFILE
    1. dsm
      1. COMPANY SNAPSHOT
      2. REVENUE ANALYSIS
      3. COMPANY SHARE ANALYSIS
      4. PRODUCT PORTFOLIO
      5. RECENT UPDATE
    2. basf se
      1. COMPANY SNAPSHOT
      2. REVENUE ANALYSIS
      3. COMPANY SHARE ANALYSIS
      4. PRODUCT PORTFOLIO
      5. RECENT UPDATES
    3. KERRY
      1. COMPANY SNAPSHOT
      2. REVENUE ANALYSIS
      3. COMPANY SHARE ANALYSIS
      4. PRODUCT PORTFOLIO
      5. RECENT UPDATE
    4. dupont
      1. COMPANY SNAPSHOT
      2. REVENUE ANALYSIS
      3. COMPANY SHARE ANALYSIS
      4. PRODUCT PORTFOLIO
      5. RECENT UPDATES
    5. ADM
      1. COMPANY SNAPSHOT
      2. REVENUE ANALYSIS
      3. COMPANY SHARE ANALYSIS
      4. PRODUCT PORTFOLIO
      5. RECENT UPDATE
    6. EUROPE BIO-CHEM TECHNOLOGY GROUP COMPANY LIMITED
      1. COMPANY SNAPSHOT
      2. REVENUE ANALYSIS
      3. PRODUCT PORTFOLIO
      4. RECENT UPDATE
    7. EVONIK Industries AG
      1. COMPANY SNAPSHOT
      2. REVENUE ANALYSIS
      3. PRODUCT PORTFOLIO
      4. RECENT UPDATE
    8. CARGILL, Incorporated
      1. COMPANY SNAPSHOT
      2. REVENUE ANALYSIS
      3. PRODUCT PORTFOLIO
      4. RECENT UPDATE
    9. Adisseo (A subsidiary of bluestar adisseo co., ltd.)
      1. COMPANY SNAPSHOT
      2. REVENUE ANALYSIS
      3. PRODUCT PORTFOLIO
      4. RECENT UPDATE
    10. Advanced animal nutrition pty ltd.
      1. COMPANY SNAPSHOT
      2. PRODUCT PORTFOLIO
      3. RECENT UPDATE
    11. Ajinomoto Co., Inc.
      1. COMPANY SNAPSHOT
      2. REVENUE ANALYSIS
      3. PRODUCT PORTFOLIO
      4. RECENT UPDATES
    12. Arla Food Ingrediants Group P/S (a subsidiary of Arla foods amba)
      1. COMPANY SNAPSHOT
      2. REVENUE ANALYSIS
      3. PRODUCT PORTFOLIO
      4. RECENT UPDATES
    13. Chr. hansen holding a/s
      1. COMPANY SNAPSHOT
      2. REVENUE ANALYSIS
      3. PRODUCT PORTFOLIO
      4. RECENT UPDATES
    14. FMC CORPORATION
      1. COMPANY SNAPSHOT
      2. REVENUE ANALYSIS
      3. PRODUCT PORTFOLIO
      4. RECENT UPDATE
    15. INGREDION
      1. COMPANY SNAPSHOT
      2. REVENUE ANALYSIS
      3. PRODUCT PORTFOLIO
      4. RECENT UPDATE
    16. novus international (A SUBSIDIARY OF Mitsui & Co. (U.S.A.), Inc.)
      1. COMPANY SNAPSHOT
      2. REVENUE ANALYSIS
      3. PRODUCT PORTFOLIO
      4. RECENT UPDATE
    17. pROBI
      1. COMPANY SNAPSHOT
      2. REVENUE ANALYSIS
      3. SOLUTION PORTFOLIO
      4. RECENT UPDATE
    18. Roquette FrèreS
      1. COMPANY SNAPSHOT
      2. PRODUCT PORTFOLIO
      3. RECENT UPDATE
    19. SabinsA
      1. COMPANY SNAPSHOT
      2. PRODUCT PORTFOLIO
      3. RECENT UPDATES
    20. sunrise nutrachem grouP
      1. COMPANY SNAPSHOT
      2. PRODUCT PORTFOLIO
      3. RECENT UPDATES
  13. QUESTIONNAIRES
  14. related reports

표 목록

TABLE 1 IMPORT DATA of Food preparations, n.e.s.; HS Code - 210690 (USD Thousand)

TABLE 2 EXPORT DATA OF FOOD PREPARATIONS, N.E.S.; HS CODE - 210690 (USD THOUSAND)

TABLE 1 Europe bioactive ingredient market, By Ingredient Type, 2019-2028 (USD Thousand)

TABLE 2 Europe Bioactive ingredient Market, By Ingredient Type, 2019-2028 (Tons)

TABLE 3 Europe Peptides in bioactive ingredient MARKET, BY REGION, 2019-2028 (USD Thousand)

TABLE 4 Europe Peptides in bioactive ingredient MARKET, BY REGION, 2019-2028 (Tons)

TABLE 5 Europe Peptides in Bioactive Ingredient Market, By Ingredient Type, 2019-2028 (USD Thousand)

TABLE 6 Europe prebiotic in bioactive ingredient MARKET, BY REGION, 2019-2028 (USD Thousand)

TABLE 7 Europe prebiotic in bioactive ingredient MARKET, BY REGION, 2019-2028 (Tons)

TABLE 8 Europe Prebiotic in Bioactive Ingredient Market, By Ingredient Type, 2019-2028 (USD Thousand)

TABLE 9 Europe Probiotics in bioactive ingredient MARKET, BY REGION, 2019-2028 (USD Thousand)

TABLE 10 Europe Probiotics in bioactive ingredient MARKET, BY REGION, 2019-2028 (Tons)

TABLE 11 Europe Probiotic in Bioactive Ingredient Market, By Ingredient Type, 2019-2028 (USD Thousand)

TABLE 12 Europe Minerals in bioactive ingredient MARKET, BY REGION, 2019-2028 (USD Thousand)

TABLE 13 Europe Minerals in bioactive ingredient MARKET, BY REGION, 2019-2028 (Tons)

TABLE 14 Europe Minerals in Bioactive Ingredient Market, By Ingredient Type, 2019-2028 (USD Thousand)

TABLE 15 Europe Vitamins in bioactive ingredient MARKET, BY REGION, 2019-2028 (USD Thousand)

TABLE 16 Europe Vitamins in bioactive ingredient MARKET, BY REGION, 2019-2028 (Tons)

TABLE 17 Europe Vitamins in Bioactive Ingredient Market, By Ingredient Type, 2019-2028 (USD Thousand)

TABLE 18 Europe Amino Acid in bioactive ingredient MARKET, BY REGION, 2019-2028 (USD Thousand)

TABLE 19 Europe Amino Acid in bioactive ingredient MARKET, BY REGION, 2019-2028 (Tons)

TABLE 20 Europe AMINO ACID in Bioactive Ingredient Market, By Ingredient Type, 2019-2028 (USD Thousand)

TABLE 21 Europe Omega 3 and Structured Lipi in bioactive ingredient MARKET, BY REGION, 2019-2028 (USD Thousand)

TABLE 22 Europe Omega 3 and Structured Lipi in bioactive ingredient MARKET, BY REGION, 2019-2028 (Tons)

TABLE 23 Europe Phytochemicals & Plant Extracts in bioactive ingredient MARKET, BY REGION, 2019-2028 (USD Thousand)

TABLE 24 Europe Phytochemicals & Plant Extracts in bioactive ingredient MARKET, BY REGION, 2019-2028 (Tons)

TABLE 25 Europe Fibers and Specialty Carbohydrates in bioactive ingredient MARKET, BY REGION, 2019-2028 (USD Thousand)

TABLE 26 Europe Fibers and Specialty Carbohydrates in bioactive ingredient MARKET, BY REGION, 2019-2028 (Tons)

TABLE 27 Europe Carotenoids & Antioxidants in bioactive ingredient MARKET, BY REGION, 2019-2028 (USD Thousand)

TABLE 28 Europe Carotenoids & Antioxidants in bioactive ingredient MARKET, BY REGION, 2019-2028 (Tons)

TABLE 29 Europe Others in bioactive ingredient MARKET, BY REGION, 2019-2028 (USD Thousand)

TABLE 30 Europe Others in bioactive ingredient MARKET, BY REGION, 2019-2028 (Tons)

TABLE 31 Europe bioactive ingredient market, By Applications, 2019-2028 (USD Thousand)

TABLE 32 Europe Functional Food in bioactive ingredient MARKET, BY REGION, 2019-2028 (USD Thousand)

TABLE 33 Europe Functional Food in Bioactive Ingredient Market, By Applications, 2019-2028 (USD Thousand)

TABLE 34 Europe Dairy in Bioactive Ingredient Market, By Applications, 2019-2028 (USD Thousand)

TABLE 35 Europe Dairy alternatives in Bioactive Ingredient Market, By Applications, 2019-2028 (USD Thousand)

TABLE 36 Europe Beverages in Bioactive Ingredient Market, By Applications, 2019-2028 (USD Thousand)

TABLE 37 Europe Bars in Bioactive Ingredient Market, By Applications, 2019-2028 (USD Thousand)

TABLE 38 Europe Animal Nutrition in bioactive ingredient MARKET, BY REGION, 2019-2028 (USD Thousand)

TABLE 39 Europe Animal Nutrition in Bioactive Ingredient Market, By Applications, 2019-2028 (USD Thousand)

TABLE 40 Europe Personal Care in bioactive ingredient MARKET, BY REGION, 2019-2028 (USD Thousand)

TABLE 41 Europe Personal care in Bioactive Ingredient Market, By Applications, 2019-2028 (USD Thousand)

TABLE 42 Europe Dietary Supplements in bioactive ingredient MARKET, BY REGION, 2019-2028 (USD Thousand)

TABLE 43 Europe Gummy Supplements in bioactive ingredient MARKET, BY REGION, 2019-2028 (USD Thousand)

TABLE 44 Europe Others in bioactive ingredient MARKET, BY REGION, 2019-2028 (USD Thousand)

TABLE 45 Europe bioactive ingredient market, By Source, 2019-2028 (USD Thousand)

TABLE 46 Europe Plant in bioactive ingredient MARKET, BY REGION, 2019-2028 (USD Thousand)

TABLE 47 Europe Animal in bioactive ingredient MARKET, BY REGION, 2019-2028 (USD Thousand)

TABLE 48 Europe Microbial in bioactive ingredient MARKET, BY REGION, 2019-2028 (USD Thousand)

TABLE 49 Europe bioactive ingredient Market, BY COUNtry, 2019-2028 (USD Thousand)

TABLE 50 Europe bioactive ingredient Market, BY COUNtry, 2019-2028 (tons)

TABLE 51 Europe Bioactive ingredient Market, By Ingredient Type, 2019-2028 (USD Thousand)

TABLE 52 Europe Bioactive ingredient Market, By Ingredient Type, 2019-2028 (Tons)

TABLE 53 Europe Peptides in Bioactive ingredient Market, By Ingredient Type, 2019-2028 (USD Thousand)

TABLE 54 Europe Prebiotic in Bioactive ingredient Market, By Ingredient Type, 2019-2028 (USD Thousand)

TABLE 55 Europe Probiotic in Bioactive ingredient Market, By Ingredient Type, 2019-2028 (USD Thousand)

TABLE 56 Europe Minerals in Bioactive ingredient Market, By Ingredient Type, 2019-2028 (USD Thousand)

TABLE 57 Europe Vitamins in Bioactive ingredient Market, By Ingredient Type, 2019-2028 (USD Thousand)

TABLE 58 Europe Amino Acid in Bioactive ingredient Market, By Ingredient Type, 2019-2028 (USD Thousand)

TABLE 59 Europe Bioactive ingredient Market, By Applications, 2019-2028 (USD Thousand)

TABLE 60 Europe Functional Food in Bioactive ingredient Market, By Applications, 2019-2028 (USD Thousand)

TABLE 61 Europe Dairy in Bioactive ingredient Market, By Applications, 2019-2028 (USD Thousand)

TABLE 62 Europe Dairy Alternatives in Bioactive ingredient Market, By Applications, 2019-2028 (USD Thousand)

TABLE 63 Europe Beverages in Bioactive ingredient Market, By Applications, 2019-2028 (USD Thousand)

TABLE 64 Europe Bars in Bioactive ingredient Market, By Applications, 2019-2028 (USD Thousand)

TABLE 65 Europe Animal Nutrition in Bioactive ingredient Market, By Applications, 2019-2028 (USD Thousand)

TABLE 66 Europe Personal Care in Bioactive ingredient Market, By Applications, 2019-2028 (USD Thousand)

TABLE 67 Europe Bioactive ingredient Market, By Source, 2019-2028 (USD Thousand)

TABLE 68 GERMANY Bioactive ingredient Market, By Ingredient Type, 2019-2028 (USD Thousand)

TABLE 69 GERMANY Bioactive ingredient Market, By Ingredient Type, 2019-2028 (Tons)

TABLE 70 GERMANY Peptides in Bioactive ingredient Market, By Ingredient Type, 2019-2028 (USD Thousand)

TABLE 71 GERMANY Prebiotic in Bioactive ingredient Market, By Ingredient Type, 2019-2028 (USD Thousand)

TABLE 72 GERMANY Probiotic in Bioactive ingredient Market, By Ingredient Type, 2019-2028 (USD Thousand)

TABLE 73 GERMANY Minerals in Bioactive ingredient Market, By Ingredient Type, 2019-2028 (USD Thousand)

TABLE 74 GERMANY Vitamins in Bioactive ingredient Market, By Ingredient Type, 2019-2028 (USD Thousand)

TABLE 75 GERMANY Amino Acid in Bioactive ingredient Market, By Ingredient Type, 2019-2028 (USD Thousand)

TABLE 76 GERMANY Bioactive ingredient Market, By Applications, 2019-2028 (USD Thousand)

TABLE 77 GERMANY Functional Food in Bioactive ingredient Market, By Applications, 2019-2028 (USD Thousand)

TABLE 78 GERMANY Dairy in Bioactive ingredient Market, By Applications, 2019-2028 (USD Thousand)

TABLE 79 GERMANY Dairy Alternatives in Bioactive ingredient Market, By Applications, 2019-2028 (USD Thousand)

TABLE 80 GERMANY Beverages in Bioactive ingredient Market, By Applications, 2019-2028 (USD Thousand)

TABLE 81 GERMANY Bars in Bioactive ingredient Market, By Applications, 2019-2028 (USD Thousand)

TABLE 82 GERMANY Animal Nutrition in Bioactive ingredient Market, By Applications, 2019-2028 (USD Thousand)

TABLE 83 GERMANY Personal Care in Bioactive ingredient Market, By Applications, 2019-2028 (USD Thousand)

TABLE 84 GERMANY Bioactive ingredient Market, By Source, 2019-2028 (USD Thousand)

TABLE 85 U.K. Bioactive ingredient Market, By Ingredient Type, 2019-2028 (USD Thousand)

TABLE 86 U.K. Bioactive ingredient Market, By Ingredient Type, 2019-2028 (Tons)

TABLE 87 U.K. Peptides in Bioactive ingredient Market, By Ingredient Type, 2019-2028 (USD Thousand)

TABLE 88 U.K. Prebiotic in Bioactive ingredient Market, By Ingredient Type, 2019-2028 (USD Thousand)

TABLE 89 U.K. Probiotic in Bioactive ingredient Market, By Ingredient Type, 2019-2028 (USD Thousand)

TABLE 90 U.K. Minerals in Bioactive ingredient Market, By Ingredient Type, 2019-2028 (USD Thousand)

TABLE 91 U.K. Vitamins in Bioactive ingredient Market, By Ingredient Type, 2019-2028 (USD Thousand)

TABLE 92 U.K. Amino Acid in Bioactive ingredient Market, By Ingredient Type, 2019-2028 (USD Thousand)

TABLE 93 U.K. Bioactive ingredient Market, By Applications, 2019-2028 (USD Thousand)

TABLE 94 U.K. Functional Food in Bioactive ingredient Market, By Applications, 2019-2028 (USD Thousand)

TABLE 95 U.K. Dairy in Bioactive ingredient Market, By Applications, 2019-2028 (USD Thousand)

TABLE 96 U.K. Dairy Alternatives in Bioactive ingredient Market, By Applications, 2019-2028 (USD Thousand)

TABLE 97 U.K. Beverages in Bioactive ingredient Market, By Applications, 2019-2028 (USD Thousand)

TABLE 98 U.K. Bars in Bioactive ingredient Market, By Applications, 2019-2028 (USD Thousand)

TABLE 99 U.K. Animal Nutrition in Bioactive ingredient Market, By Applications, 2019-2028 (USD Thousand)

TABLE 100 U.K. Personal Care in Bioactive ingredient Market, By Applications, 2019-2028 (USD Thousand)

TABLE 101 U.K. Bioactive ingredient Market, By Source, 2019-2028 (USD Thousand)

TABLE 102 FRANCE Bioactive ingredient Market, By Ingredient Type, 2019-2028 (USD Thousand)

TABLE 103 FRANCE Bioactive ingredient Market, By Ingredient Type, 2019-2028 (Tons)

TABLE 104 FRANCE Peptides in Bioactive ingredient Market, By Ingredient Type, 2019-2028 (USD Thousand)

TABLE 105 FRANCE Prebiotic in Bioactive ingredient Market, By Ingredient Type, 2019-2028 (USD Thousand)

TABLE 106 FRANCE Probiotic in Bioactive ingredient Market, By Ingredient Type, 2019-2028 (USD Thousand)

TABLE 107 FRANCE Minerals in Bioactive ingredient Market, By Ingredient Type, 2019-2028 (USD Thousand)

TABLE 108 FRANCE Vitamins in Bioactive ingredient Market, By Ingredient Type, 2019-2028 (USD Thousand)

TABLE 109 FRANCE Amino Acid in Bioactive ingredient Market, By Ingredient Type, 2019-2028 (USD Thousand)

TABLE 110 FRANCE Bioactive ingredient Market, By Applications, 2019-2028 (USD Thousand)

TABLE 111 FRANCE Functional Food in Bioactive ingredient Market, By Applications, 2019-2028 (USD Thousand)

TABLE 112 FRANCE Dairy in Bioactive ingredient Market, By Applications, 2019-2028 (USD Thousand)

TABLE 113 FRANCE Dairy Alternatives in Bioactive ingredient Market, By Applications, 2019-2028 (USD Thousand)

TABLE 114 FRANCE Beverages in Bioactive ingredient Market, By Applications, 2019-2028 (USD Thousand)

TABLE 115 FRANCE Bars in Bioactive ingredient Market, By Applications, 2019-2028 (USD Thousand)

TABLE 116 FRANCE Animal Nutrition in Bioactive ingredient Market, By Applications, 2019-2028 (USD Thousand)

TABLE 117 FRANCE Personal Care in Bioactive ingredient Market, By Applications, 2019-2028 (USD Thousand)

TABLE 118 FRANCE Bioactive ingredient Market, By Source, 2019-2028 (USD Thousand)

TABLE 119 ITALY Bioactive ingredient Market, By Ingredient Type, 2019-2028 (USD Thousand)

TABLE 120 ITALY Bioactive ingredient Market, By Ingredient Type, 2019-2028 (Tons)

TABLE 121 ITALY Peptides in Bioactive ingredient Market, By Ingredient Type, 2019-2028 (USD Thousand)

TABLE 122 ITALY Prebiotic in Bioactive ingredient Market, By Ingredient Type, 2019-2028 (USD Thousand)

TABLE 123 ITALY Probiotic in Bioactive ingredient Market, By Ingredient Type, 2019-2028 (USD Thousand)

TABLE 124 ITALY Minerals in Bioactive ingredient Market, By Ingredient Type, 2019-2028 (USD Thousand)

TABLE 125 ITALY Vitamins in Bioactive ingredient Market, By Ingredient Type, 2019-2028 (USD Thousand)

TABLE 126 ITALY Amino Acid in Bioactive ingredient Market, By Ingredient Type, 2019-2028 (USD Thousand)

TABLE 127 ITALY Bioactive ingredient Market, By Applications, 2019-2028 (USD Thousand)

TABLE 128 ITALY Functional Food in Bioactive ingredient Market, By Applications, 2019-2028 (USD Thousand)

TABLE 129 ITALY Dairy in Bioactive ingredient Market, By Applications, 2019-2028 (USD Thousand)

TABLE 130 ITALY Dairy Alternatives in Bioactive ingredient Market, By Applications, 2019-2028 (USD Thousand)

TABLE 131 ITALY Beverages in Bioactive ingredient Market, By Applications, 2019-2028 (USD Thousand)

TABLE 132 ITALY Bars in Bioactive ingredient Market, By Applications, 2019-2028 (USD Thousand)

TABLE 133 ITALY Animal Nutrition in Bioactive ingredient Market, By Applications, 2019-2028 (USD Thousand)

TABLE 134 ITALY Personal Care in Bioactive ingredient Market, By Applications, 2019-2028 (USD Thousand)

TABLE 135 ITALY Bioactive ingredient Market, By Source, 2019-2028 (USD Thousand)

TABLE 136 SPAIN Bioactive ingredient Market, By Ingredient Type, 2019-2028 (USD Thousand)

TABLE 137 SPAIN Bioactive ingredient Market, By Ingredient Type, 2019-2028 (Tons)

TABLE 138 SPAIN Peptides in Bioactive ingredient Market, By Ingredient Type, 2019-2028 (USD Thousand)

TABLE 139 SPAIN Prebiotic in Bioactive ingredient Market, By Ingredient Type, 2019-2028 (USD Thousand)

TABLE 140 SPAIN Probiotic in Bioactive ingredient Market, By Ingredient Type, 2019-2028 (USD Thousand)

TABLE 141 SPAIN Minerals in Bioactive ingredient Market, By Ingredient Type, 2019-2028 (USD Thousand)

TABLE 142 SPAIN Vitamins in Bioactive ingredient Market, By Ingredient Type, 2019-2028 (USD Thousand)

TABLE 143 SPAIN Amino Acid in Bioactive ingredient Market, By Ingredient Type, 2019-2028 (USD Thousand)

TABLE 144 SPAIN Bioactive ingredient Market, By Applications, 2019-2028 (USD Thousand)

TABLE 145 SPAIN Functional Food in Bioactive ingredient Market, By Applications, 2019-2028 (USD Thousand)

TABLE 146 SPAIN Dairy in Bioactive ingredient Market, By Applications, 2019-2028 (USD Thousand)

TABLE 147 SPAIN Dairy Alternatives in Bioactive ingredient Market, By Applications, 2019-2028 (USD Thousand)

TABLE 148 SPAIN Beverages in Bioactive ingredient Market, By Applications, 2019-2028 (USD Thousand)

TABLE 149 SPAIN Bars in Bioactive ingredient Market, By Applications, 2019-2028 (USD Thousand)

TABLE 150 SPAIN Animal Nutrition in Bioactive ingredient Market, By Applications, 2019-2028 (USD Thousand)

TABLE 151 SPAIN Personal Care in Bioactive ingredient Market, By Applications, 2019-2028 (USD Thousand)

TABLE 152 SPAIN Bioactive ingredient Market, By Source, 2019-2028 (USD Thousand)

TABLE 153 NETHERLANDS Bioactive ingredient Market, By Ingredient Type, 2019-2028 (USD Thousand)

TABLE 154 NETHERLANDS Bioactive ingredient Market, By Ingredient Type, 2019-2028 (Tons)

TABLE 155 NETHERLANDS Peptides in Bioactive ingredient Market, By Ingredient Type, 2019-2028 (USD Thousand)

TABLE 156 NETHERLANDS Prebiotic in Bioactive ingredient Market, By Ingredient Type, 2019-2028 (USD Thousand)

TABLE 157 NETHERLANDS Probiotic in Bioactive ingredient Market, By Ingredient Type, 2019-2028 (USD Thousand)

TABLE 158 NETHERLANDS Minerals in Bioactive ingredient Market, By Ingredient Type, 2019-2028 (USD Thousand)

TABLE 159 NETHERLANDS Vitamins in Bioactive ingredient Market, By Ingredient Type, 2019-2028 (USD Thousand)

TABLE 160 NETHERLANDS Amino Acid in Bioactive ingredient Market, By Ingredient Type, 2019-2028 (USD Thousand)

TABLE 161 NETHERLANDS Bioactive ingredient Market, By Applications, 2019-2028 (USD Thousand)

TABLE 162 NETHERLANDS Functional Food in Bioactive ingredient Market, By Applications, 2019-2028 (USD Thousand)

TABLE 163 NETHERLANDS Dairy in Bioactive ingredient Market, By Applications, 2019-2028 (USD Thousand)

TABLE 164 NETHERLANDS Dairy Alternatives in Bioactive ingredient Market, By Applications, 2019-2028 (USD Thousand)

TABLE 165 NETHERLANDS Beverages in Bioactive ingredient Market, By Applications, 2019-2028 (USD Thousand)

TABLE 166 NETHERLANDS Bars in Bioactive ingredient Market, By Applications, 2019-2028 (USD Thousand)

TABLE 167 NETHERLANDS Animal Nutrition in Bioactive ingredient Market, By Applications, 2019-2028 (USD Thousand)

TABLE 168 NETHERLANDS Personal Care in Bioactive ingredient Market, By Applications, 2019-2028 (USD Thousand)

TABLE 169 NETHERLANDS Bioactive ingredient Market, By Source, 2019-2028 (USD Thousand)

TABLE 170 BELGIUM Bioactive ingredient Market, By Ingredient Type, 2019-2028 (USD Thousand)

TABLE 171 BELGIUM Bioactive ingredient Market, By Ingredient Type, 2019-2028 (Tons)

TABLE 172 BELGIUM Peptides in Bioactive ingredient Market, By Ingredient Type, 2019-2028 (USD Thousand)

TABLE 173 BELGIUM Prebiotic in Bioactive ingredient Market, By Ingredient Type, 2019-2028 (USD Thousand)

TABLE 174 BELGIUM Probiotic in Bioactive ingredient Market, By Ingredient Type, 2019-2028 (USD Thousand)

TABLE 175 BELGIUM Minerals in Bioactive ingredient Market, By Ingredient Type, 2019-2028 (USD Thousand)

TABLE 176 BELGIUM Vitamins in Bioactive ingredient Market, By Ingredient Type, 2019-2028 (USD Thousand)

TABLE 177 BELGIUM Amino Acid in Bioactive ingredient Market, By Ingredient Type, 2019-2028 (USD Thousand)

TABLE 178 BELGIUM Bioactive ingredient Market, By Applications, 2019-2028 (USD Thousand)

TABLE 179 BELGIUM Functional Food in Bioactive ingredient Market, By Applications, 2019-2028 (USD Thousand)

TABLE 180 BELGIUM Dairy in Bioactive ingredient Market, By Applications, 2019-2028 (USD Thousand)

TABLE 181 BELGIUM Dairy Alternatives in Bioactive ingredient Market, By Applications, 2019-2028 (USD Thousand)

TABLE 182 BELGIUM Beverages in Bioactive ingredient Market, By Applications, 2019-2028 (USD Thousand)

TABLE 183 BELGIUM Bars in Bioactive ingredient Market, By Applications, 2019-2028 (USD Thousand)

TABLE 184 BELGIUM Animal Nutrition in Bioactive ingredient Market, By Applications, 2019-2028 (USD Thousand)

TABLE 185 BELGIUM Personal Care in Bioactive ingredient Market, By Applications, 2019-2028 (USD Thousand)

TABLE 186 BELGIUM Bioactive ingredient Market, By Source, 2019-2028 (USD Thousand)

TABLE 187 RUSSIA Bioactive ingredient Market, By Ingredient Type, 2019-2028 (USD Thousand)

TABLE 188 RUSSIA Bioactive ingredient Market, By Ingredient Type, 2019-2028 (Tons)

TABLE 189 RUSSIA Peptides in Bioactive ingredient Market, By Ingredient Type, 2019-2028 (USD Thousand)

TABLE 190 RUSSIA Prebiotic in Bioactive ingredient Market, By Ingredient Type, 2019-2028 (USD Thousand)

TABLE 191 RUSSIA Probiotic in Bioactive ingredient Market, By Ingredient Type, 2019-2028 (USD Thousand)

TABLE 192 RUSSIA Minerals in Bioactive ingredient Market, By Ingredient Type, 2019-2028 (USD Thousand)

TABLE 193 RUSSIA Vitamins in Bioactive ingredient Market, By Ingredient Type, 2019-2028 (USD Thousand)

TABLE 194 RUSSIA Amino Acid in Bioactive ingredient Market, By Ingredient Type, 2019-2028 (USD Thousand)

TABLE 195 RUSSIA Bioactive ingredient Market, By Applications, 2019-2028 (USD Thousand)

TABLE 196 RUSSIA Functional Food in Bioactive ingredient Market, By Applications, 2019-2028 (USD Thousand)

TABLE 197 RUSSIA Dairy in Bioactive ingredient Market, By Applications, 2019-2028 (USD Thousand)

TABLE 198 RUSSIA Dairy Alternatives in Bioactive ingredient Market, By Applications, 2019-2028 (USD Thousand)

TABLE 199 RUSSIA Beverages in Bioactive ingredient Market, By Applications, 2019-2028 (USD Thousand)

TABLE 200 RUSSIA Bars in Bioactive ingredient Market, By Applications, 2019-2028 (USD Thousand)

TABLE 201 RUSSIA Animal Nutrition in Bioactive ingredient Market, By Applications, 2019-2028 (USD Thousand)

TABLE 202 RUSSIA Personal Care in Bioactive ingredient Market, By Applications, 2019-2028 (USD Thousand)

TABLE 203 RUSSIA Bioactive ingredient Market, By Source, 2019-2028 (USD Thousand)

TABLE 204 TURKEY Bioactive ingredient Market, By Ingredient Type, 2019-2028 (USD Thousand)

TABLE 205 TURKEY Bioactive ingredient Market, By Ingredient Type, 2019-2028 (Tons)

TABLE 206 TURKEY Peptides in Bioactive ingredient Market, By Ingredient Type, 2019-2028 (USD Thousand)

TABLE 207 TURKEY Prebiotic in Bioactive ingredient Market, By Ingredient Type, 2019-2028 (USD Thousand)

TABLE 208 TURKEY Probiotic in Bioactive ingredient Market, By Ingredient Type, 2019-2028 (USD Thousand)

TABLE 209 TURKEY Minerals in Bioactive ingredient Market, By Ingredient Type, 2019-2028 (USD Thousand)

TABLE 210 TURKEY Vitamins in Bioactive ingredient Market, By Ingredient Type, 2019-2028 (USD Thousand)

TABLE 211 TURKEY Amino Acid in Bioactive ingredient Market, By Ingredient Type, 2019-2028 (USD Thousand)

TABLE 212 TURKEY Bioactive ingredient Market, By Applications, 2019-2028 (USD Thousand)

TABLE 213 TURKEY Functional Food in Bioactive ingredient Market, By Applications, 2019-2028 (USD Thousand)

TABLE 214 TURKEY Dairy in Bioactive ingredient Market, By Applications, 2019-2028 (USD Thousand)

TABLE 215 TURKEY Dairy Alternatives in Bioactive ingredient Market, By Applications, 2019-2028 (USD Thousand)

TABLE 216 TURKEY Beverages in Bioactive ingredient Market, By Applications, 2019-2028 (USD Thousand)

TABLE 217 TURKEY Bars in Bioactive ingredient Market, By Applications, 2019-2028 (USD Thousand)

TABLE 218 TURKEY Animal Nutrition in Bioactive ingredient Market, By Applications, 2019-2028 (USD Thousand)

TABLE 219 TURKEY Personal Care in Bioactive ingredient Market, By Applications, 2019-2028 (USD Thousand)

TABLE 220 TURKEY Bioactive ingredient Market, By Source, 2019-2028 (USD Thousand)

TABLE 221 SWITZERLAND Bioactive ingredient Market, By Ingredient Type, 2019-2028 (USD Thousand)

TABLE 222 SWITZERLAND Bioactive ingredient Market, By Ingredient Type, 2019-2028 (Tons)

TABLE 223 SWITZERLAND Peptides in Bioactive ingredient Market, By Ingredient Type, 2019-2028 (USD Thousand)

TABLE 224 SWITZERLAND Prebiotic in Bioactive ingredient Market, By Ingredient Type, 2019-2028 (USD Thousand)

TABLE 225 SWITZERLAND Probiotic in Bioactive ingredient Market, By Ingredient Type, 2019-2028 (USD Thousand)

TABLE 226 SWITZERLAND Minerals in Bioactive ingredient Market, By Ingredient Type, 2019-2028 (USD Thousand)

TABLE 227 SWITZERLAND Vitamins in Bioactive ingredient Market, By Ingredient Type, 2019-2028 (USD Thousand)

TABLE 228 SWITZERLAND Amino Acid in Bioactive ingredient Market, By Ingredient Type, 2019-2028 (USD Thousand)

TABLE 229 SWITZERLAND Bioactive ingredient Market, By Applications, 2019-2028 (USD Thousand)

TABLE 230 SWITZERLAND Functional Food in Bioactive ingredient Market, By Applications, 2019-2028 (USD Thousand)

TABLE 231 SWITZERLAND Dairy in Bioactive ingredient Market, By Applications, 2019-2028 (USD Thousand)

TABLE 232 SWITZERLAND Dairy Alternatives in Bioactive ingredient Market, By Applications, 2019-2028 (USD Thousand)

TABLE 233 SWITZERLAND Beverages in Bioactive ingredient Market, By Applications, 2019-2028 (USD Thousand)

TABLE 234 SWITZERLAND Bars in Bioactive ingredient Market, By Applications, 2019-2028 (USD Thousand)

TABLE 235 SWITZERLAND Animal Nutrition in Bioactive ingredient Market, By Applications, 2019-2028 (USD Thousand)

TABLE 236 SWITZERLAND Personal Care in Bioactive ingredient Market, By Applications, 2019-2028 (USD Thousand)

TABLE 237 SWITZERLAND Bioactive ingredient Market, By Source, 2019-2028 (USD Thousand)

TABLE 238 DENMARK Bioactive ingredient Market, By Ingredient Type, 2019-2028 (USD Thousand)

TABLE 239 DENMARK Bioactive ingredient Market, By Ingredient Type, 2019-2028 (Tons)

TABLE 240 DENMARK Peptides in Bioactive ingredient Market, By Ingredient Type, 2019-2028 (USD Thousand)

TABLE 241 DENMARK Prebiotic in Bioactive ingredient Market, By Ingredient Type, 2019-2028 (USD Thousand)

TABLE 242 DENMARK Probiotic in Bioactive ingredient Market, By Ingredient Type, 2019-2028 (USD Thousand)

TABLE 243 DENMARK Minerals in Bioactive ingredient Market, By Ingredient Type, 2019-2028 (USD Thousand)

TABLE 244 DENMARK Vitamins in Bioactive ingredient Market, By Ingredient Type, 2019-2028 (USD Thousand)

TABLE 245 DENMARK Amino Acid in Bioactive ingredient Market, By Ingredient Type, 2019-2028 (USD Thousand)

TABLE 246 DENMARK Bioactive ingredient Market, By Applications, 2019-2028 (USD Thousand)

TABLE 247 DENMARK Functional Food in Bioactive ingredient Market, By Applications, 2019-2028 (USD Thousand)

TABLE 248 DENMARK Dairy in Bioactive ingredient Market, By Applications, 2019-2028 (USD Thousand)

TABLE 249 DENMARK Dairy Alternatives in Bioactive ingredient Market, By Applications, 2019-2028 (USD Thousand)

TABLE 250 DENMARK Beverages in Bioactive ingredient Market, By Applications, 2019-2028 (USD Thousand)

TABLE 251 DENMARK Bars in Bioactive ingredient Market, By Applications, 2019-2028 (USD Thousand)

TABLE 252 DENMARK Animal Nutrition in Bioactive ingredient Market, By Applications, 2019-2028 (USD Thousand)

TABLE 253 DENMARK Personal Care in Bioactive ingredient Market, By Applications, 2019-2028 (USD Thousand)

TABLE 254 DENMARK Bioactive ingredient Market, By Source, 2019-2028 (USD Thousand)

TABLE 255 SWEDEN Bioactive ingredient Market, By Ingredient Type, 2019-2028 (USD Thousand)

TABLE 256 SWEDEN Bioactive ingredient Market, By Ingredient Type, 2019-2028 (Tons)

TABLE 257 SWEDEN Peptides in Bioactive ingredient Market, By Ingredient Type, 2019-2028 (USD Thousand)

TABLE 258 SWEDEN Prebiotic in Bioactive ingredient Market, By Ingredient Type, 2019-2028 (USD Thousand)

TABLE 259 SWEDEN Probiotic in Bioactive ingredient Market, By Ingredient Type, 2019-2028 (USD Thousand)

TABLE 260 SWEDEN Minerals in Bioactive ingredient Market, By Ingredient Type, 2019-2028 (USD Thousand)

TABLE 261 SWEDEN Vitamins in Bioactive ingredient Market, By Ingredient Type, 2019-2028 (USD Thousand)

TABLE 262 SWEDEN Amino Acid in Bioactive ingredient Market, By Ingredient Type, 2019-2028 (USD Thousand)

TABLE 263 SWEDEN Bioactive ingredient Market, By Applications, 2019-2028 (USD Thousand)

TABLE 264 SWEDEN Functional Food in Bioactive ingredient Market, By Applications, 2019-2028 (USD Thousand)

TABLE 265 SWEDEN Dairy in Bioactive ingredient Market, By Applications, 2019-2028 (USD Thousand)

TABLE 266 SWEDEN Dairy Alternatives in Bioactive ingredient Market, By Applications, 2019-2028 (USD Thousand)

TABLE 267 SWEDEN Beverages in Bioactive ingredient Market, By Applications, 2019-2028 (USD Thousand)

TABLE 268 SWEDEN Bars in Bioactive ingredient Market, By Applications, 2019-2028 (USD Thousand)

TABLE 269 SWEDEN Animal Nutrition in Bioactive ingredient Market, By Applications, 2019-2028 (USD Thousand)

TABLE 270 SWEDEN Personal Care in Bioactive ingredient Market, By Applications, 2019-2028 (USD Thousand)

TABLE 271 SWEDEN Bioactive ingredient Market, By Source, 2019-2028 (USD Thousand)

TABLE 272 POLAND Bioactive ingredient Market, By Ingredient Type, 2019-2028 (USD Thousand)

TABLE 273 POLAND Bioactive ingredient Market, By Ingredient Type, 2019-2028 (Tons)

TABLE 274 POLAND Peptides in Bioactive ingredient Market, By Ingredient Type, 2019-2028 (USD Thousand)

TABLE 275 POLAND Prebiotic in Bioactive ingredient Market, By Ingredient Type, 2019-2028 (USD Thousand)

TABLE 276 POLAND Probiotic in Bioactive ingredient Market, By Ingredient Type, 2019-2028 (USD Thousand)

TABLE 277 POLAND Minerals in Bioactive ingredient Market, By Ingredient Type, 2019-2028 (USD Thousand)

TABLE 278 POLAND Vitamins in Bioactive ingredient Market, By Ingredient Type, 2019-2028 (USD Thousand)

TABLE 279 POLAND Amino Acid in Bioactive ingredient Market, By Ingredient Type, 2019-2028 (USD Thousand)

TABLE 280 POLAND Bioactive ingredient Market, By Applications, 2019-2028 (USD Thousand)

TABLE 281 POLAND Functional Food in Bioactive ingredient Market, By Applications, 2019-2028 (USD Thousand)

TABLE 282 POLAND Dairy in Bioactive ingredient Market, By Applications, 2019-2028 (USD Thousand)

TABLE 283 POLAND Dairy Alternatives in Bioactive ingredient Market, By Applications, 2019-2028 (USD Thousand)

TABLE 284 POLAND Beverages in Bioactive ingredient Market, By Applications, 2019-2028 (USD Thousand)

TABLE 285 POLAND Bars in Bioactive ingredient Market, By Applications, 2019-2028 (USD Thousand)

TABLE 286 POLAND Animal Nutrition in Bioactive ingredient Market, By Applications, 2019-2028 (USD Thousand)

TABLE 287 POLAND Personal Care in Bioactive ingredient Market, By Applications, 2019-2028 (USD Thousand)

TABLE 288 POLAND Bioactive ingredient Market, By Source, 2019-2028 (USD Thousand)

TABLE 289 REST OF EUROPE Bioactive ingredient Market, By Ingredient Type, 2019-2028 (USD Thousand)

TABLE 290 REST OF EUROPE Bioactive ingredient Market, By Ingredient Type, 2019-2028 (Tons)

그림 목록

FIGURE 1 EUROPE BIOACTIVE INGREDIENT MARKET: segmentation

FIGURE 2 EUROPE BIOACTIVE INGREDIENT MARKET: data triangulation

FIGURE 3 EUROPE BIOACTIVE INGREDIENT MARKET: DROC ANALYSIS

FIGURE 4 EUROPE BIOACTIVE INGREDIENT MARKET: Europe VS. regional MARKET analysis

FIGURE 5 EUROPE BIOACTIVE INGREDIENT MARKET: company research analysis

FIGURE 6 EUROPE BIOACTIVE INGREDIENT MARKET: THE Ingredient Type LIFE LINE CURVE

FIGURE 7 EUROPE BIOACTIVE INGREDIENT MARKET: MULTIVARIATE MODELLING

FIGURE 8 EUROPE BIOACTIVE INGREDIENT MARKET: INTERVIEW DEMOGRAPHICS

FIGURE 9 EUROPE BIOACTIVE INGREDIENT MARKET: DBMR MARKET POSITION GRID

FIGURE 10 EUROPE BIOACTIVE INGREDIENT MARKET: MARKET application COVERAGE GRID

FIGURE 11 EUROPE BIOACTIVE INGREDIENT MARKET: THE MARKET CHALLENGE MATRIX

FIGURE 12 EUROPE BIOACTIVE INGREDIENT MARKET: vendor share analysis

FIGURE 13 EUROPE BIOACTIVE INGREDIENT MARKET: SEGMENTATION

FIGURE 14 Rising demand of bioactive ingredients in functional foodIS DRIVING the EUROPE BIOACTIVE INGREDIENT MARKET in the forecast period of 2021 to 2028

FIGURE 15 peptide SEGMENT is expected to account for the largest share of the EUROPE BIOACTIVE INGREDIENT MARKET in 2021 & 2028

FIGURE 16 Figure 1 DRIVERS, RESTRAINTS, OPPORTUNITIES AND CHALLENGEs OF Europe Bioactive Ingredient MARKET

FIGURE 17 : DRUG USED FOR DIABETES (DOSAGE PER 1,000 INHABITANTS, PER DAY)

FIGURE 1 Europe bioactive ingredient MARKET: BY Ingredient Type, 2020

FIGURE 2 Europe bioactive ingredient MARKET: BY Applications, 2020

FIGURE 3 Europe bioactive ingredient MARKET: BY source, 2020

FIGURE 4 EUROPE bioactive ingredient market: SNAPSHOT (2020)

FIGURE 5 EUROPE BIOACTIVE INGREDIENT market: by COUNTRY (2020)

FIGURE 6 EUROPE BIOACTIVE INGREDIENT market: by COUNTRY (2021 & 2028)

FIGURE 7 EUROPE BIOACTIVE INGREDIENT market: by COUNTRY (2020 & 2028)

FIGURE 8 EUROPE BIOACTIVE INGREDIENT market: by Ingredient Type (2021-2028)

FIGURE 9 EUROPE BIOACTIVE INGREDIENT MARKET: company share 2020 (%)

자세한 정보 보기 Right Arrow

연구 방법론

데이터 수집 및 기준 연도 분석은 대규모 샘플 크기의 데이터 수집 모듈을 사용하여 수행됩니다. 이 단계에는 다양한 소스와 전략을 통해 시장 정보 또는 관련 데이터를 얻는 것이 포함됩니다. 여기에는 과거에 수집한 모든 데이터를 미리 검토하고 계획하는 것이 포함됩니다. 또한 다양한 정보 소스에서 발견되는 정보 불일치를 검토하는 것도 포함됩니다. 시장 데이터는 시장 통계 및 일관된 모델을 사용하여 분석하고 추정합니다. 또한 시장 점유율 분석 및 주요 추세 분석은 시장 보고서의 주요 성공 요인입니다. 자세한 내용은 분석가에게 전화를 요청하거나 문의 사항을 드롭하세요.

DBMR 연구팀에서 사용하는 주요 연구 방법론은 데이터 마이닝, 시장에 대한 데이터 변수의 영향 분석 및 주요(산업 전문가) 검증을 포함하는 데이터 삼각 측량입니다. 데이터 모델에는 공급업체 포지셔닝 그리드, 시장 타임라인 분석, 시장 개요 및 가이드, 회사 포지셔닝 그리드, 특허 분석, 가격 분석, 회사 시장 점유율 분석, 측정 기준, 글로벌 대 지역 및 공급업체 점유율 분석이 포함됩니다. 연구 방법론에 대해 자세히 알아보려면 문의를 통해 업계 전문가에게 문의하세요.

사용자 정의 가능

Data Bridge Market Research는 고급 형성 연구 분야의 선두 주자입니다. 저희는 기존 및 신규 고객에게 목표에 맞는 데이터와 분석을 제공하는 데 자부심을 느낍니다. 보고서는 추가 국가에 대한 시장 이해(국가 목록 요청), 임상 시험 결과 데이터, 문헌 검토, 재생 시장 및 제품 기반 분석을 포함하도록 사용자 정의할 수 있습니다. 기술 기반 분석에서 시장 포트폴리오 전략에 이르기까지 타겟 경쟁업체의 시장 분석을 분석할 수 있습니다. 귀하가 원하는 형식과 데이터 스타일로 필요한 만큼 많은 경쟁자를 추가할 수 있습니다. 저희 분석가 팀은 또한 원시 엑셀 파일 피벗 테이블(팩트북)로 데이터를 제공하거나 보고서에서 사용 가능한 데이터 세트에서 프레젠테이션을 만드는 데 도움을 줄 수 있습니다.

자주 묻는 질문

Europe Bioactive Ingredient Market to grow at a CAGR of 7.1% by forecast 2028.
Europe Bioactive Ingredient Market value to reach USD 12,713,978.02 thousand by 2028.
The major market players engaged in the global bioactive ingredient market are DSM, BASF SE , Kerry, DuPont, ADM, Global Bio-chem Technology Group Company Limited, Evonik Industries AG, Cargill, Incorporated, Arla Food Ingredients Group P/S (a subsidiary of Arla Foods amba), FMC Corporation, Sunrise Nutrachem Group, Adisseo (a subsidiary of Bluestar Adisseo Co., Ltd.), Chr.Hansen Holding A/S, Sabinsa, Ajinomoto Co., Inc, NOVUS INTERNATIONAL (a subsidiary of Mitsui & Co. (U.S.A.), Inc.), Ingredion, Roquette Frères, Probi and Advanced Animal Nutrition Pty Ltd.
The countries covered in the Europe Bioactive Ingredient market report are Germany, U.K., France, Italy, Spain, Netherlands, Belgium, Russia, Turkey, Switzerland, Poland, Denmark, and the Rest of Europe.