유럽 ​​API 중간체 시장 - 산업 동향 및 2030년까지의 예측

TOC 요청 TOC 요청 분석가에게 문의 분석가에게 문의 지금 구매 지금 구매 구매하기 전에 문의 구매하기 전에 문의 무료 샘플 보고서 무료 샘플 보고서

유럽 ​​API 중간체 시장 - 산업 동향 및 2030년까지의 예측

  • Pharmaceutical
  • Upcoming Report
  • Oct 2023
  • Europe
  • 350 Pages
  • 테이블 수: 220
  • 그림 수: 60

Europe Api Intermediates Market

시장 규모 (USD 10억)

연평균 성장률 :  % Diagram

Diagram 예측 기간
2023 –2030
Diagram 시장 규모(기준 연도)
USD 49,400.00 Million
Diagram 시장 규모(예측 연도)
USD 79,332.30 Million
Diagram 연평균 성장률
%
Diagram주요 시장 플레이어
  • Dummy1
  • Dummy2
  • Dummy3
  • Dummy4
  • Dummy5

유럽 ​​API 중간체 시장, 유형별(수의학 약물 중간체 제약/대량 약물 중간체), 제품(브로모 화합물, O-벤질 살부타몰, 헤미술페이트, 옥시란, 비소프롤올 염기, 키랄 PCBHP, 페니라민 염기, 클로로페니라민 염기, 브롬페니라민 염기, 메피라민/피릴라민 염기, 6-아미노-1,3-디메틸 우라실, 테오필린, 아세필린, 잔틴, 니트릴, 기타), 치료 유형(자가면역 ​​질환, 종양학, 대사 질환, 안과, 심혈관 질환, 감염성 질환, 신경학, 호흡기 질환, 피부과, 비뇨기과, 기타), 고객(직접 사용자/제약 회사, 상인/도매업체/유통업체, 협회/정부 기관/민간 기관), 최종 사용자(API 제조업체, 완제품 제조업체), 유통 채널(직접 입찰, 소매 판매, 기타) - 산업 동향 및 2030년까지의 전망.

유럽 ​​API 중간체 시장

유럽 ​​API 중간체 시장 분석 및 규모

제약 회사는 신약을 만들고 기존 제형을 개선하기 위해 연구 개발(R&D)에 적극적으로 참여합니다. 이러한 R&D 노력에는 고품질 API 중간체의 꾸준한 공급이 필요합니다. 유럽의 많은 제약 회사는 아시아와 같은 다른 지역의 제조업체를 포함하여 API 중간체 생산을 제3자 제조업체에 아웃소싱하고 있습니다. 이러한 아웃소싱을 통해 유럽 회사는 생산 비용을 줄이고 약물 개발 및 마케팅에 집중할 수 있습니다. 기존 생물학적 제품과 매우 유사한 생물학적 약물인 바이오시밀러의 개발은 유럽에서 증가하고 있습니다. 바이오시밀러를 생산하려면 API 중간체의 안정적인 공급이 필요하여 시장 성장에 기여합니다.

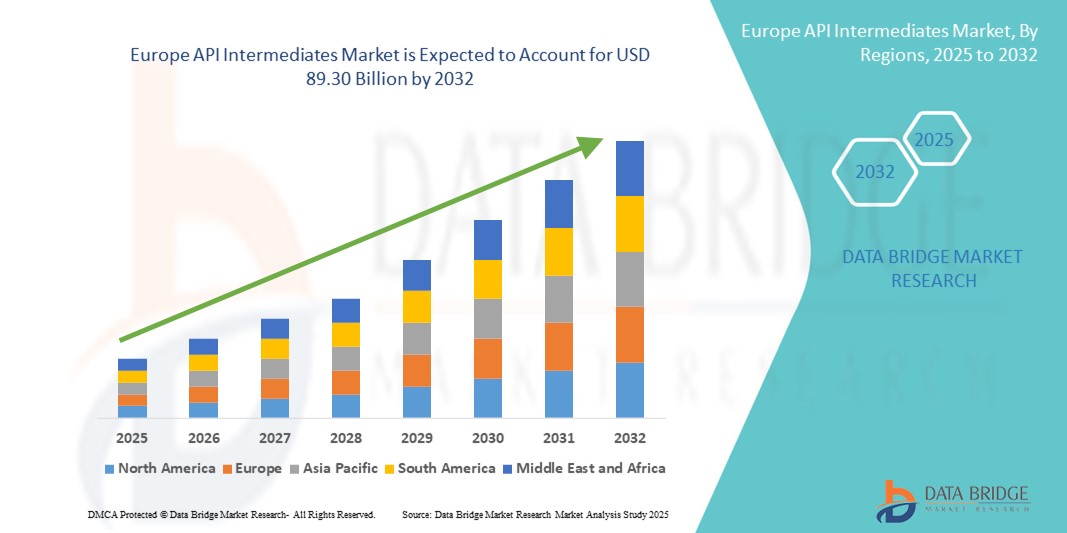
Data Bridge Market Research는 2022년에 49,400.00백만 달러였던 유럽 API 중간체 시장이 2030년까지 79,332.30백만 달러에 도달할 것으로 예상되며, 2023-2030년 예측 기간 동안 6.1%의 CAGR을 보일 것으로 분석했습니다. 이는 시장 가치를 나타냅니다. "수의학 의약품 중간체 제약"은 의료 분야에 대한 투자 증가로 인해 유럽 API 중간체 시장의 유형 세그먼트를 지배합니다. 시장 가치, 성장률, 세분화, 지리적 범위 및 주요 업체와 같은 시장 시나리오에 대한 통찰력 외에도 Data Bridge Market Research에서 큐레이팅한 시장 보고서에는 심층 전문가 분석, 환자 역학, 파이프라인 분석, 가격 분석 및 규제 프레임워크도 포함됩니다.

유럽 ​​API 중간체 시장 범위 및 세분화

보고서 메트릭

세부

예측 기간

2023년부터 2030년까지

기준 연도

2022

역사적 연도

2021 (2015-2020까지 사용자 정의 가능)

양적 단위

매출은 백만 달러, 볼륨은 단위, 가격은 달러로 표시

다루는 세그먼트

Type (Veterinary Drug Intermediates Pharmaceutical / Bulk Drug Intermediates), Product (Bromo Compound, O-Benzyl Salbutamol, Hemisulfate, Oxirane, Bisoprolol Base, Chiral PCBHP, Pheniramine Base, Chlorpheniramine Base, Brompheniramine Base, Mepyramine/Pyrilamine Base, 6-Amino-1,3-Dimethyl Uracil, Theofylline, Acefylline, Xanthine, Nitriles, Others), Therapeutic Type (Autoimmune Diseases, Oncology, Metabolic Diseases, Ophthalmology, Cardiovascular Diseases, Infectious Diseases, Neurology, Respiratory Disorders, Dermatology, Urology, Others), Customers (Direct Users/Pharma Companies, Traders/Wholesalers/Distributors, Associations/Govt. Institutions/Pvt Institutions), End User (API Manufacturer, Finished Product Manufacturer), Distribution Channel (Direct Tender, Retail Sales, Others)

Countries Covered

Germany, U.K., France, Italy, Spain, Netherlands, Russia, Switzerland, Turkey, Austria, Norway, Hungary, Lithuania, Ireland, Poland, Rest of Europe

Market Players Covered

HIKAL Ltd.(India), Cambrex Corporation (U.S.), Ganesh-Group (India), AlzChem Group AG (Germany), Vasudha Pharma (India), Anyang General Chemical Co.,Ltd.(South Korea), Sarex (India), Sandoo Pharmaceuticals and Chemicals Co., Ltd.(China), Atul Ltd (India), Sandoz International GmbH  (a subsidiary of Novartis AG) (Germany), Aceto (U.S.), Supriya Lifescience Ltd. (India), Vertellus (U.S.), Dishman Carbogen Amcis Ltd (India), Sanofi (France), Divi's Laboratories Limited (India), AARTI INDUSTRIES LIMITED (India), Aurobindo Pharma (India), BASF SE (Germany)

Market Opportunities

  • Rising incidence of chronic diseases
  • Rising technological advancements
  • Rising R&D activities
  • Increasing demand for generic medicines

Market Definition

The active pharmaceutical ingredient (API) intermediates are the chemical compounds that are used as intermediate products in the synthesis or manufacturing of active pharmaceutical ingredients (APIs). API intermediates are essential components in the pharmaceutical manufacturing process, as they serve as building blocks for the creation of the final API. API intermediates are chemical compounds that are synthesized during the production of active pharmaceutical ingredients (APIs). They are intermediate stages in the chemical synthesis pathway, and they undergo further processing and modifications to ultimately become the API of a pharmaceutical product. API intermediates are crucial in the pharmaceutical industry, as they play a vital role in determining the quality, purity, and efficacy of the final drug product.

Europe API Intermediates Market Dynamics

Drivers

  • Pharmaceutical Industry Growth

The pharmaceutical industry in Europe is characterized by a robust pipeline of new drug candidates and therapies. As pharmaceutical companies invest in research and development (R&D) to bring innovative drugs to market, they require a steady supply of high-quality API intermediates. Each new drug development project necessitates specific intermediates tailored to the drug's molecular structure. Pharmaceutical companies in Europe are engaged in the development of drugs across a wide range of therapeutic areas, including oncology, cardiovascular diseases, neurology, infectious diseases, and rare diseases. The diversity of therapeutic areas leads to a variety of API intermediate requirements, stimulating demand in the market.

  • Rising Research and Development

Ongoing research and development efforts in the pharmaceutical sector lead to the creation of new drugs and therapies, requiring specific API intermediates. Pharmaceutical companies in Europe continually invest in R&D to discover and develop new drugs and therapies. The early stages of drug discovery and development often involve the synthesis and testing of numerous compounds, including API intermediates. As more drug candidates enter development pipelines, the demand for specialized intermediates increases. R&D efforts often focus on the development of customized drug formulations tailored to specific patient populations or therapeutic needs. This customization requires the synthesis of unique API intermediates that match the desired molecular structures and characteristics of the APIs.

Opportunity

  • Rising Research Collaborations

Collaborations between pharmaceutical companies and research institutions in Europe often lead to the development of novel drugs and therapies. These research efforts may require the synthesis of specific API intermediates. The growth of the pharmaceutical industry in Europe is intricately linked to the demand for API intermediates. The development of new drugs, adherence to regulatory standards, customization needs, outsourcing practices, and expansion into emerging markets all contribute to the increasing demand for high-quality and reliable API intermediates in Europe.

Restraint/Challenge

  • Regulatory Hurdles

The pharmaceutical industry, including the API intermediates sector, is subject to strict regulatory oversight in Europe. Compliance with Good Manufacturing Practices (GMP), Good Laboratory Practices (GLP), and other quality and safety standards is mandatory. Meeting these stringent requirements can be costly and time-consuming. Europe places a strong emphasis on environmental protection. API intermediate manufacturing processes often involve the use of chemicals and solvents. Compliance with environmental regulations, waste management, and sustainable practices can be challenging and expensive.

Recent Developments

  • In January 2021, Vertellus has been acquired by the company, Pritzker Private Capital who partners with the middle-market companies established in North America and builds up the long-term relationship with that company. As Vertellus is considered as leading company or provider of specialty chemicals in different sectors such as healthcare, food & agriculture, personal care, transportation and coatings, so PPC has made a partnership with the company. This helped the company Vertellus to increase their market growth which will drive revenues of the company
  • In November 2020, Cambrex Corporation had announced that the company will expand their API manufacturing capacity to meet the increasing demand from the consumer side. The company has invested USD 50.00 million to enhance their manufacturing capacity. The increase in API manufacturing will directly increase the production and requirement of intermediates which means that the company has to increase the manufacturing of both API and their intermediates. This expansion has helped the company to enhance their production in both the fields that is APIs and their intermediates which will increase the API intermediates market growth

Europe API Intermediates Market Scope

The Europe API intermediates market is segmented on the basis of type, product, therapeutic type, customers, end user, and distribution channel. The growth amongst these segments will help you analyse meager growth segments in the industries and provide the users with a valuable market overview and market insights to help them make strategic decisions for identifying core market applications.

Type

  • Veterinary Drug Intermediates Pharmaceutical
  • Bulk Drug Intermediates

Product

  • Bromo Compound
  • O-Benzyl Salbutamol
  • Hemisulfate, Oxirane
  • Bisoprolol Base
  • Chiral PCBHP
  • Pheniramine Base
  • Chlorpheniramine Base
  • Brompheniramine Base
  • Mepyramine/Pyrilamine Base
  • 6-Amino-1,3-Dimethyl Uracil
  • Theofylline
  • Acefylline
  • Xanthine
  • Nitriles
  • Others

Therapeutic Type

  • Autoimmune Diseases
  • Oncology
  • Metabolic Diseases
  • Ophthalmology
  • Cardiovascular Diseases
  • Infectious Diseases
  • Neurology
  • Respiratory Disorders
  • Dermatology
  • Urology
  • Others

Customers

  • Direct Users/Pharma Companies
  • Traders/Wholesalers/Distributors
  • Associations/Govt. Institutions/PVT Institutions

End User

  • API Manufacturer
  • Finished Product Manufacturer)

Distribution Channel

  • Direct Tender
  • Retail Sales
  • Others

Europe API Intermediates Market Analysis/Insights

Europe API intermediates market is analyzed, and market size insights and trends are provided by type, product, therapeutic type, customers, end user, and distribution channel as referenced above.

The countries covered in the Europe API intermediates market   report are Germany, U.K., France, Italy, Spain, Netherlands, Russia, Switzerland, Turkey, Austria, Norway, Hungary, Lithuania, Ireland, Poland, and Rest of Europe.

독일은 시장 점유율과 시장 수익 측면에서 유럽 API 중간체 시장을 지배하고 있으며 2023-2030년 예측 기간 동안 지배력을 계속 유지할 것입니다. 이는 의료비 지출 증가로 인해 이 지역의 시장 성장률이 더욱 높아질 것입니다. 또한, 유리한 건강 보상 정책, 만성 상처의 증가, 노령 인구의 증가로 인해 이 지역의 시장 성장률이 더욱 높아질 것입니다.

보고서의 국가 섹션은 또한 현재 및 미래 시장 추세에 영향을 미치는 개별 시장 영향 요인과 시장 규제의 변화를 제공합니다. 다운스트림 및 업스트림 가치 사슬 분석, 기술 추세 및 포터의 5가지 힘 분석, 사례 연구와 같은 데이터 포인트는 개별 국가의 시장 시나리오를 예측하는 데 사용되는 몇 가지 포인터입니다. 또한 유럽 브랜드의 존재 및 가용성과 지역 및 국내 브랜드와의 대규모 또는 희소한 경쟁으로 인해 직면한 과제, 국내 관세 및 무역 경로의 영향은 국가 데이터에 대한 예측 분석을 제공하는 동안 고려됩니다.

의료 인프라 성장 설치 기반 및 신기술 침투

유럽 ​​API 중간체 시장은 또한 모든 국가에 대한 자세한 시장 분석을 제공합니다. 자본 장비에 대한 의료 지출 증가, 유럽 API 중간체 시장을 위한 다양한 종류의 제품 설치 기반, 수명선 곡선을 사용한 기술의 영향, 의료 규제 시나리오의 변화 및 유럽 API 중간체 시장에 미치는 영향. 데이터는 2015-2020년의 과거 기간에 대해 제공됩니다.

경쟁 환경 및 유럽 API 중간체 시장 점유율 분석

유럽 ​​API 중간체 시장 경쟁 구도는 경쟁자별 세부 정보를 제공합니다. 포함된 세부 정보는 회사 개요, 회사 재무, 창출된 수익, 시장 잠재력, 연구 개발 투자, 새로운 시장 이니셔티브, 지역적 입지, 생산 현장 및 시설, 생산 용량, 회사의 강점과 약점, 제품 출시, 제품 폭과 범위, 응용 분야 우세입니다. 위에 제공된 데이터 포인트는 유럽 API 중간체 시장과 관련된 회사의 초점에만 관련이 있습니다.

유럽 ​​API 중간체 시장에서 활동하는 주요 기업은 다음과 같습니다.

  • HIKAL Ltd.(인도)
  • 캠브렉스 코퍼레이션(미국)
  • 가네쉬 그룹(인도)
  • AlzChem Group AG(독일)
  • Vasudha Pharma(인도)
  • 안양종합화학(주) (한국)
  • 사렉스(인도)
  • 산두제약화학(주)(중국)
  • Atul Ltd(인도)
  • Sandoz International GmbH(독일)
  • 아세토(미국)
  • Supriya Lifescience Ltd. (인도)
  • 베르텔루스(미국)
  • Dishman Carbogen Amcis Ltd(인도)
  • 사노피(프랑스)
  • Divi's Laboratories Limited(인도)
  • AARTI INDUSTRIES LIMITED(인도)
  • Aurobindo Pharma(인도)
  • BASF SE(독일)


SKU-

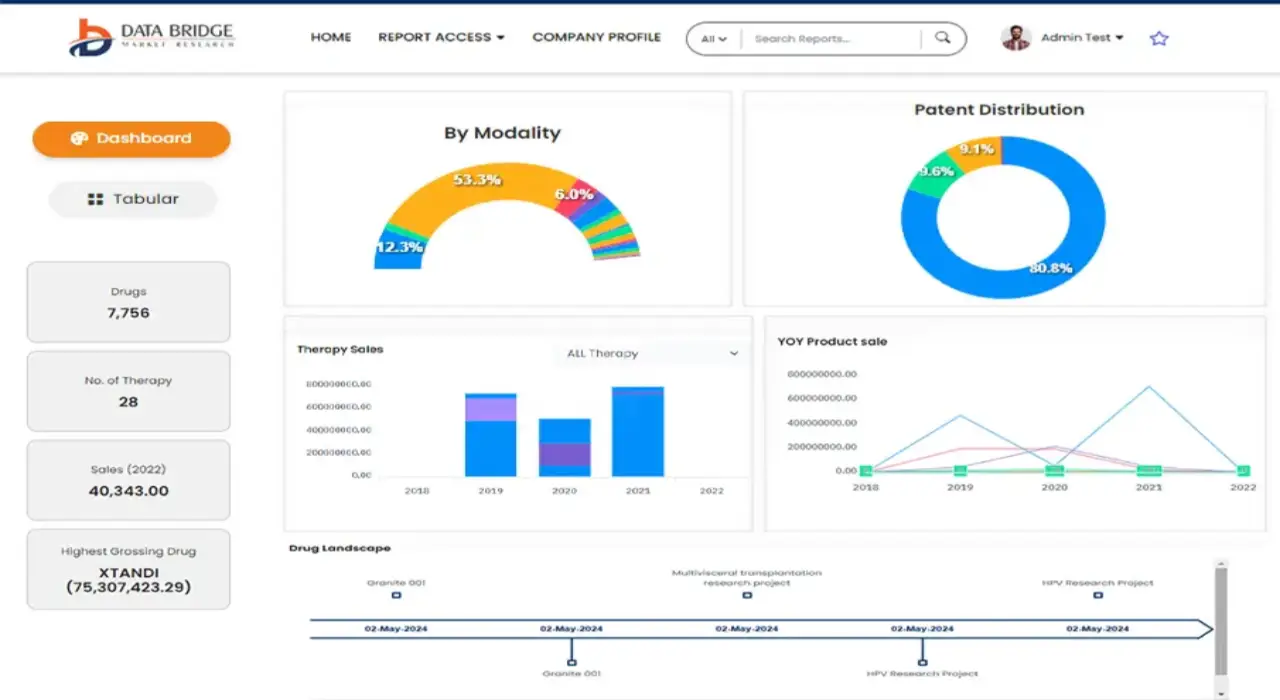
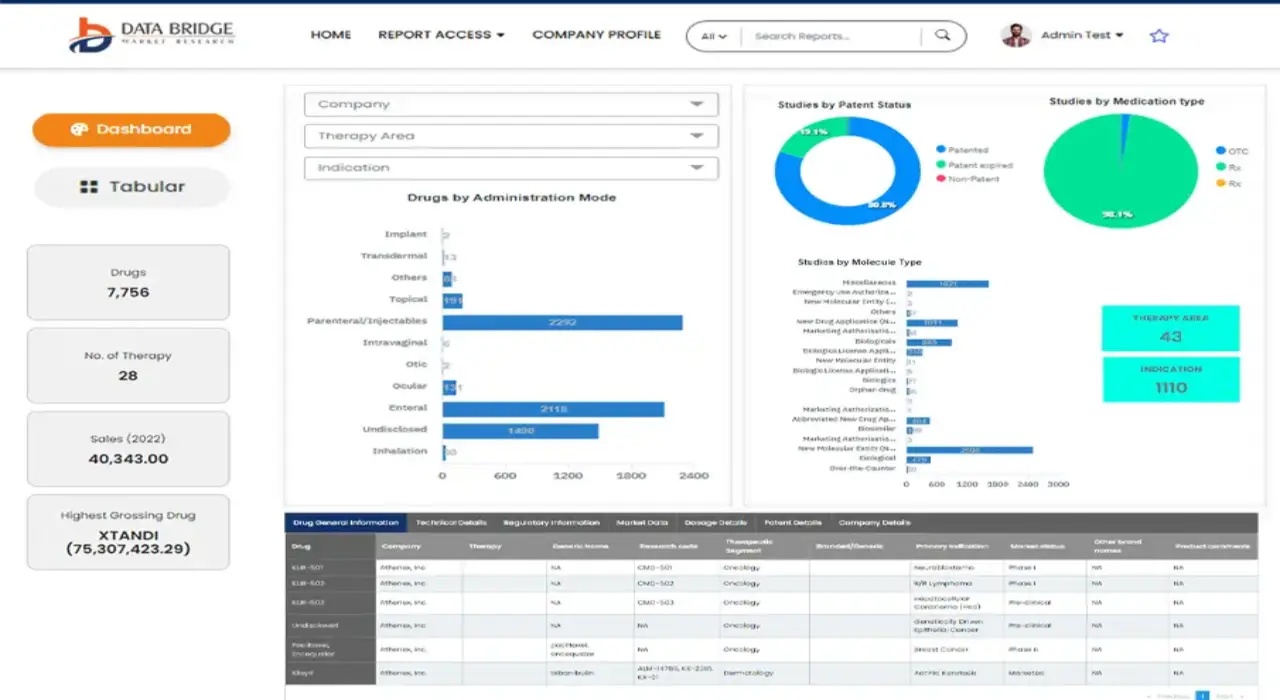
세계 최초의 시장 정보 클라우드 보고서에 온라인으로 접속하세요

  • 대화형 데이터 분석 대시보드
  • 높은 성장 잠재력 기회를 위한 회사 분석 대시보드
  • 사용자 정의 및 질의를 위한 리서치 분석가 액세스
  • 대화형 대시보드를 통한 경쟁자 분석
  • 최신 뉴스, 업데이트 및 추세 분석
  • 포괄적인 경쟁자 추적을 위한 벤치마크 분석의 힘 활용
데모 요청

목차

  1. introduction
    1. OBJECTIVES OF THE STUDY
    2. MARKET DEFINITION
    3. OVERVIEW of EUROPE API intermediates MARKET
    4. LIMITATIONs
    5. MARKETS COVERED
  2. MARKET SEGMENTATION
    1. MARKETS COVERED
    2. geographical scope
    3. years considered for the study
    4. currency and pricing
    5. DBMR TRIPOD DATA VALIDATION MODEL
    6. MULTIVARIATE MODELLING
    7. type LIFELINE CURVE
    8. primary interviews with key opinion leaders
    9. DBMR MARKET POSITION GRID
    10. vendor share analysis
    11. MARKET type COVERAGE GRID
    12. secondary sourcEs
    13. assumptions
  3. EXECUTIVE SUMMARY
  4. premium insight
    1. CURRENT SCENARIO OF IMPORT AND EXPORT OF API INTERMEDIATE
    2. Tentative Production and operational costs calculations which will ultimately lead to feasibility of the product manufacturing
      1. Tentative Land requirement for a Substantial Production Capacity Plant Set-Up
    3. EUROPE API INTERMEDIATES MARKET: 3C ANALYSIS-CHINA EFFECT
      1. THE U.S.-CHINA TRADE WAR
      2. INDO-CHINA GEOPOLITICAL ISSUES
      3. CHINESE SLOWDOWN DUE TO E&C OVER THE YEARS
      4. CHINESE SLOWDOWN DUE TO COVID-19 (CORONAVIRUS)
    4. Cost Analysis
    5. Analysis on China API intermediates:
      1. Conclusion:
    6. porters five forces model
    7. Pestel analysis
    8. Europe API INTERMEDIATES market: regulatORY
      1. THE U.S. REGULATORY GUIDANCE FOR NON-CLINICAL SAFETY EVALUATION OF API INTERMEDIATES
      2. CANADA REGULATORY GUIDANCE FOR API INTERMEDIATES
      3. EUROPE REGULATORY SCENARIO FOR API INTERMEDIATES
      4. JAPAN REGULATORY FOR API INTERMEDIATES
      5. MIDDLE EAST AND AFRICA REGULATORY FRAMEWORK FOR API INTERMEDIATES
  5. EUROPE API INTERMEDIATES MARKET: CONCLUSION
    1. TOP PRODUCTS AND THERAPEUTIC AREAS
    2. ADDITIONAL
  6. CUSTOMER SENTIMENTS/INCLINATION TOWARDS FINDING ALTERNATE VENDOR SOURCE
  7. LIST OF API OR FORMULATION COMPANIES WITH API INTERMEDIATE:
  8. Market Overview
    1. Drivers
      1. HIGH BURDEN OF CHRONIC DISEASES
      2. increase in aging population
      3. utilization of advanceD technology in active pharmaceutical ingredients (api) manufacturing
      4. increasing disease awareness and education
      5. research and development regarding pharmaceutical API and their intermediates
    2. restrainTs
      1. availability of sub-standard and counterfeit drugs
      2. product recalls
      3. high manufacturing cost
      4. stringent government regulations for api intermediates
    3. opportunities
      1. strategic initiatives by the market players
      2. increasing healthcare expenditure
      3. SOARING NUMBER OF API INTERMEDIATES MANUFACTURERS
      4. RISE IN NUMBER OF CONTRACT MANUFACTURING ORGANIZATIONS (CMO) AND CONTRACT RESEARCH ORGANIZATIONS (crO)
    4. challenges
      1. disruption in the supply chain of active pharmaceutical ingredients (api) during covid-19
      2. lack of workforce in pharma industries
  9. Impact of COVID 19 on Europe API Intermediates market
    1. IMPACT ON PRICE
    2. IMPACT ON DEMAND
    3. IMPACT ON SUPPLY CHAIIN
    4. STRATEGIC DECISIONS FOR MANUFACTURERS AFTER COVID-19 TO GAIN COMPETITIVE MARKET SHARE
    5. CONCLUSION
  10. Europe API intermediates MARKET, BY type
    1. overview
    2. pharmaceutical intermediates/ bulk drug intermediates
    3. Veterinary Drug Intermediates
  11. Europe API intermediates MARKET, BY product
    1. overview
    2. Nitriles
    3. bromo compound
    4. Chiral PCBHP
    5. Chlorpheniramine Base
    6. Brompheniramine Base
    7. Pheniramine Base
    8. O-Benzyl Salbutamol
    9. Bisoprolol Base
    10. Hemisulfate
    11. Oxirane
    12. Mepyramine/Pyrilamine Base
    13. Theofylline
    14. Acefylline
    15. Xanthine
    16. 6-Amino-1,3-Dimethyl Uracil
    17. others
  12. Europe API intermediates MARKET, BY therapeutic type
    1. overview
    2. Cardiovascular Diseases
    3. Metabolic Diseases
    4. infectious Diseases
    5. respiratory Diseases
    6. neurology
    7. oncology
    8. Autoimmune Disease
    9. Dermatology
    10. ophthalmology
    11. urology
    12. others
  13. Europe API intermediates MARKET, BY customers
    1. overview
    2. Direct Users/Pharma Companies
    3. Traders/Wholesalers/Distributors
    4. Associations/Govt. Institutions/Pvt Institutions
  14. Europe API intermediates MARKET, BY End User
    1. overview
    2. API manufacturer
    3. finished product manufacturer
  15. Europe API intermediates MARKET, BY distribution channel
    1. overview
    2. direct tender
    3. Retail Sale
    4. others
  16. Europe API Intermediates Market by geography
    1. EUROPE
      1. GERMANY
      2. U.K
      3. ITALY
      4. SPAIN
      5. FRANCE
      6. NETHERLANDS
      7. RUSSIA
      8. SWITZERLAND
      9. TURKEY
      10. AUSTRIA
      11. NORWAY
      12. HUNGARY
      13. LITHUANIA
      14. IRELAND
      15. POLAND
      16. REST OF ASIA PACIFIC
  17. Europe API Intermediates Market: COMPANY landscape
    1. company share analysis: Europe
  18. swot analysis
  19. company profile
    1. aurobindo pharma
      1. COMPANY SNAPSHOT
      2. REVENUE ANALYSIS
      3. company share analysis
      4. PRODUCT PORFOLIO
      5. RECENT DEVELOPMENTS
    2. Divi’s laboratories limited
      1. COMPANY SNAPSHOT
      2. REVENUE ANALYSIS
      3. company share analysis
      4. PRODUCT PORTFOLIO
      5. RECENT DEVELOPMENTS
    3. basf se
      1. COMPANY SNAPSHOT
      2. REVENUE ANALYSIS
      3. company share analysis
      4. PRODUCT PORTFOLIO
      5. RECENT DEVELOPMENT
    4. CAMBRIX CORPORATION
      1. COMPANY SNAPSHOT
      2. company share analysis
      3. PRODUCT PORTFOLIO
      4. RECENT DEVELOPMENTS
    5. Sandoz International GmbH (a subsidiary of Novartis AG)
      1. COMPANY SNAPSHOT
      2. REVENUE ANALYSIS
      3. PRODUCT PORTFOLIO
      4. RECENT DEVELOPMENT
    6. aceto
      1. COMPANY SNAPSHOT
      2. PRODUCT PORTFOLIO
      3. RECENT DEVELOPMENT
    7. hikal ltd.
      1. COMPANY SNAPSHOT
      2. REVENUE ANALYSIS
      3. PRODUCT PORTFOLIO
      4. RECENT DEVELOPMENTS
    8. alzchem group ag
      1. COMPANY SNAPSHOT
      2. REVENUE ANALYSIS
      3. PRODUCT PORTFOLIO
      4. RECENT DEVELOPMENTS
    9. vertellus
      1. COMPANY SNAPSHOT
      2. PRODUCT CATEGORIES
      3. RECENT DEVELOPMENTS
    10. sanofi
      1. COMPANY SNAPSHOT
      2. REVENUE ANALYSIS
      3. PRODUCT PORFOLIO
      4. RECENT DEVELOPMENTS
    11. atul ltd
      1. COMPANY SNAPSHOT
      2. REVENUE ANALYSIS
      3. PRODUCT PORTFOLIO
      4. RECENT DEVELOPMENTS
    12. aarti industries limited
      1. COMPANY SNAPSHOT
      2. REVENUE ANALYSIS
      3. PRODUCT PORTFOLIO
      4. RECENT DEVELOPMENT
    13. vasudha pharma
      1. COMPANY SNAPSHOT
      2. PRODUCT PORTFOLIO
      3. RECENT DEVELOPMENT
    14. anyang general chemical co., Ltd.
      1. COMPANY SNAPSHOT
      2. PRODUCT PORFOLIO
      3. RECENT DEVELOPMENT
    15. dishman carbogen amics ltd
      1. COMPANY SNAPSHOT
      2. REVENUE ANALYSIS
      3. PRODUCT PORFOLIO
      4. RECENT DEVELOPMENTS
    16. ganesh-group
      1. COMPANY SNAPSHOT
      2. PRODUCT PORTFOLIO
      3. RECENT DEVELOPMENTS
    17. levachem company limited
      1. COMPANY SNAPSHOT
      2. PRODUCT PORFOLIO
      3. RECENT DEVELOPMENT
    18. sandoo pharmaceuticals and chemicals co., ltd.
      1. COMPANY SNAPSHOT
      2. PRODUCT PORTFOLIO
      3. RECENT DEVELOPMENT
    19. sarex
      1. COMPANY SNAPSHOT
      2. PRODUCT PORTFOLIO
      3. RECENT DEVELOPMENTS
    20. SUPRIYA LIFESCIENCE LTD.
      1. COMPANY SNAPSHOT
      2. PRODUCT PORTFOLIO
      3. RECENT DEVELOPMENT
  20. questionnaire
  21. related reports

표 목록

TABLE 1 EUROPE ACTIVE PHARMACEUTICAL INGREDIENTS INTERMEDIATES: CUSTOMIZATION (COUNTRIES INVOLVED IN IMPORT & EXPORT)

TABLE 2 Percentage Break up of Cost

TABLE 3 Tentative Land Requirement

TABLE 4 Percentage Break up of Plant Area

TABLE 5 Table: 1 EUROPE ACTIVE PHARMACEUTICAL INGREDIENTS INTERMEDIATES: LIST OF API OR FORMULATION COMPANIES WITH API INTERMEDIATE

TABLE 6 HEALTHCARE EXPENDITURE IN ASIA-PACIFIC

TABLE 7 MARKET PLAYERS OF API INTERMEDIATES

TABLE 8 Sales Data of API intermediates for 2019/2020

TABLE 9 Europe API intermediates Market, By Type, 2019-2028 (USD Million)

TABLE 10 Europe pharmaceutical intermediates/ bulk drug intermediates in API intermediates Market, By region, 2019-2028 (USD Million)

TABLE 11 Europe Veterinary Drug Intermediates in API intermediates Market, By region, 2019-2028 (USD Million)

TABLE 12 Europe API intermediates Market, By Product, 2019-2028 (USD Million)

TABLE 13 Europe nitriles in API intermediates Market, By region, 2019-2028 (USD Million)

TABLE 14 Europe bromo compound in API intermediates Market, By region, 2019-2028 (USD Million)

TABLE 15 Europe chiral PCBHP in API intermediates Market, By region, 2019-2028 (USD Million)

TABLE 16 Europe chlorpheniramine base in API intermediates Market, By region, 2019-2028 (USD Million)

TABLE 17 Europe brompheniramine base in API intermediates Market, By region, 2019-2028 (USD Million)

TABLE 18 Europe pheniramine base in API intermediates Market, By region, 2019-2028 (USD Million)

TABLE 19 Europe O-Benzyl Salbutamol in API intermediates Market, By region, 2019-2028 (USD Million)

TABLE 20 Europe bisoprolol base in API intermediates Market, By region, 2019-2028 (USD Million)

TABLE 21 Europe hemisulfate in API intermediates Market, By region, 2019-2028 (USD Million)

TABLE 22 Europe oxirane in API intermediates Market, By region, 2019-2028 (USD Million)

TABLE 23 Europe mepyramine/pyrilamine base in API intermediates Market, By region, 2019-2028 (USD Million)

TABLE 24 Europe theofylline in API intermediates Market, By region, 2019-2028 (USD Million)

TABLE 25 Europe acefylline in API intermediates Market, By region, 2019-2028 (USD Million)

TABLE 26 Europe Xanthine in API intermediates Market, By region, 2019-2028 (USD Million)

TABLE 27 Europe 6-amino-1, 3-dimethyl uracil in API intermediates Market, By region, 2019-2028 (USD Million)

TABLE 28 Europe others in API intermediates Market, By region, 2019-2028 (USD Million)

TABLE 29 Europe API intermediates Market, By THERAPEUTIC Type, 2019-2028 (USD Million)

TABLE 30 Europe cardiovascular diseases in API intermediates Market, By Region, 2017-2028 (USD Million)

TABLE 31 Europe metabolic diseases in API intermediates Market, By Region, 2019-2028 (USD Million)

TABLE 32 Europeinfectious diseases in API intermediates Market, By Region, 2019-2028 (USD Million)

TABLE 33 Europe respiratory diseases in API intermediates Market, By Region, 2019-2028 (USD Million)

TABLE 34 Europe neurology in API intermediates Market, By Region, 2019-2028 (USD Million)

TABLE 35 Europe oncology in API intermediates Market, By Region, 2019-2028 (USD Million)

TABLE 36 Europe autoimmune diseases in API intermediates Market, By Region, 2019-2028 (USD Million)

TABLE 37 Europe dermatology in API intermediates Market, By Region, 2019-2028 (USD Million)

TABLE 38 Europe ophthalmology in API intermediates Market, By Region, 2019-2028 (USD Million)

TABLE 39 Europe urology in API intermediates Market, By Region, 2019-2028 (USD Million)

TABLE 40 Europe others in API intermediates Market, By Region, 2019-2028 (USD Million)

TABLE 41 Europe API intermediates Market, By CUSTOMERS, 2019-2028 (USD Million)

TABLE 42 Europe Direct Users/Pharma Companies in API intermediates Market, By Region, 2019-2028 (USD Million)

TABLE 43 Europe Traders/Wholesalers/Distributors in API intermediates Market, By Region, 2019-2028 (USD Million)

TABLE 44 Europe Associations/Govt. Institutions/Pvt Institutionsin API intermediates Market, By Region, 2019-2028 (USD Million)

TABLE 45 Europe API intermediates Market, By END USER, 2019-2028 (USD Million)

TABLE 46 Europe API manufacturer in API intermediates Market, By region, 2019-2028 (USD Million)

TABLE 47 Europe finished product manufacturer in API intermediates Market, By region, 2019-2028 (USD Million)

TABLE 48 Europe API intermediates Market, By distribution channel, 2019-2028 (USD Million)

TABLE 49 Europe direct tender in API intermediates Market, By Region, 2019-2028 (USD Million)

TABLE 50 Europe retail sales in API intermediates Market, By Region, 2019-2028 (USD Million)

TABLE 51 Europe Othersin API intermediates Market, By Region, 2019-2028 (USD Million)

TABLE 52 Europe API intermediates market, By Type, 2019-2028 (USD Million)

TABLE 53 Europe API intermediates market, By Type, 2019-2028 (USD Million)

TABLE 54 Europe API intermediates market, By Product, 2019-2028 (USD Million)

TABLE 55 Europe API intermediates market, By Therapeutic Type, 2019-2028 (USD Million)

TABLE 56 Europe API intermediates market, By Customers, 2019-2028 (USD Million)

TABLE 57 Europe API intermediates market, By End User, 2019-2028 (USD Million)

TABLE 58 Europe API intermediates market, By Distribution Channel, 2019-2028 (USD Million)

TABLE 59 Germany API intermediates market, By Type, 2019-2028 (USD Million)

TABLE 60 Germany API intermediates market, By Product, 2019-2028 (USD Million)

TABLE 61 Germany API intermediates market, By Therapeutic Type, 2019-2028 (USD Million)

TABLE 62 Germany API intermediates market, By Customers, 2019-2028 (USD Million)

TABLE 63 Germany API intermediates market, By End User, 2019-2028 (USD Million)

TABLE 64 Germany API intermediates market, By Distribution Channel, 2019-2028 (USD Million)

TABLE 65 U.K API intermediates market, By Type, 2019-2028 (USD Million)

TABLE 66 U.K API intermediates market, By Product, 2019-2028 (USD Million)

TABLE 67 U.K API intermediates market, By Therapeutic Type, 2019-2028 (USD Million)

TABLE 68 U.K API intermediates market, By Customers, 2019-2028 (USD Million)

TABLE 69 U.K API intermediates market, By End User, 2019-2028 (USD Million)

TABLE 70 U.K API intermediates market, By Distribution Channel, 2019-2028 (USD Million)

TABLE 71 U.K API intermediates market, By Type, 2019-2028 (USD Million)

TABLE 72 Italy API intermediates market, By Product, 2019-2028 (USD Million)

TABLE 73 Italy API intermediates market, By Therapeutic Type, 2019-2028 (USD Million)

TABLE 74 Italy API intermediates market, By Customers, 2019-2028 (USD Million)

TABLE 75 Italy API intermediates market, By End User, 2019-2028 (USD Million)

TABLE 76 Italy API intermediates market, By Distribution Channel, 2019-2028 (USD Million)

TABLE 77 Spain API intermediates market, By Type, 2019-2028 (USD Million)

TABLE 78 Spain API intermediates market, By Product, 2019-2028 (USD Million)

TABLE 79 Spain API intermediates market, By Therapeutic Type, 2019-2028 (USD Million)

TABLE 80 Spain API intermediates market, By Customers, 2019-2028 (USD Million)

TABLE 81 Spain API intermediates market, By End User, 2019-2028 (USD Million)

TABLE 82 Spain API intermediates market, By Distribution Channel, 2019-2028 (USD Million)

TABLE 83 France API intermediates market, By Type, 2019-2028 (USD Million)

TABLE 84 France API intermediates market, By Product, 2019-2028 (USD Million)

TABLE 85 France API intermediates market, By Therapeutic Type, 2019-2028 (USD Million)

TABLE 86 France API intermediates market, By Customers, 2019-2028 (USD Million)

TABLE 87 France API intermediates market, By End User, 2019-2028 (USD Million)

TABLE 88 France API intermediates market, By Distribution Channel, 2019-2028 (USD Million)

TABLE 89 Netherlands API intermediates market, By Type, 2019-2028 (USD Million)

TABLE 90 Netherlands API intermediates market, By Product, 2019-2028 (USD Million)

TABLE 91 Netherlands API intermediates market, By Therapeutic Type, 2019-2028 (USD Million)

TABLE 92 Netherlands API intermediates market, By Customers, 2019-2028 (USD Million)

TABLE 93 Netherlands API intermediates market, By End User, 2019-2028 (USD Million)

TABLE 94 Netherlands API intermediates market, By Distribution Channel, 2019-2028 (USD Million)

TABLE 95 Russia API intermediates market, By Type, 2019-2028 (USD Million)

TABLE 96 Russia API intermediates market, By Product, 2019-2028 (USD Million)

TABLE 97 Russia API intermediates market, By Therapeutic Type, 2019-2028 (USD Million)

TABLE 98 Russia API intermediates market, By Customers, 2019-2028 (USD Million)

TABLE 99 Russia API intermediates market, By End User, 2019-2028 (USD Million)

TABLE 100 Russia API intermediates market, By Distribution Channel, 2019-2028 (USD Million)

TABLE 101 Switzerland API intermediates market, By Type, 2019-2028 (USD Million)

TABLE 102 Switzerland API intermediates market, By Product, 2019-2028 (USD Million)

TABLE 103 Switzerland API intermediates market, By Therapeutic Type, 2019-2028 (USD Million)

TABLE 104 Switzerland API intermediates market, By Customers, 2019-2028 (USD Million)

TABLE 105 Switzerland API intermediates market, By End User, 2019-2028 (USD Million)

TABLE 106 Switzerland API intermediates market, By Distribution Channel, 2019-2028 (USD Million)

TABLE 107 Turkey API intermediates market, By Type, 2019-2028 (USD Million)

TABLE 108 Turkey API intermediates market, By Product, 2019-2028 (USD Million)

TABLE 109 Turkey API intermediates market, By Therapeutic Type, 2019-2028 (USD Million)

TABLE 110 Turkey API intermediates market, By Customers, 2019-2028 (USD Million)

TABLE 111 Turkey API intermediates market, By End User, 2019-2028 (USD Million)

TABLE 112 Turkey API intermediates market, By Distribution Channel, 2019-2028 (USD Million)

TABLE 113 Austria API intermediates market, By Type, 2019-2028 (USD Million)

TABLE 114 Austria API intermediates market, By Product, 2019-2028 (USD Million)

TABLE 115 Austria API intermediates market, By Therapeutic Type, 2019-2028 (USD Million)

TABLE 116 Austria API intermediates market, By Customers, 2019-2028 (USD Million)

TABLE 117 Austria API intermediates market, By End User, 2019-2028 (USD Million)

TABLE 118 Austria API intermediates market, By Distribution Channel, 2019-2028 (USD Million)

TABLE 119 Norway API intermediates market, By Type, 2019-2028 (USD Million)

TABLE 120 Norway API intermediates market, By Product, 2019-2028 (USD Million)

TABLE 121 Norway API intermediates market, By Therapeutic Type, 2019-2028 (USD Million)

TABLE 122 Norway API intermediates market, By Customers, 2019-2028 (USD Million)

TABLE 123 Norway API intermediates market, By End User, 2019-2028 (USD Million)

TABLE 124 Norway API intermediates market, By Distribution Channel, 2019-2028 (USD Million)

TABLE 125 Hungary API intermediates market, By Type, 2019-2028 (USD Million)

TABLE 126 Hungary API intermediates market, By Product, 2019-2028 (USD Million)

TABLE 127 Hungary API intermediates market, By Therapeutic Type, 2019-2028 (USD Million)

TABLE 128 Hungary API intermediates market, By Customers, 2019-2028 (USD Million)

TABLE 129 Hungary API intermediates market, By End User, 2019-2028 (USD Million)

TABLE 130 Hungary API intermediates market, By Distribution Channel, 2019-2028 (USD Million)

TABLE 131 Lithuania API intermediates market, By Type, 2019-2028 (USD Million)

TABLE 132 Lithuania API intermediates market, By Product, 2019-2028 (USD Million)

TABLE 133 Lithuania API intermediates market, By Therapeutic Type, 2019-2028 (USD Million)

TABLE 134 Lithuania API intermediates market, By Customers, 2019-2028 (USD Million)

TABLE 135 Lithuania API intermediates market, By End User, 2019-2028 (USD Million)

TABLE 136 Lithuania API intermediates market, By Distribution Channel, 2019-2028 (USD Million)

TABLE 137 Ireland API intermediates market, By Type, 2019-2028 (USD Million)

TABLE 138 Ireland API intermediates market, By Product, 2019-2028 (USD Million)

TABLE 139 Ireland API intermediates market, By Therapeutic Type, 2019-2028 (USD Million)

TABLE 140 Ireland API intermediates market, By Customers, 2019-2028 (USD Million)

TABLE 141 Ireland API intermediates market, By End User, 2019-2028 (USD Million)

TABLE 142 Ireland API intermediates market, By Distribution Channel, 2019-2028 (USD Million)

TABLE 143 Poland API intermediates market, By Type, 2019-2028 (USD Million)

TABLE 144 Poland API intermediates market, By Product, 2019-2028 (USD Million)

TABLE 145 Poland API intermediates market, By Therapeutic Type, 2019-2028 (USD Million)

TABLE 146 Poland API intermediates market, By Customers, 2019-2028 (USD Million)

TABLE 147 Poland API intermediates market, By End User, 2019-2028 (USD Million)

TABLE 148 Poland API intermediates market, By Distribution Channel, 2019-2028 (USD Million)

TABLE 149 Rest of Asia Pacific API intermediates market, By Type, 2019-2028 (USD Million)

그림 목록

FIGURE 1 Europe API INTERMEDIATES MARKET: SEGMENTATION

FIGURE 2 EUROPE API INTERMEDIATES MARKET: DATA TRIANGULATION

FIGURE 3 Europe API intermediates Market: DROC ANALYSIS

FIGURE 4 Europe API intermediates market: Europe VS REGIONAL MARKET ANALYSIS

FIGURE 5 Europe API intermediates Market: COMPANY RESEARCH ANALYSIS

FIGURE 6 EUROPE API intermediates MARKET: MULTIVARIATE MODELLING

FIGURE 7 EUROPE API intermediates MARKET: INTERVIEW DEMOGRAPHICS

FIGURE 8 EUROPE API INTERMEDIATES MARKET: DBMR MARKET POSITION GRID

FIGURE 9 EUROPE API INTERMEDIATES MARKET: VENDOR SHARE ANALYSIS

FIGURE 10 EUROPE API intermediates MARKET: MARKET type COVERAGE GRID

FIGURE 11 Europe API intermediates market: SEGMENTATION

FIGURE 12 Utilization of advanceD technology in active pharmaceutical ingredients (API) manufacturing is DRIVing THE Europe API intermediates MARKET IN THE FORECAST PERIOD OF 2021 to 2028

FIGURE 13 pharmaceutical / bulk drug intermediates SEGMENT is expected to account for the largest share of the Europe API INTERMEDIATES MARKET in 2021 & 2028

FIGURE 14 DRIVERS, RESTRAINTs, OPPORTUNITies AND CHALLENGEs OF Europe API Intermediates market

FIGURE 15 TOP 5 COUNTRIES FOR NUMBER OF PEOPLE AGED 20 TO 79 SUFFERING FROM DIABETES in 2019

FIGURE 16 ESTIMATED NUMBER OF DIFFERENT TYPEs OF CANCERS IN FEMALE POPULATION in 2020

FIGURE 17 ESTIMATED NUMBER OF DIFFERENT TYPEs OF CANCERS IN MALE POPULATION in 2020

FIGURE 18 EUROPE CAUSES OF DEATHs WITH THE CHRONIC DISEASES

FIGURE 19 NUMBER OF PERSON AGED 60 YEARS OR OVER BY REGIONS in 2020 (IN MILLIONS)

FIGURE 20 MARKET GROWTH IN CLINICAL CRO (IN USD MILLIONS)

FIGURE 21 Europe API intermediates market: BY type, 2021

FIGURE 22 Europe API intermediates market: BY type, 2019-2028 (USD Million)

FIGURE 23 Europe API intermediates market: BY type, CAGR (2021-2028)

FIGURE 24 Europe API intermediates market: BY type, LIFELINE CURVE

FIGURE 25 Europe API intermediates market: BY product, 2021

FIGURE 26 Europe API intermediates market: BY product, 2019-2028 (USD Million)

FIGURE 27 Europe API intermediates market: BY product, CAGR(2021-2028)

FIGURE 28 Europe API intermediates market: BY product, LIFELINE CURVE

FIGURE 29 Europe API intermediates market: BY therapeutic type, 2021

FIGURE 30 Europe API intermediates market: BY therapeutic type, 2019-2028 (USD Million)

FIGURE 31 Europe API intermediates market: BY therapeutic type, CAGR (2021-2028)

FIGURE 32 Europe API intermediates market: BY therapeutic type, LIFELINE CURVE

FIGURE 33 Europe API intermediates market: BY customers, 2021

FIGURE 34 Europe API intermediates market: BY customers, 2019-2028 (USD Million)

FIGURE 35 Europe API intermediates market: BY customers, CAGR (2021-2028)

FIGURE 36 Europe API intermediates market: BY customers, LIFELINE CURVE

FIGURE 37 Europe API intermediates market: BY end user, 2021

FIGURE 38 Europe API intermediates market: BY end user, 2019-2028 (USD Million)

FIGURE 39 Europe API intermediates market: BY end user, CAGR (2021-2028)

FIGURE 40 Europe API intermediates market: BY end user, LIFELINE CURVE

FIGURE 41 Europe API intermediates market: BY distribution channel, 2021

FIGURE 42 Europe API intermediates market: BY distribution channel, 2019-2028 (USD Million)

FIGURE 43 Europe API intermediates market: BY distribution channel, CAGR (2021-2028)

FIGURE 44 Europe API intermediates market: BY distribution channel, LIFELINE CURVE

FIGURE 45 Europe API Intermediates market: SNAPSHOT (2020)

FIGURE 46 Europe API INTERMEDIATEs market: BY COUNTRY (2020)

FIGURE 47 Europe API INTERMEDIATEs market: BY COUNTRY (2021 & 2028)

FIGURE 48 Europe API Intermediates market: BY COUNTRY (2020 & 2028)

FIGURE 49 Europe API Intermediates market: BY type (2021-2028)

FIGURE 50 Europe API Intermediates market: company share 2020 (%)

자세한 정보 보기 Right Arrow

연구 방법론

데이터 수집 및 기준 연도 분석은 대규모 샘플 크기의 데이터 수집 모듈을 사용하여 수행됩니다. 이 단계에는 다양한 소스와 전략을 통해 시장 정보 또는 관련 데이터를 얻는 것이 포함됩니다. 여기에는 과거에 수집한 모든 데이터를 미리 검토하고 계획하는 것이 포함됩니다. 또한 다양한 정보 소스에서 발견되는 정보 불일치를 검토하는 것도 포함됩니다. 시장 데이터는 시장 통계 및 일관된 모델을 사용하여 분석하고 추정합니다. 또한 시장 점유율 분석 및 주요 추세 분석은 시장 보고서의 주요 성공 요인입니다. 자세한 내용은 분석가에게 전화를 요청하거나 문의 사항을 드롭하세요.

DBMR 연구팀에서 사용하는 주요 연구 방법론은 데이터 마이닝, 시장에 대한 데이터 변수의 영향 분석 및 주요(산업 전문가) 검증을 포함하는 데이터 삼각 측량입니다. 데이터 모델에는 공급업체 포지셔닝 그리드, 시장 타임라인 분석, 시장 개요 및 가이드, 회사 포지셔닝 그리드, 특허 분석, 가격 분석, 회사 시장 점유율 분석, 측정 기준, 글로벌 대 지역 및 공급업체 점유율 분석이 포함됩니다. 연구 방법론에 대해 자세히 알아보려면 문의를 통해 업계 전문가에게 문의하세요.

사용자 정의 가능

Data Bridge Market Research는 고급 형성 연구 분야의 선두 주자입니다. 저희는 기존 및 신규 고객에게 목표에 맞는 데이터와 분석을 제공하는 데 자부심을 느낍니다. 보고서는 추가 국가에 대한 시장 이해(국가 목록 요청), 임상 시험 결과 데이터, 문헌 검토, 재생 시장 및 제품 기반 분석을 포함하도록 사용자 정의할 수 있습니다. 기술 기반 분석에서 시장 포트폴리오 전략에 이르기까지 타겟 경쟁업체의 시장 분석을 분석할 수 있습니다. 귀하가 원하는 형식과 데이터 스타일로 필요한 만큼 많은 경쟁자를 추가할 수 있습니다. 저희 분석가 팀은 또한 원시 엑셀 파일 피벗 테이블(팩트북)로 데이터를 제공하거나 보고서에서 사용 가능한 데이터 세트에서 프레젠테이션을 만드는 데 도움을 줄 수 있습니다.

자주 묻는 질문

The Europe API intermediates market size will be worth USD 79,332.30 million by 2030.
The growth rate of the Europe API intermediates market is 6.1% in the forecast by 2030.
Pharmaceutical industry growth & rising research and development are the growth drivers of the Europe API intermediates market.
Type, product, therapeutic type, customers, end user, and distribution channel are the factors on which the Europe API intermediates market research is based.
Major companies in the Europe API intermediates market are HIKAL Ltd.(India), Cambrex Corporation (U.S.), Ganesh-Group (India), AlzChem Group AG (Germany), Vasudha Pharma (India), Anyang General Chemical Co.,Ltd.(South Korea), Sarex (India), Sandoo Pharmaceuticals and Chemicals Co., Ltd.(China), Atul Ltd (India), Sandoz International GmbH (a subsidiary of Novartis AG) (Germany), Aceto (U.S.), Supriya Lifescience Ltd. (India), Vertellus (U.S.), Dishman Carbogen Amcis Ltd (India), Sanofi (France), Divi's Laboratories Limited (India), AARTI INDUSTRIES LIMITED (India), Aurobindo Pharma (India), BASF SE (Germany)